SPY, the SPDR S&P 500 ETF gained +5.33% last week, while the VIX closed at 17.24, indicating an implied one day move of +/-1.09% & an implied one month move of +/-4.98% for the S&P 500.
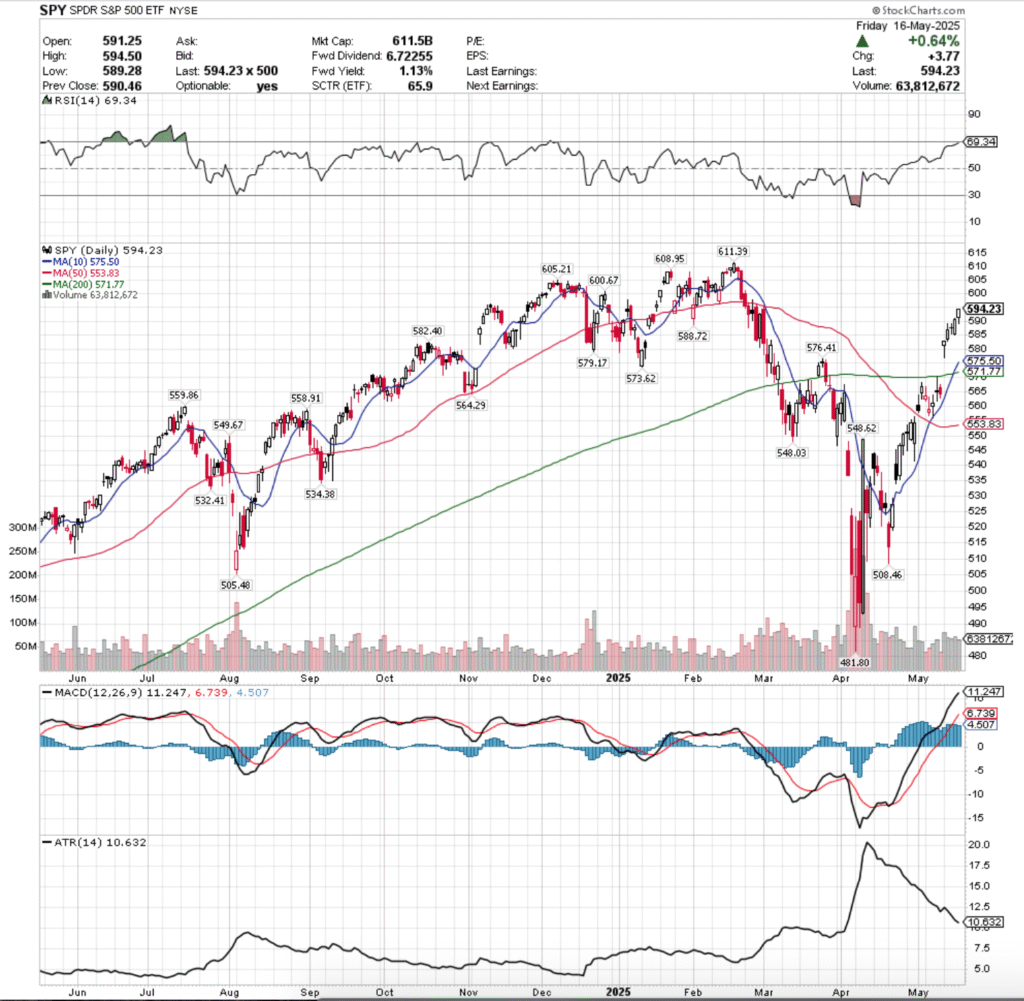
Their RSI is just beneath the overbought level & currently sits at 69.34, while their MACD is bullish, but looking overextended following Monday’s gap up session.
Volumes were +24.32% above the prior year’s average level (69,454,000 vs. 55,866,349), which while it sounds like a lot, is still below the levels seen in the years prior, which doesn’t mean we’re out of the woods just yet.
Monday opened the week up on a gap up open that enabled the week to begin above the support of both the 10 & 200 day moving averages.
Monday’s session was also the highest volume of the week & it set the stage for the increased volume mentioned above, but as noted over prior months in our weekly review notes, there will need to be continued elevated levels of volume before this looks like a sustainable uptrend.
This holds especially true given how far market participants were willing to trade SPY during Monday’s session, as noted by the lower shadow that dropped ~1% from the day’s opening price into the window it created.
Tuesday opened on another gap up, this time on weaker volume for the day, and while SPY proceeded to march higher, the upper shadow on the day’s session indicates that there was a bit of profit taking during the session & market participants were not fully at ease with the current price level of SPY.
Wednesday confirmed this, where another gap up open on un-noteworthy volume resulted in a doji candle, indicating that there was a bit of discomfort & indecisiveness in the market, but that participants found temporary equilibrium at the $587.59-.81 range (closing-opening prices, day ended slightly down).
Thursday is really the most important session of the week, as it had the second highest volume & formed a bearish engulfing pattern with Wednesday’s session, while covering a daily range of >1% with little upper/lower shadows.
While the result of the day as an advancing session is certainly bullish & the high volumes confirm it, but they also tell another story, one about profit taking, which if that narrative flakes out & less people are willing to continue to accept risk at this level -2.81% below SPY’s all time high, we will see gains of the week slip away.
Friday the week wound down on a note that did not inspire confidence heading into the weekend, as on the week’s lowest volume SPY opened on a gap up, retraced down into Thursday’s price range, before powering higher to close near the top of the session’s range.
Looking ahead into this upcoming week there are a few focal points to keep in mind.
Firstly, to the upside, SPY has managed to climb over the past week, and is now back within -2.81% from the all-time high price level, but while volume has been better, when compared to previous years’ volume levels (roughly one year ago was much lower, as the volume trend was in serious decline after years of higher levels).
Unless we see increased, sustainable volume levels it will take longer & some more volatility before a base is formed that can be built upon.
Particularly as while the long-term trend line was broken & the 10 day moving average crossed bullishly through it, they now have become important support levels that will more than likely be retested when the gap fills.
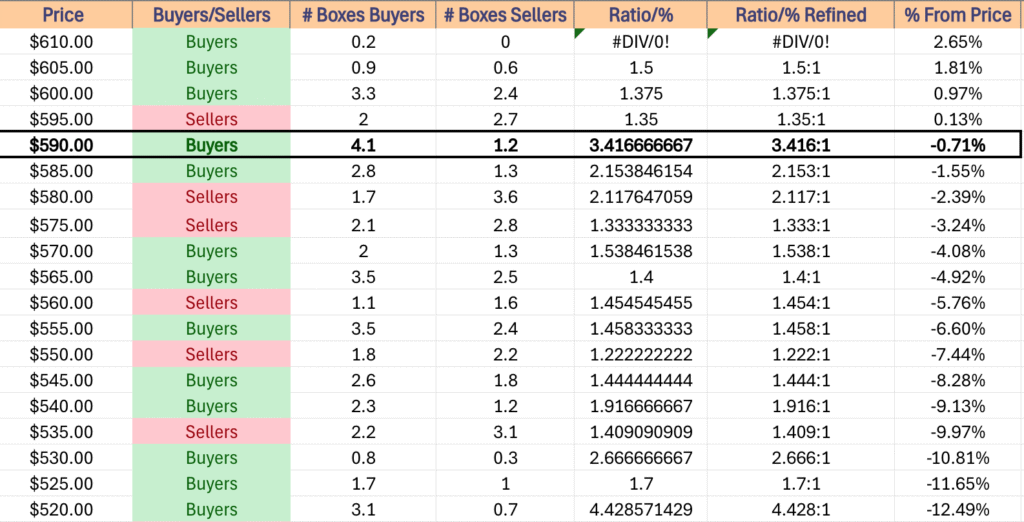
While the resistance levels that remain from here for SPY are all Buyer dominated over the past year, it is wise to recall that they are currently including SPY’s most recent 52-week highs, which skewes the data.
Re-tests are likely to dilute the Buyer dominated ratios shown in the table below, which would lead to consolidation or declining outcomes.
The consolidation case revolves on a retest of the $577.04 price level, which would most likely lead to further declines to attempt to close Monday’s window & test the support of the long-term & short-term moving averages (we’ll get into next) & or it will likely involve oscillations around the 10 & 200 day moving averages until we get an upside or downside catalyst.
This week we’ll get some insight into the state of consumers based on earning’s reports from the likes of Home Depot & Target, as well as BJ’s Wholesale & Advanced Auto Parts.
There will also be PMI data coming out along with a slew of Fed speakers to lend insight into the health of the economy.
To the downside, if the $588.72/share level breaks down, we see the $577.04 retest mentioned above, which should that break down we discover whether market participants believe the long-term trend is stronger than SPY’s current price or not.
There is quite a bit of Seller pressure historically to help get SPY into that window created on Monday & once it’s in there it will have to retest both the long & short term trend lines, which will give a real look into how market participants are viewing the state of current & future economic news.
In the event of further declines, using the table below at support levels or specific price levels you’re targeting is worthwile to understand the market sentiment of each price level SPY traded at over the past ~3 years.
SPY has support at the $588.72 (Volume Sentiment: Buyers, 2.15:1), $582.40 (Volume Sentiment: Sellers, 2.12:1), $579.17 (Volume Sentiment: Sellers, 1.33:1) & $576.41/share (Volume Sentiment: Sellers, 1.33:1) price levels, with resistance at the $600.67 (Volume Sentiment: Buyers, 1.38:1), $605.21 (Volume Sentiment: Buyers, 1.5:1), $608.95 (Volume Sentiment: Buyers, 1.5:1) & $611.39/share (All-Time High, Volume Sentiment: Buyers, 0.2:0*) price levels.
QQQ, the Invesco QQQ Trust ETF had the best week of the four majors, advancing +6.88%, mostly due in large part to Monday’s gap up.
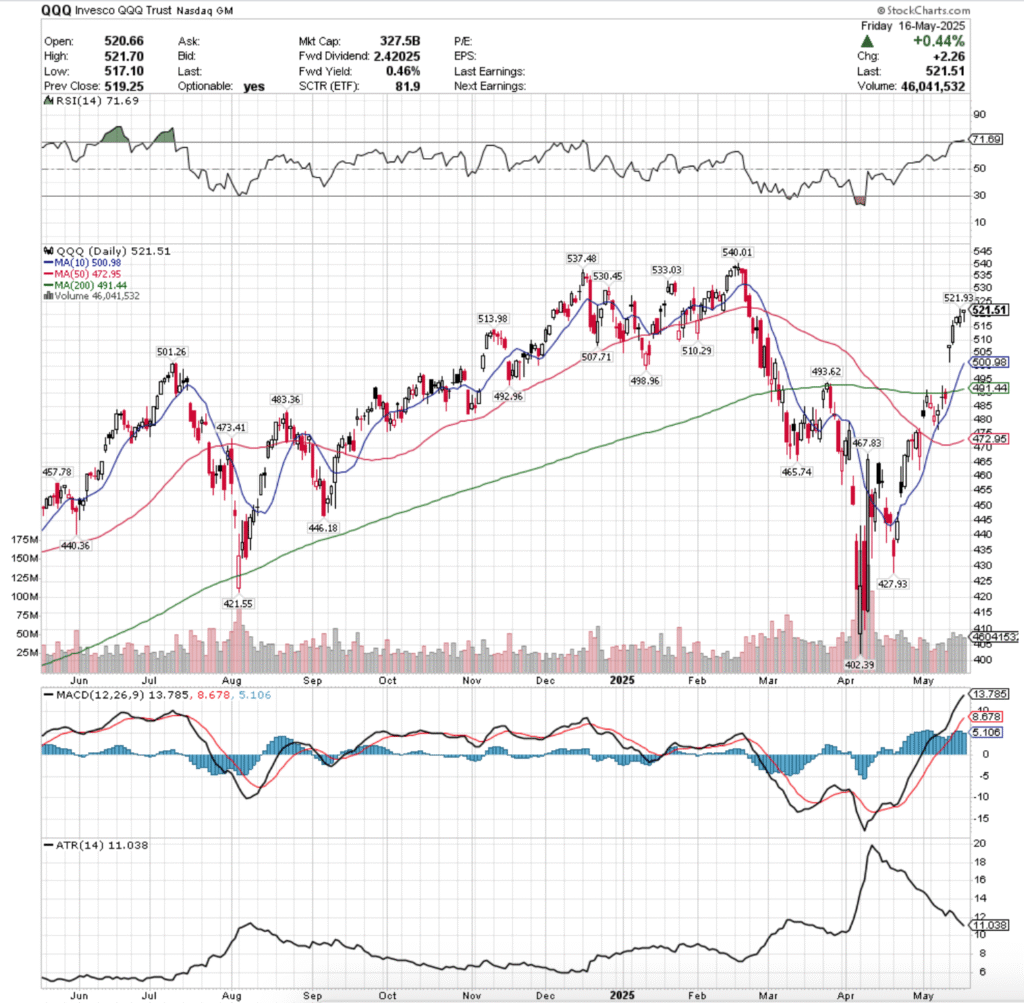
Their RSI is in overbought territory following the massive gap up on Monday and sits currently at 71.69, while their MACD is bullish still, but beginning to look overextended.
Volumes were +30.63% above the previous year’s average (48,262,000 vs. 36,945,556), which much like SPY brings reasons for caution heading into a new week.
Monday saw a gap up open above the 200 & 10 day moving averages, which retraced ~1.09% into the window to the $501.48/share level, before rallying to close at $507.85/share.
Tuesday QQQ saw a gap up open on the week’s highest volume, one a session that covered ~1.73% top to bottom, and likely featured a bit of short-term profit taking from eager buyers in the wake of the prior day’s gap up.
Wednesday is where things began to look a little dicey for QQQ, as while volumes dropped day-over-day they weren’t far from Tuesday’s, but the day resulted in a spinning top candle after a gap up, indicating uncertainty & that the bullish sentiment was beginning to wear out.
Thursday’s candle opened lower, but closed higher than Wednesday’s, forming a bullish engulfing pattern, while logging the week’s second highest volume.
While this may be regarded by many to normally be an encouraging sign, the day’s shadows tell a different story.
Firstly, while the $515/share level held up & was not broken through to the downside, the day’s upper shadow signals that there was a bit of profit taking, as prices ran up much higher than they tested to the downside, but the day’s close was only +0.11% day-over-day.
The $515/share level is not a support level, so while sentiment held up there, it is not associated with any trend, and while it should be noted, should not be used in making decisions until other clusters of information emerge.
The high volume therefore is likely more associated with the profit taking shown by the upper shadow, and not the day’s actual advance.
Friday the week ended on another haunting feeling, when a gap up open retraced almost all the way through Thursday’s candle’s real body to the downside, before the day advanced slightly & closed as a hanging man candle.
While that in & of itself is a bearish signal, the fact that it occurred on the week’s second weakest volume is also an indicator that there is still not bullish sentiment abound in the market right now.
Looking into the coming week, QQQ’s upside potential revolves around breaking through the $521.93/share resistance level.
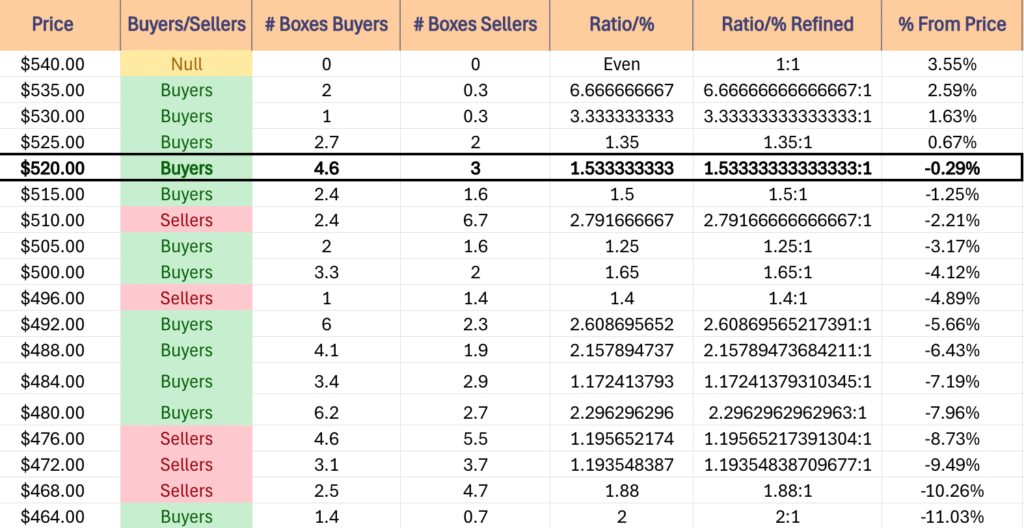
Much like SPY’s resistance levels, QQQ’s are mostly Buyer dominated over the past ~4 years, but there are only 5 resistance levels above Friday’s close, all of which have been prior 52-week highs, so the data is skewed towards Buyers.
This means that we may see the ratios on the table below become more even in the event of a rejected re-test.
Without continued high, advancing volume the upside case is still largely TBD based on how close to the all-time High QQQ is.
The consolidation case is quite similar to SPY’s; $501.48/share is not a support levels, but will be an area to focus on, as if it holds up then the window formed by Monday’s gap up open will be preserved for a while longer, likely waiting to fill until there’s a downside catalyst.
However, give that the 10 & 200 DMA’s are both in near proximity to QQQ’s closing price on Friday, the consolidation case looks awfully similar to SPY’s above, where QQQ’s price oscillates around the long & short-term trend lines waiting for an upside or downside catalyst.
The $493.62/share support levels also looks interesting here, as while there has clearly been a lot of optimism among the Buyers at this price level, given its proximity to the long-term trend line, a breakdown of it will make the 200 DMA appear a bit weaker & make long-term sentiment appear less optimistic.
To the downside, there is a bit of selling pressure in QQQ’s near viscininty, which signals likely weakness for its next two support levels.
However, like the dilution of extreme Buyers near the top, we may see some consolidation in these zones, diluting the Seller pressure levels.
This doesn’t mean that they’re likely to hold up, but should be mentioned as this & the consolidation case do somewhat overlap on it.
If the first four support levels buckle, the 10 day moving average is next at bat, which will give us the market’s view on short-term sentiment.
If it breaks down, expect the 200 DMA’s support to be key in determining whether QQQ can continue to climb higher, or if it’s going to break down & revert back to the long-term trend that we’ve been experiencing since March.
This is especially interesting, as the gap up propelling QQQ higher on the volume levels that it had are not exactly indicative of a major long-term trend change & look a lot like a shorter term squeeze higher.
The table below provides insight into how QQQ may perform when it re-tests it’s near-term support/resistance levels based on the based ~4 years.
QQQ has support at the $513.98 (Volume Sentiment: Sellers, 2.79:1), $510.29 (Volume Sentiment: Sellers, 2.79:1), $507.71 (Volume Sentiment: Buyers, 1.25:1) & $501.26/share (Volume Sentiment: Buyers, 1.65:1) price levels, with resistance at the $521.93 (Volume Sentiment: Buyers, 1.53:1), $530.45 (Volume Sentiment: Buyers, 3.33:1), $533.03 (Volume Sentiment: Buyers, 3.33:1) & $537.48/share (Volume Sentiment: Buyers, 6.67:1) price levels.
IWM, the iShares Russell 2000 ETF climbed +4.5% last week, as small caps performed better than blue chips, but were the second worst weekly performing index.
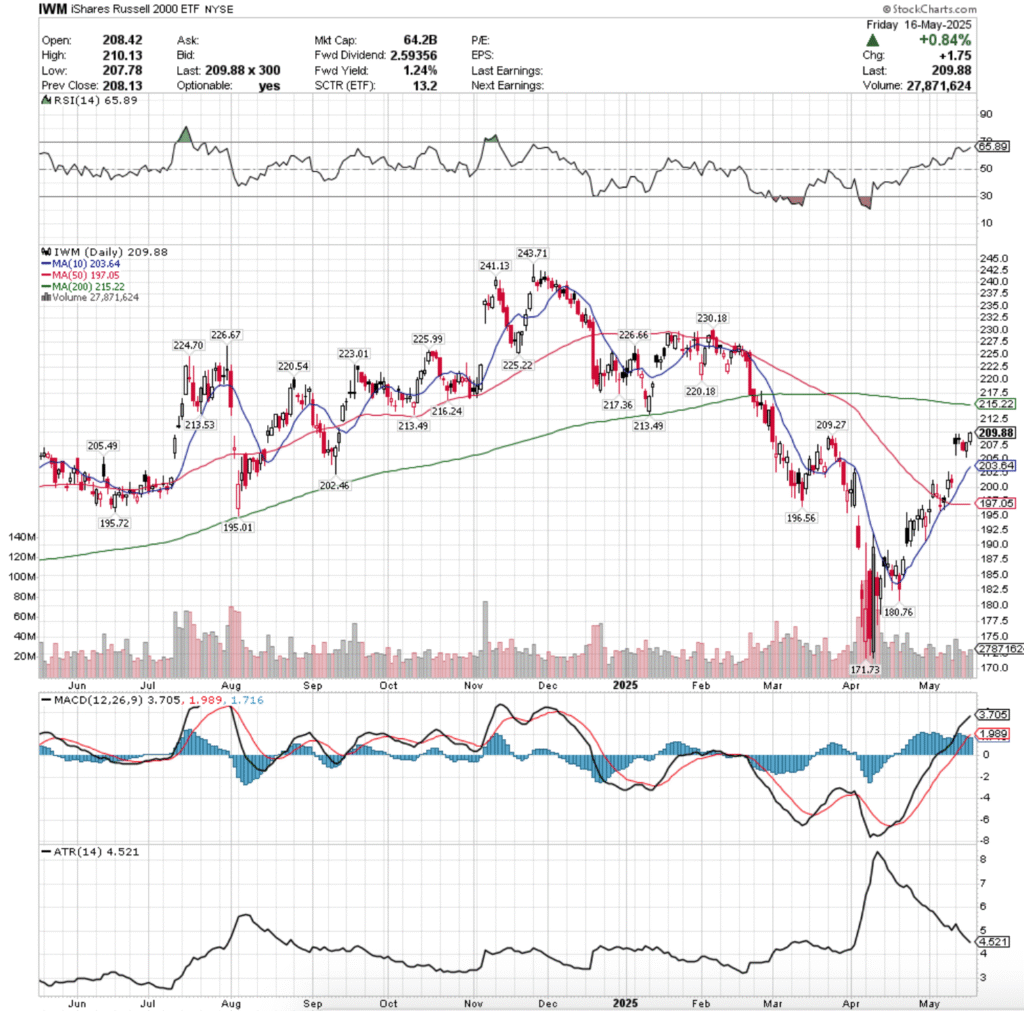
Their RSI is advancing towards overbought conditions & sits currently at 65.89, while their MACD is bullish, but beginning to show signs of weakness after the consolidation period of last week.
Volumes were -4.75% lower than the previous year’s average (28,424,000 vs. 29,841,389), which isn’t particularly noteworthy given the performance of IWM throughout the week & how their volumes have held up over the past year vs. the previous year.
Monday was really the only important day for the small-cap index, gap up open, highest volume of the week, but a major issue given that the day closed lower than it opened, and despite at it’s daily low point losing -1.45% from its opening price, it gained +3.82% day-over-day.
While a ~+4% gap up session is always nice, the consolidation range that the rest of the week was spent in wasn’t difficult to see coming by Monday’s close.
Tuesday opened slightly higher, but closed as a doji candle that closed lower than it opened, which confirmed the cautious sentiment Monday gave.
Additionally, there was a bit of profit taking to the upside on IWM, but not enough actual will among market participants for Tuesday to break Monday’s session’s high.
Wednesday is where the weakness became more evident, as the day opened on a gap down, tested slightly higher, before tanking to close near it’s daily low as market participants were eager to pile out of the pool & take their near-term profits.
Thursday didn’t give much extra confidence, as IWM opened lower, tested down to the $205.39/share price level, before managing to come back & close marginally higher than Wednesday’s open on the lowest volume of the week.
Friday managed to open on a gap higher, before testing the low point of $207.78/share & ending the day up +0.83%, but the week’s chart closed showing some exhaustion for the small cap names.
IWM, much like DIA has been performing quite differently than SPY & QQQ over the past couple of years, a trend that still continues.
The upside scenario for IWM really focuses first on $213.49/share, which contains two resistance touch-points & will act as one of two gatekeepers for the 200 Day Moving Average’s resistance.
This is problematic, as both that level & the next resistance levels of $213.53/share (and the 200 Day Moving Average) are all in a historically Seller dominated price zone.
This makes the long-term trend line across the major indexes appear weaker, as there is far less enthusiasm in small cap names, indicating that there is more “fish chasing” than active investment enthusiasm.
Should the 200 DMA break down & we see sustainable volume levels, then there may be the ability to rally a bit higher temporarily (particularly in the event that there is some buying into the short holiday week next week), as it means the resistance zone of $213-214/share broke down & there is Buyer sentiment above.
Consolidation case here looks like a slow window fill from Monday’s gap up with some oscillating around the 10 DMA while awaiting a catalyst to the upside or downside.
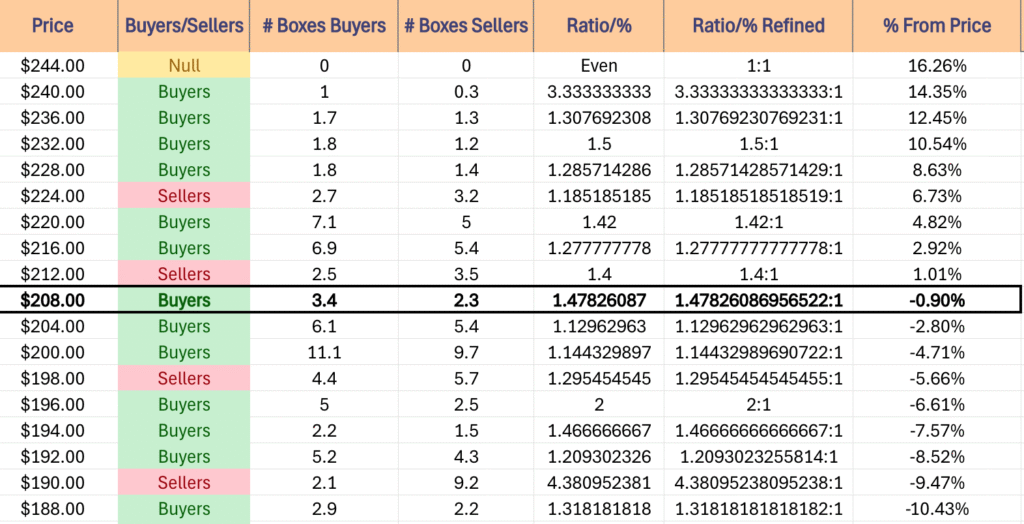
To the downside, the next four support levels are all primarily in favor of the Buyers over the past ~2-3 years, but not at particularly strong ratios, which makes the 50 day moving average’s support level key to watch, before IWM likely finds some relief in the support zone before $195.01-197.05.
Assuming that the window closes, the 10 day moving average will likely also not be particularly strong, which would lead to a breakdown that is shown in that scenario.
The table below can aid in assessing the strength & weakness of support/resistance levels that IWM tests/re-tests in the coming week.
IWM has support at the $209.27 (Volume Sentiment: Buyers, 1.48:1), $205.49 (Volume Sentiment: Buyers, 1.13:1), $203.64 (10 Day Moving Average, Volume Sentiment: Buyers, 1.14:1) & $202.46/share (Volume Sentiment: Buyers, 1.14:1) price levels, with resistance at the $213.49 (2 Touch-Points, Volume Sentiment: Sellers, 1.4:1), $213.53 (Volume Sentiment: Sellers, 1.4:1), $215.22 (200 Day Moving Average, Volume Sentiment: Sellers, 1.4:1) & $216.24/share (Volume Sentiment: Buyers, 1.28:1) price levels.
DIA, the SPDR Dow Jones Industrial Average ETF added +3.43% last week, faring the worst of the four majors, but volume indicates that market participants are likely holding DIA component names at the moment.
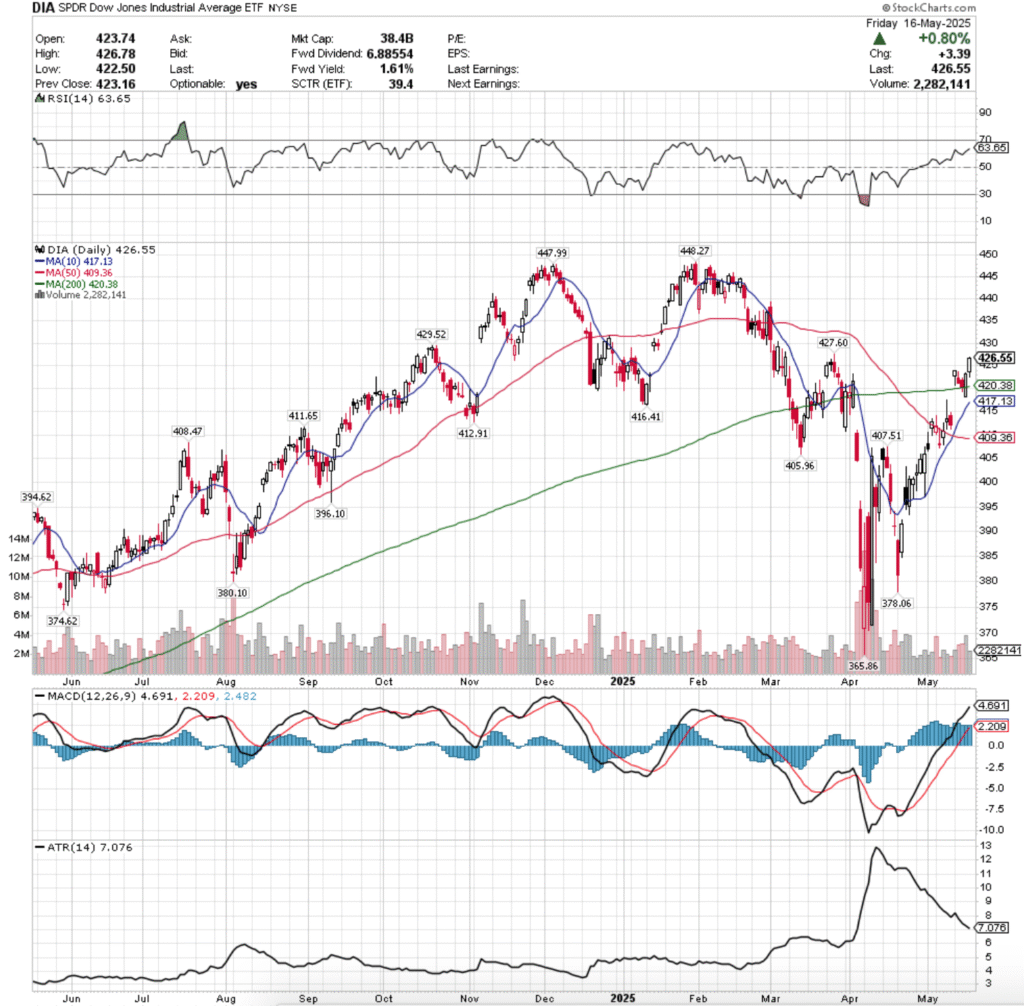
Their RSI is trending higher following Monday’s gap up open and sits currently at 63.65, while their MACD is still bullish & looks heavily extended following the mid-April rally.
Volumes were -7.42% below the prior year’s average (2,938,000 vs. 3,173,413), which is also an area of concern, as the blue chip index had shown more sustainable week-over-week participation than the other major indexes, but now it seems to be more in “buy & hold” mode.
One key area to note is that on Monday the resistance of the 200 day moving average (long-term trend line) was broken through on the gap up open, but that the candle for the day resulted in a hanging man (bearish).
While the support of the 200 DMA held up, the candle’s lower shadow retraced down -0.44% to just above the long-term trend line & moved forward for an advancing session.
This is important to note, as it was on the week’s second lowest volume, indicating a bit of fluff, or uncertainty that continued to move higher.
Tuesday the window began to fill on a gap down open, tested most of the way through Monday’s candle’s real body, but ultimately sunk to decline for the day, while managing to stay above the support of the 200 day moving average.
Wednesday opened higher, but the song remained the same, except the week’s second highest volume session managed to break down the 200 DMA’s support temporarily, while settling for the day just above it.
Thursday was where the real lack of confidence in DIA became evident, as it opened on a gap down & while it was able to break above the resistance of the 200 day moving average & close for an advance that was above the new support level forming a bullish engulfing pattern, Friday’s follow up was unable to confirm the “bullish signals”.
Friday opened on a gap up, briefly tested near the high/close of Thursday to the downside before breaking out above the $425/share level to close at $426.55/share, but the volume expressed extreme skepticism heading into the weekend, which did not align with Thursday’s sentiment.
DIA’s chart looks like a hybrid between SPY/QQQ’s & IWM’s, as it tightly consolidated after the gap up like IWM did, but the blue chip names have the same strong sentiment that is keeping them above the long-term trend line still after gapping above it on Monday’s open.
To the upside this week, the $429.52 resistance level will be an interesting area to watch, as it resides in a price zone that is historically “Even” between the Buyers & Sellers over the past ~4-5 years, meaning that it will be another long-term trend bellwether like the 200 DMA.
This is especially true given that next higher resistance levels is Buyer oriented & the following is still “NULL”, as it is the current all-time high.
Any run at this level will require a severe uptick in advancing volume that holds sustainable for weeks-to-months.
The consolidation case here revolved around DIA oscillating around its 200 day moving average awaiting an upside or downside catalyst.
Given that the blue chip index seems to be in “buy & hold” mode currently, this is likely what we will see, before a massive swing one way or the other (pending earnings reports/news reports, as noted above).
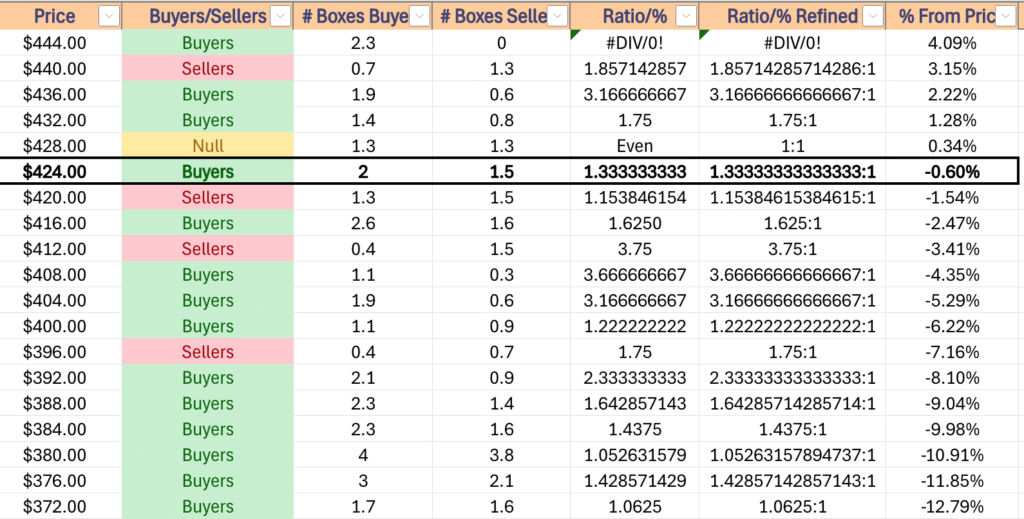
To the downside, there is a chance of oscillation between the 10 & 200 day moving averages while market participants digest news/earnings & assess their risk tolerance among the blue chip names, but should that break down the chart below will become even more important to understand how strong/weak the coming support levels are.
When you factor in the DIA represents the blue chip names that are sold to investors of all size & that their data below is covering the past ~4-5 years it will paint a stronger picture of not just DIA’s future, but the other major indexes listed above.
DIA has support at the $420.38 (200 Day Moving Average, Volume Sentiment: Sellers, 1.15:1), $417.13 (10 Day Moving Average, Volume Sentiment: Buyers, 1.63:1), $416.41 (Volume Sentiment: Buyers, 1.63:1) & $412.91/share (Volume Sentiment: Sellers, 3.75:1) price levels, with resistance at the $427.60 (Volume Sentiment: Buyers, 1.33:1), $429.52 (Volume Sentiment: Even, 1:1), $447.49 (Volume Sentiment: Buyers, 2.3:0*) & $448.27/share (All-Time High, Volume Sentiment: NULL, 0:0*) price levels.
The Week Ahead
Monday morning kicks off with Fed President Williams & Fed President Jefferson each giving speeches at 8:45 am, followed by U.S. Leading Economic Indicators at 10 am.
Target Hospitality reports earnings Monday before the session opens, followed by 8×8, Agilysys & Transcat after the closing bell.
Fed President Barkin speaks Tuesday at 9 am, before Fed President Collins speaks at 9:30 am, Fed President Musalem speaks at 1 pm & Fed President Kugler speaks at 5 pm.
Home Depot, Amer Sports, Bilibili, Eagle Materials, GDS Holdings & Viking Holdings all report earnings before Tuesday’s opening bell, followed by James Hardie, Keysight Technologies, Modine Manufacturing, Palo Alto Networks, Toll Brothers, Viasat & ZTO Express after the session’s closing bell.
Wednesday is relatively quiet, with only Fed President Barkin & Fed Governor Bowman taking part in a Fed Listens event at 12:15 pm.
Target, Canada Goose, Dycom, Lowe’s, Medtronic, TJX, V.F. Corp., Weibo & Wix all report earnings Wednesday morning, followed by Snowflake, Domo, Enersys, LiveRamp, Urban Outfitters & Zoom Communications at the session’s closing bell.
Initial Jobless Claims data comes out Thursday morning at 8:30 am, before S&P Flash U.S. Services PMI & S&P Flash U.S. Manufacturing PMI data come out at 9:45 am, Existing Home Sales Data is released at 10 am & Fed President Williams speaks at 2 pm.
Thursday morning’s earnings calls include Advanced Auto Parts, Analog Devices, ATS Corp., BJ’s Wholesale, Lightspeed, Ralph Lauren & Toronto-Dominion Bank, before Autodesk, Copart, Deckers Outdoor, Intuit, Lions Gate Entertainment, Ross Stores, StepStone Group & Workday after the closing bell.
Friday morning the week winds down with Fed President Schmid speaking at 9:35 am, New Home Sales data at 10 am & Fed Governor Cook speaking at 12 pm.
Booz Allen Hamilton & Buckle both report earnings before Friday’s opening bell.
See you back here next week!
*** I DO NOT OWN SHARES OR OPTIONS CONTRACT POSITIONS IN SPY, QQQ, IWM OR DIA AT THE TIME OF PUBLISHING THIS ARTICLE***