Is there anybody out there? Hello? A third straight week of bite-sized volumes came & went in a week with numerous Fed speakers & the most anticipated earnings report of the quarter where the S&P 500 & NASDAQ reached new all-time highs.
The Dow Jones Industrial Average joined the ranks of the Russell 2000 & decoupled from having similar recent success as the S&P & NASDAQ, primarily due to the fact that NVDA is not a component of the latter two indexes.
SPY, the SPDR S&P 500 ETF remained flat last week, registering a 0.00% change week-over-week (-$0.01) in a week where the VIX closed at 11.93, implying a one day move of +/-0.75% & a one month move of +/-2.18%.
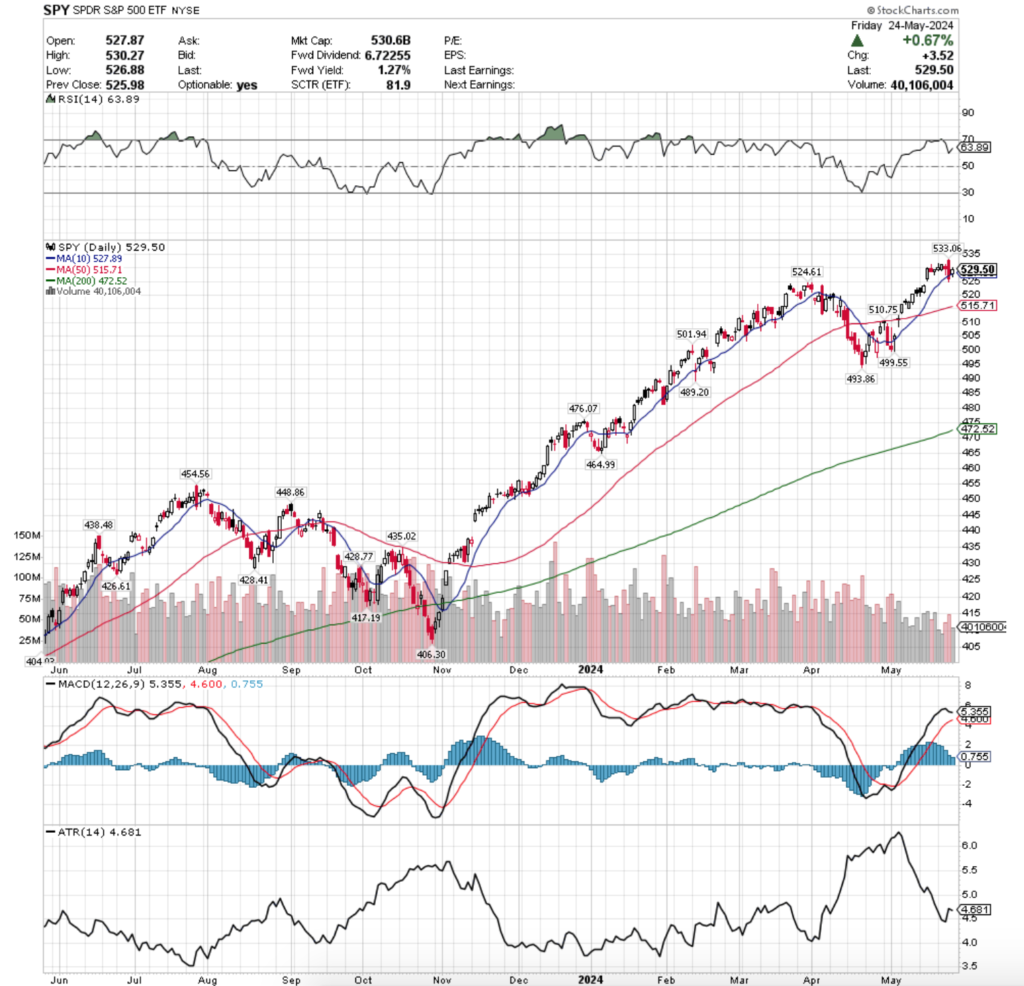
Their RSI is rising & trending towards the overbought level, currently sitting at 63.89, while their MACD is bullish but looks like it will have a bearish crossover this week (although the four session week may impact this).
Volumes were -42.48% below average this week compared to the year prior (43,612,160 vs. 75,685,438), as the weak enthusiasm carried on for the third week in a row.
The week kicked off with a session that set the tone for a relatively range-bound performance, opening near Friday’s close, testing higher, before ultimately closing just above where it opened on the second lightest volume of the week.
Tuesday opened just below Monday’s close & wound up closing below the high of Monday’s session; however the session was the weakest volume session of the week, on a third consecutive week of very low volumes compared to the year prior.
Wednesday proved to be the pivot point of the week, forming a bearish harami with Tuesday’s candle & testing to the downside with its lower shadow on the second highest volume of the week.
This led to Thursday, where a wide-range bearish engulfing candle covered almost the entire range that SPY has traded at since 5/15 on the highest volume of the week, while also establishing a new all-time high.
The volume is even more significant as SPY was able to close below the support of their 10 day moving average, which has not happened since May 1, 2024 & is an indication that investor sentiment is waning.
The week wound down on a +0.67% session Friday, which opened at the 10 day moving average, tested lower, before closing up.
Volumes were still nothing to write home about on Friday & the spinning top candle indicates that there is still a great deal of uncertainty among market participants.
SPY’s Average True Range began to perk back up following the volatility of Wednesday & Thursday & should continue to do so into the coming week.
The strength of the 10 day moving average’s support is still going to be a main theme to keep an eye on this week, as it began showing weakness during the most active session by volume this week, indicating that investors were undeterred by it.
As noted in previous weeks, should the 10 DMA be broken there are limited local support touch-points for SPY, which means a breach of the 10 DMA would likely lead to a test of the 50 DMA which is ~3% below Friday’s closing price.
A breakdown of the 50 DMA would likely result in a broader leg downward & would then have downward pressure of the 10 & 50 DMA’s resistance impacting price.
Between Fed speakers, the Beige Book & some earnings reports that will highlight the strength of the lower income consumer there will be plenty of opportunities for a downside test of the 10 DMA to occur again during this shortened holiday week.
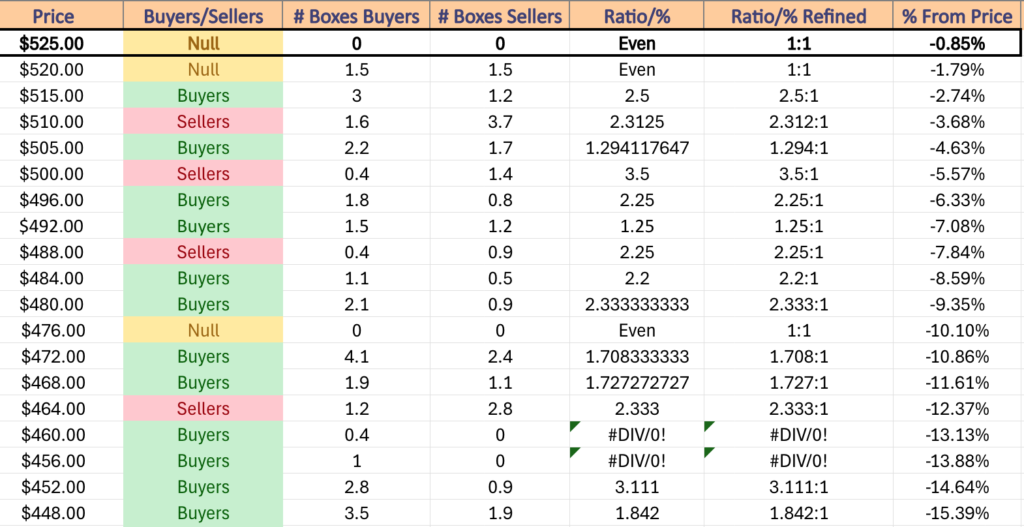
SPY has support at the $527.89 (10 Day Moving Average, Volume Sentiment: NULL, 0:0*), $524.61 (Volume Sentiment: Even, 1:1), $515.71 (50 Day Moving Average, Volume Sentiment: Buyers, 2.5:1) & $501.75/share (Volume Sentiment: Sellers, 3.5:1), with resistance at the $533.06/share (All-Time High, Volume Sentiment: NULL, 0:0*) price level.
QQQ, the Invesco QQQ Trust ETF that tracks the NASDAQ 100 was the only major index to advance this week, gaining +1.37%.
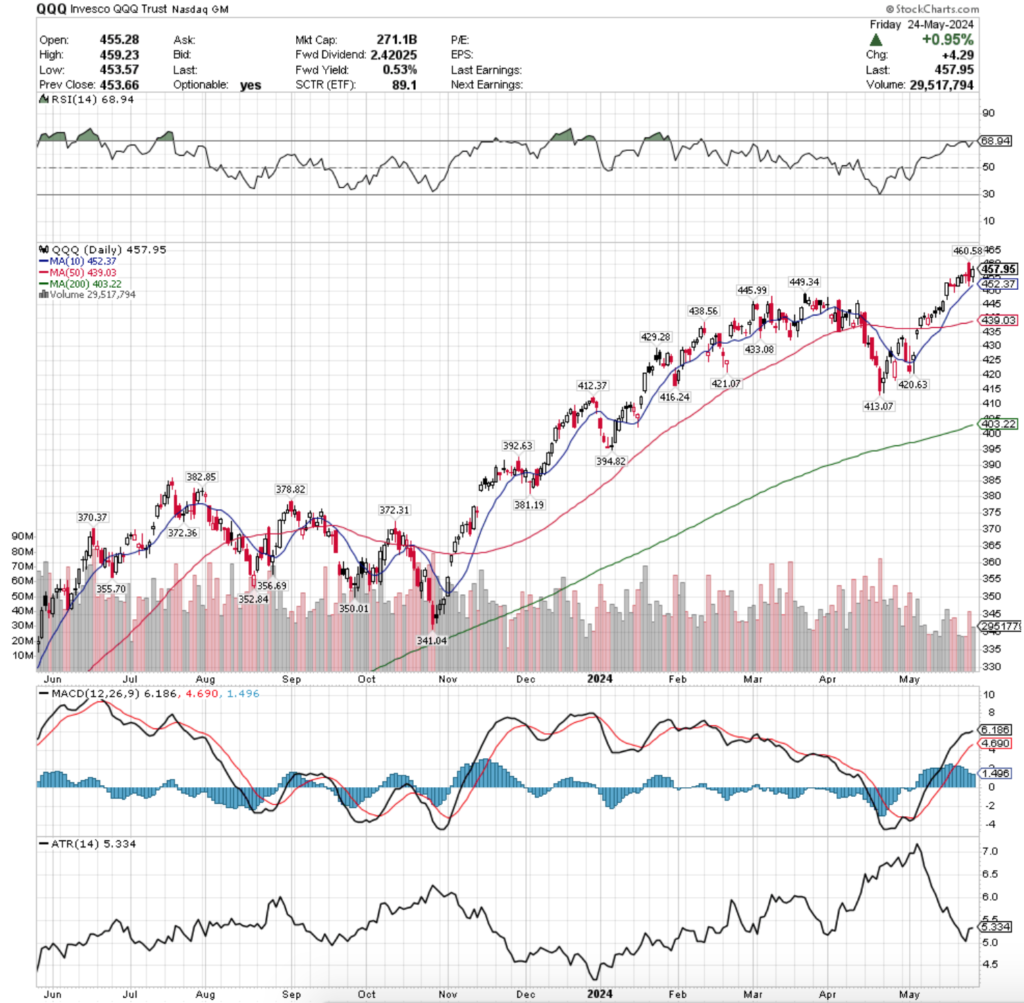
Their RSI is trending higher & sits just beneath the overbought level at 68.94, while their MACD is bullish, but is curling over for what looks to be a bearish crossover in the coming week (although the four day week may impact this).
Volumes were -39.9% below average compared to the previous year’s average (28,662,420 vs. 47,688,702), which casts doubt on the strength of their weekly advance, which was powered by NVIDIA’s earnings call & the associated strength in technology names.
QQQ’s week began on a muted note, with a low volume advancing session whose upper shadow indicated that there was a slight bit more room to move higher in the near-term.
Tuesday opened on a cautious note about mid-way through Monday’s total price range, but was able to close the day slightly higher day-over-day, but on lighter volume indicating that there was hesitancy.
Much like SPY, QQQ’s week’s performance was ultimately determined on Wednesday, when another very low volume session resulted in a dragonfly doji, indicating that there may be a reversal, or a continued march higher.
Thursday’s open in the wake of the NVDA earnings report was a large gap up for QQQ, but ultimately resulted in the indication of significant appetite for QQQ’s price to be lower, as the session closed near the low of Wednesday’s session & tested lower on the lower shadow.
Thursday also had the highest volume of the week, indicating that there is extreme discomfort in QQQ’s current price level & that many folks were eager to take profits off of the table quickly.
Also, Thursday set a new all-time high for QQQ, which confirms the profit taking angle & will make it important to keep an eye on this coming week.
Friday opened higher than Thursday’s close, tested lower but ultimately marched higher, forming a bullish harami pattern to close out the week, which will be an area to keep an eye on this week.
Like SPY, QQQ’s Average True Range began to perk up mid-week, which seems likely to continue into this coming week.
QQQ’s 10 day moving average & its relationship to its share price will be something traders are keeping a close eye on this week, as despite the weak volumes of last week, the 10 DMA maintained its strength & was not tested.
There are more local support levels for QQQ than SPY, as we’ve outlined before due to the less steep ascent that they took in the rally from October of 2023 to April of 2024, however due to the performance of many tech names eagerness to take profits may render that irrelevant in the face of a decline.
Along with SPY, the relationship between price, 10 & 50 day moving averages will also be something to keep an eye on in the event of decline, as the results will be similar for QQQ’s price.
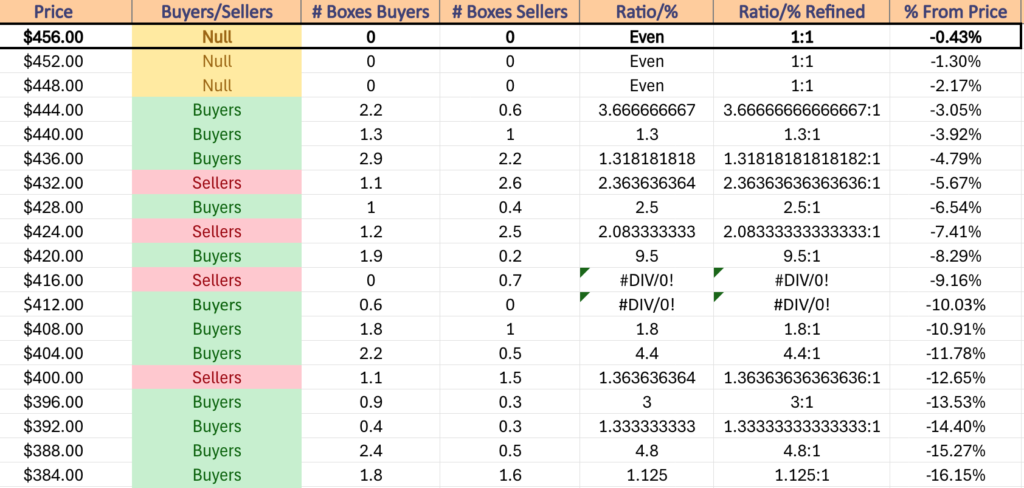
QQQ has support at the $452.37 (10 Day Moving Average, Volume Sentiment: NULL, 0:0*), $449.34 (Volume Sentiment: NULL, 0:0*), $445.99 (Volume Sentiment: Buyers, 3.67:1) & $439.03/share (50 Day Moving Average, Volume Sentiment: Buyers, 1.32:1), with resistance at the $460.58/share (All-Time High, Volume Sentiment: NULL, 0:0*) price level.
IWM, the iShares Russell 2000 ETF dipped -1.27% last week, as market participants were less enthusiastic about small cap names than other stocks.
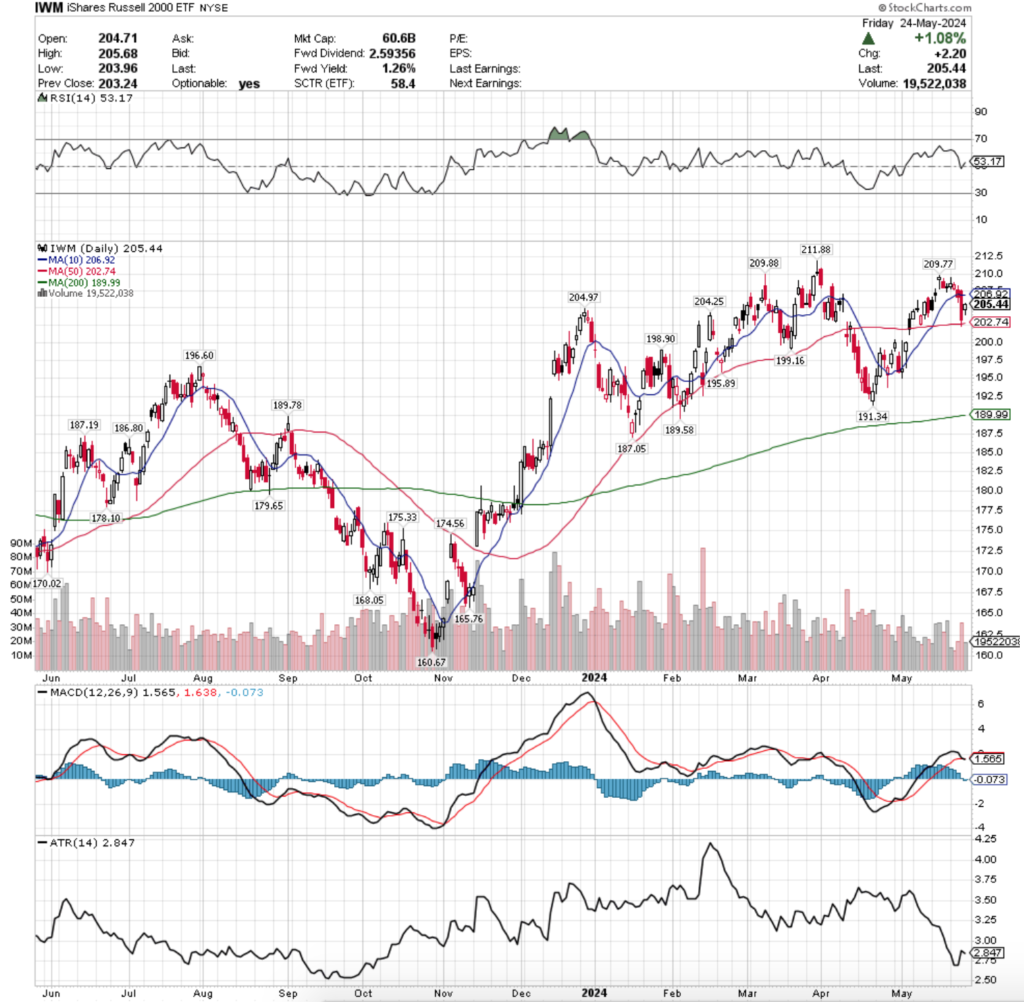
Their RSI is just above the neutral level, sitting at 53.17, while their MACD is bearish following the declines of last week.
Volumes were -39.7% less than the year prior’s average (20,792,280 vs. 34,480,038), which is interesting, given that IWM decoupled from SPY & QQQ’s performance & went largely bearish for the week.
Monday started off on a bearish foot for IWM, with a shooting star candle that included a small lower shadow, indicating that there was further appetite to the downside.
Sure enough, Tuesday gapped down, tested slightly lower, but ultimately was able to gather enough steam to close above where it opened, but still for a declining session.
The low volume of Tuesday’s session was the lowest of the week for IWM, which somewhat mutes the fact that investors did push the price back to above where the session opened, which was confirmed by Wednesday’s decline.
Wednesday’s high wave session’s real body was slightly longer than a traditional spinning top, but nevertheless showed large movements both higher & lower based on the upper & lower shadows.
It also showed a complete breakdown of the 10 day moving average’s support for IWM, which when combined with Thursday’s session paints two interesting pictures.
Thursday the declines continued, opening at first above the close of Wednesday, before nosediving through both the 10 & 50 DMAs on the week’s highest volume.
Prices were able to cover to close above the 50 DMA, leading to a bullish harami with Friday’s +1.08% advancing session, but the volumes are clearly speaking more to the downside in terms of investor preference in IWM.
IWM’s Average True Range began to perk up again after declining all month due to the volatility of the past week & appears ready to continue climbing as the most likely scenarios for IWM in the near-term involve more volatility.
Based on the fact that the 50 DMA’s support ultimately held up, Friday’s candle forming a bullish harami may see a new consolidation range forming for IWM’s prices where they oscillate between the 10 & 50 day moving averages in the near-term while waiting for an upside or downside catalyst.
However, due to the high volumes that pushed the price below the 50 DMA’s support there could also be an uptick in volatility where the 50 DMA is broken through, leading to a leg to the downside.
In the event of the latter, there are a handful of support levels that are local to the 50 DMA & could lead to a continuation of the range that IWM has traded in since December 2024 in the near-term.
The angle which the 10 DMA is curled over at is an area of concern though, and indicates that there will be more declines in the coming week(s).
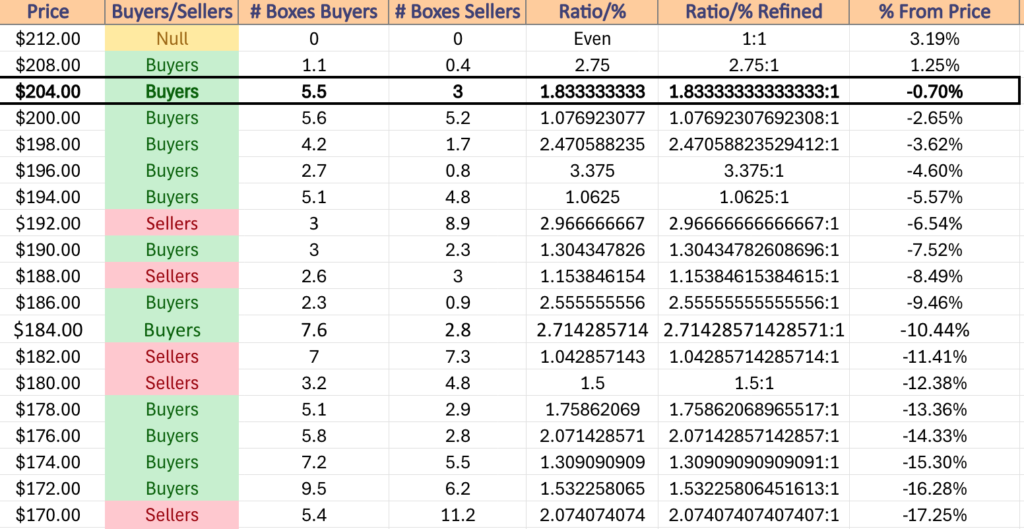
IWM has support at the $204.97 (Volume Sentiment: Buyers, 1.83:1), $204.25 (Volume Sentiment: Buyers, 1.83:1), $202.74 (50 Day Moving Average, Volume Sentiment: Buyers, 1.08:1) & $199.16/share (Volume Sentiment: Buyers, 2.47:1), with resistance at the $206.92 (10 Day Moving Average, Volume Sentiment: Buyers, 1.83:1), $209.77 (Volume Sentiment: Buyers, 2.75:1), $209.88 (Volume Sentiment: Buyers, 2.75:1) & $211.88/share (52-Week High, Volume Sentiment: Buyers, 2.75:1) price level.
DIA, the SPDR Dow Jones Industrial Average ETF had the weakest week of the major four indexes, declining -2.33%, indicating the importance NVDA stock had on markets this week, as it is a component of SPY & QQQ, but not DIA or IWM.
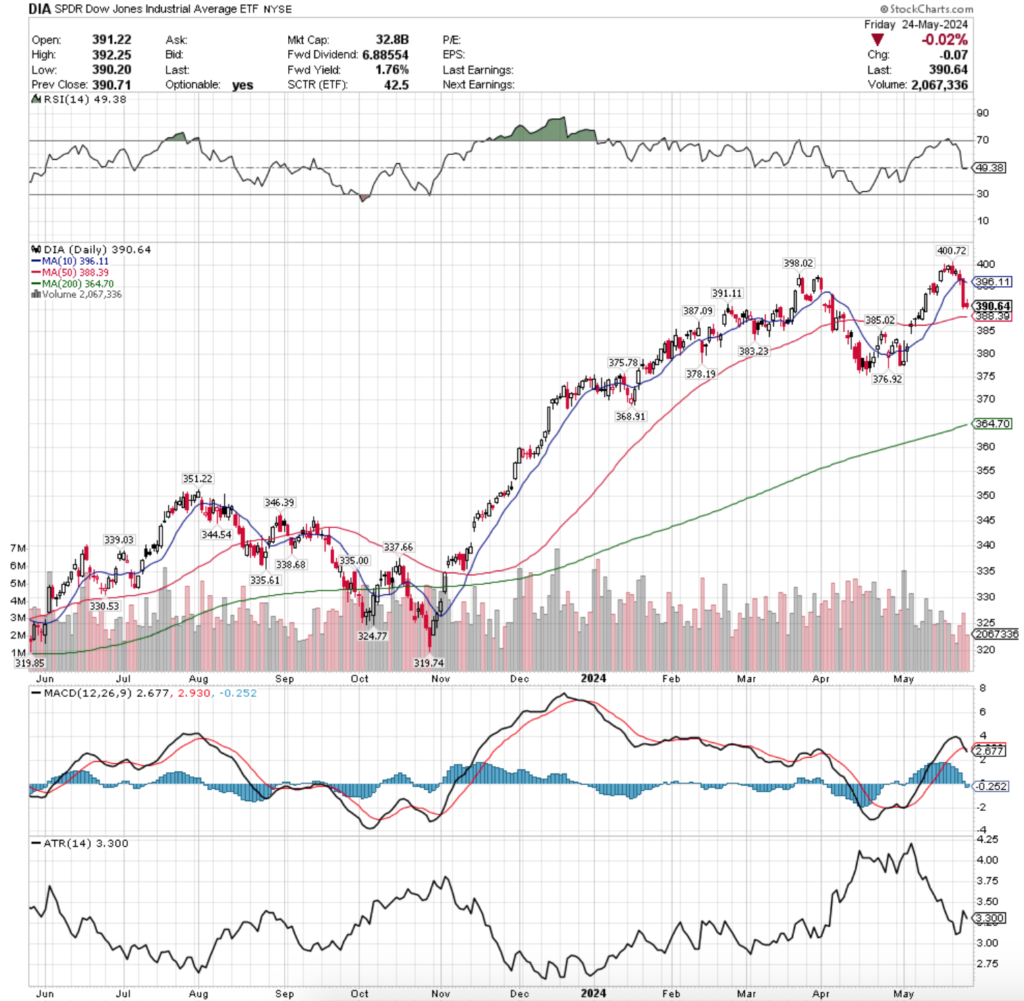
Their RSI is right along the neutral level at 49.38 after flattening out over the past two sessions, while their MACD is bearish in the aftermath of last week’s declines.
Volumes were -33.42% below average last week compared to the year prior (2,358,500 vs. 3,542,530), as investors were even weary to jump into names of the large cap comprised index & used the broader market volatility to take profits from DIA & its components.
As noted above, last week began to show the divergence between indexes that hold NVDA & indexes that do not, as IWM & DIA drifted further apart from SPY & QQQ.
DIA’s week began on an interesting note, where a low volume session that opened around Friday’s closing level created a new all-time high, before profits were taken & the day resulted in a decline.
Tuesday offered a glimmer of hope, but was still marked with uncertainty when the lowest volume of the week came on DIA’s only daily advance, but the result of the session was one of uncertainty, marked by a spinning top candle.
The rest of the week confirmed this, as Wednesday’s session opened lower, tested above Tuesday’s close, before breaking to the downside, temporarily dipping below the 10 day moving average’s support, but managing to recover to close about in line with the 10 DMA on the second highest volume of the week.
That volume indicated that sentiment clearly lies with more profit taking, which led to Thursday’s wide range decline on the highest volumes of the week, as there was no gain for DIA from the NVDA earnings report on Wednesday night.
Prices settled for the session ~2% below the 10 day moving average’s resistance, hovering <1% above the 50 day moving average’s support.
Friday’s session set up a situation similar to the one just outlined for IWM in terms of where DIA’s price goes from here, as there was more profit taking on a declining session of -0.02%, setting up a sharp downwards angle from the 10 DMA, while prices sit between it & the 50 DMA.
A ~0.5% decline would have DIA sitting atop its 50 DMA, indicating that in the near-term we either will see a consolidation range established within the two moving averages & the body of Thursday’s wide-range candle, or the support of the 50 DMA breaks down & results in a broader move to the downside.
In the case of either instance, there is a chance of the gap from early May being filled in the coming weeks, but in the near-term there does not appear to be much in the way of catalysts to the upside, nor general enthusiasm at these price levels to continue the charge higher.
DIA, like IWM has many local support touch-points, which will also be something to look at & assess as prices fluctuate in the near-term.
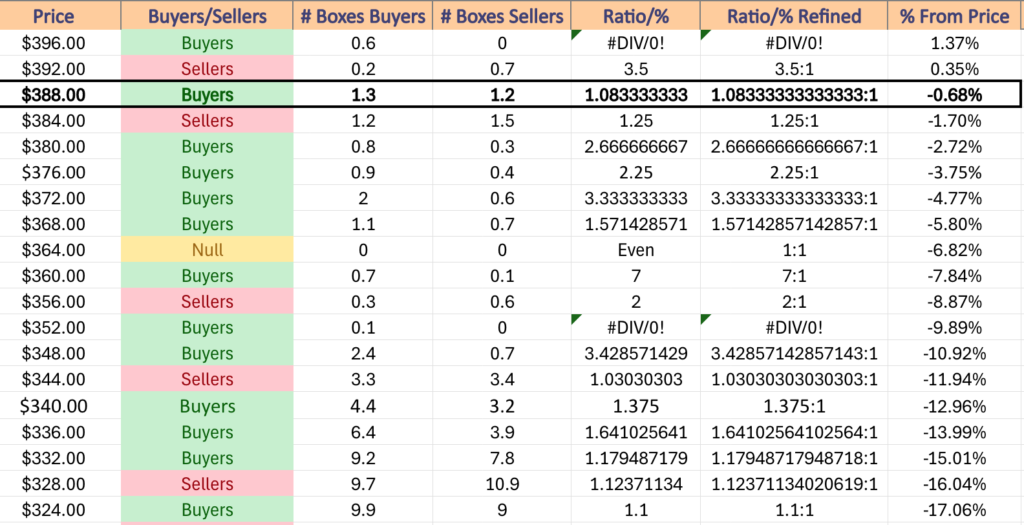
DIA has support at the $388.39 (50 Day Moving Average, Volume Sentiment: Buyers, 1.08:1), $387.09 (Volume Sentiment: Sellers, 1.25:1), $385.02 (Volume Sentiment: Sellers, 1.25:1) & $383.23/share (Volume Sentiment: Buyers, 2.67:1), with resistance at the $391.11 (Volume Sentiment: Buyers, 1.08:1), $396.11 (10 Day Moving Average, Volume Sentiment: Buyers, 0.6:0*), $398.02 (Volume Sentiment: Buyers, 0.6:0*) & $400.72/share (All-Time High, Volume Sentiment: NULL, 0:0*) price level.
The Week Ahead
Monday is the Memorial Day holiday in the U.S. so markets will be closed & there will be not economic data nor earnings reports released.
Cleveland Fed President Mester speaks in Japan at 12:55am on Tuesday, followed by the S&P Case-Shiller Home Price Index (20 cities) at 9 am, Minneapolis Fed President Kashkari speaks at 9:55 am & Consumer Confidence data is released at 10 am.
Tuesday morning’s earnings reports include Bank of Montreal, Bank of Nova Scotia, Baozun & Hello Group, with Box, CAVA Group & HEICO scheduled to report after the closing bell.
Wednesday starts late on the data front, with New York Fed President Williams speaking at 1:45 pm, followed by the Fed Beige Book at 2 pm.
Abercrombie & Fitch, Advanced Auto Parts, American Eagle Outfitters, Chewy, Columbus McKinnon, Dick’s Sporting Goods & Royal Bank of Canada are all due to report earnings before Wednesday’s opening bell, with Salesforce, Agilent Technologies, C3.ai, Capri Holdings, Credo Technology Group, HP, nCino, Nutanix, Okta, Pure Storage, Stratasys & UiPath all scheduled to report after the closing bell.
Things pick up on Thursday beginning with Initial Jobless Claims, GDP (first revision), Advanced U.S. Trade Balance in Goods, Advanced Retail Inventories & Advanced Wholesale Inventories at 8:30 am, Pending Home Sales at 10 am & New York Fed President Williams speaking at 12:05pm.
Thursday morning’s earnings calls include Dollar General, Best Buy, Birkenstock Holding, Burlington Stores, Caleres, Cracker Barrel, Foot Locker, Hormel Foods, Kohl’s, SpartanNash & Veradigm, with Dell Technologies, Ambarella, Asana, Cooper Companies, Costco Wholesale, Elastic, Gap, Marvell Technology, MongoDB, NetApp, Nordstrom, SentinelOne, Ulta Beauty, Veeva Systems & Zscaler all due to report after the session’s close.
Friday begins with Personal Income, Personal Spending, PCE Index, PCE (Year-over-Year), Core PCE Index & Core PCE (Year-over-Year) at 8:30 am & the Chicago Business Barometer (PMI) at 9:45 am & Genesco will report earnings before the opening bell.
See you back here next week!
*** I DO NOT OWN SHARES OR OPTIONS CONTRACTS IN SPY, QQQ, IWM OR DIA AT THE TIME OF PUBLISHING THIS ARTICLE ***