SPY, the SPDR S&P 500 ETF lost -0.36% this week, while the VIX closed at 20.82, indicating an implied one day move of +/-1.31 & a one month implied move of +/-6.02%.
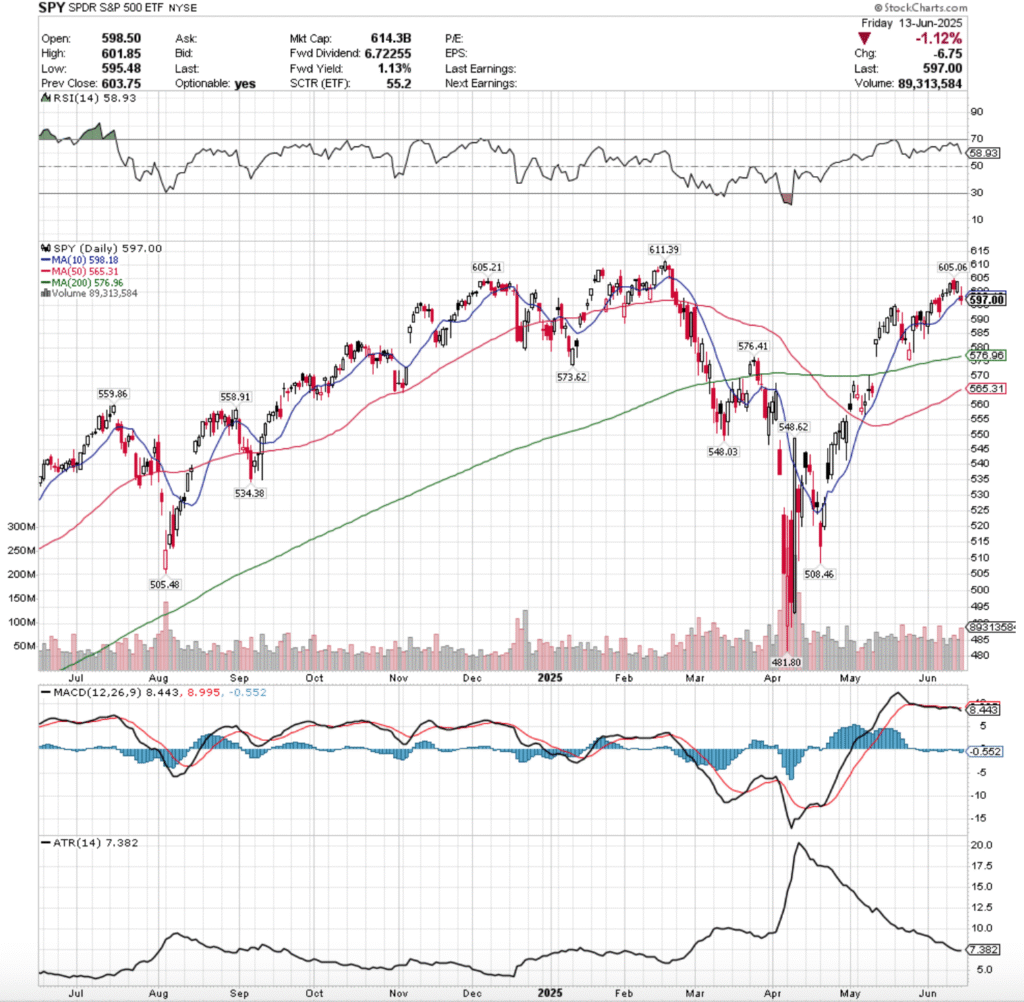
Their RSI is trending down towards the neutral 50 mark & is currently at 58.93 & their MACD is bearish, but still relatively flat; however their histogram is signaling that bearishness is likely to continue & expand next week.
Volumes were +19.92% higher than the prior year’s average (69,314,000 vs. 57,801,235), with Friday’s bearish session seeing the highest level of the week, as market participants were eager to take risk off of the table before the weekend in the wake of Israel & Iran’s conflict escalating.
Last week kicked off on a note of uncertainty for SPY, as the session opened in line with Friday’s close & produced the lowest volume of the week to close as a doji candle, indicating that there was not much confidence & market participants were more in a “wait & see” type of mood.
Tuesday opened higher, retraced much of Monday’s candle to the downside, before pushing higher to close at $603.08/share on slightly better volume.
Wednesday confirmed the feelings of unease, as a gap up open managed to break above the $605/share mark temporarily, before plunging down & exposing the vulnerability in broader markets on the week’s second highest volume as market participants took chips off of the table following the gains of Tuesday.
Thursday opened lower & made a run at Wednesday’s opening price but failed to reach it as there was not enough positive sentiment in the market, and that inability to hit Wedneday’s open or high signaled that there is clearly an impediment at the $605/share level.
Friday was the epitome of a ris-off day, as a gap down open led to a brief stint above $600/share again, but profits were quickly taken from the table & SPY was forced down to $595.48 before closing at $597/share ont he highest volume of the week.
Looking to the coming week there are a few things to take into consideration.
Firstly, the $605/share level looks to be forming the shoulders of a potential bearish head & shoulders pattern on the one year chart with the $611.39/share level, which will be an area of focus in the coming week.
There is also another head & shoulders pattern brewing on a more short-term level bearishly that began with the gap up on May 12, 2025 which will be something to watch, as it may well become an island top when the gap created that day gets filled.
The bullish case for SPY is now incredibly simple, the $605-605.99/share zone needs to be broken through & it needs solid advancing volume if it is to be sustainable.
If that can’t happen, we don’t see a run at the all-time high of $611.35/share, much less it broken through.
There is likelihood of a squeeze higher situation early in the week where a mix of short-covering & “last hurrah” profit seekers pump prices up before Wednesday’s FOMC decision, but if $605 holds up as a resistance point/doesn’t get retested it’s a signal of bearishness.
The consolidation case remains the same as it has for the past month in our notes, oscillations around the 10 day moving average, but keep an eye on the 50 DMA approaching the 200 DMA bullishly, as a golden cross may boost confidence briefly & lead to some advances.
The consolidation case looks to be the best case scenario at the moment, as there is limited data & earnings coming out this week, minus the FOMC decision & earnings/reports on the state of homebuilders & the housing market, as well as some US absed manufacturing data on a shortened holiday week (Thursday the market is closed).
To the downside there begins to be some pockets of concern given how SPY has recently performed.
One of the most important things to watch heading into this week is that when things do cool off, how far support levels are away from SPY’s closing price.
There is a very easy to visualize ~3% decline on the horizon when you look at SPY’s support levels heading into the new week, where the 200 day moving average comes into play.
All eyes should be on there if we see any declines this week, as the long-term trend line is likely to be retested.
The long-term trend line is ~-3.36% lower than Friday’s close & will likely be retested in the event of any declines given how few support levels SPY has at this point.
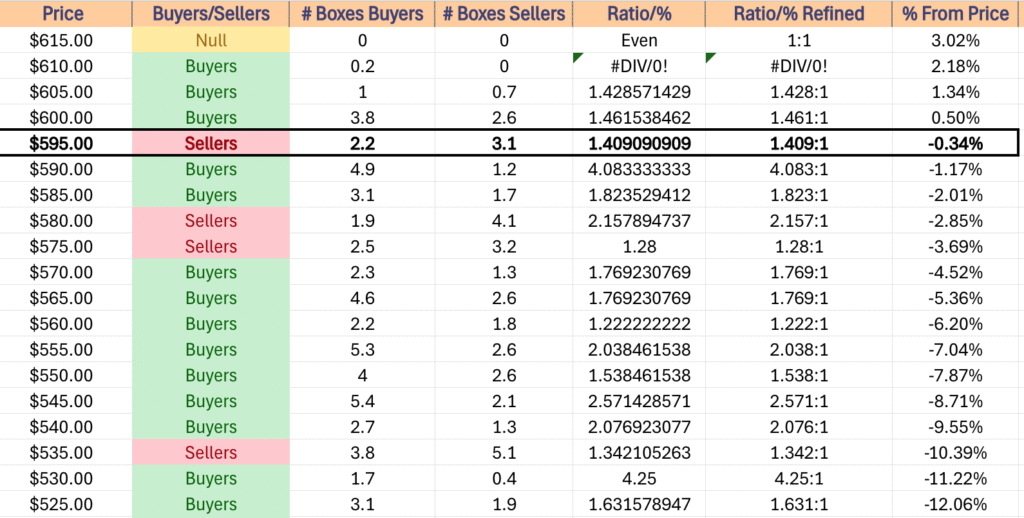
That’s where to fixate attention to at the moment, particularly when you reference the table below for their historic price level sentiment.
SPY has support at the $576.96 (200 Day Moving Average, Volume Sentiment: Sellers, 1.28:1), $576.41 (Volume Sentiment: Sellers, 1.28:1), $573.62 (Volume Sentiment: Buyers, 1.77:1) & $565.31/share (Volume Sentiment: Buyers, 1.77:1) price levels, with resistance at the $598.18 (10 Day Moving Average, Volume Sentiment: Sellers, 1.41:1), $605.06 (Volume Sentiment: Buyers, 1.43:1), $605.21 (Volume Sentiment: Buyers, 1.43:1) & $611.39/share (All-Time High, Volume Sentiment: Buyers, 0.2:0*) price levels.
QQQ, the Invesco QQQ Trust ETF dropped -0.56% last week, as the tech heavy index was saved in part by Oracle’s earnings call.
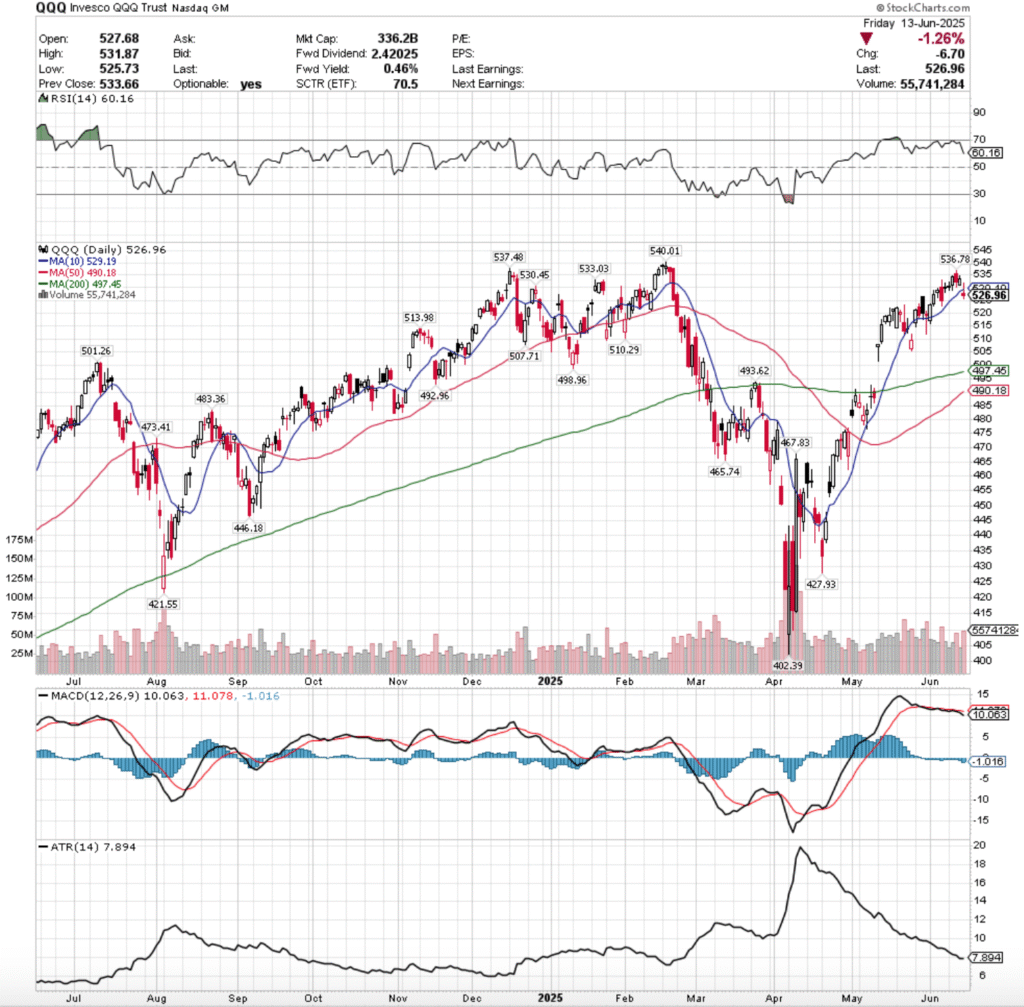
Their RSI is trending down back towards the neutral 50-mark & is currently at 60.16, while their MACD is still bearish, with their histogram implying that there is more declines & sour sentiment on the horizon.
Volumes were +13.36% higher than the previous year’s average (43,592,000 vs. 38,452,988), led primarily by Wednesday & Friday’s declining sessions, which were the two highest volume days of the week.
Monday started off similar to SPY, another low volume doji session as market participants digested the week prior’s data & looked ahead to plan the approach to the following week that is short & features an FOMC decision.
Tuesday opened on a gap higher, tested back below the $520/share mark, but was able to grind higher on slightly better volume than the previous day.
Wednesday opened on a gap up to above $535, but was unable to gain stable footing & wound up declining throughout the session, reverting back towards the 10 day moving average & indicating that the sh0rt term trend had not been broken out from.
Thursday opened on a gap down, but the weak volume session managed to squeeze QQQ higher briefly, but the lack of participation was noted.
It was felt on Friday when QQQ opened on a gap down, tried to retrace higher & break back to where it had spent the week, but was unable to as profits were taken & prices were forced lower, causing a -1.26% decline & forcing the close & open to both take place below the resistance of the 10 day moving average.
Looking ahead to this week, that negative sentiment is in the air & any bullishness is making a run at all-time highs, so unless we see a real shift in rising advancing volume or a surprise bit of FOMC news there’s not much to watch beyond the $540.01/share mark.
There is a growing concern about the potential bearish head & shoulders pattern from November where the ATH is the head & $537.48 & $536.78/share are the left & right shoulder respectively, which will be something to watch.
The consolidation case here is the same as usual, oscillations around the 10 day moving average, waiting for an upside or downside catalyst to strike, while also awaiting a potential small short-term pump from the 50 & 200 DMA’s golden cross that is impending.
The downside case has the $507.71/share price level in target, as the three higher support levels are all Seller dominated & this resides in the window created in early May that needs to be filled.
Should this get retested, the 200 day moving average’s support will come into question & likely see a re-test, as the long-term trendline is beginning to look less stable.
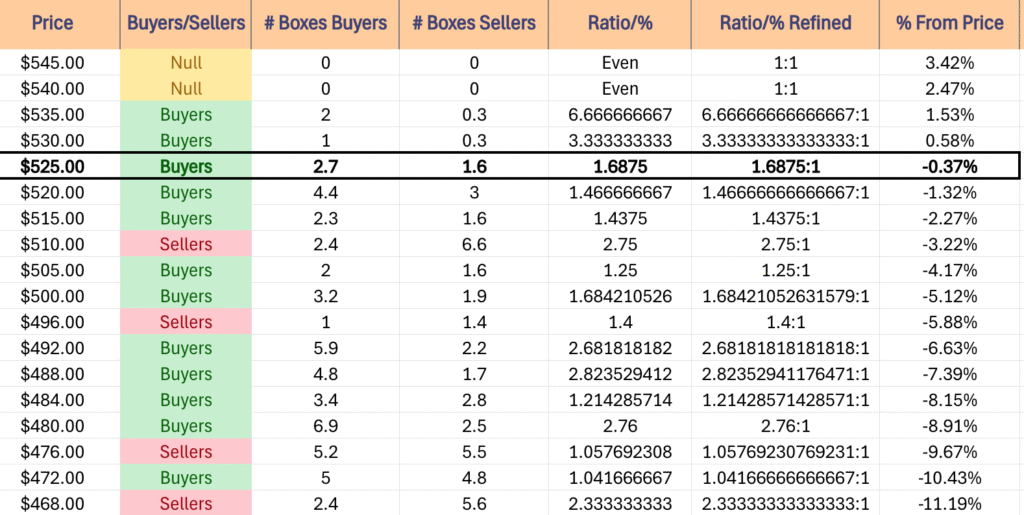
QQQ has support at the $513.98 (Volume Sentiment: Sellers, 2.75:1), $510.29 (Volume Sentiment: Sellers, 2.75:1), $510.29 (Volume Sentiment: Sellers, 2.75:1) & $507.71/share (Volume Sentiment: Buyers, 1.25:1) price levels, with resistance at the $529.19 (10 Day Moving Average, Volume Sentiment: Buyers, 1.69:1), $530.45 (Volume Sentiment: Buyers, 3.33:1), $533.03 (Volume Sentiment: Buyers, 3.33:1) & $536.78/share (Volume Sentiment: Buyers, 6.67:1) price levels.
IWM, the iShares Russell 2000 ETF declined -1.42% last week, as the small cap index fell back out of favor among market participants.
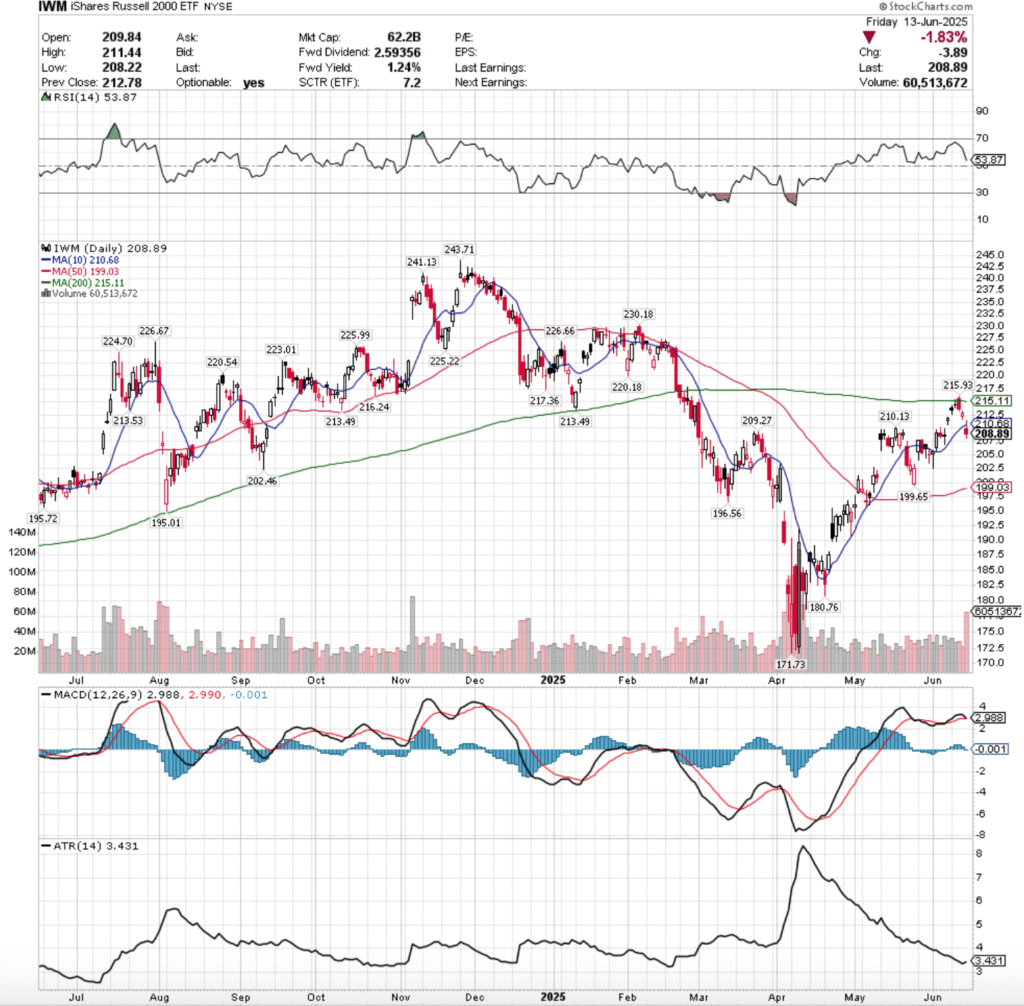
Their RSI is trending back towards the neutral 50-level, currently at 53.87, while their MACD is set to cross over bearishly on Monday’s open.
Volumes were +19.04% higher than the previous year’s average (36,244,000 vs. 30,446,096), which is cause for concern given that the declining volume on Friday eclipsed the rest of the week, hitting levels not seen since early April 2025.
Monday opened the week up on a gap up on the week’s second highest volume, but there was a major warning sign flashed as the volume indicates short-term profit taking & the day closed as a hanging man candle that closed lower than it opened.
Tuesday again gapped higher on the open, this time on less volume indicating skepticism in the strength behind the recent advances, and the gravestone doji candle signaled that there was about to be a risk-off move.
Wednesday confirmed this, as the open was on a gap up to above the resistance of the 200 day moving average, but quickly chips were taken off of the table & the long-term trendline prevailed.
Thursday opened on a gap lower & experienced a short-term pump intraday that forced the close to be higher than the open, but the low volume & nature of the previous few sessions did not make for a convincing bullish case.
Friday this continued, where a gap down open to below the support of the 10 day moving average occurred, IWM made a run to break above the short-term moving average & failed as intraday profits were collected, and the result was a -1.83% day on high declining volume, indicating that there’s more pain to come.
Heading into a new week, the bullish case requires a successful retest of the $210.13/share resistance level, which would then with enough advancing volume behind it lead to a retest of the $214.49/share level, which has two resistance levels, which happens to reside in a Seller dominated zone.
Should that test succeed, we see a long-term trendline retest on the horizon, but that’s getting ahead of ourselves, particiularly if we get there via gap ups
The consolidation case is an oscillation around the 10 DMA, while we await a catalyst to move SPY, QQQ or DIA & carry IWM with it.
To the downside, the primary focal point now is the 50 day moving avearge’s support, which is moving upwards which may help IWM prevent declines, but is certainly the gatekeeper to the downside.
If the 50 DMA breaks down, the 2025 year low price is the last test that matters.
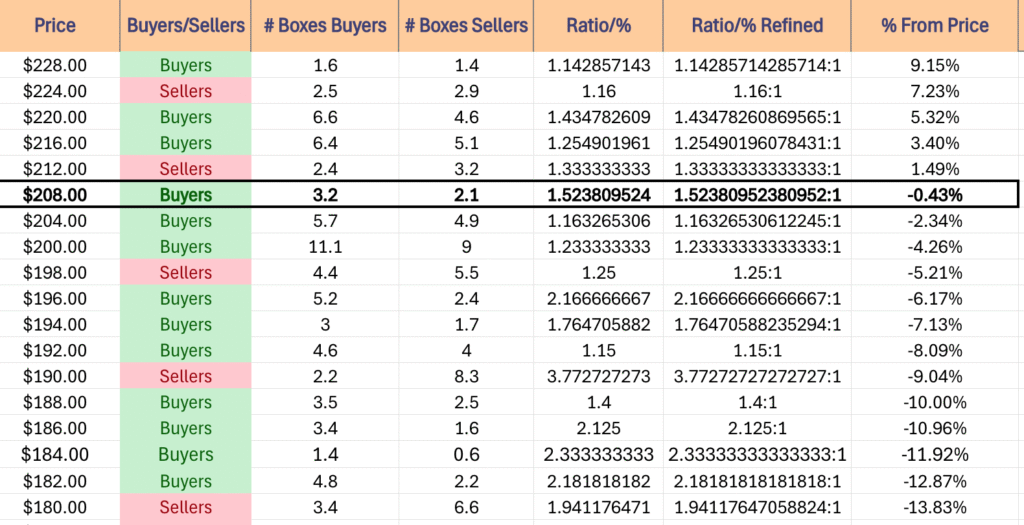
IWM has support at the $202.46 (Volume Sentiment: Buyers, 1.23:1), $199.65 (Volume Sentiment: Sellers, 1.25:1), $199.03 (50 Day Moving Average, Volume Sentiment: Sellers, 1.25:1) & $196.56/share (Volume Sentiment: Buyers, 2.17:1) price levels, with resistance at the $209.27 (Volume Sentiment: Buyers, 1.53:1), $210.13 (Volume Sentiment: Buyers, 1.53:1), $210.68 (10 Day Moving Average, Volume Sentiment: Buyers, 1.53:1) & $214.49/share (2 Touch-Points, Volume Sentiment: Sellers, 1.33:1) price levels.
DIA, the SPDR Dow Jones Industrial Average ETF dropped -1.3%, as the blue chip index wasn’t immune to the issues of the week.
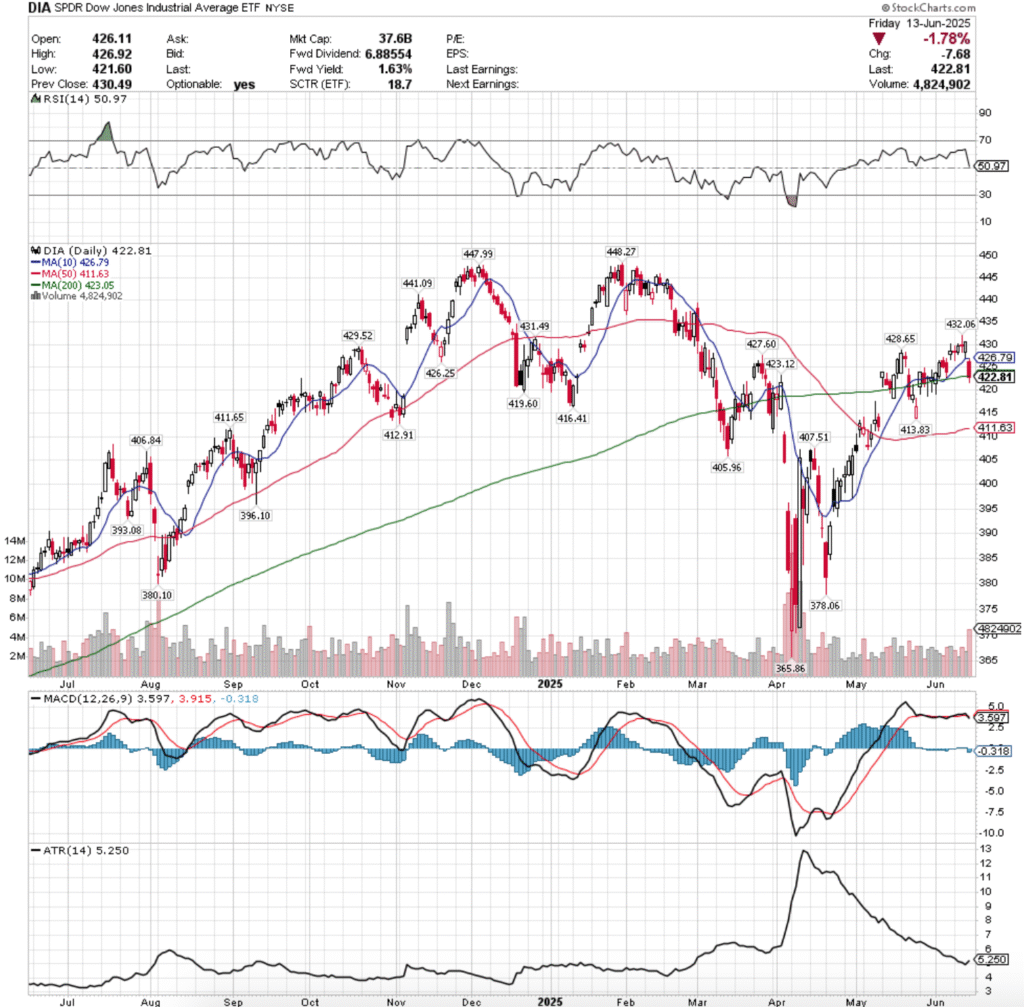
Their RSI is trending downwards & near neutral at 50.97, while their MACD crossed over the signal line bearishly on Friday.
Volumes were -4.79% lower than the previous year’s average (3,028,000 vs. 3,180,398), which like IWM is cause for concern based on Friday’s declining session’s volume eclipsing most of 2025’s volumes, only outdone by early April’s.
The week was marked by “wait & see”/”hold on” as Monday opened the week up with a high wave doji and mediocre volume indicating a sense of complacency & uncertainty among market participants.
Tuesday advanced on weak volume, before another high wave doji on Wednesday for a decline on the second highest volume of the week that marked the high water mark.
Thursday opened on a gap down that tested the support of the 10 day moving average, but was able to advance in the end to close above $430/share.
Friday showed the cracks in DIA where the gap down open below the 10 day moving avearge’s resistance only carried lower, testing the support of the 200 day moving average & breaking down through the long-term trendline to close below it on the day.
Currently the 200 DMA is DIA’s likely main place to stay this week, osciallating around waiting for a catalyst to the upside or downside.
They’re currently not set up for upside or downside breakouts as most of the blue chip index owners have been sitting on their hands waiting for an upside/downside catalyst, which will continue into this week.
To the downside if there’sa breakdown keep an eye on the 50 day moving average’s support.
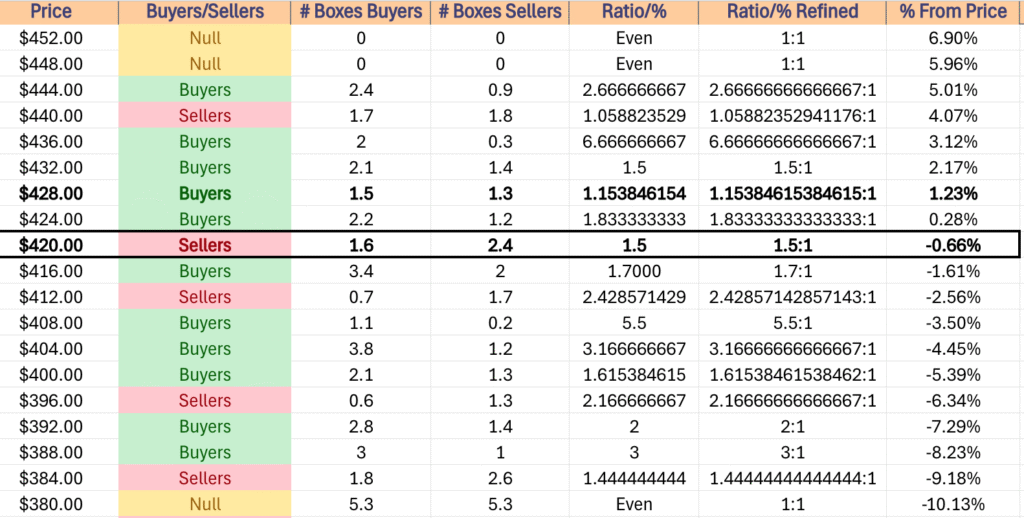
DIA has support at the $419.60 (Volume Sentiment: Buyers, 1.7:1), $416.41 (Volume Sentiment: Buyers, 1.7:1), $413.83 (Volume Sentiment: Sellers, 2.43:1) & $412.91/share (Volume Sentiment: Sellers, 2.43:1) price levels, with resistance at the $423.05 (200 Day Moving Average, Volume Sentiment: Sellers, 1.5:1), $423.12 (Volume Sentiment: Sellers, 1.5:1), $426.25 (Volume Sentiment: Buyers, 1.83:1) & $426.79/share (10 Day Moving Average, Volume Sentiment: Buyers, 1.83:1) price levels.
The Week Ahead
Monday the week kicks off with Empire State Manufacturing Survey data at 8:30 am.
Lennar is the only major earnings report on Monday, which will take place after the session’s close.
U.S. Retail Sales, Retail Sales minus Autos, Import Price Index & Import Price Index minus Fuel data are scheduled for release at 8:30 am on Tuesday, before Industrial Production & Capacity Utilization data at 9:15 am, and Business Inventories & Home Builder Confidence Index data at 10 am.
Tuesday begins with Jabil & Wiley reporting earnings before the session’s open, before La-Z-Boy’s report comes after the closing bell.
Wednesday will be an important day to watch, with Housing Starts, Building Permits & Initial Jobless Claims data due out at 8:30 am, followed by the FOMC Interest Rate Decision at 2pm & Fed Chair Powell’s Press Conference at 2:30 pm.
GMS & Korn/Ferry report earnings before Wednesday’s opening bell, with Smith & Wesson Brands reporting after the session’s close.
There is no economic data nor earnings reports scheduled for release on Thursday.
Friday the week winds down with Philadelphia Fed Manufacturing Survey Data at 8:30 am.
Darden Restaurants, Accenture, CarMax & Kroger all report earnings before Friday morning’s opening bell.
See you back here next week!
*** I DO NOT OWN SHARES OR OPTIONS CONTRACT POSITIONS IN SPY, QQQ, IWM OR DIA AT THE TIME OF PUBLISHING THIS ARTICLE ***