SPY, the SPDR S&P 500 ETF added +1.64% this week, as the volume drought continued for a sixth consecutive week.
The VIX closed the week at 12.66, implying a one day move of +/-0.80% & a one month move of +/-3.66%, although both of those numbers seem extreme if volumes continue to be so low (I am on vacation & this portion was written before Monday’s open, but I’m not editing it).
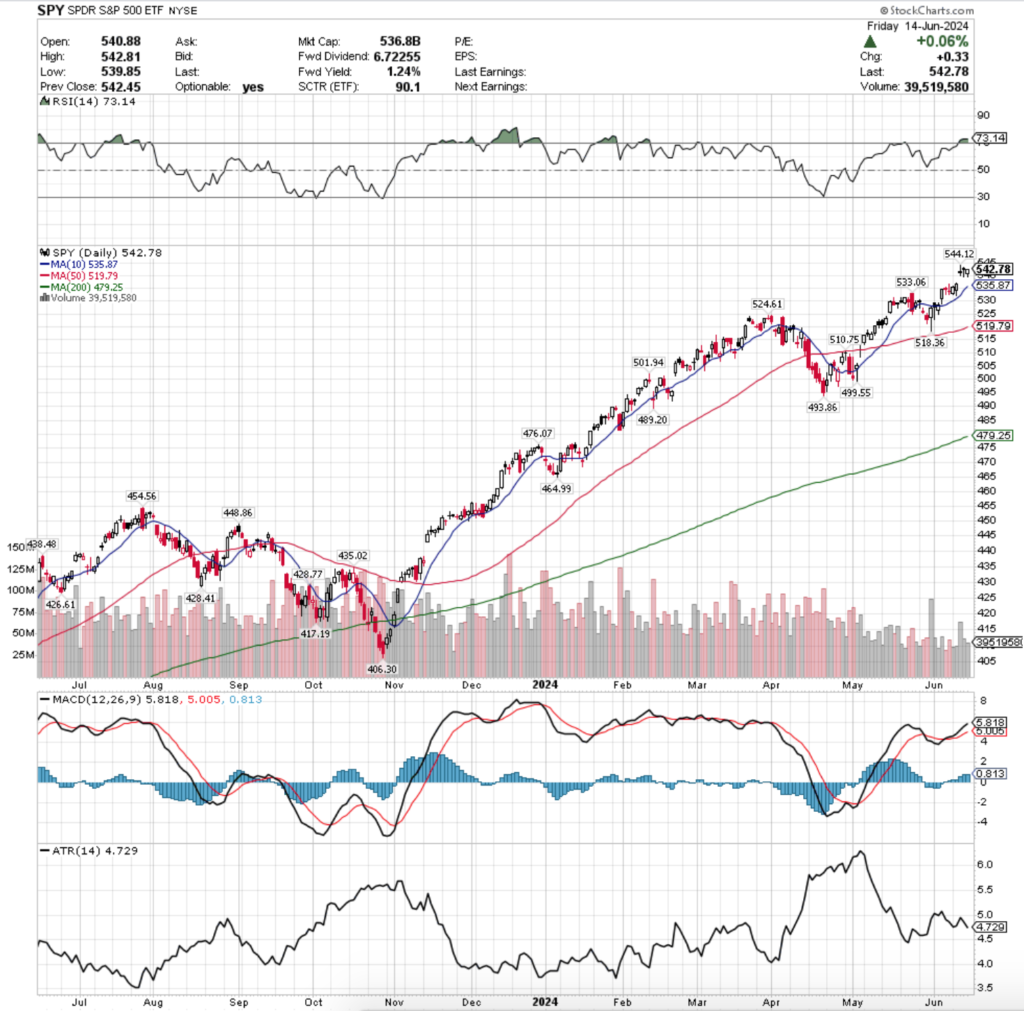
Their RSI is currently overbought at 73.14 & has flatlined in the wake of the consolidation period post-gap up over the past few days, while their MACD extended pointing bullish, but the histogram isn’t signaling extreme strength.
Volumes were -42.39% below average compared to the year prior (42,408,078 vs. 73,612,610), as it appears global warming has even caused a severe 6 week volume drought for the major index ETFs.
Monday opened the week up on a bullish & optimistic note, despite having the weakest volumes of the week & the session closed in a bullish engulfing day-over-day pattern that closed in the top 25% of the prior Friday’s candle’s upper shadow.
The cautious, yet optimistic sentiment carried on into Tuesday, when the session opened at the midway point of Monday’s candle’s real body, checked lower but was supported by the 10 day moving average (which it didn’t test fully) before trending higher to close the day in an advance.
Tuesday’s volumes were also on the lower end of the spectrum last week for SPY, indicating there was still a bit on uneasiness in markets as participants waited for both Wednesday’s CPI announcement & FOMC interest rate announcement.
This is where things took a turn for the interesting for SPY & QQQ in particular (QQQ will be reviewed next), as the CPI report forced SPY to open on a gap up on Wednesday morning & run up higher until about 10:30 am, before settling into a trading range.
Around 1:30 pm SPY began to experience declines in the run-up to Powell’s rate announcement & at 2pm continued lower.
SPY continued to bounce around in that range during Powell’s press conference until near the end when from 2:50-3:15 pm it rallied higher before dumping for the rest of the afternoon & into the close after Powell finished speaking.
This led to the day’s close being lower than the session’s open, on the highest volume of the week.
Given the hawkish nature of the Fed announcement & the dot-plot this appears to be the precursor to a further move downward in the coming weeks.
It is worth noting that 21% of the dot plot currently calls for 0 rate cuts in 2024, which is an increase of 100% from the March meeting.
Additionally, ~53% of the dots from March’s meeting have moved from 3-4 cuts in 2024 to 0,1 or 2 cuts.
In addition to the 0 cuts gaining +100%, it appears as one cut may be the most likely in 2024, as the dots for one cut increased by +250%, while the dots for three cuts only increased by 60% from March’s reading.
This will be something to keep an eye on moving into the second half of the year, especially while trying to navigate the timing estimates of said cuts that folks are saying on the financial news.
It’s also worth noting that Wednesday’s price action & the subsequent consolidation range following the gap up pushed SPY’s RSI into overbought territory.
Thursday brought along the PPI report, which also was slightly better than what was anticipated by markets, yet SPY didn’t seem properly convinced that things are improving.
This makes sense though, as one thing that is not often discussed when the impact of rate hikes has been brought up is how long it took for the desired impacts to take place since they began in March of 2022.
With this in mind, it is something to think about every time you hear someone utter the phrase “higher for longer”, as it’s been ~2.25 years since this process began & it is highly unlikely that this will be as simple as putting ice melt out on your driveway & seeing everything immediately melt away.
While Thursday’s volume was the second highest of the week, it’s still not particularly convincing that there will be folks eager to hop back into the pool in the near-term, particularly when looking at the broader market breadth.
Thursday ultimately opened on a gap up, tested much lower, but ultimately closed on the higher end of the day’s range, but below the opening price level.
This is another indication of market participant hesitancy & reason to take caution in the near-term.
Friday opened lower, tested slightly lower, but was ultimately able to close in a +0.06% advance going into the weekend, which when combined with the low volumes is really not much of a bullish sentiment.
SPY’s Average True Range began the week perking higher as discussed would happen last week, however the gap up of Wednesday’s session caused it to go back to where it began the week.
There are many Fed speakers next week, along with data coming out on the manufacturing front & homebuilding front which will likely play an impact on the week’s overall performance.
It seems that there are more potential downward catalysts in the week ahead than upward ones, but time will tell.
For the past few weeks we have stressed the importance of the relationship of the price to the 10 & 50 day moving averages, which will still be a factor in the week ahead.
However, the window that was created by Wednesday’s gap up will be an area of more interest, as while it provides some support in the near-term that is even closer to the price than the 10 DMA, it is also likely to be filled based on the low participation levels shown by volumes over the past 6 weeks.
While the gap has provided adequate support so far based on the lower shadows of the last three candles of the week, there will be more tests to come of this in the week ahead & the low volumes suggest that many market participants are looking for a reason to abandon ship in the short-term.
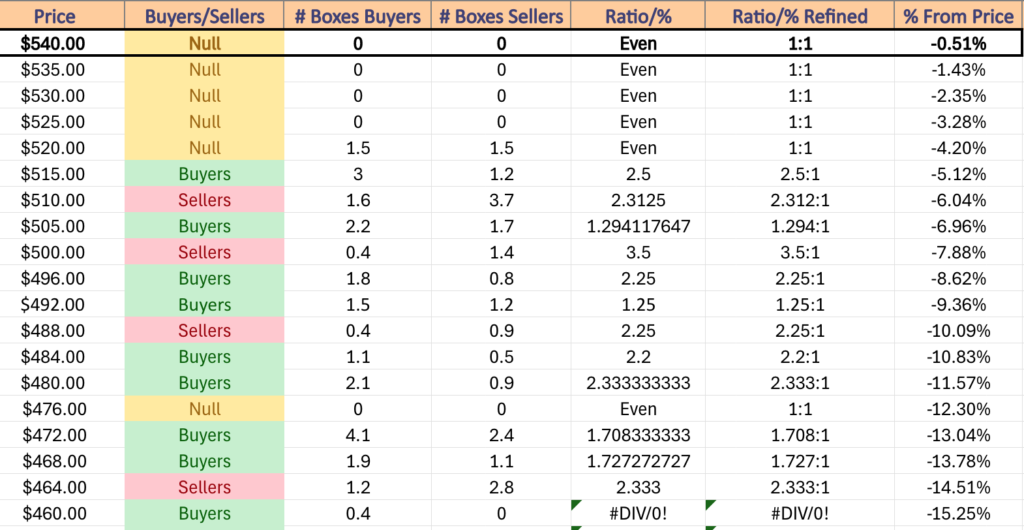
Adding further uncertainty to this is that most of the trading at the more recent high price levels has been on such light volume that sentiment analyses of SPY’s most recent price levels produce little signals & data, making it difficult to gauge the strength of the local support levels.
With this in mind, it is best to err to the side of weakness in the near-term when assessing the strength of these support levels, given that there is such little volume in the price ranges SPY has been at recently.
Should the window begin to be filled, it is likely the support of the 10 day moving average will be broken to the downside, making the $533.06 level important in hopes that it can create enough support for a near-term head-and-shoulders pattern using Wednesday’s new all-time high as the headpiece.
SPY has support at the $535.87 (10 Day Moving Average, Volume Sentiment: NULL, 0:0*), $533.06 (Volume Sentiment: NULL, 0:0*), $524.61 (Volume Sentiment: NULL, 0:0*) & $519.79/share (50 Day Moving Average, Volume Sentiment: Buyers, 2.5:1) price level, with resistance at the $544.12/share (Volume Sentiment: NULL, 0:0*) price level.
QQQ, the Invesco QQQ Trust ETF that tracks the NASDAQ 100 advanced +3.51% for the week, having the best week of the major index ETFs as NVDA’s +9.09% weekly gain powered the 100 stock component index higher than SPY’s more diluted 500 stock index.
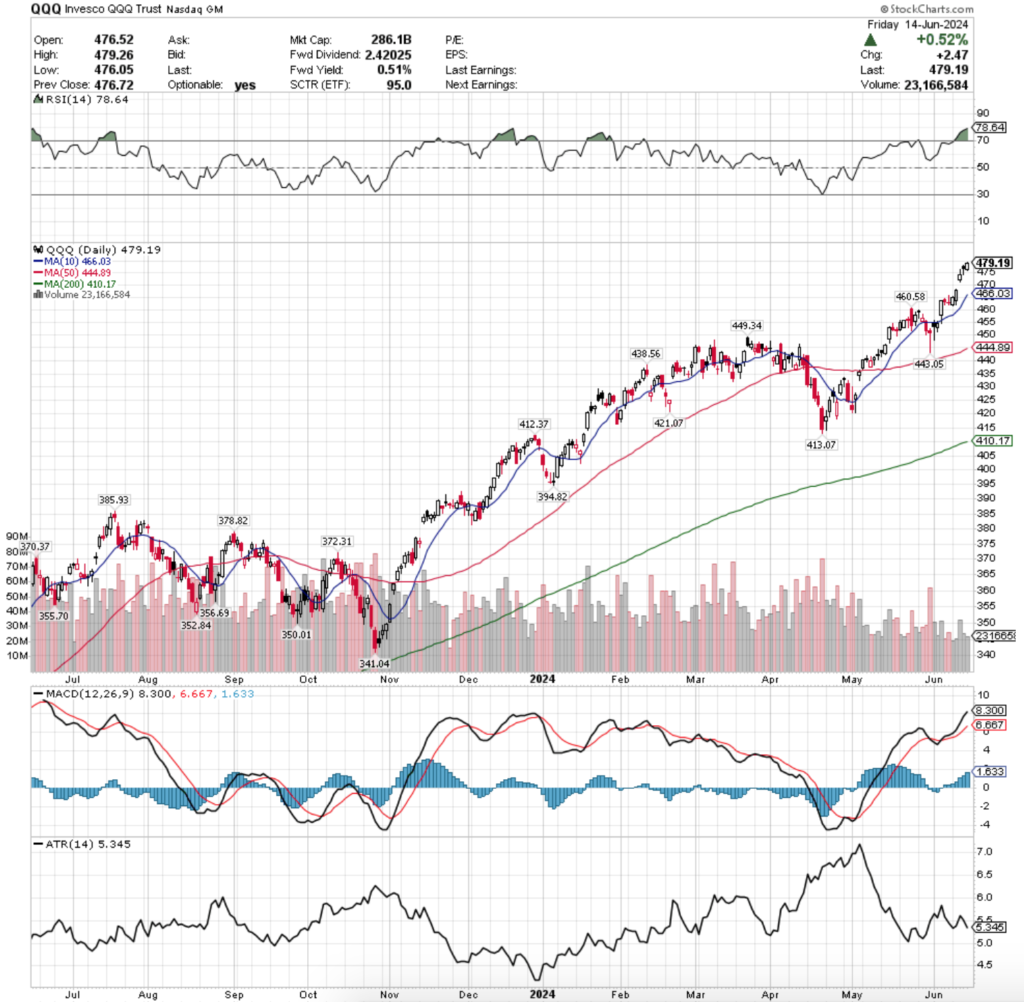
Their RSI is currently overbought at 78.64, while their MACD is bullish, but beginning to look to be extended due to lack of volume.
Volumes were worse than SPY’s though, coming in at -45.38% below average compared to the previous year (25,243,192 vs. 46,219,182), as it’s beginning to look like QQQ needs to start offering free pizza with purchase in order to drum up participation.
As we’ve been saying for the last handful of weeks, QQQ & SPY have been trading similarly due to their having NVDA & other semiconductor/AI-focused names as component stocks, which has caused them to perform much more strongly than IWM & DIA, both of which have limited to no exposure in those areas/names.
Monday kicked the week off on a similar bullish note for QQQ as SPY had, where a bullish engulfing candle set the week up for advances, although on the weakest volume of the week (also much like SPY).
Tuesday the advances continued, as did the weak volume (second weakest of the week).
Wednesday’s news events created a gap up situation for QQQ as well, also on the week’s highest volumes, which resulted in a candle with a longer upper shadow than lower shadow, indicating that bulls were not in control, but that there was some appetite to keep pushing higher.
QQQ’s RSI crossed into overbought conditions on Tuesday, leading SPY by a day.
Thursday had a rather ominous tone to the day, as the second highest volumes of the day had a dreary, yet slightly bullish result.
Prices gapped higher on the open as a result of the CPI, FOMC & PPI information releases, but tested much lower during the day to around the neighborhood Wednesday closed in, before staging a slight recovery to still close below the day’s open.
Friday resulted in a bullish engulfing candle & a new all-time high for QQQ, but with the subdued volume levels, high RSI & stretched MACD it is not feeling as bullish as it may normally.
Much like SPY, QQQ’s Average True Range began the week advancing until the gap up session of Wednesday turned it around.
This week will also turn QQQ’s focus onto the strength of the window created on Wednesday’s support, as well as if their 10 day moving average will be of much help should it cross over into the zone before prices reach that low.
The small real bodies of the candles of the past week are another indication that things are not necessarily doing ok under the hood for QQQ & that there is still a great deal of indecision in the air around them.
Many of the concerns regarding the strength of sentiment in support for SPY are also applicable to QQQ & will be areas to keep an eye on moving into the coming week.
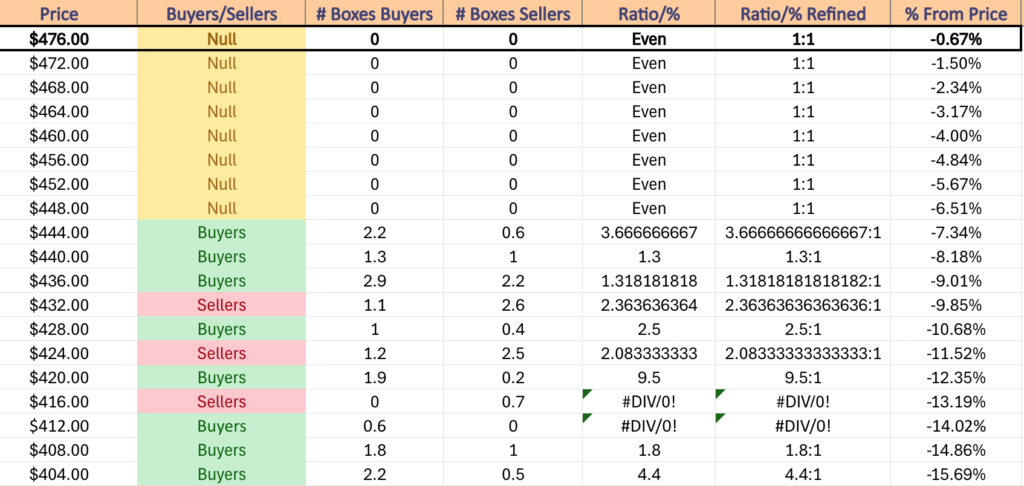
QQQ has support at the $466.03 (10 Day Moving Average, Volume Sentiment: NULL, 0:0*), $460.58 (Volume Sentiment: NULL, 0:0*), $449.34 (Volume Sentiment: NULL, 0:0*) & $444.89/share (50 Day Moving Average, Volume Sentiment: Buyers, 3.67:1) price level, with resistance at the $479.26/share (All-Time High/Friday’s High, Volume Sentiment: NULL, 0:0*) price level.
IWM, the iShares Russell 2000 ETF had the worst week of the major four index ETFs, declining -0.95%.
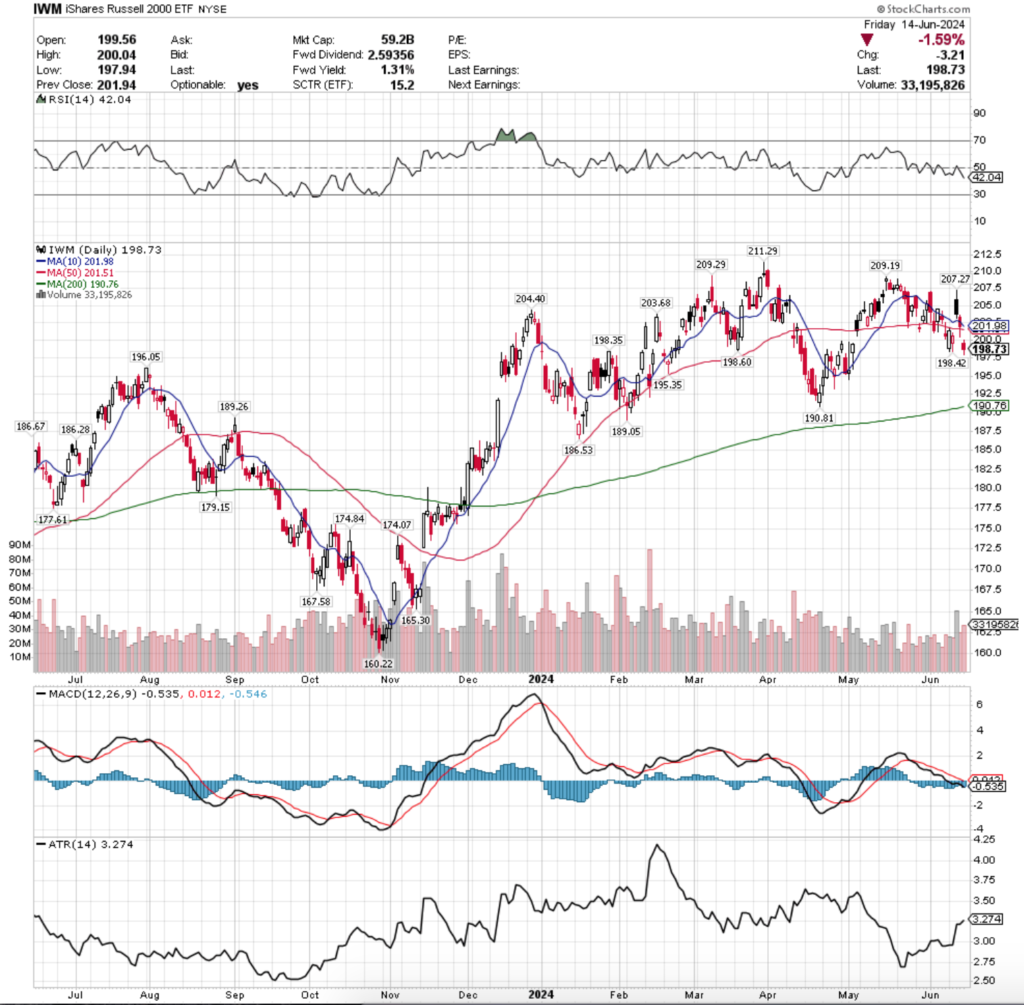
Their RSI is currently at 42.04 & trending lower towards the oversold level of 30 as a result of the consolidation that began in the middle of May, while their MACD is bearish & steadily trending lower away from the signal line, due to the nature of the consolidation range being so stretched out.
Volumes were bad, but better than the other three index ETFs, ending the week only -9.13% below the year prior’s average volume (30,758,209 vs. 33,848,256), making IWM the most actively traded of the major four index ETFs this past week (it’s a participation trophy, but we’ll give it to them).
Monday opened on weak volumes an a bullish engulfing candle, much like SPY & QQQ & set the stage for a week of advances.
Tuesday had different plans however, when a bearish harami pattern emerged during the lowest volume session of the week.
It’s worth noting that this was the lowest volume day of the week, as the session was able to close higher than it opened, despite being a declining session.
This signals that the move was not based off of any actual meaningful strength & that sentiment for IWM was still to the downside.
Wednesday is where things became interesting, as prices gapped higher on the open, tested even higher to the range that IWM traded in’s high from two weeks ago, before ultimately testing much lower & closing lower.
The good news was that the 10 day moving average was just as strong that day as a support level as it has been as a resistance level for the past few weeks.
The next day is where Wednesday’s subtle weakness was confirmed though, as prices gapped lower, broke through the 10 day moving average’s support, before dropping below the 50 DMA’s support & recovering to close just above the 50 DMA.
Thursday’s volume was the third highest of the week, indicating that this pivotal move was relatively supported by market participants & that there is still quite a bit of hesitancy among market participants to dive back into the small cap dominated index.
Friday came through with confirmation of this, when prices gapped lower, made a weak attempt higher, before testing much lower & closing down -1.59% for the day heading into the weekend.
IWM’s Average True Range has behaved differently than SPY & QQQ’s & has continued higher this past week, again likely due to their lack of NVDA & other semiconductor/AI name relevance.
This is going to be an area to keep an eye on in the near future, as these names can’t keep the entire S&P 500/NASDAQ 100 afloat forever & the challenges that IWM & DIA have faced over the past few weeks are likely to occur to SPY & QQQ except much worse as their prices have continued higher irrationally while the other two indexes have taken time to breathe.
As we’ve outlined before, the more range-bound oscillating trading style of IWM has it in the comfort of many local support levels, which will help soften any further declines.
IWM’s 10 day moving average looks primed to bearishly cross their 50 DMA which will queue further near-term declines.
This will be an area to keep a close eye on, but even more important will be to monitor what occurs with SPY & QQQ when this occurs, as they may either continue flying higher while IWM suffers, and or that movement may be the catalyst that begins to let some air out of the balloons & cause folks to take profits from their positions in them.
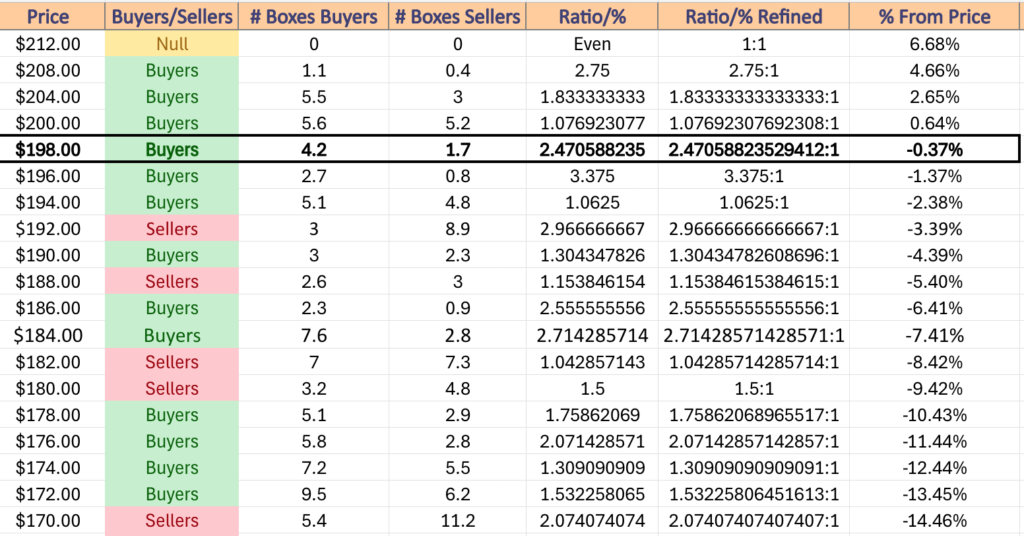
IWM has support at the $198.60 (Volume Sentiment: Buyers, 2.47:1), $198.42 (Volume Sentiment: Buyers, 2.47:1), $198.35 (Volume Sentiment: Buyers, 2.47:1) & $196.05/share (Volume Sentiment: Buyers, 3.38:1) price level, with resistance at the $201.51 (50 Day Moving Average, Volume Sentiment: Buyers, 1.08:1), $201.98 (10 Day Moving Average, Volume Sentiment: Buyers, 1.08:1), $203.68 (Volume Sentiment: Buyers, 1.08:1) & $204.40/share (Volume Sentiment: Buyers, 1.83:1) price levels.
DIA, the SPDR Dow Jones Industrial Average ETF dipped -0.52% for the week, further distancing itself from the recent returns of SPY & QQQ & sending signals of weakness to investors & traders.
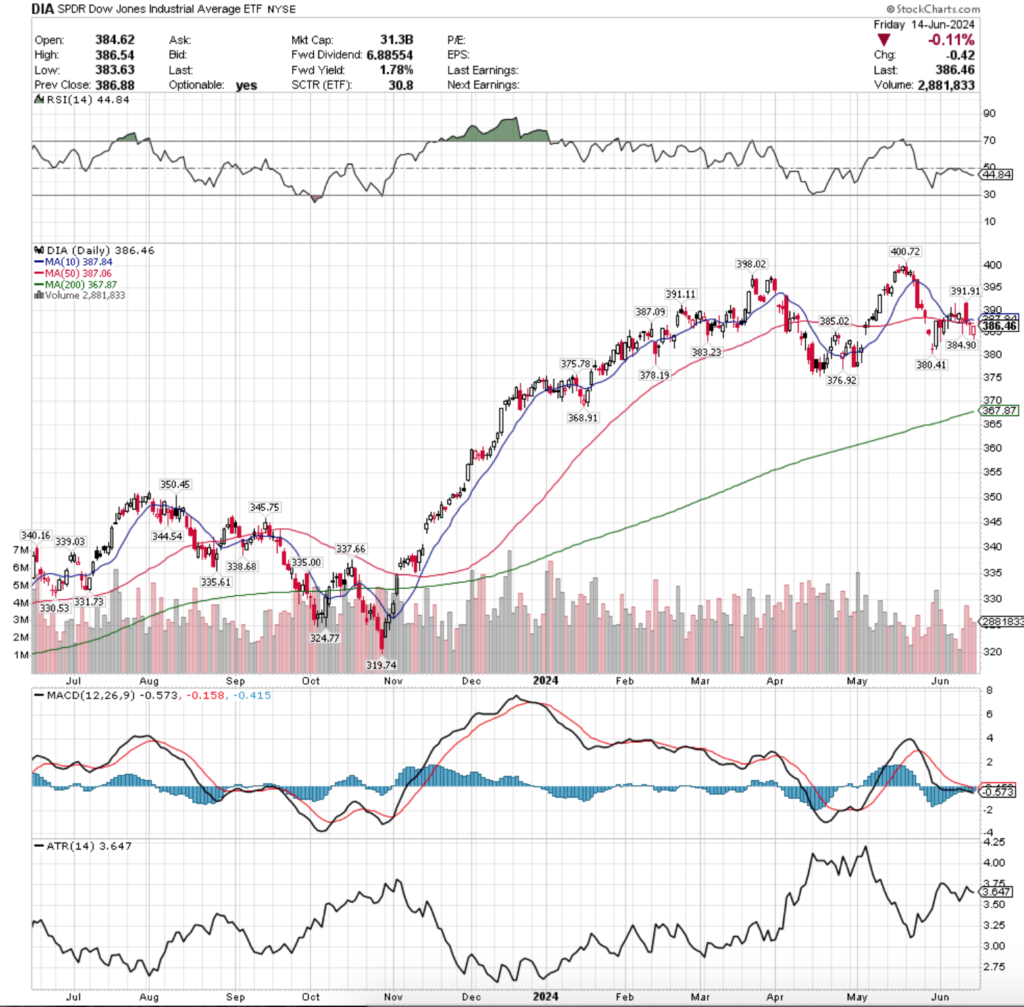
Their RSI is trending down from the neutral level & sits at 44.84, while their MACD is bearish & looking primed to continue downward for the coming week.
Volumes were -21.91% below average last week vs. the previous year (2,748,875 vs. 3,520,004), as market participants have not been overly eager to jump back into the markets & are more content with taking a breather.
Monday was the only bullish day of the week for DIA, however the bullish engulfing candle came on extremely light volumes which indicated that there was little strength behind the short term bullish signal.
Tuesday began to signal more weakness when the session opened lower, tested below the support of the 10 & 50 DMAs & ultimately closed slightly above its open, but still for a declining daily session.
Wednesday was where the real trouble began though, as the session opened on a gap up following the CPI print, but investors were no enthused about the FOMC decision & pushed prices much lower throughout the day, settling atop/just at the 10 & 50 DMA’s support levels.
This was confirmed Thursday when the session opened & tested lower again, but ultimately closed as a doji on a declining session right at about the 50 DMA’s support on the second lowest volume of the week.
Market participants were eagerly participating on profit taking during these two sessions, which is a theme that will likely carry over into this week for DIA.
Friday confirmed the weakness when prices gapped lower on the open & tested a bit lower before closing above their open, but still down -0.11% for the day.
DIA’s Average True Range has also been declining since Wednesday’s session, but based on their other indicators it looks like volatility will continue to perk up throughout this week.
As outlined many times previously, DIA & IWM have begun trading in a much more of a range-bound style than SPY & QQQ who have advanced at rapid rates over the past seven months, which gives the former more local support levels.
It will be interesting to see how strong the resistance of the 10 & 50 day moving averages are on DIA’s price this week, as well as to see if the emerging bearish head & shoulders pattern actually comes to fruition & what impact that would have on the other major three index ETFs.
It will also be imperative to see if there are any volume spikes & in which direction they occur over the coming week, as this may prove to be indicative of future near-term price movements.
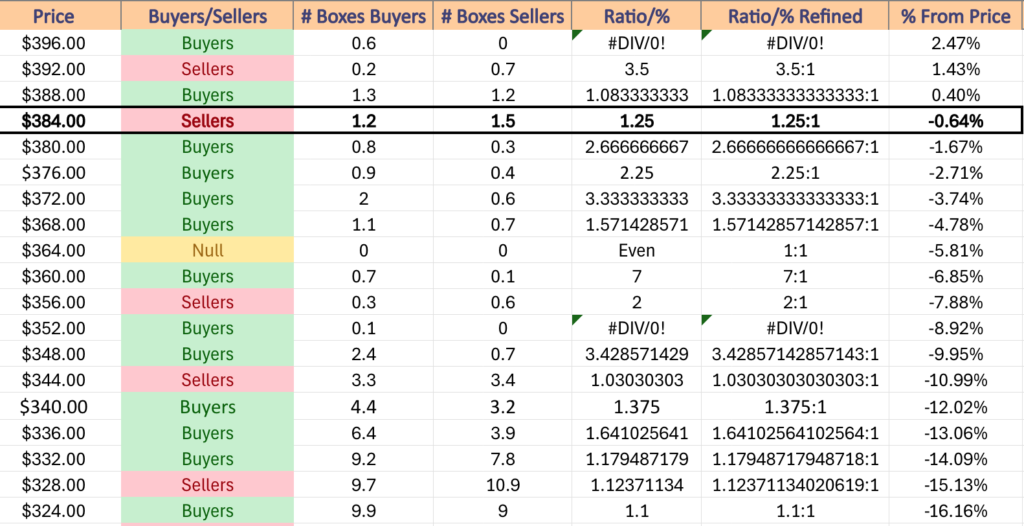
DIA has support at the $385.02 (Volume Sentiment: Sellers, 1.25:1), $384.90 (Volume Sentiment: Sellers, 1.25:1), $383.23 (Volume Sentiment: Buyers, 2.67:1) & $380.41/share (Volume Sentiment: Buyers 2.67:1) price level, with resistance at the $387.06 (50 Day Moving Average, Volume Sentiment: Sellers, 1.25:1), $387.09 (Volume Sentiment: Sellers, 1.25:1), $387.84 (10 Day Moving Average, Volume Sentiment: Sellers, 1.25:1) & $391.11/share (Volume Sentiment: Buyers, 1.08:1) price level.
The Week Ahead
Monday kicks off with the Empire State Manufacturing Survey data at 8:30 am, followed by Philadelphia Fed President Harker speaking at 1pm.
La-Z-Boy & Lennar are both scheduled to report earnings after Monday’s closing bell.
U.S. Retail Sales & Retail Sales minus Autos are released at 8:30 am on Tuesday, followed by Industrial Production & Capacity Utilization data at 9:15 am, Business Inventories & a Richmond Fed President Barkin interview at 10 am, St. Louis Fed President Musalem speaks at 1:20 pm, Chicago Fed President Goolsbee speaks at 2pm & the day closes with Dallas Fed President Logan speaking at 2:30 pm.
Tuesday morning’s pre-market earnings reports include America’s Car Mart, Cognyte Software & Patterson Companies, with KB Home announcing their results after the session’s close.
Wednesday’s primary area of focus will be the Home Builder Confidence Index at 10am.
Steelcase is scheduled to report earnings on Wednesday.
Initial Jobless Claims, U.S. Current Account, Housing Starts, Building Permits & the Philadelphia Fed Manufacturing Survey data are all released Thursday at 8:30 am.
Thursday morning begins with Darden Restaurants, Accenture, Commercial Metals, GMS, Jabil, Kroger & Winnebego all reporting earnings before the opening bell, with Smith & Wesson Brands reporting after the session’s closing bell.
Friday the week winds down with S&P Flash U.S. Services PMI & S&P Flash U.S. Manufacturing PMI data at 9:45 am, followed by Existing Home Sales & U.S. Leading Economic Indicators data at 10 am.
CarMax & FactSet Research Systems will report earnings before the opening bell on Friday morning.
See you back here next week!
*** I DO NOT OWN SHARES OR OPTIONS CONTRACT POSITIONS IN SPY, QQQ, IWM OR DIA AT THE TIME OF PUBLISHING THIS ARTICLE ***