SPY, the SPDR S&P 500 ETF lost -0.39% last week, as the ghost-town volumes continued for another week, while the VIX closed out the short week at 12.92, implying a one day move of +/-0.81% & a one month move of +/-2.36%.
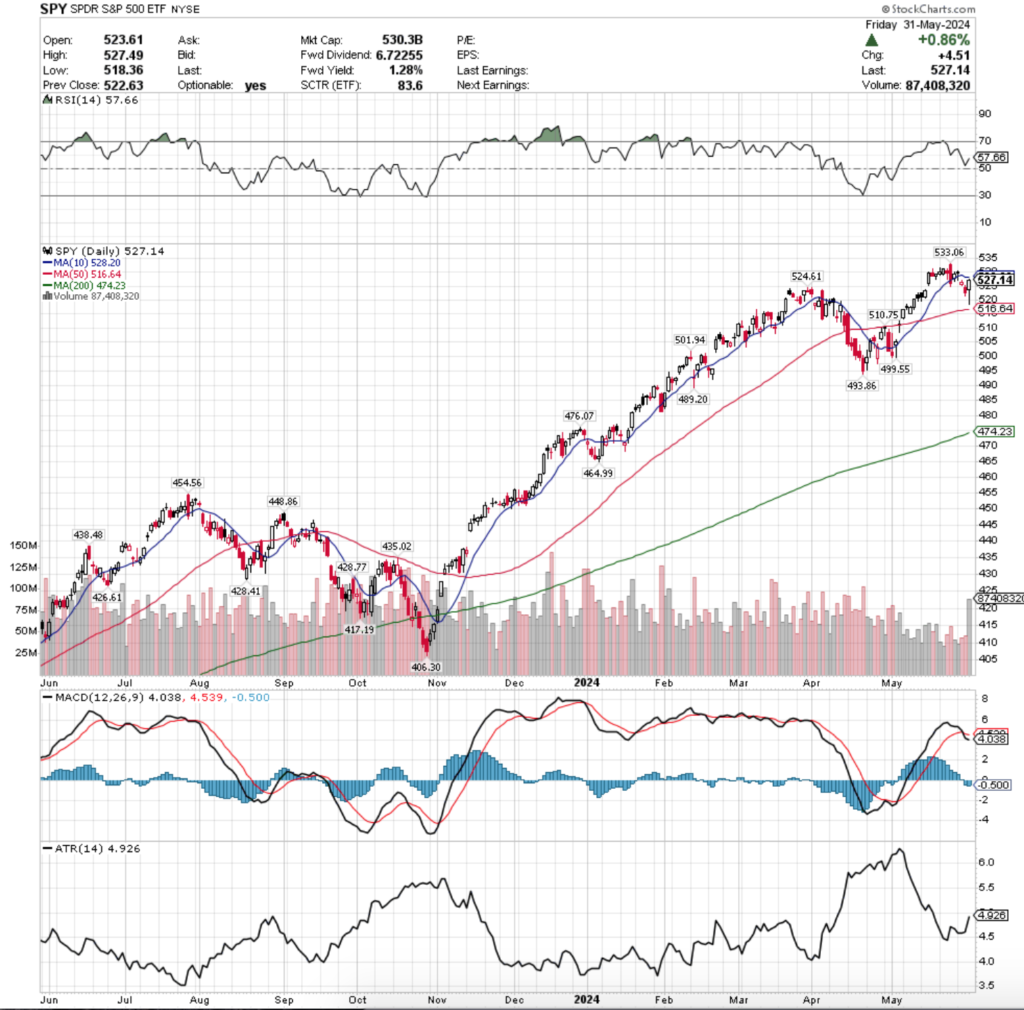
Their RSI was trending back towards neutral until Friday’s session boosted it back in the direction of overbought & currently sits at 57.55, while their MACD is bearish after crossing over on Thursday.
Volumes were yet again underwhelming for a fourth consecutive week, as SPY’s weekly volume was -27.34% below average compared to the year prior (54,558,375 vs. 75,091,843).
While it was a short trading week, these numbers are still very low, especially given how Friday’s volume eclipsed all of the volumes seen in the past month/month & a half.
Monday was Memorial Day in the United States & so the market wasn’t open, leaving the honors of opening the trading week to Tuesday.
Tuesday barely managed to stay positive, closing in a dragonfly doji on the weakest volumes of the week.
Given that last Thursday’s bearish engulfing candle had a very wide range & Tuesday’s candle remained inside of it, it was not exactly the vote of confidence market participants were hoping for.
Another area of concern included that the support of the 10 day moving average was temporarily broken on Tuesday, despite SPY rallying back to close above the 10 DMA.
The closing price was lower than the open though, which is another cause for concern, especially on such light volumes.
While Friday of last week did set a bullish harami two day pattern, it was proven to be weak as Wednesday saw a gap down session on stronger volume than Monday’s, but still severely lackluster levels compared to the rest of the previous year.
One glimmering area of hope for SPY on Wednesday came in the form of despite the gap down day, the close was slightly higher than the opening price level.
This was quickly erased on Thursday, when another gap down open occurred & pushed prices even further below the resistance of the 10 DMA.
Volumes were still subdued on Thursday, but slightly higher than the prior two days, which brings us to Friday’s interesting price action.
Firstly, as noted previously, Friday had the highest volumes of all sessions for almost the past month & a half for SPY.
The candle that the day resulted in is an interesting one though, as it came out in the form of a hanging man (bearish) with a very long lower shadow.
Prices opened just below the open of Thursday & proceeded to test well below all of Thursday’s range & broke below the $520/share range temporarily, as seen by the lower shadow.
Although the session proved to be an advancing day & a run at the 10 day moving average’s resistance was made, it was unable to reach, indicating that there is still quite a bit of downside sentiment.
As last week’s note pointed out for IWM & DIA, SPY has now entered into a range in the little bubble between the 50 Day Moving Average’s support & 10 Day Moving Average’s resistance.
This tends to be indicative of further near-term declines on the horizon & will be something to keep an eye on in the coming week.
SPY’s Average True Range perked up as last week’s note anticipated, and we expect it to continue into the near-term as volatility looks ready to increase further.
It would also be prudent to keep a keen eye on volume sentiments as the 50 day moving average begins to be tested, as an uptick in volumes there will likely be a great indicator of where market participants are ready for SPY to go.
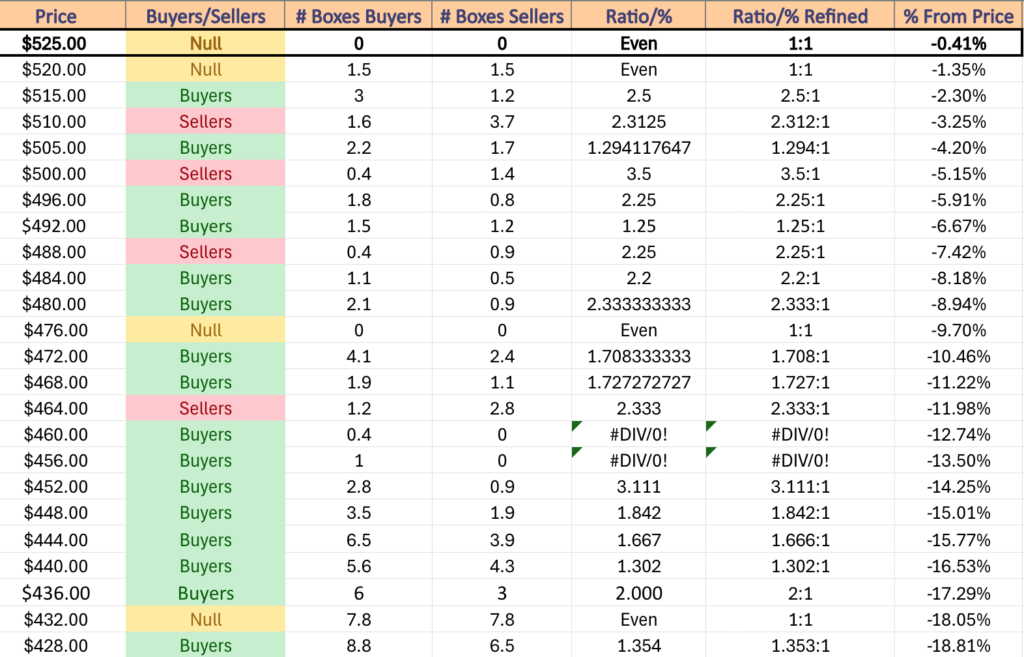
In the event that the 50 DMA is breached another key area of focus will be the $510.75/share mark, where sellers have historically outperformed buyers at a ratio of 2.31:1 over the past 1-2 years, as this gate is the last area keeping SPY from heading towards the gap that in the $505-510 range, as well as the one in the $500-502 range.
The $510.75/share support is also where the 50 DMA rejected price advances on a session that resulted in a hanging man candle at the end of April, which is not a particularly reassuring signal of strength.
Last Thursday’s candle remains the upside target if the 10 DMA resistance is broken, but there appears to be more pain to come in the coming week for SPY & an increased chance of declines.
SPY has support at the $524.61 (Volume Sentiment: Even, 1:1), $516.64 (50 Day Moving Average, Volume Sentiment: Buyers, 2.5:1), $510.75 (Volume Sentiment: Sellers, 2.31:1) & $501.94/share (Volume Sentiment: Sellers, 3.5:1) price levels, with resistance at the $528.20 (10 Day Moving Average, Volume Sentiment: NULL, 0:0*) & $533.06/share (All-Time High, Volume Sentiment: NULL, 0:0*) price levels.
QQQ, the Invescco QQQ Trust ETF that tracks the performance of the NASDAQ 100, declined -1.58% in the short trading week, faring the worst of the major four indexes after being the leader of the prior week’s performance.
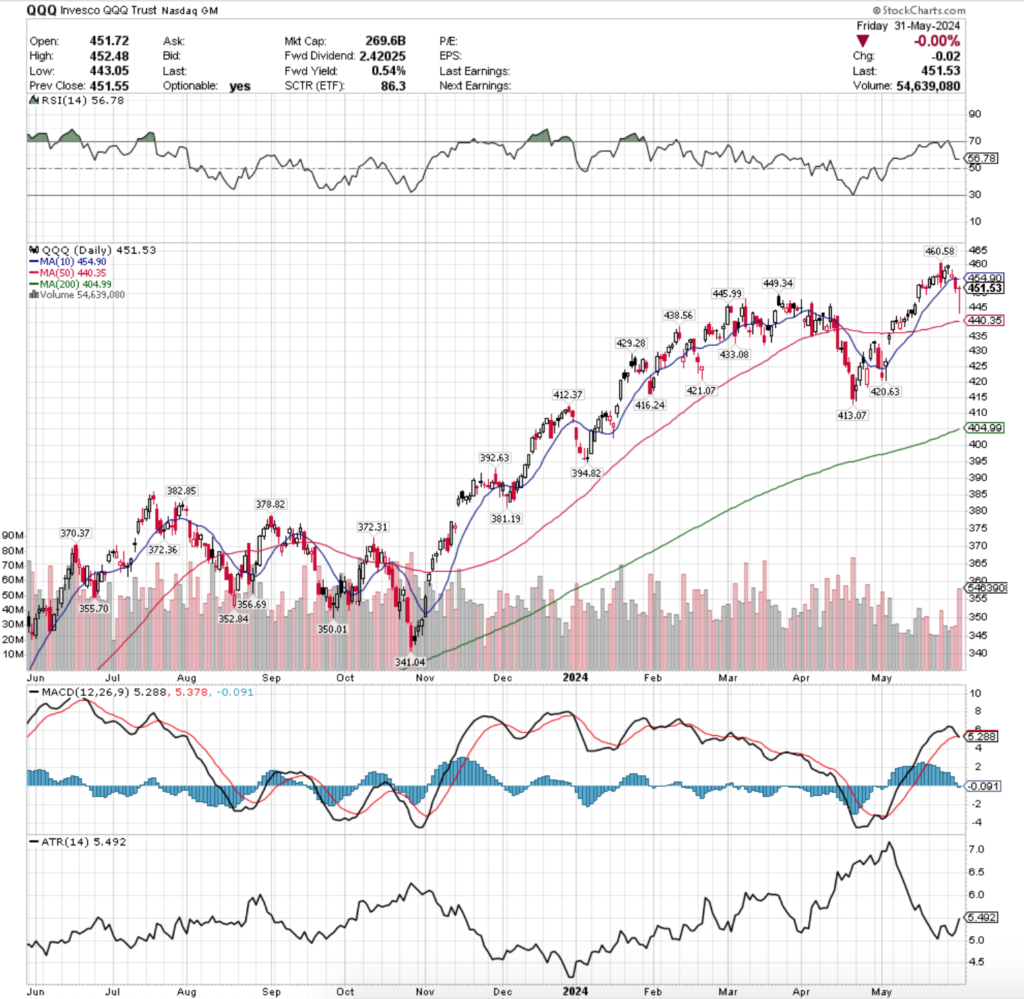
Their RSI is currently 56.78, while their MACD is bearish in the wake of the past few days of declining sessions.
Volumes were also very low for QQQ, finishing at -24.47% below average vs. the year prior’s average (35,643,100 vs. 47,192,452), which despite the four day trading week is still very low.
It is worth noting that Friday also had the highest volume of the week for QQQ, however it was on a “declining” session where QQQ dropped-0.00%, losing $0.02/share, which will make for an interesting sentiment attribute moving into next week.
Tuesday opened on an advancing note, however the day’s candle was a hanging man & set the stage for the rest of the week’s declines.
Tuesday managed to keep some hope for bulls alive as the strength of the 10 day moving average prevailed & propped prices up above it, where a declining open resulted in a test higher & an ultimate higher close than open for QQQ.
Tuesday had the weakest volume of the week, followed by Wednesday & Thursday.
Thursday is where we saw QQQ re-align to a degree with SPY, IWM & DIA, as last week’s note pointed out how there was a divergence in index performance between SPY & QQQ who have NVDA as a component & IWM & DIA who do not.
Thursday opened just above the 10 DMA, tested slightly higher based on the small upper shadow, but in the end broke to the downside, breaking the key support level to close ~1% below it.
This made for an interesting Friday, where the session opened near the low range of Thursday’s session’s candle body, tested down -1.92% to the low of the day, before closing two cents lower for the day at $451.53.
While the session resulted in a dragonfly doji which tends to signal a reversal is imminent, that’s not likely the case for QQQ this week.
Much like SPY above, QQQ is now in the area between the resistance of the 10 DMA that is moving downward applying pressure to price, while above the 50 DMA which is moving towards price as support.
QQQ is in luck though, as due to its more steady price progression there are more support levels locally in relation to its price compared to SPY, but these may not be as strong as holders think & could become problematic, particularly if there is a rug-pull profit taking move on NVDA & the other semiconductor stocks that are QQQ components that have been experiencing strength of recent.
Much like IWM & DIA last week & SPY above, now we wait to see if QQQ manages to maintain its position squeezed between the two moving averages & establishes a new consolidation range, or if the 50 DMA will give out & prices crash to the downside.
In the unlikely event that prices do ultimately pop up in the near-term, last Thursday’s high of $460.58/share is the target area to be keeping an eye on (all-time high).
It appears more likely to see a test of the downside though given the relationship to prices & the 10 & 50 DMAs, which is where attention should be placed this coming week.
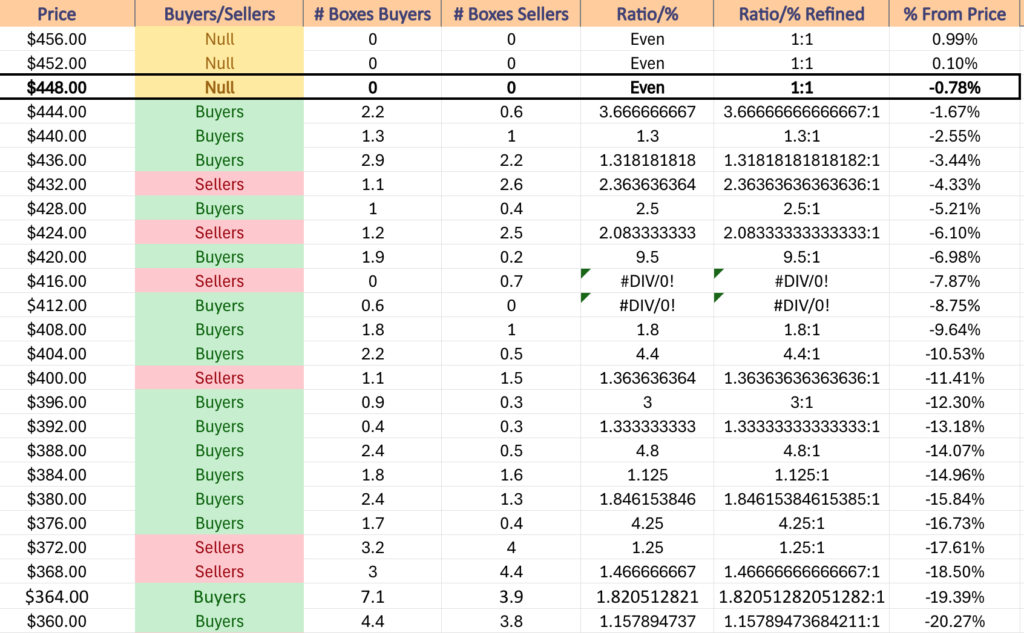
QQQ has support at the $449.34 (Volume Sentiment: NULL, 0:0*), $445.99 (Volume Sentiment: Buyers, 3.67:1), $440.35 (50 Day Moving Average, Volume Sentiment: Buyers, 1.3:1) & $438.56/share (Volume Sentiment: Buyers, 1.32:1) price levels, with resistance at the $454.90 (10 Day Moving Average, Volume Sentiment: NULL, 0:0*) & $460.58/share (All-Time High, Volume Sentiment: NULL, 0:0*) price levels.
IWM, the iShares Russell 2000 ETF had the strongest weekly performance of the major index ETFs, advancing +0.16%.
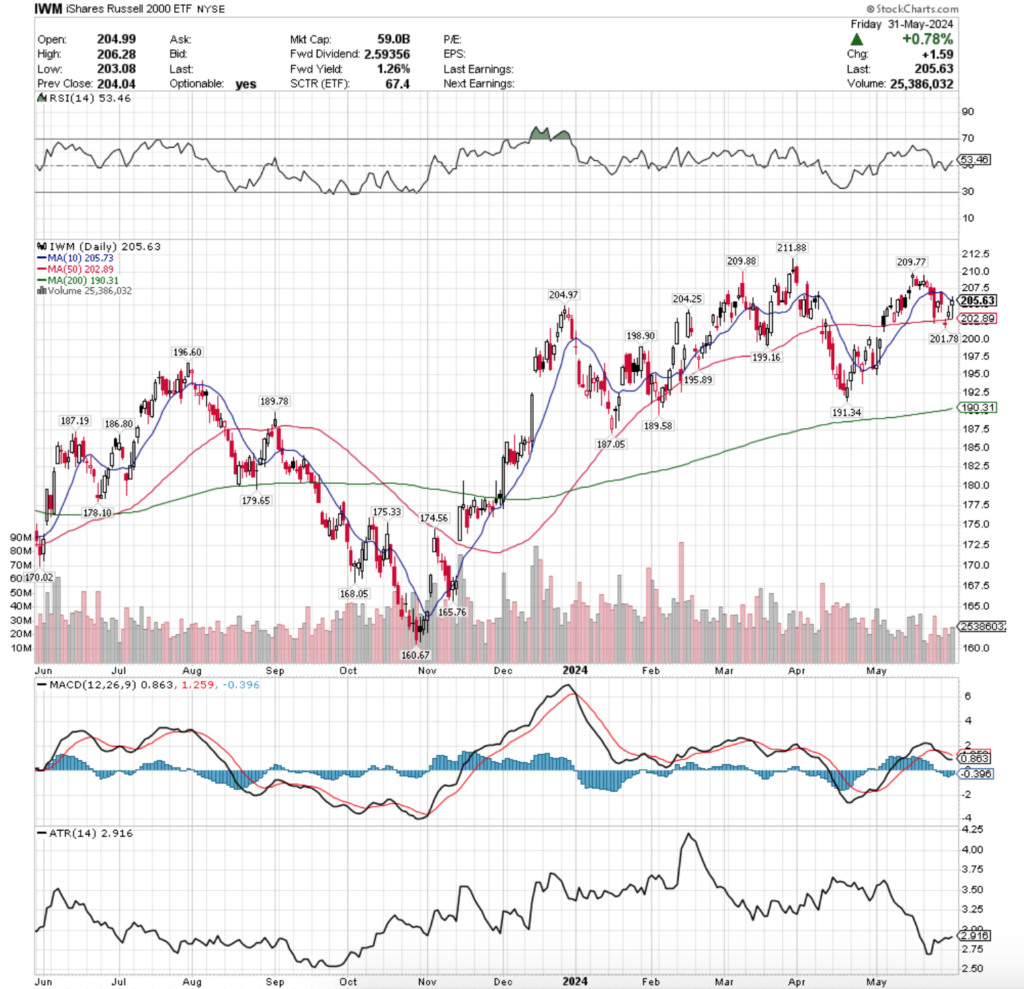
Their RSI is at 53.46 & trending back towards overbought after the gains of the past two sessions, while their MACD is bearish but the signal line could be broken bullishly in the event that the 10 day moving average’s resistance does not hold up.
Volumes were very low for IWM as well, coming in at -34.2% below average compared to the year prior (22,595,850 vs. 34,337,848), which even when the loss of Monday trading is factored in still signals a sluggish participation rate among investors.
IWM opened the week off Tuesday with gap up to the 10 day moving average in the footsteps of a bullish harami pattern formed the previous Friday.
However, the open was about the best part of the day, as it declined on the lowest volume of the week after that, testing near the prior day’s lows had been when looking at the candles’ lower shadows.
Things took an uglier turn on Wednesday, with a gap down session that barreled through the 50 day moving average’s support at the open & ended the day on an indecisive note with the session’s candle being a doji.
One thing that was certain was that market participants were overwhelmed by the resistance of the 50 day moving average, as the session remained below it all day & the volumes were at the second highest level of the week.
Thursday was a bit more optimistic, but still negative, as prices gapped back above the 50 DMA, tested its support to the downside & were able to rally higher, but the candle’s real body was concentrated in the lower half of the day’s range & volumes were lackluster compared with other sessions last week.
Friday was reckoning day, as the open gapped higher, tested lower covering the range between the 10 & 50 DMAs before heading back up to break the resistance of the 10 day moving average temporarily & closing 10 cents lower than the resistance level on the week’s highest volume.
IWM’s Average True Range has been increasing slowly over the past weeks & looks to continue to do so as more volatility appears to be on the horizon.
As we enter a new week all eyes will be on which direction prices get squeezed into as the 10 & 50 day moving averages begin to constrict the consolidation range that IWM has established over the past few weeks.
If prices can’t settle for a session above the 10 DMA, it appears the near-term following movements will be to the downside.
Fortunately, due to its more rangebound trading nature IWM has many support touch-points nearby in the event of the decline, and it will be interesting to see which ones hold up as the strongest.
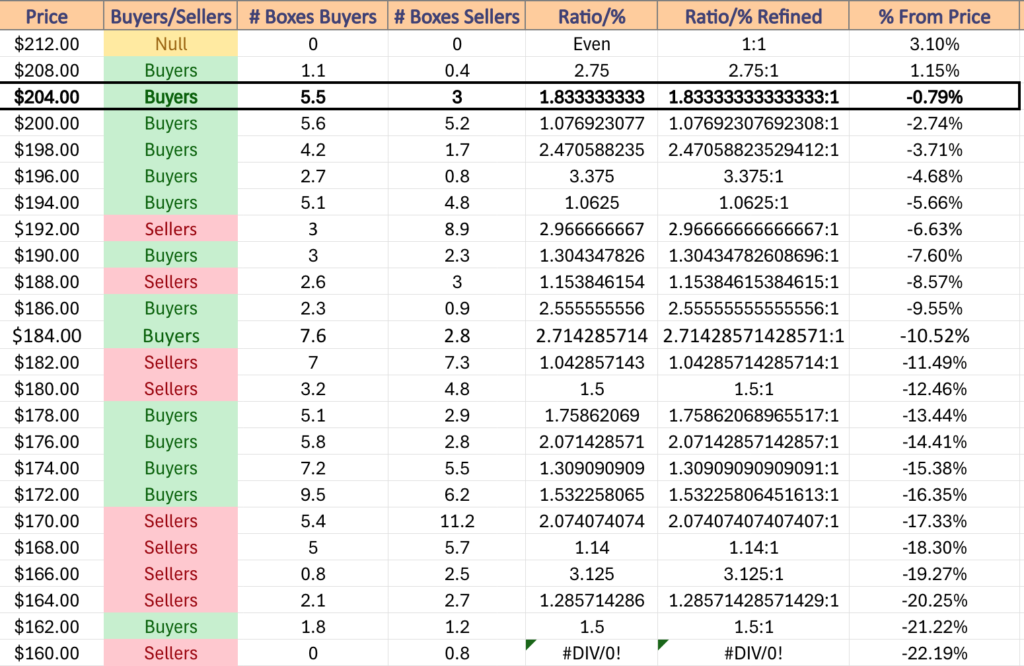
IWM has support at the $204.97 (Volume Sentiment: Buyers, 1.83:1), $204.25 (Volume Sentiment: Buyers, 1.83:1), $202.89 (50 Day Moving Average, Volume Sentiment: Buyers, 1.08:1) & $201.78/share (Volume Sentiment: Buyers, 1.08:1) price levels, with resistance at the $205.73 (10 Day Moving Average, Volume Sentiment: Buyers, 1.83:1), $209.77 (Volume Sentiment: Buyers, 2.75:1), $209.88 (Volume Sentiment: Buyers, 2.75:1) & $211.88/share (52-Week High, Volume Sentiment: Buyers, 2.75:1) price levels.
DIA, the SPDR Dow Jones Industrial Average ETF fell -0.8% last week, which was set to be a steeper decline until Friday’s +1.55% session saved their week.
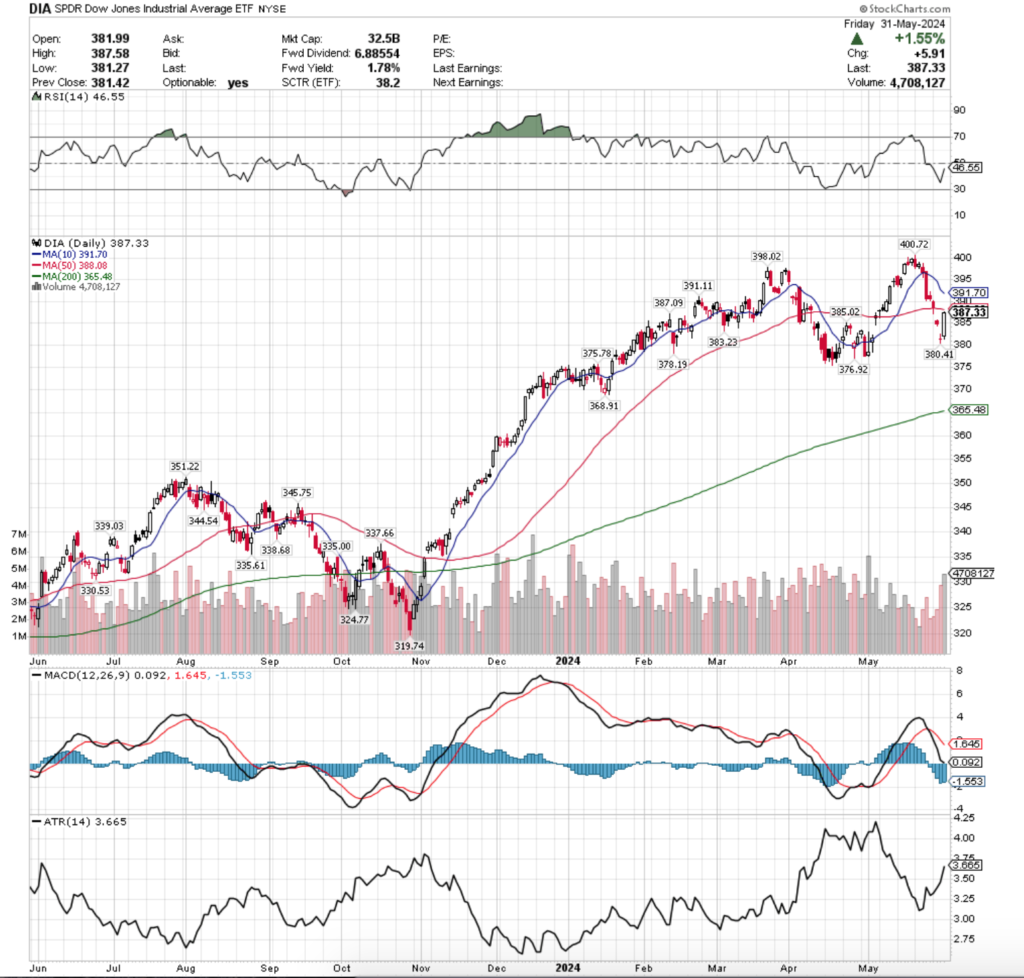
Their RSI is trending up towards the neutral 50 level & sits at 46.55, while their MACD is currently bearish following the declines of the past two weeks.
DIA’s volume was actually relatively high compared to the other index ETFs, coming in at only -3.28% below average compared to the year prior (3,426,550 vs. 3,542,864).
Much like IWM, DIA’s past week decoupled from the performance of the NVDA holding indexes SPY & QQQ & began to show signs of weakness.
Tuesday opened the week up on a gap down that straddled the 50 day moving average’s support, briefly breaking below it, before closing right in line with it, although on low volumes.
Wednesday saw investors showing more pessimism, as DIA gapped down again below the 50 DMA & closed the day as a spinning top candle, indicating that there is still a great deal of uncertainty among market participants.
Thursday may have been the most important day of the week for DIA though, where the second highest volume session of the week resulted in third consecutive gap down & a long-legged doji candle.
This is important for two reasons: 1) the long-legged doji is a signal of uncertainty among market participants overall & 2) because the open & close were so close to one another it can be viewed as market participants finding that price level to be “equilibrium” between bears & bulls.
If buyers & sellers are still uncertain of DIA’s proper value, but agree that it is near $380.41 currently then this suggests that there is further downside movement on the horizon.
While Friday’s wide-range session to the upside was on the highest volume of the week, it should not be interpreted as a bullish signal as it was unable to test the resistance of the 50 day moving average.
It was able to place their RSI a bit higher in the wake of the declines of the week & change prior, but given the angle of their 10 & 50 day moving averages there appears to be a bearish crossover on the cards for this coming week which would result in further downside movements.
DIA’s Average True Range continued to climb higher as the week was marked with heavy volatility & this should continue into the coming weeks.
This week will be time to watch how DIA’s price consolidates within the range of Friday’s candle, or if it continues its downwards slide.
With the 10 DMA closing in on the 50 DMA there should be some additional downside movement this week as a result of that impending crossover.
This is also beginning to look like a bearish head & shoulders set up is forming, which will be something to keep in the back of your mind as we navigate the next few weeks.
This is confirmed by the shapes of the 10 DMA, RSI & the MACD.
Fortunately for DIA their prices have been relatively rangebound in the past few months which has set them up with many support levels nearby.
As their 200 DMA inches higher it will also be important to keep an eye on the $368.91/share price level, which is currently the last support level before prices enter the range of the long bullish run up from November & December of 2023.
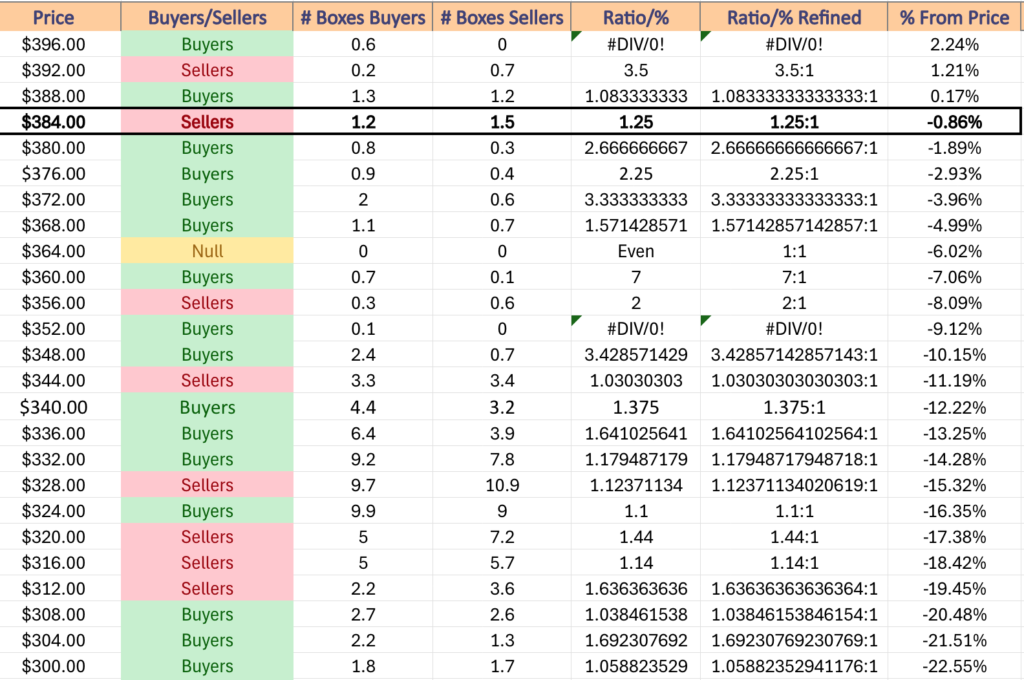
DIA has support at the $387.09 (Volume Sentiment: Sellers, 1.25:1), $385.02 (Volume Sentiment: Sellers, 1.25:1), $383.23 (Volume Sentiment: Buyers, 2.67:1) & $380.41/share (Volume Sentiment: Buyers, 2.67:1) price levels, with resistance at the $388.08 (50 Day Moving Average, Volume Sentiment: Buyers, 1.08:1), $391.11 (Volume Sentiment: Buyers, 1.08:1), $391.70 (10 Day Moving Average, Volume Sentiment: Buyers, 1.08:1) & $398.02/share (Volume Sentiment: Buyers, 0.6:0*) price levels.
The Week Ahead
Monday kicks the week off with S&P Flash U.S. Manufacturing PMI data at 9:45 am, followed by Construction Spending & ISM Manufacturing data at 10 am & Auto Sales data.
CIBC & Science Applications are scheduled to report earnings before Monday’s opening bell, with GitLab due to report after the session’s close.
Factory Orders & Job Openings data are announced at 10 am on Tuesday.
Tuesday opens up with Bath & Body Works, Core & Main, Designer Brands, Donaldson Company & Ferguson reporting earnings before the bell, with CrowdStrike, Guidewire Software, Hewlett Packard Enterprise, PVH, Sportman’s Warehouse, Stitch Fix & Verint Systems due to report after the session’s close.
Wednesday begins with ADP employment data at 8:15 am, U.S. Productivity (final revision) & U.S. Trade Deficit data at 8:30 am, S&P Flash U.S. Services PMI at 9:45 am & ISM Services data at 10 am.
Brown-Forman, Campbell Soup, Dollar Tree, Hibbett, Ollie’s Bargain Outlet, REV Group, Thor Industries & United Natural Foods are all due to report earnings before Wednesday’s opening bell, with Lululemon Athletica, ChargePoint, Couchbase, Five Below, Greif, Semtech, Smartsheet, Sprinklr & Victoria’s Secret scheduled to report earnings after the session’s close.
Initial Jobless Claims data is released at 8:30 am on Thursday.
Thursday’s earnings start off with ABM Industries, Big Lots, Ciena, G-III Apparel, J.M. Smucker, Nio & The Toro Company before the opening bell, with Argan, Braze, DocuSign, Mission Produce, Samsara, Vail Resorts & Zumiez reporting earnings after the closing bell.
Friday winds the week down with U.S. Employment Report, U.S. Unemployment Rate, U.S. Hourly Wages & Hourly Wages Year-over-Year data at 8:30 am, followed by Wholesale Inventories at 10 am & Consumer Credit at 3pm & there are no noteworthy earnings reports scheduled.
See you back here next week!
*** I DO NOT OWN SHARES OR OPTIONS CONTRACT POSITIONS IN SPY, QQQ, IWM OR DIA AT THE TIME OF PUBLISHING THIS ARTICLE ***