SPY, the SPDR S&P 500 ETF declined -0.46% for the week, while the VIX closed the week at 20.62, indicating an implied one day move of +/-1.3%, and a one month implied move of +/-5.96%.
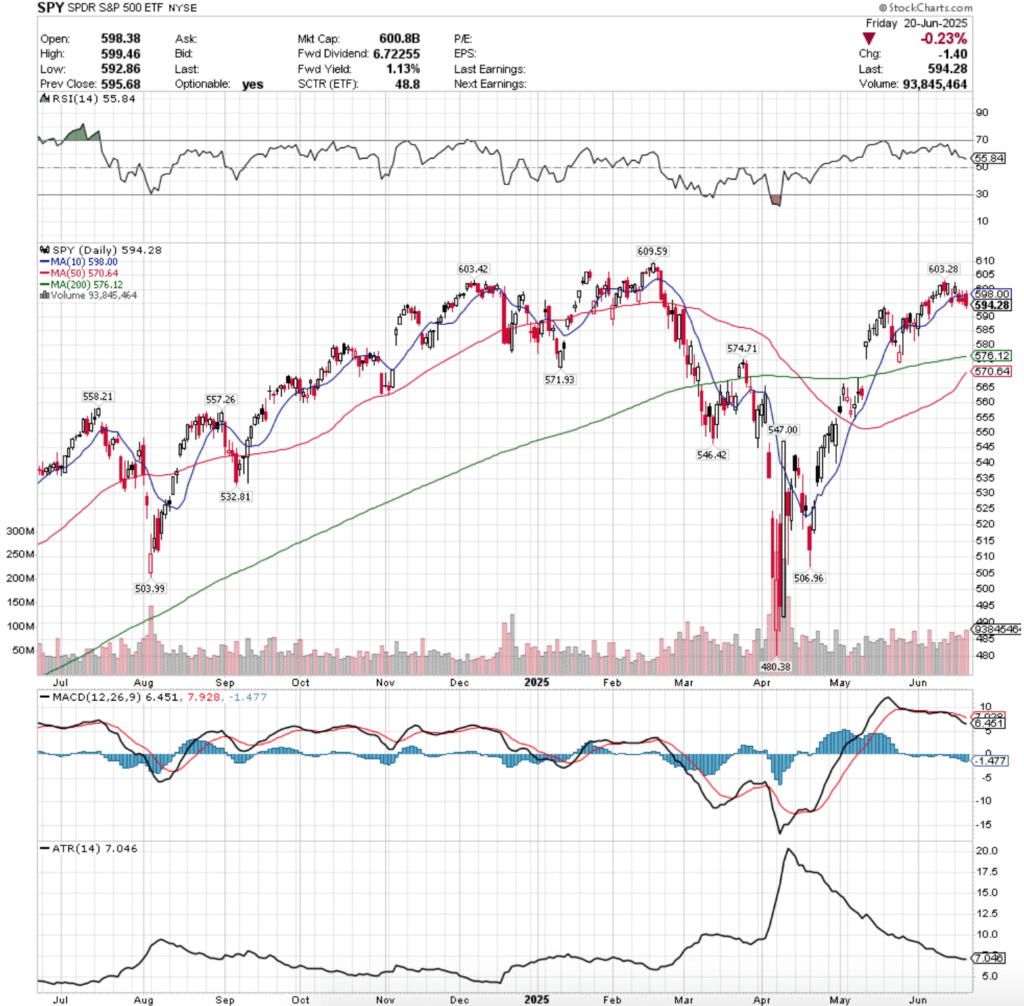
Their RSI is declining towards the neutral 50-mark & sits current at 55.84, while their MACD is bearish, with the histogram implying that there may be more declines on the near-term horizon.
Volumes were +42.48% higher than the prior year’s average levels (83,212,500 vs. 58,401,952), which is cause for concern given that aside from Monday’s gap up open that caused an advance, the entire holiday week was declining with lower shadows indicating that there is more Seller pressure on the horizon.
Monday the week began on the only advancing session, which is of note due to the rest of the week resulting in declines & it was the third highest volume of the four sessions.
While the week opened on a gap up, the lack of participation was disappointing from a sustainability perspective.
Tuesday the cracks became exposed, opening on a gap down that was unable to break above $599.98/share & ended up breaking down though the support of the 10 day moving average on higher volume than Monday.
Wednesday things got even fisher, as the session produced lower highs & lower lows, forming a bearish harami pattern with Tuesday’s candle on the week’s lowest volume heading into the holiday Thursday & the resistance of the 10 day moving average kept SPY subdued.
Friday’s candle opened on a gap higher, attempted to crack the $600/share level, but ultimately declined forming a bearish engulfing pattern with Wednesday’s session on the highest volume of the week.
The story of this week is going to be focused on Iran, PCE & Powell’s testimony to the House.
To the upside the $603.28-.42/level needs to be broken through to see any type of advances.
This will prove tricky though as like noted last week there is a bearish head & shoulders pattern emerging for SPY that’s shoulders are at those two prices.
There’s going to need to be major, consistent advancing volume in order for that to happen, which should be noted.
The head is the $609.59/share level, which is SPY’s all-time high, and will need a lot of participation to break down.
The consolidation case has SPY oscillating around the 10 day moving average, with perhaps a minor pump when the 50 day moving average crosses through the 200 DMA bullishly, but should that happen there is another, smaller head & shoulders that would form from mid-May’s gap up, leading to the following.
The declining case gets tricky, as there is limited support at SPY’s current price level nearby, which means that there is likely going to be a closing on said window that occurred in mid-May, and the long-term trend line will be tested as support.
In the best case scenario there SPY will oscillate around the 200 DMA awaiting an upside or downside catalyst, but the price level that the 200 DMA resides in is historically Seller oriented, which adds fuel to any declines.
$570.64/share is the current downside target level to watch, but that will change daily as it is the 50 day moving average (Per Friday’s close).
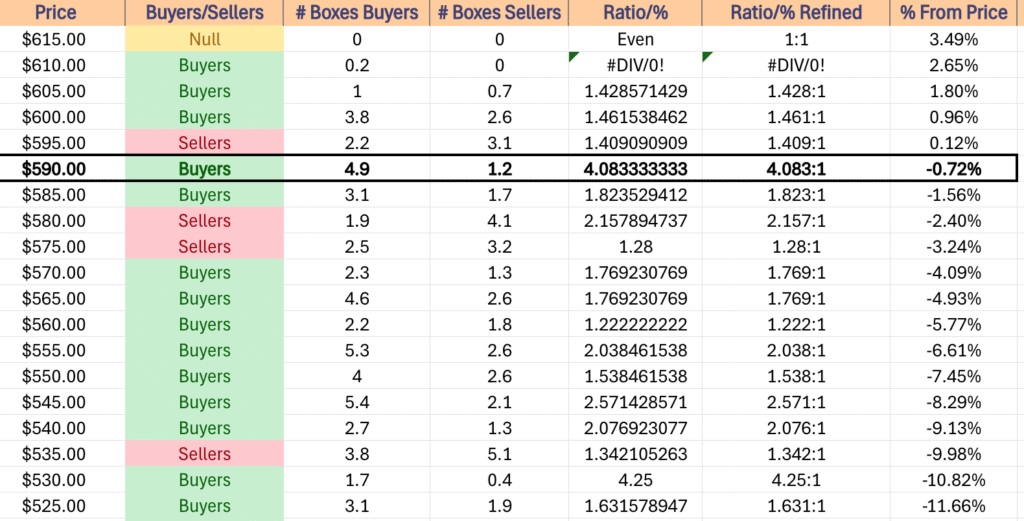
SPY has support at the $576.12 (200 Day Moving Average, Volume Sentiment: Sellers, 1.28:1), $574.71 (Volume Sentiment: Buyers, 1.77:1), $571.93 (Volume Sentiment: Buyers, 1.77:1) & $570.64/share (Volume Sentiment: Buyers, 1.77:1) price levels, with resistance at the $598.00 (Volume Sentiment: Sellers, 1.41:1), $603.28 (Volume Sentiment: Buyers, 1.46:1), $603.42 (Volume Sentiment: Buyers, 1.46:1) & $609.59/share (All-Time High, Volume Sentiment: Buyers, 1.43:1) price levels.
QQQ, the Invesco QQQ Trust ETF dipped -0.02% last week, and much like SPY it was mostly only that muted of a decline due to Monday’s gap up open.
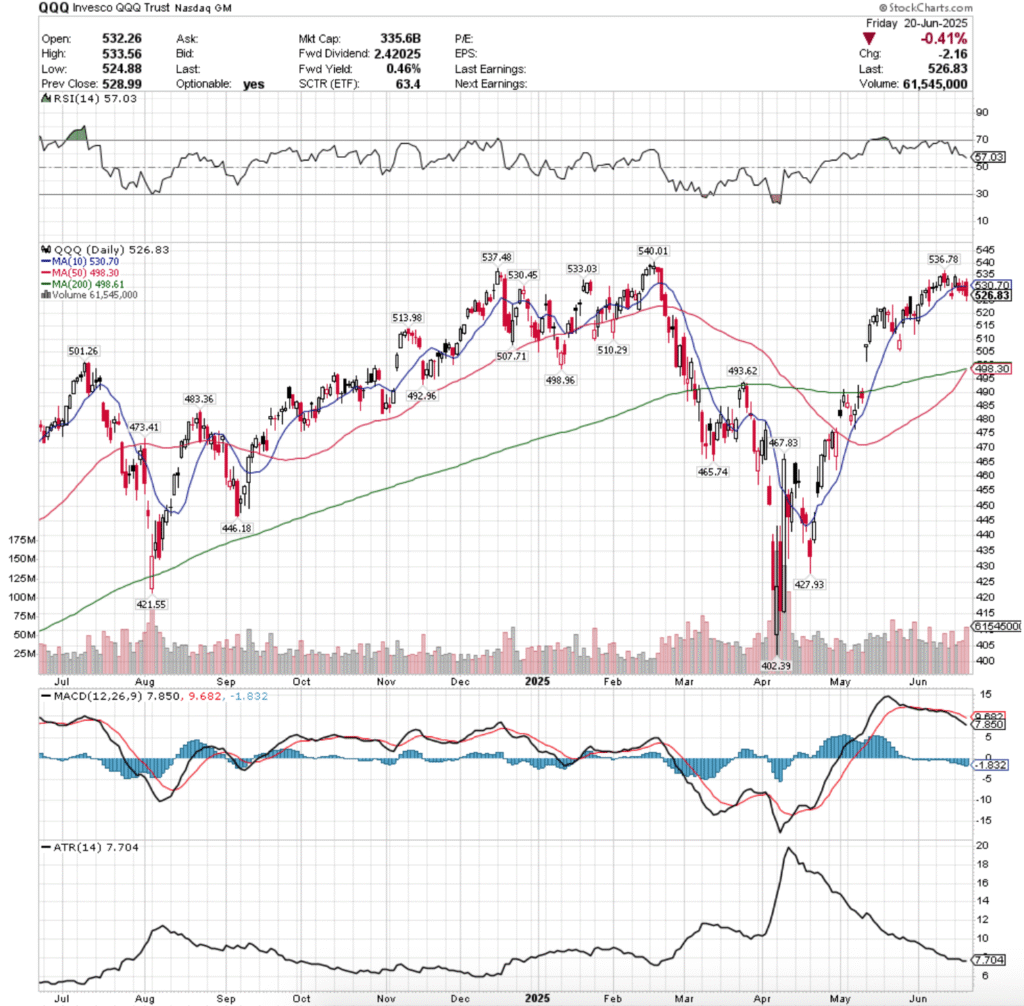
Their RSI is trending down towards the neutral 50 level at 57.03, while their MACD is bearish & looks to signal more trouble on the near-term horizon.
Volumes were +19.62% higher than the previous year’s average (46,355,000 vs. 38,750,598), which paints a bleaker picture when you factor in that the weekest session of the week was the only advancing one, signaling that there was quite a bit of risk being taken off of the table.
QQQ’s week looked an awful lot like SPY’s with only a few small differences.
Monday’s gap up session for QQQ was their weakest volume of the week, which was quite telling about the rest of the week’s performance.
Tuesday opened lower, and while there was briefly an attempt higher the Sellers came out in droves to force a breakdown of the 10 day moving average’s support.
Wednesday this theme continued on higher declining volume, as Sellers emerged more & more throughout the week & there was more of a risk-off sentiment emerging that looks poised to carry over into the new week.
Wednesday’s candle formed a bearish harami, which was bearishly engulfed by Friday’s candle on even higher volume, which is even more bleak.
Like SPY, the upside case is relying on there not being a bearish head & shoulders pattern emerging, where the shoulders are $536.78 & $537.48/share.
Those levels need to be broken through in order for there to be a run at QQQ’s all-time high of $540.01 (the head).
Consolidation case is also like SPY’s, with the only difference being that their 50 day moving average is forming a bullish golden cross today, which may provide a brief pump, but unlikely based on the volume trends of last week.
To the downside QQQ’s first two support levels have been historically Seller zones, which will lead it down into the window formed by mid-May’s gap up & will likely force re-test of the long-term trendline.
For this week the 200 Day moving average is a good place to look from a downside perspective, as the $498-500/share is going to be a pivotal support level.
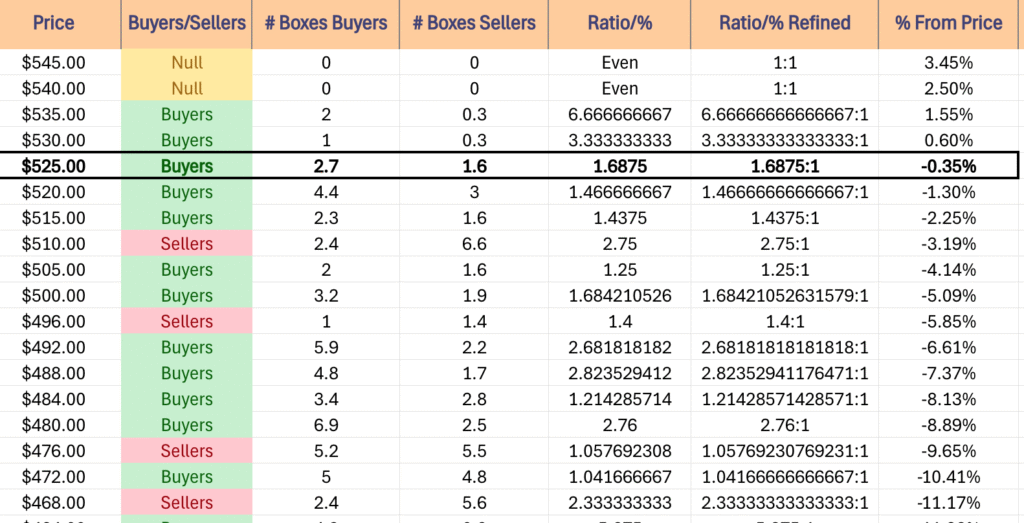
QQQ has support at the $513.98 (Volume Sentiment: Sellers, 2.75:1), $510.29 (Volume Sentiment: Sellers, 2.75:1), $507.71 (Volume Sentiment: Buyers, 1.25:1) & $501.26/share (Volume Sentiment: Buyers, 1.68:1) price levels, with resistance at the $530.45 (Volume Sentiment: Buyers, 3.33:1), $530.70 (Volume Sentiment: Buyers, 3.33:1), $533.03 (Volume Sentiment: Buyers, 3.33:1) & $536.78/share (Volume Sentiment: Buyers, 6.67:1) price levels.
IWM, the iShares Russell 2000 ETF advanced +0.15% for the week, as there was a rotation into the small cap index after much of the past two months showed more people buying into its larger peers.
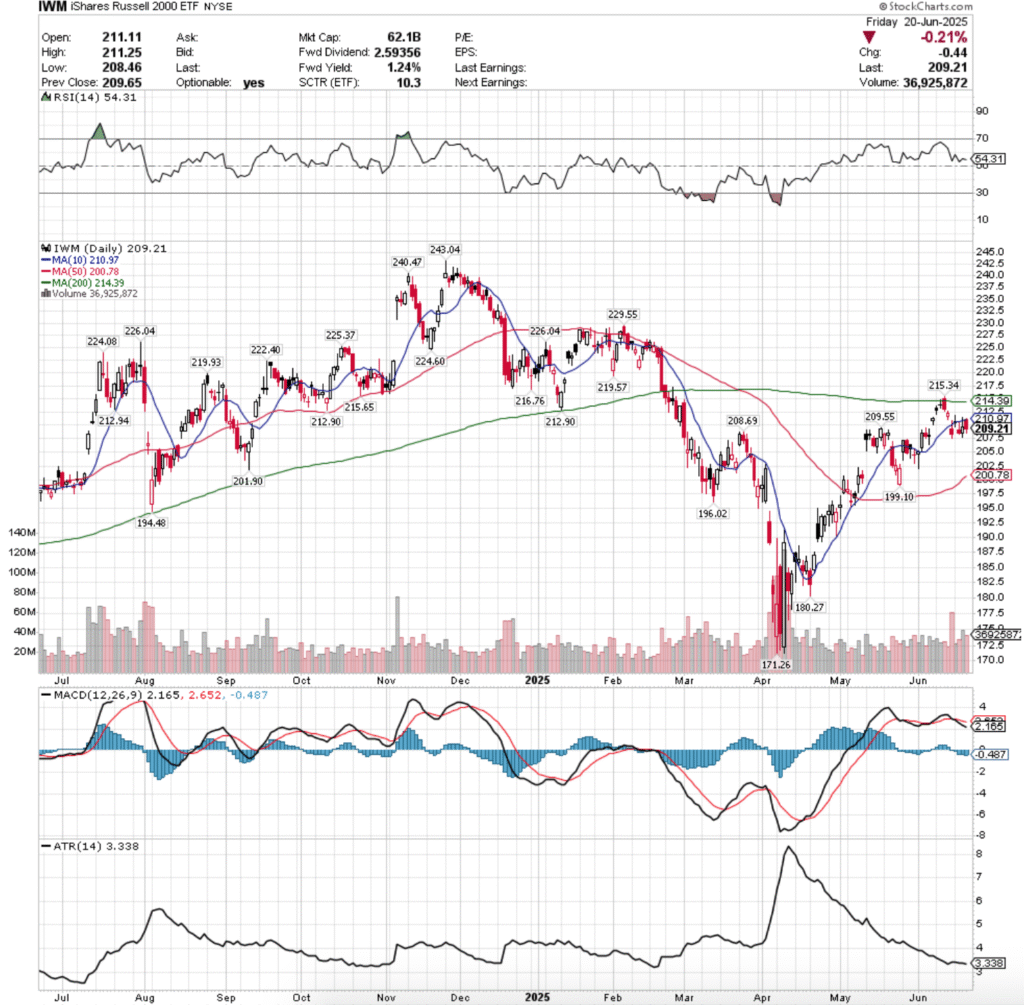
Their RSI is also declining back towards the neutral 50 level despite a stronger weekly performance than the aforementioned indexes & is currently at 54.31, while their MACD is bearish, and looks content on heading lower based on last week’s performance.
Volumes were +15.86% higher than the prior year’s average (35,410,000 vs. 30,562,351), but while Wednesday’s advancing volume led the pack in terms of strongest performing day, Friday’s risk-off move signaled that there is still quite a bit of uncertainty out there among market participants.
IWM saw a different type of week, bucking the trend of the major indexes declining for the week.
Monday opened on a gap up, and resulted ina high wave doji candle that closed in-line with the 10 day moving average, indicating that there was a strong tie to price & the short-term trendline & despite the wide trading range of the day the session produecd the lowest volume of the week.
Tuesday opened on a gap lower, attempted a run up to the resistance of the 10 day moving average, but promptly fell & resulted in a declining session.
Wednesday was the crown jewel of IWM’s week, as the session resulted in the week’s highest volume & a bullish engulfing candle, but there was a problem.
The 10 day moving average’s resistance held strong & to the downside market participants were willing to test the $207.50/share level, indicating that there was some pent up downside appetite that we had not been seeing previously.
Friday left a sour taste for IWM’s week, when the small cap index opened on a gap up in-line with the 10 day moving average, only to progress lower throughout the session & close -0.21% on the week’s second highest volume.
Risk-off into the weekend was the theme, and profits were taken to safety.
The coming week will likely hinge greatly on the other major indexes’ performances, but to the upside the $212.90/share level will be a target that needs to be overcome, as there are two resistance touch-points there.
After that the 200 day moving average comes into view, as the price has not been above the long-term trendline since February of 2025.
Consolidation looks much like SPY & QQQ’s short-term bearish head & shoulders formation forming from May’s gap up session.
To the downside the main place to keep an eye on is the 50 day moving average, as it is the gatekeeper to a Seller dominated price zone.
If it doesn’t hold up as support there is likely to be a run at the 52-week low given the unfilled gap from mid-April in the $187.50-190 range.
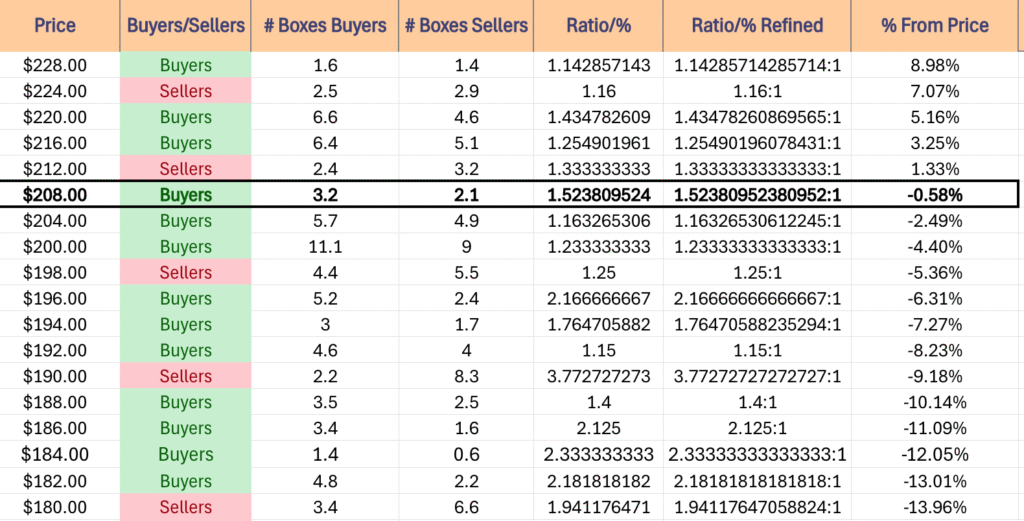
IWM has support at the $208.69 (Volume Sentiment: Buyers, 1.52:1), $201.90 (Volume Sentiment: Buyers, 1.23:1), $200.78 (50 Day Moving Average, Volume Sentiment: Buyers, 1.23:1) & $199.10/share (Volume Sentiment: Sellers, 1.25:1) price levels, with resistance at the $209.55 (Volume Sentiment: Buyers, 1.52:1), $210.97 (10 Day Moving Average, Volume Sentiment: Buyers, 1.52:1), $212.90 (2 Touch-Points, Volume Sentiment: Sellers, 1.33:1) & $212.94/share (Volume Sentiment: Sellers, 1.33:1) price levels.
DIA, the SPDR Dow Jones Industrial Average ETF fell -0.25%, breaking just below its long-term trendline to close out the week, which will lead into an interesting new week.
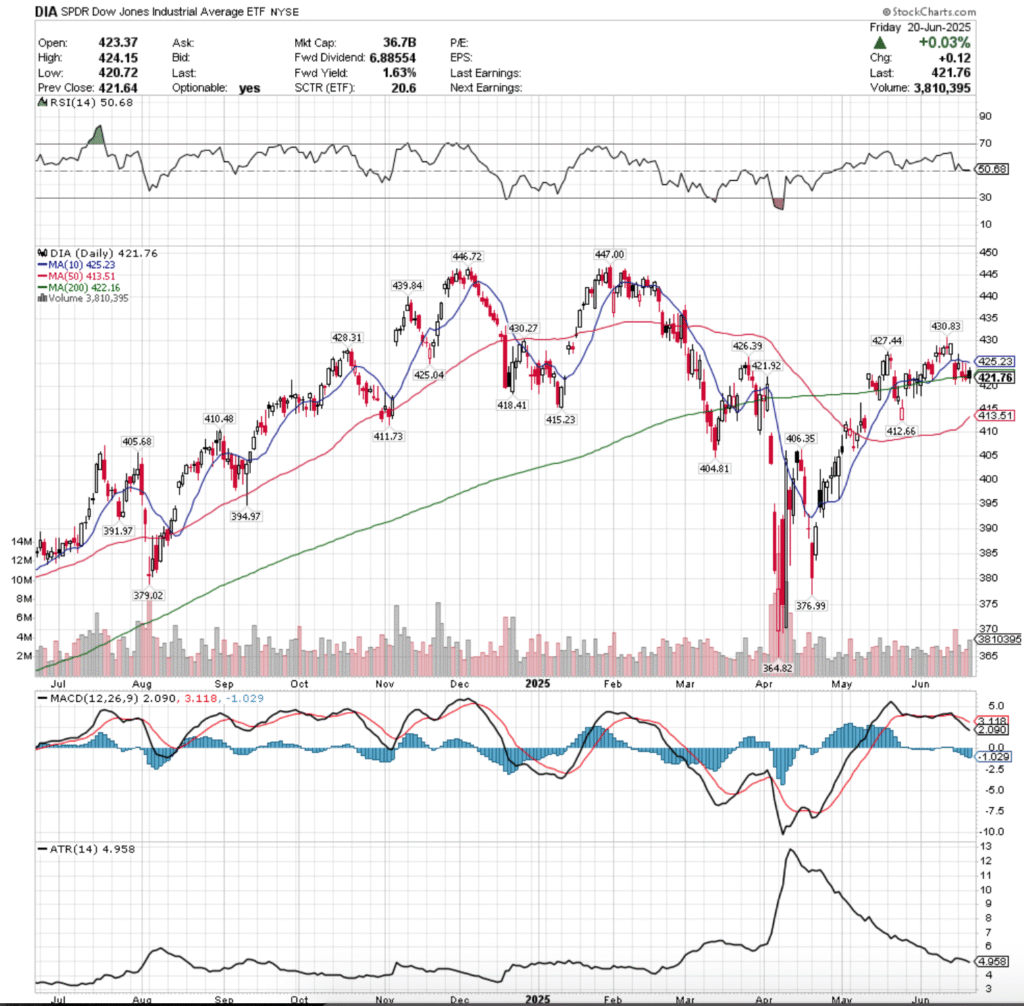
Their RSI is flat at 50.68, straddling the neutral 50-level, while their MACD is bearish & stretching lower indicating that there is likely more short-term pain to come.
Volumes were -4.14% below the prior year’s average levels (3,057,500 vs. 3,189,681), which paints an interesting picture given Friday had the best volume of the week on an advancing session, but given that it closed below both its opening price & the 200 DMA paints a gloomy picture.
DIA’s week kicked off on a gap up open on the second highest volume of the week, which was able to temporarily break above the 10 day moving average’s resistance, but the proved to be short-lived and profit taking forced the session to close near the previous Friday’s open.
Tuesday opened on a gap down, but showed mixed signals as the lowest volume session of the week tested the resistance of the 10 day moving average but was rejected, before the 200 day moving average was tested & the long-term trendline showed signs of fatigue.
Wednesday was more of the same, but the real body of the session’s candle stayed on the lower end of the daily range, on slightly higher volume, indicating that there was a bit of hesitancy & risk aversion in the air.
Friday opened on a gap higher, but the week’s highest volume session resulted in a lot of profit-taking that drove prices to break down though the 200 day moving average temporarily, before closing lower than the day’s open just below the 200 day moving average.
Looking at their 10 day moving average vs. the 200 DMA we appear to have more pain on the horizon for DIA, but the upside case revolves heavily around breaking above the 200 & 10 day moving averages first, which appears unlikely without a massive shift in advancing volume.
Should we see that, the $430.83 is the high water target in the near-term.
The consolidation case also has the making of a bearish head & shoulders pattern emerging, with declines likely to come in the wake of the 10 DMA death crossing through the 200 DMA, but until then DIA will likely oscillate around & in between the two trendlines.
In the event of decline DIA has a bit of a headwind on the horizon, as once their first support levels is broken through the next 3+ are all in Seller dominated price zones, which will potentially lead to a re-test of the $410.48 or $406.35/share level, depending on where it manages to find footing.
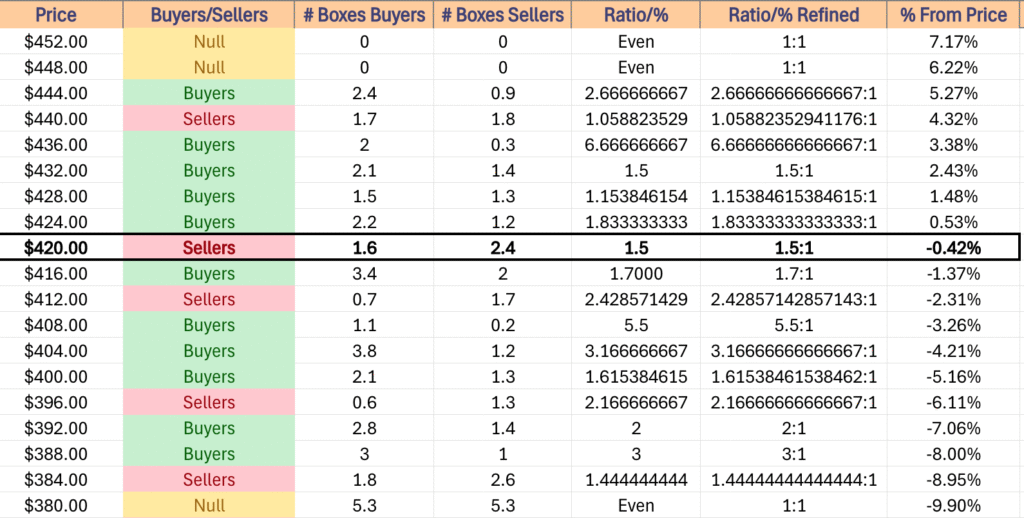
DIA has support at the $418.41 (Volume Sentiment: Buyers, 1.7:1), $415.23 (Volume Sentiment: Sellers, 2.43:1), $413.51 (50 Day Moving Average, Volume Sentiment: Sellers, 2.43:1) & $412.66/share (Volume Sentiment: Sellers, 2.43:1) price levels, with resistance at the $421.92 (Volume Sentiment: Sellers, 1.5:1), $422.16 (200 Day Moving Average, Volume Sentiment: Sellers, 1.5:1), $425.04 (Volume Sentiment: Buyers, 1.83:1) & $425.23/share (10 Day Moving Average, Volume Sentiment: Buyers, 1.83:1) price levels.
The Week Ahead
Monday the week kicks off with S&P Flash U.S. Services PMI & S&P Flash U.S. Manufacturing PMI data at 9:45 am, followed by Existing Home Sales data at 10 am.
Commercial Metals & Fact set report earnings before Monday’s opening bell, followed by KB Home after the session’s close.
S&P Case-Shiller Home Price Index (20 Cities) data comes out Tuesday morning at 9 am, before Fed President Hammack speaks at 9:15 am, Consumer Confidence data is released at 10 am, and Fed Chair Powell testifies to the House Financial Service Committee at 10 am as well.
Tuesday morning begins with earnings calls from Carnival & TD Synnex, before FedEx, AeroVironment, BlackBerry & Worthington Enterprises report after the closing bell.
Wednesday morning begins with New Home Sales data at 10 am.
General Mills, Paychex & Winnebago report earnings before Wednesday’s opening bell, followed by Micron Technology, H.B. Fuller, Jefferies, MillerKnoll, Steel case & Worthington Steel after the session closes.
Advanced U.S. Trade Balance In Goods, Advanced Retail Inventories, Advanced Wholesale Inventories, Initial Jobless Claims, Durable-Goods Orders, Core Durable-Goods Orders & GDP (Second Revision) data all come out Thursday at 8:30 am, before Fed President Hammack speaks at 9 am & Pending Home Sales data at 10 am.
Acuity, Lindsay Corp., McCormick & Walgreens Boots Alliance report earnings before Thursday morning’s opening bell, before Nike & Concentrix report after the session’s closing bell.
Friday the week winds down with Personal Income, Personal Spending, PCE Index, PCE Year-over-Year, Core PCE Index & Core PCE Index (Year-over-Year) at 8:30 am before Consumer Sentiment (Final) data comes out at 10 am.
Apogee Enterprises reports earnings on Friday morning.
See you back here next week!
*** I DO NOT OWN SHARES OR OPTIONS CONTRACT POSITIONS IN SPY, QQQ, IWM OR DIA AT THE TIME OF PUBLISHING THIS ARTICLE ***