SPY, the SPDR S&P 500 ETF tread water this week while the weak volume trend continued for an eighth consecutive week, dipping -0.05%, while the VIX closed the week at 12.44, indicating a one day implied move of +/-0.78% & a one month implied move of +/-3.6%.
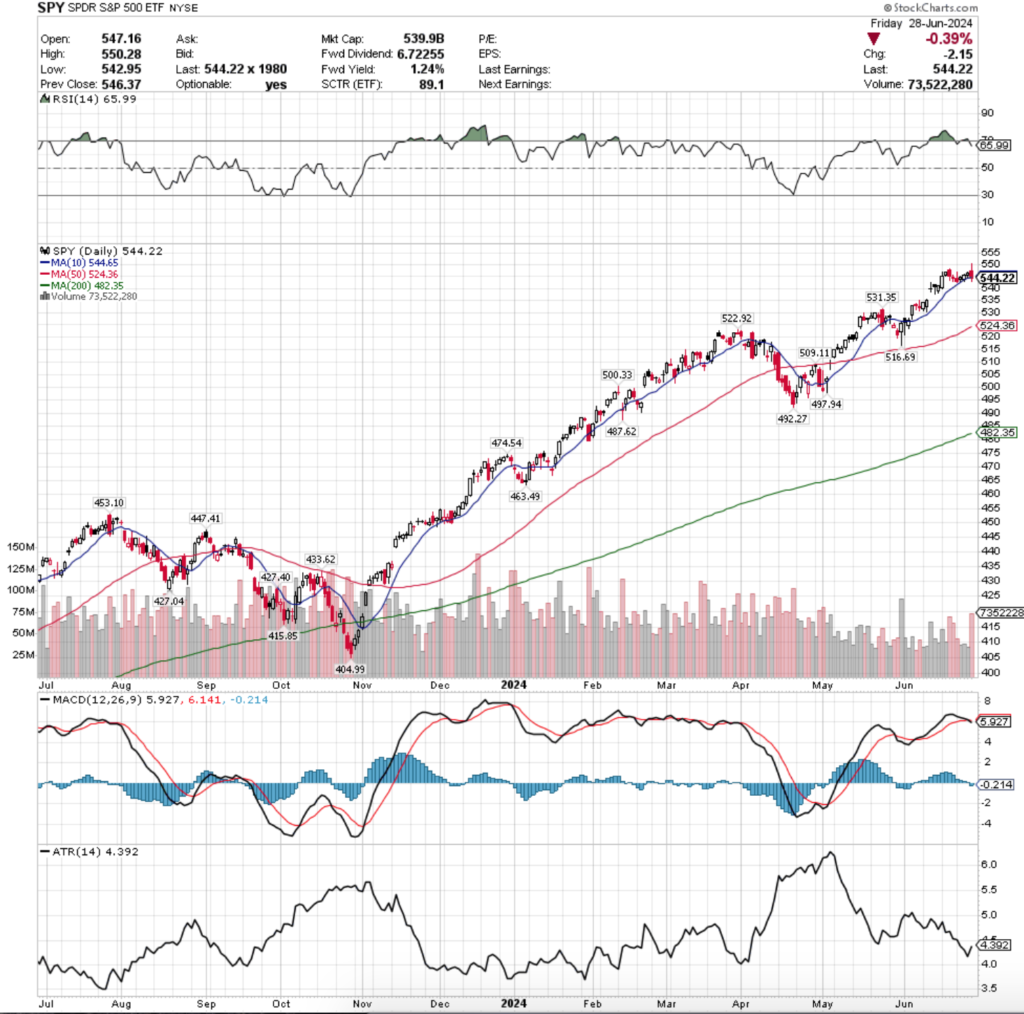
Their RSI is currently at 65.99 & trending back out of overbought territory due to Friday’s declining session after having spent a couple of weeks above 70, while their MACD has crossed over bearishly, indicating near-term declines are on the horizon.
Volumes were -36.35% below average compared to the prior year (46,059,666 vs. 72,363,608), indicating a severe hesitancy on the part of market participants & signaling flashes of fear.
This is compounded by the fact that for eight straight weeks there have been severely low volumes, which amounts to ~17% of the annualized average volume calculation, indicating that it has been dragged down even lower than it appears as higher volume sessions from last year have been dropped off from close to one fifth of the calculation.
Last week’s volume was low, but looked more acceptable due to the shortened trading week being reduced by 20% by day count, but another troubling element to the recent volume picture is that most of the higher volume days of June were declining sessions.
In fact, the last time there was an advancing session that had more volume than the highest volume sessions of June (which were declining sessions) came on May 31,2024.
Couple this with the narrow daily trading ranges shown by the real bodies & shadows of the candlesticks for the month of June , particularly towards the end of the month & it begins to paint a not so rosy picture for near-term stock performance.
Monday opened the week up with a negative note, as the session opened close to Friday’s close, tested a bit higher as shown by the candle’s upper shadow & then ultimately dropped down to test the support of the 10 day moving average, but managed to close the day above it.
Monday’s volume was also the second highest of the week, as the strongest volume sessions of the week came in the form of declining days.
The risk-averse theme continued into Tuesday, where an even lower volume day hugged the 10 DMA but resulted in a slight advance & the strength of the support level was maintained.
Wednesday opened right at the 10 DMA & was able to break out below it temporarily during the session, but by the end of the day bulls stepped back in to force a slight gain for the day, but between the low volume & the narrow price range of the day it did not inspire confidence in market participants.
Thursday was able to open near the close of Wednesday & stay above the 10 DMA.
However, Thursday’s session had the week’s lowest volume & narrowest trading range, setting the stage perfectly for Friday’s risk-off into the weekend move.
Friday set the tone for the coming week or two, as the day resulted in the week’s widest price daily price trading range on the week’s highest volume.
While there was a push to the upside to reach a new all-time high, all hopes quickly deflated after a move to the downside broke through the support of the 10 DMA & the session’s price also closed below it.
Friday’s candle bearishly engulfed Thursday’s, setting the stage for more cooling off in the next week(s).
SPY’s Average True Range began to advance late in the week due to the strength of Friday’s move & volume & it appears that it will continue to climb higher in the coming week or two as we see an increase in volatility.
This week will be a relatively quiet week on the economic data & earnings, however there will be a handful of Fed speakers, including Chairman Powell on Tuesday morning in Portugal.
With this in mind & the fact that there will be a half day of trading Wednesday & the market closed Thursday for July 4th all eyes should be on volumes this week, in particular looking at the relationship between how they stack up against recent full trading weeks’ volumes.
This week will feature ~30% less trading hours than usual, so while volumes should be expected to be lower than average, how much lower they are & in what direction the markets trade will be a strong tell about how the month of July is likely to go for SPY & the other major index ETFs.
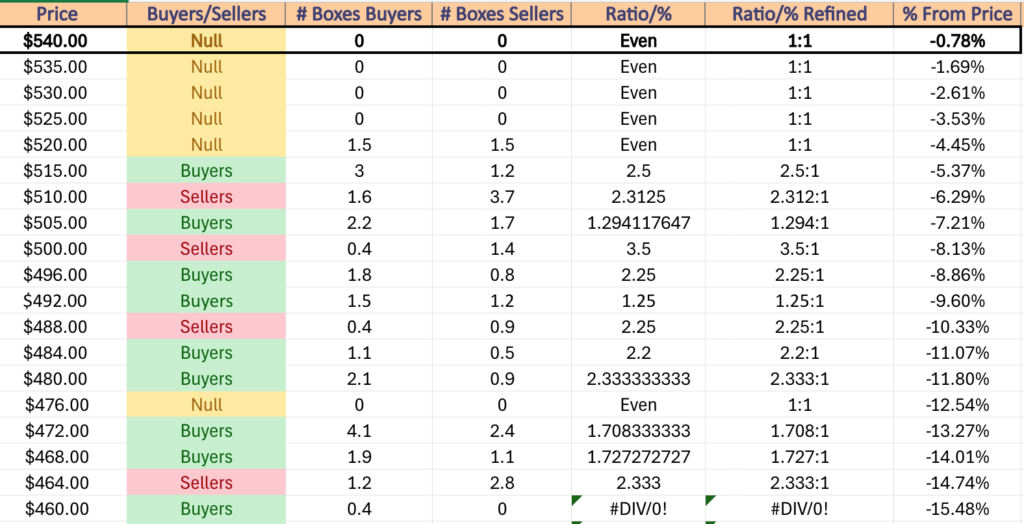
Additionally, keep an eye on how prices behave as they approach the $540/share mark for SPY, as that is the gateway to the most recent gap up.
While the window itself should serve as a form of support, once it begins to fill it will provide additional insight into whether SPY will consolidate in the near-term or if there will be a more aggressive decline from Friday’s close.
The 10 day moving average is applying downward price pressure now & if there is a movement through the gap of early June we will be keeping an eye on the nearest support levels (including the 50 day moving average) which have not really been tested much & have limited trading volume around them.
In the event prices do get close to the 50 DMA & or should they break below them, a head & shoulders pattern may be forming with the left shoulder being the end of March/early April.
In the event of that happening, it is more than likely not to be this week due to the shortened nature of it, but it is worth keeping in the back of your mind for the future.
SPY has support at the $531.35 (Volume Sentiment: NULL, 0:0*), $524.41 (50 Day Moving Average, Volume Sentiment: NULL, 0:0*), $522.92 (Volume Sentiment: NULL, 0:0*) & $516.69/share (Volume Sentiment: Buyers, 2.5:1) price levels, with resistance at the $544.65 (10 Day Moving Average, Volume Sentiment: NULL, 0:0*) & $550.28/share (All-Time High, Volume Sentiment: NULL, 0:0*) price level.
QQQ, the Invesco QQQ Trust ETF that tracks the NASDAQ 100 also was treading water with light volumes, closing -0.06% down for the week since last Friday’s close.
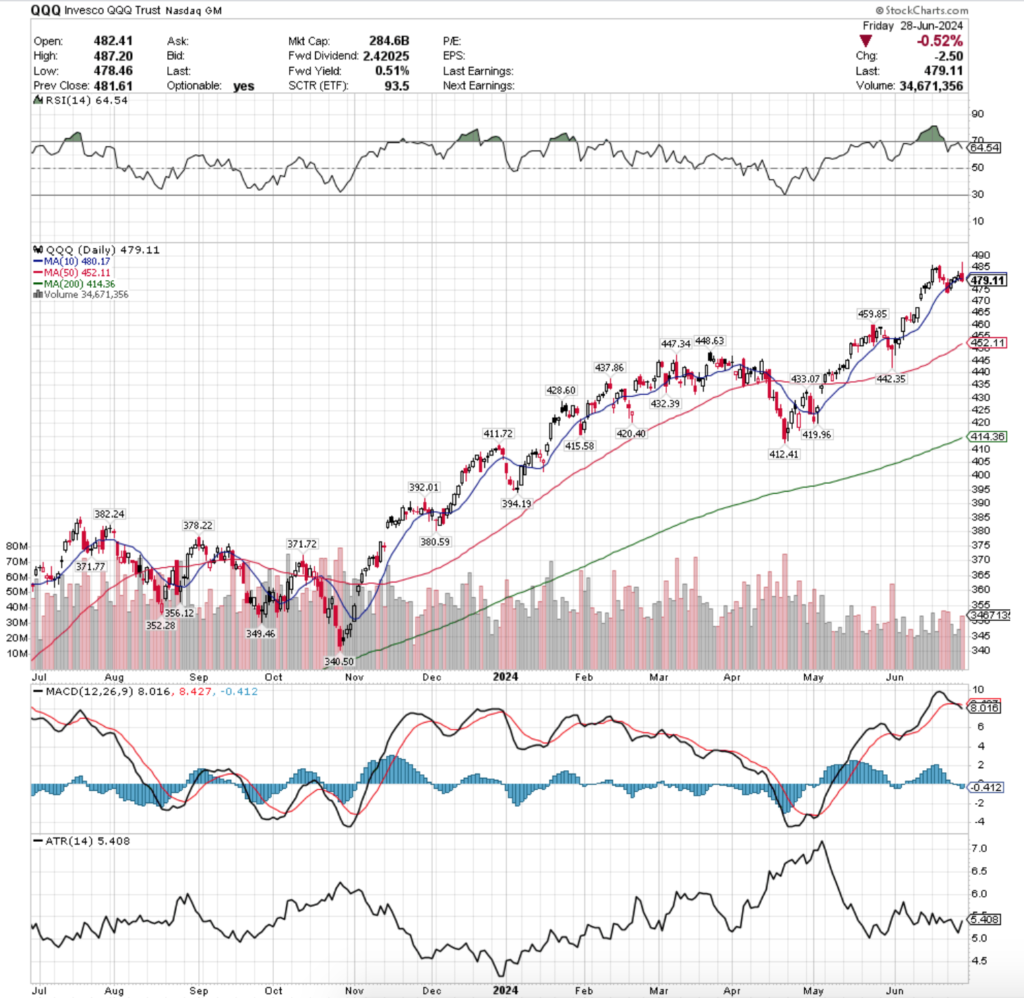
Their RSI is currently at 64.54, also after having spent a couple of weeks in overbought territory, while their MACD crossed over bearishly earlier in the week.
Volumes were spotted out by the tumbleweeds, down -33.45% below the prior year’s average (30,136,911 vs. 45,282,963), indicating that the Q2 rally that kicked off in late April has likely run out of steam as market participants have become tired & skeptical about gains continueing.
Unlike SPY, QQQ had the strongest volume of last week on Monday, which was a declining day though.
Monday opened on a gap down & while the bears were not in full control (as indicated by the upper shadow of the session’s candle) they stepped in & pushed prices down below the support of the 10 day moving average & the session was unable to recover to close above it.
The upper shadow did set the stage for the middle three days of the week to slightly advance in a similar manner to SPY, weakest volume sessions of the week & straddling the 10 day moving average’s support.
Tuesday opened below the 10 DMA, tested lower, before ultimately climbing to close above it.
Wednesday opened in-line with the 10 DMA & bumped higher in a narrow-range day that resembled a spinning top candle without much upper or lower shadow, indicating that there was a great deal of hesitancy & temporary complacency at its current price level.
Thursday also opened in line with the 10 day moving average’s support propping the open higher, temporarily broke below the support level confirming that the prior two day’s price action was not built on strong foundations & was able to push higher.
Friday was the final squeeze early in the session as prices did open to the upside & test higher (long upper shadow), but much like SPY the rug was pulled out from under QQQ as profits were taken following the uncertainty of Thursday night’s debate & as investors eyed this coming short week.
Friday’s close was below the 10 DMA, giving its price downward pressure now in the form of a falling resistance level.
Friday’s bearish engulfing candle was able to make QQQ’s Average True Range begin to advance again, which looks set to continue this week as volatility seems primed to increase in the coming weeks.
Given that QQQ & SPY have both been the recipients of the good fortune that comes from having NVDA as a component recently the items to keep an eye out for this week area the same between the two indexes.
In QQQ’s case one additional thing to note is that their RSI appears to be in the midst of a bearish head & shoulders/just completed its right shoulder.
Watching their RSI as they decline will be important, especially as the approach the neutral mark of 50 midway through the oscillator as it may help give insight into magnitude of near-term price movements.
In terms of the head & shoulders pattern that is emerging on SPY’s chart, QQQ’s is a little different, but is still certainly in play, especially if the support of the early-June gap is broken & the 50 DMA is unable to support price action.
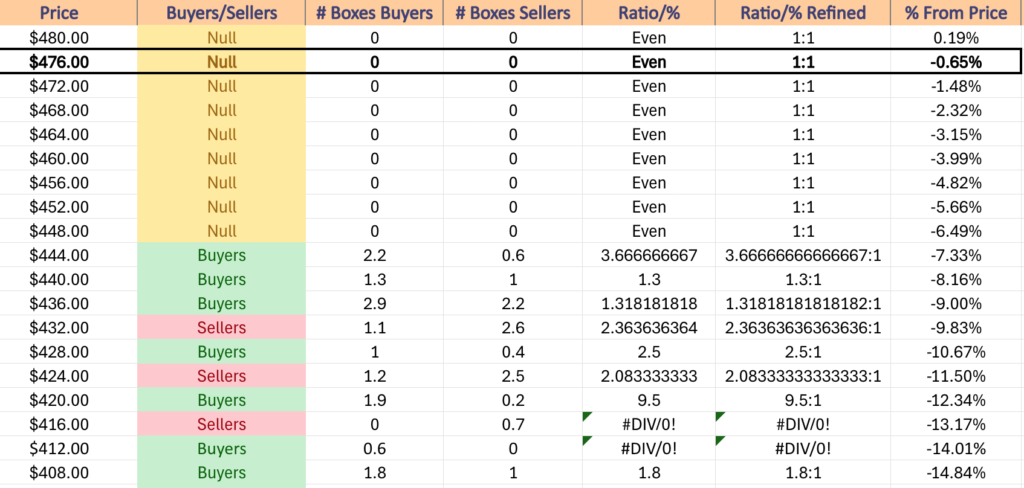
Fortunately for QQQ, their ascent had more consolidations, leading them to have more support levels that may help soothe any blows that their price takes better than SPY, whose more rapid ascent leaves it with less support at local levels.
QQQ has support at the $459.85 (Volume Sentiment: NULL, 0:0*), $452.17 (50 Day Moving Average, Volume Sentiment: NULL, 0:0*), $448.63 (50 Day Moving Average, Volume Sentiment: NULL, 0:0*) & $447.34/share (Volume Sentiment: Buyers, 3.67:1) price levels, with resistance at the $480.17 (10 Day Moving Average, Volume Sentiment: NULL, 0:0*) & $487.20/share (All-Time High, Volume Sentiment: NULL, 0:0*) price level.
IWM, the iShares Russell 2000 ETF was the lone bright spot of the major four index ETFs this week, advancing +1.27%, but also on lackluster volume.
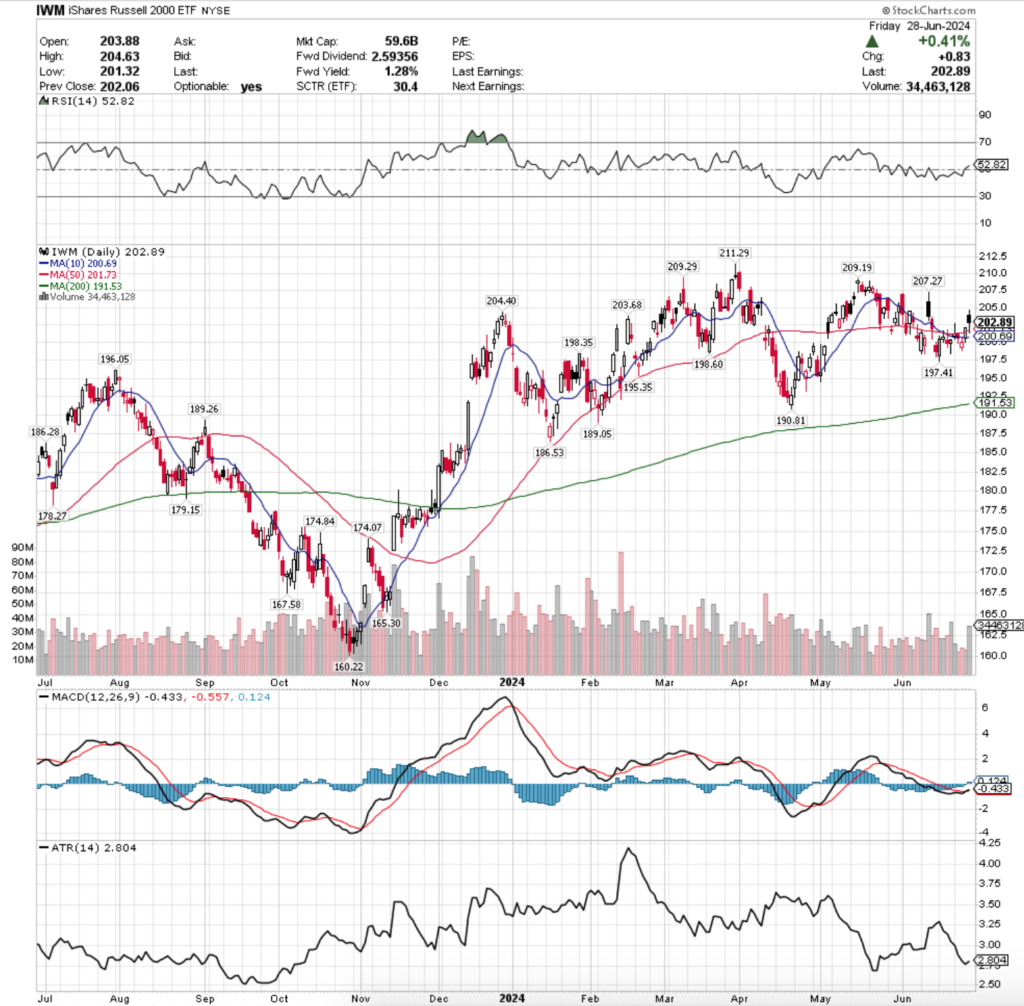
Their RSI just crossed above the neutral level of 50 & sits at 52.82, while their MACD crossed over bullishly on Thursday after IWM was able to break above the resistance of the 10 & 50 day moving averages & close above them.
Volumes were -34.18% below average compared to the previous year (22,021,443 vs. 33,455,951), signaling that the gains of the week were not necessarily on true strength & should be viewed with a skeptical eye.
While it didn’t come out of an uptrend, but rather more of a consolidation range Monday’s candle can’t be viewed as a shooting star, but it certainly resembled one & looked as though IWM’s week was going to start off on a weak foot.
However, due to how it opened in between the support of the 10 day moving average & the resistance of the 50 DMA & tested much higher, it implied that there was a small bit of appetite to the upside for IWM.
Tuesday opened roughly in line with Monday’s close & the 50 day moving average, but prices were forced lower throughout the session & wound up settling in a cradle atop the 10 DMA’s support & below the 50 DMA’s resistance on this declining session.
Wednesday opened on a gap down indicating that there may be further weakness in the cards for IWM, but despite some testing lower the session closed higher than it opened, but still for a declining session.
Wednesday was unable to break above the resistance of the 10 DMA, setting up Thursday to open in line with it.
The session tested lower Thursday, before ultimately making a bullish run up to close above both the 10 & 50 day moving averages.
Friday ended the week on a bit of an ominous note though, as prices opened on a high gap up, signaled that there was some upside appetite still based on the upper shadow, but then fell apart as the day progressed & profits began to be taken in droves, as indicated by it being the strongest volume session of the week.
It is worth noting that Friday’s test to the downside was able to break the support of the 50 DMA, indicating that there is not a lot of strong sentiment there as a support level.
IWM’s Average True Range is still increasing due to the volatility of Friday’s session, and should continue to in the coming weeks.
As we note almost weekly, IWM moves far more in a manner of oscillating around a median price level when compared to how SPY & QQQ move, giving them more support levels nearby for the near-term.
If IWM’s 10 day moving average breaks down as a support level, it will be imperative to keep an eye on the gaps from early May & early June to see if prices begin to fill into those levels.
Their highs are still set up in a descending manner & given the signs that the other major index ETFs are flashing about a near-term consolidation/decline IWM can be expected to follow suit in the coming weeks.
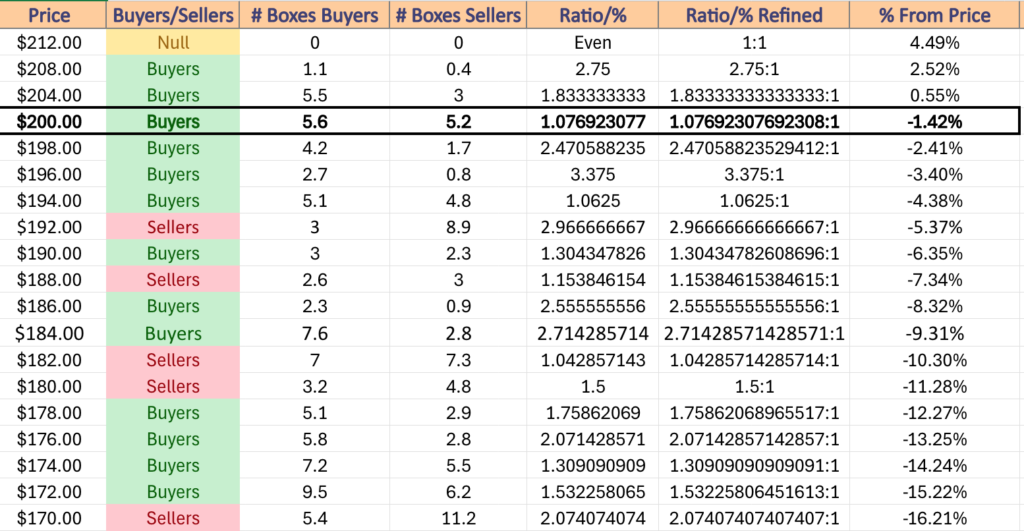
IWM has support at the $201.73 (50 Day Moving Average, Volume Sentiment: Buyers, 1.08:1), $200.69 (10 Day Moving Average, Volume Sentiment: Buyers, 1.08:1), $198.60 (Volume Sentiment: Buyers, 2.47:1) & $198.35/share (Volume Sentiment: Buyers, 2.47:1) price levels, with resistance at the $203.68 (Volume Sentiment: Buyers, 1.08:1), $204.40 (Volume Sentiment: Buyers, 1.83:1), $207.27 (Volume Sentiment: Buyers, 1.83:1) & $209.19/share (Volume Sentiment: Buyers, 2.75:1) price level.
DIA, the SPDR Dow Jones Industrial Average ETF matched SPY in terms of weekly performance, chalking up a -0.05% decline for the week.
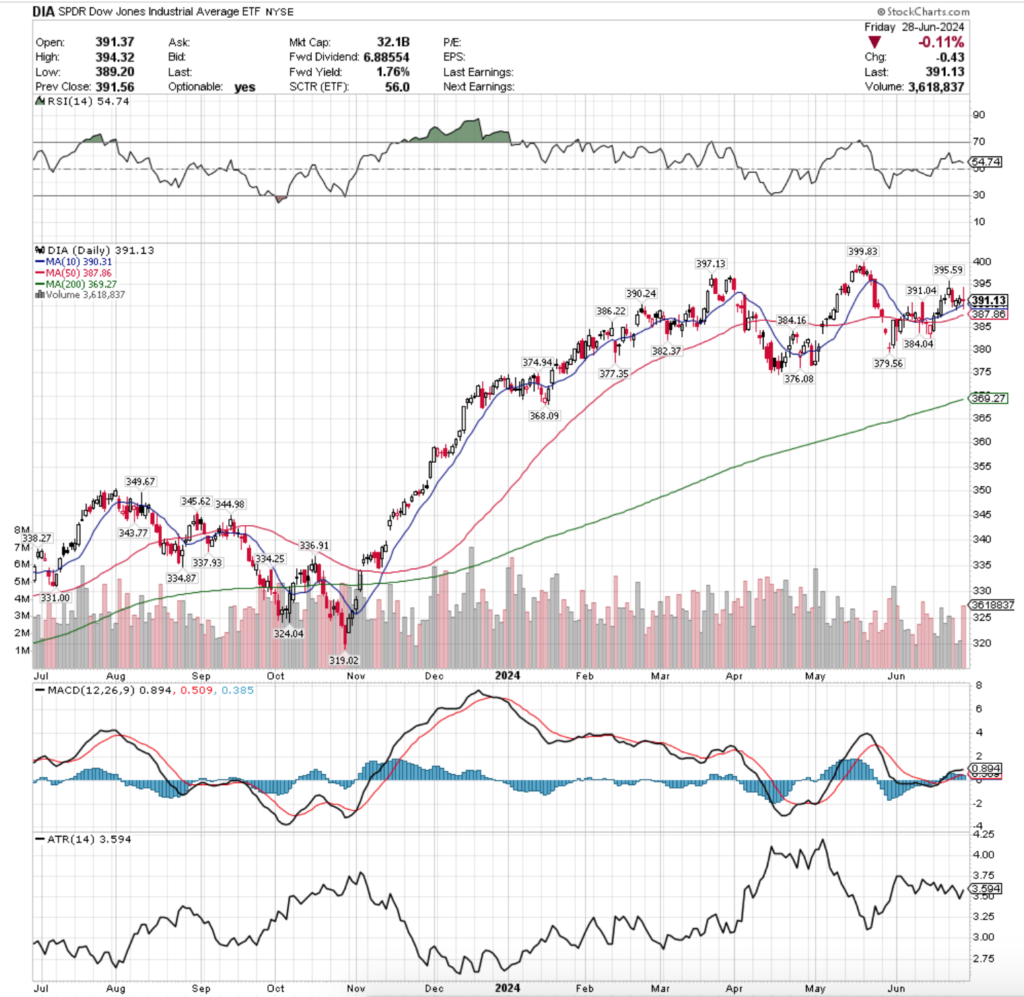
Their RSI is trending back towards neutral & sits at 54.74, while their MACD is still bullish but has flattened out in the wake of the consolidation of the past week.
Volumes were the most bountiful of the major four index ETFs, only falling -27.53% below the average volume for the previous year (2,527,411 vs. 3,487,726),
Monday kicked DIA’s week off on what appeared to be a strong note, where prices advanced & volumes were on the higher end of what we’ve been experiencing over the past eight weeks.
However the tall upper shadow on the candle indicates that there was not much strength for the bulls & that there was a great deal of selling pressure coming from the bears.
Tuesday this was confirmed, when on similar volumes DIA declined after opening near the middle of Monday’s price range & making a break towards the 10 day moving average’s support.
Wednesday saw DIA open to the downside, test the 10 DMA’s support & briefly break through it, only to rally & ultimately close higher.
It should be noted that this occurred on the weakest volume of the week, indicating that there was little strength behind the move & leaving market participants on edge & without a sense of confidence in the price movement.
Thursday was similar to Wednesday, DIA opened midway through the previous day’s range & tested the 10 DMA’s support again but was able to recover & close higher on slightly higher volume than Wednesday’s session.
The upper shadow on Thursday’s candle shows that there was a bit more appetite to go higher than Wednesday, but the low volumes continued to keep folks skeptical about future gains in the near-term.
Friday closed the week off on a long-legged doji, indicating severe uncertainty & a lack of confidence on the part of market participants, paired with the week’s highest volumes, indicating that there was a major profit taking & risk-off sentiment.
DIA was unable to break above the $395 mark on its upper shadow & did break down below the 10 DMA’s support, indicating that it is being viewed more weakly by investors.
The strength of the 10 & 50 day moving averages as support will play an important role for DIA in the next couple of weeks, especially as the increasing volatility of the past week has gotten their Average True Range perked up.
Should they break down, keep an eye out to see how the potential head & shoulders set up plays our for DIA using the $397.13 price level of March as the left shoulder & the $395.59/share mark of June as the left.
Should prices approach the $376.08 level there will be a need to analyze the possibility of a reversal at that level, given that that is an interior support level between the left shoulder & the head.
Should it be broken to the downside then the $374.94 & $368.09/share levels will be where attention must be focused in terms of support before a potential decline into the area of last year’s Q3 major price run up into 2024.
Adding complexity to the mix is that NVDA is not a DJIA component & so DIA has not benefitted by its aggressive price movements directly.
Should the semiconductor stocks all take a hit leading to SPY & QQQ to face aggressive declines, will DIA & IWM who have little to no exposure to these names be able to consolidate with minimal losses or will they be dragged down in a panic with the former two indexes?
That will be a question sure to be on everyone’s mind.
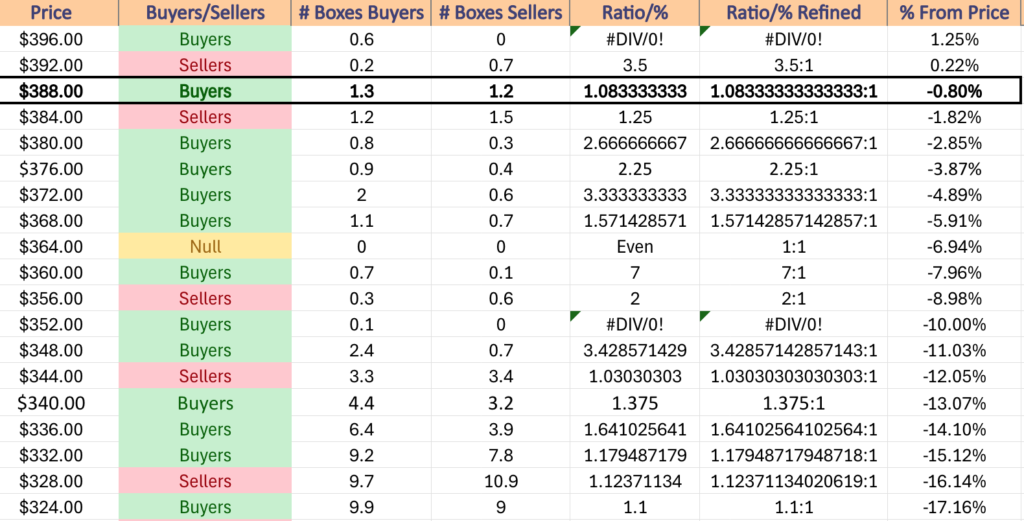
DIA has support at the $391.04 (Volume Sentiment: Buyers, 1.08:1), $390.31 (10 Day Moving Average, Volume Sentiment: Buyers, 1.08:1), $390.24 (Volume Sentiment: Buyers, 1.08:1) & $387.86/share (50 Day Moving Average, Volume Sentiment: Sellers, 1.25:1) price levels, with resistance at the $395.59 (Volume Sentiment: Sellers, 3.5:1), $397.13 (Volume Sentiment: Buyers, 0.6:0*) & $399.83/share (All-Time High, Volume Sentiment: Buyers, 0.6:0*) price level.
The Week Ahead
Monday kicks off a new month with S&P Final U.S. Manufacturing PMI at 9:45 am & Construction Spending & ISM Manufacturing data at 10 am.
There are no noteworthy earnings reports set to be released on Monday.
Federal Reserve Chair Jerome Powell speaks in Portugal Tuesday morning at 9:30 am, followed by Job Openings at 10 am & Auto Sales (TBD).
Tuesday morning brings earnings reports from MSC Industrial & Radius Recycling, with Simulation Plus scheduled to report after the session’s close.
Wednesday begins with NY Fed President Williams speaking in Portugal at 6:30 am followed by ADP Employment, Initial Jobless Claims & U.S. Trade Deficit data at 8:30 am, S&P Final U.S. Services PMI data at 9:45 am, Factory Orders & ISM Services data at 10 am & the Minutes of the June FOMC meeting at 2pm.
Constellation Brands will report earnings before Wednesday’s open before a half day due to the July 4th holiday.
Thursday is July 4th & there are no scheduled data or earnings announcements as the market is closed.
U.S. Employment Report, U.S. Unemployment Rate, U.S. Hourly Wages & Hourly Wages Year-over-Year are all released on Friday at 8:30 am & there are no notable earnings reports scheduled for the day.
See you back here next week & have a great Fourth of July!
*** I DO NOT OWN SHARES OR OPTIONS CONTRACT POSITIONS IN SPY, QQQ, IWM or DIA AT THE TIME OF PUBLISHING THIS ARTICLE ***