SPY, the SPDR S&P 500 ETF advanced +1.26% this past week as they continued to enjoy the NVDA stock split mania, while the VIX closed the week at 12.22%, implying a one day move of +/-0.77% & a one month move of +/-3.53%.
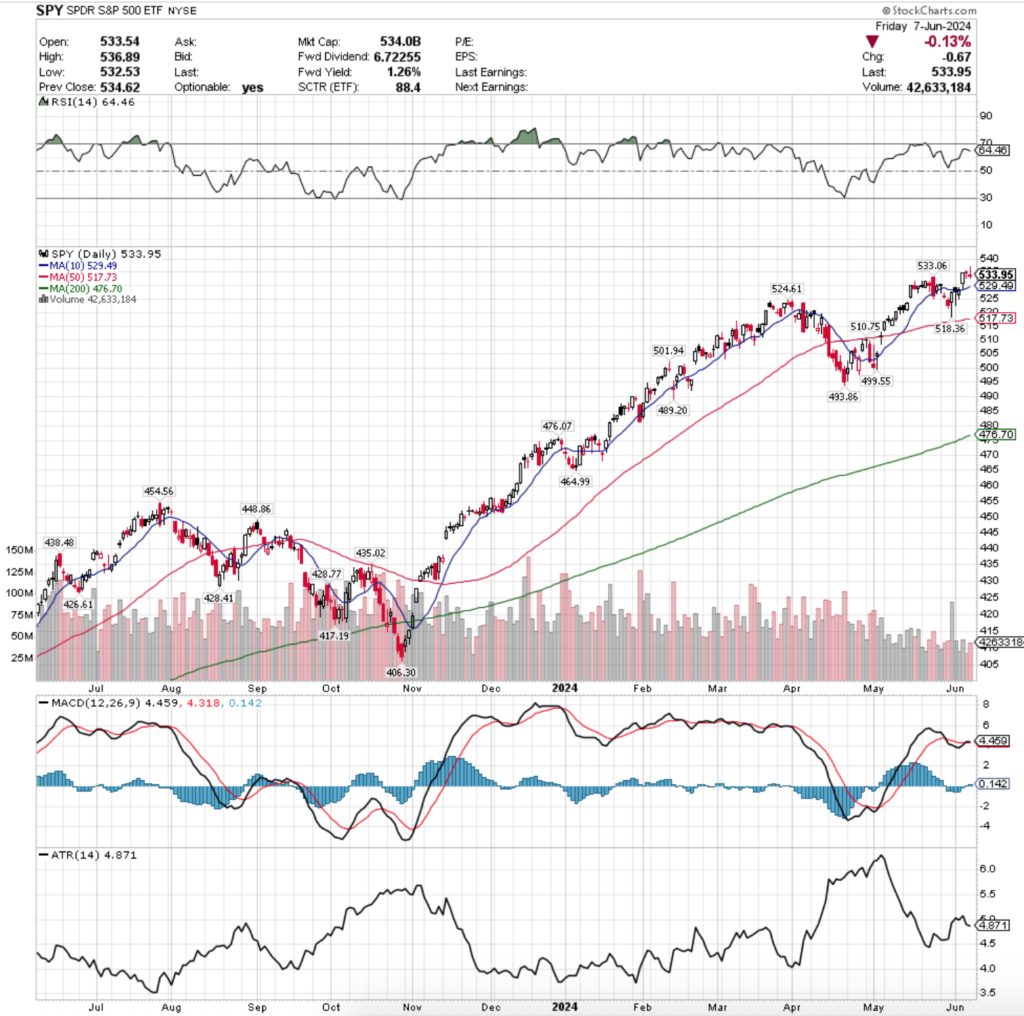
Their RSI is 64.46 after trending close to the overbought level but decreasing over the past two sessions, while their MACD is still bullish but looking weak & like it is ready for a bearish crossover in the coming week.
Volumes were -47.06% below average for the week compared to the year prior, continuing the tumbleweed trend for a fifth consecutive week (39,364,990 vs. 74,350,735).
This lack of volume for such a long time is becoming a bit concerning, with the coming week’s CPI, PPI & Fed-Funds Rate decision likely going to be the catalyst to increase volumes, be it to the upside or downside.
Monday began the week on a note of uncertainty, as the session gapped up to open above the 10 day moving average, only to test to the downside below the open of the previous Friday’s open & recovered to close just below/in-line with the 10 DMA.
This was on the second highest volume of the week, indicating that there is some severe downside sentiment in the market, both by how low the day’s range tested & by the fact that the day closed lower than it opened, which is another signal of limited cofidence.
Tuesday opened on a gap down & tested lower, although not as low as Monday & ultimately was able to test above the 10 DMA, although it closed about in-line with it.
The limited volume of the day (second lowest of the week) indicates that there was not much faith in the price advance & that market participants are still weary of prices being around the 10 day moving average.
Things got interesting on Wednesday, as SPY was able to gap up to open above the 10 DMA, but while the 10 DMA’s support held up, it was tested & the upside testing beyond the day’s closing level was minimal.
This led into Thursday’s narrow gap up open that ultimately tested lower & resulted in a doji candle, indicating uncertainty as investors tread water waiting for new developments to send SPY higher or lower.
The low volume on the doji should also be noted, as it showed market participants were relatively content with where SPY was priced, while also showing some hesitancy to continue marching higher.
This was confirmed by Friday’s session, where a new all-time high was reached temporarily, but the open & close of the day’s sessions were concentrated near the bottom of the day’s candle, which was also a doji (although its body was a bit thicker than the day prior’s.
SPY’s Average True Range declined a bit (we had anticipated it continuing higher) due to the first three sessions of the week, but in the wake of Thursday & Friday’s declines it should be primed to edge higher as volatility looks set to increase this week.
This week’s main events will be Wednesday & Thursday between CPI, the FOMC interest-rate decision & PPI data being released & markets are already eagerly awaiting their next direction based on the results of these announcements.
Rates will most likely remain unchanged & the “higher for longer” narrative will likely be repeated, which would cause the 10 DMA’s support to give out again, at which point all eyes will shift to the 50 day moving average.
There are two other support levels between the 10 & 50 day moving averages currently, but given that one was established six sessions ago it is likely not going to be strong, especially with how close the 50 DMA is to it.
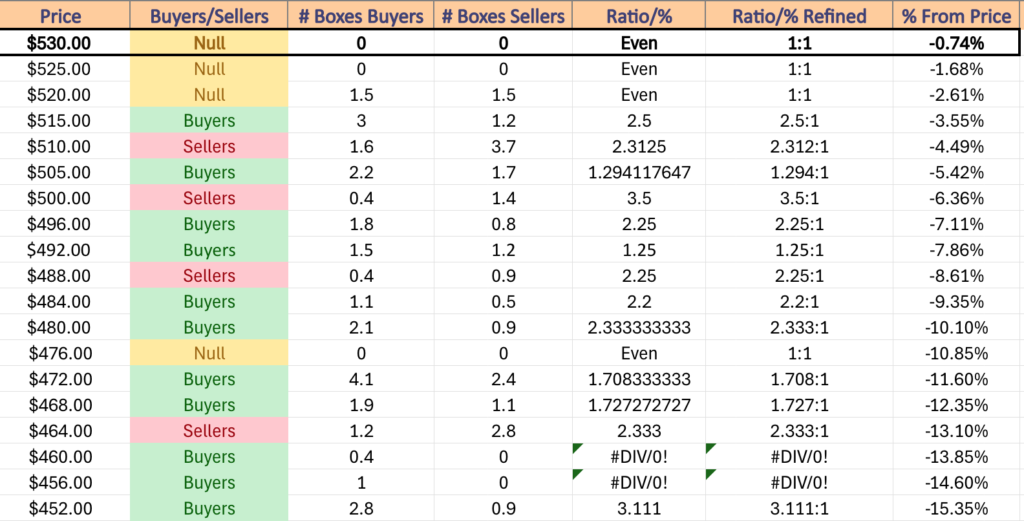
The 50 DMA test will more than likely result in a declining move through it, which would then open up SPY to further declines due to sparse support levels following their aggressive run up that began in October of 2023 & the $510.75, $501.94, $499.55 & $493.86 price levels would then be the next key support levels of focus.
Until then, expect rangebound activity & a consolidation for the beginning of the week within the confines of Wednesday’s candle’s real body on muted volumes.
In the event of any upside moves (for SPY, as well as the other index ETFs below) in the near-term, unless they’re accompanied by strong volumes they should be viewed with caution based on current market sentiments.
SPY has support at the $533.06 (Volume Sentiment: NULL, 0:0*), $529.49 (10 Day Moving Average, Volume Sentiment: NULL, 0:0*), $524.61 (Volume Sentiment: Even, 1:1) & $518.36/share (Volume Sentiment: Buyers, 2.5:1) price levels, with resistance at the $536.89/share (All-Time High, Volume Sentiment: NULL, 0:0*) price level.
QQQ, the Invesco QQQ Trust ETF that tracks the NASDAQ 100 advanced +2.72% last week, having the strongest week of the major four index ETFs.
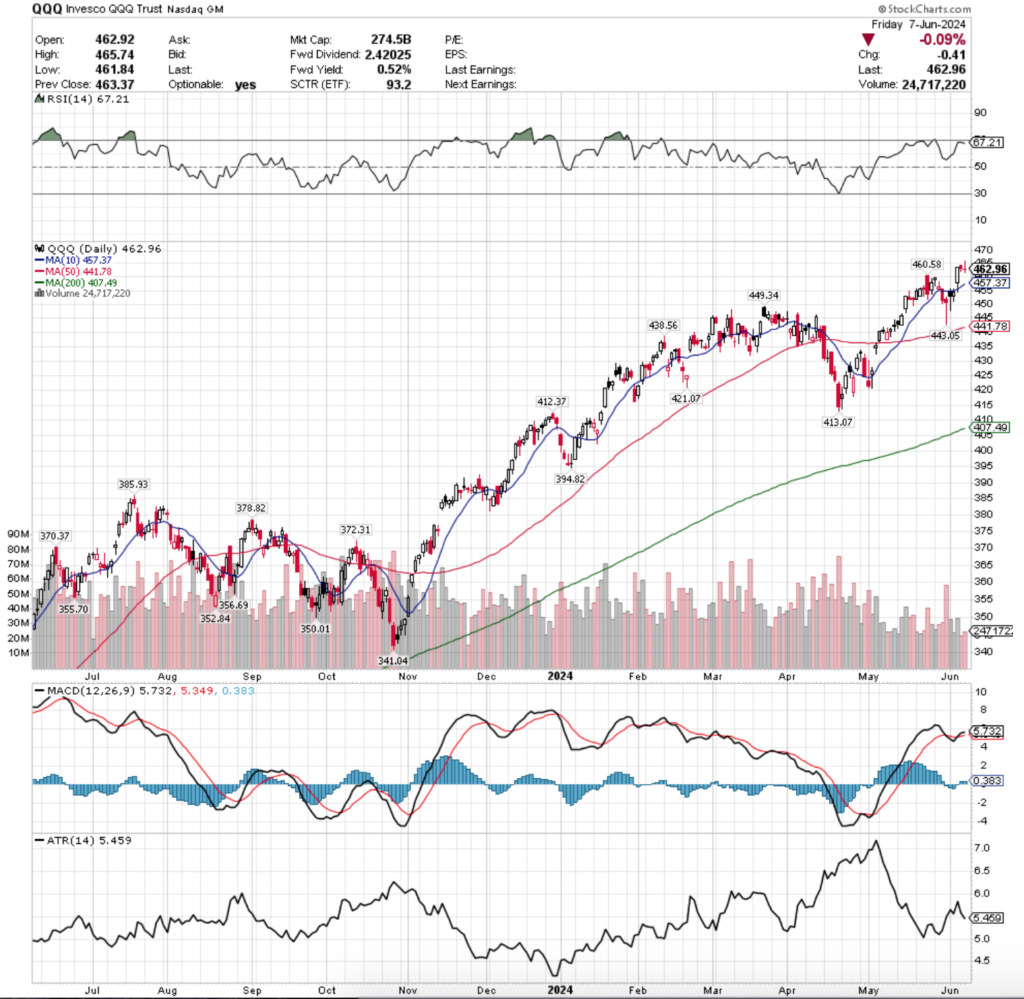
Their RSI is just beneath the overbought level of 70 & is currently at 67.21 after brushing up against the overbought mark, while their MACD is slightly bullish, but looking feeble & ready to keel over for a bearish crossover in the coming days.
Volumes were -41.33% below average vs. the year prior (27,451,313 vs. 46,787,963), as market participants are extremely cautious about entering into new positions & are worried about the outcome of the three key events mentioned above.
This low volume should also be noted as if there is any type of miss or bad data released it will spark investors into action, most likely to all hop out of the pool & take their profits with them from the run up QQQ has enjoyed since October of 2023.
QQQ’s week looked very similar to SPY’s, which makes sense given that they’ve both been driven by NVDA’s success, while IWM & DIA have not as it is not a component of either index.
Monday kicked QQQ’s week off on an erie note, as the session gapped higher on the open to just below the 10 day moving average’s resistance, poked higher temporarily, but ultimately tested low on the downside to well below the prior Friday’s close & closed for the day lower than the open.
This was the week’s second highest volume session of the week as well, indicating that there is more bearish than bullish sentiment in the near-term for QQQ.
Tuesday had a similar story, opening above Monday’s close, but testing lower before poking its upper shadow above the 10 DMA only to close right below it.
The session’s weak volume should be noted as it indicates that there was a bit of uncertainty among market participants & an overall reluctance to go above the 10 day moving average’s resistance.
Wednesday’s move to the upside then became more questionable, as despite having the highest volumes of the week, the levels were so muted that it is hardly meaningful from a sentiment perspective compared to their average volumes.
They opened above the 10 DMA, tested below it, but ultimately continued higher & established a new all-time high.
It should be noted however that there was no upper shadow on the day’s candle, which means that the day’s closing level was one of the highest points it traded at all day, indicating that there is not much appetite for QQQ to advance beyond that level in the near-term.
Much like SPY, expect to see QQQ kick off this week in a consolidation range based on the real body of Wednesday’s candle in the run-up to this week’s big data announcements mid-week.
Thursday set the tone for this with a slight gap higher than ultimately closed in declines with a lower shadow indicating that there was more downward sentiment than upward at these levels & an indecisive spirit was confirmed by the lowest volume of the week.
This continued Friday as the session opened on a gap lower, tested higher to reach an new all-time high, but ultimately closed as a gravestone doji, indicating that the sentiment now for QQQ is bearish, which should be expected to continue into this week.
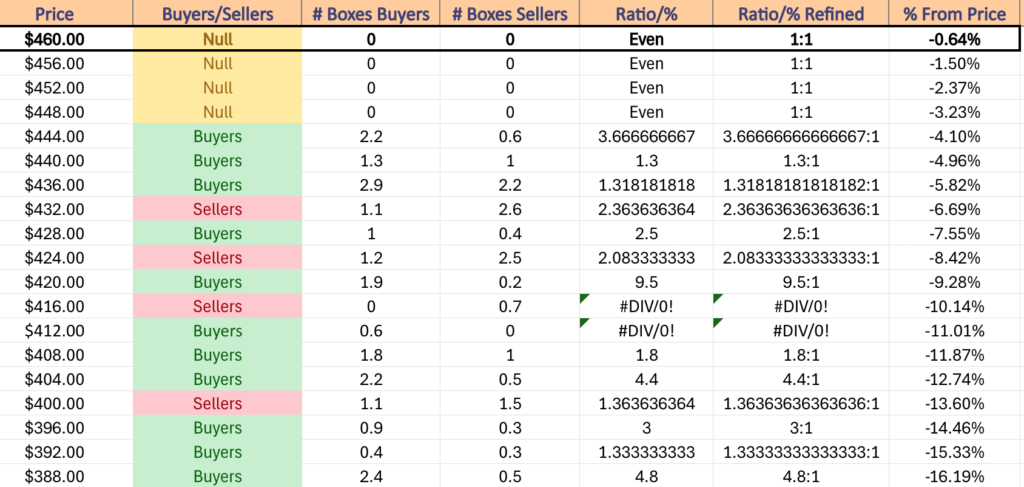
Much like SPY, QQQ’s 10 & 50 DMAs will continue to be areas to watch this week, as should the support of the 10 DMA be broken there will likely be a follow up test of the 50 DMA, as there are only two support levels between the two moving averages, one of which was established a week ago from Friday.
The index can continue to float higher if the AI & semiconductor names continue to be strong, but it appears that market participants are already taking their feet off of the gas pedal in recent weeks & are looking for a reason to take profits in the near-term, which may be delivered to them mid-week.
QQQ’s Average True Range also began to fall this past week due to the first three sessions, but it appears ready to continue climbing in the coming week amid rising volatility.
Due to this, it is important to have an idea as to how strong QQQ’s nearby support levels are in the event that they are retested soon.
QQQ has support at the $460.58 (Volume Sentiment: NULL, 0:0*), $457.37 (10 Day Moving Average, Volume Sentiment: NULL, 0:0*), $449.34 (Volume Sentiment: NULL, 0:0*) & $443.05/share (Volume Sentiment: Buyers, 1.3:1) price levels, with resistance at the $465.74/share (All-Time High, Volume Sentiment: NULL, 0:0*) price level.
IWM, the iShares Russell 2000 ETF fared the worst of the major index ETF this week, declining -2.22% as small cap stocks continued their consolidation that began in May.
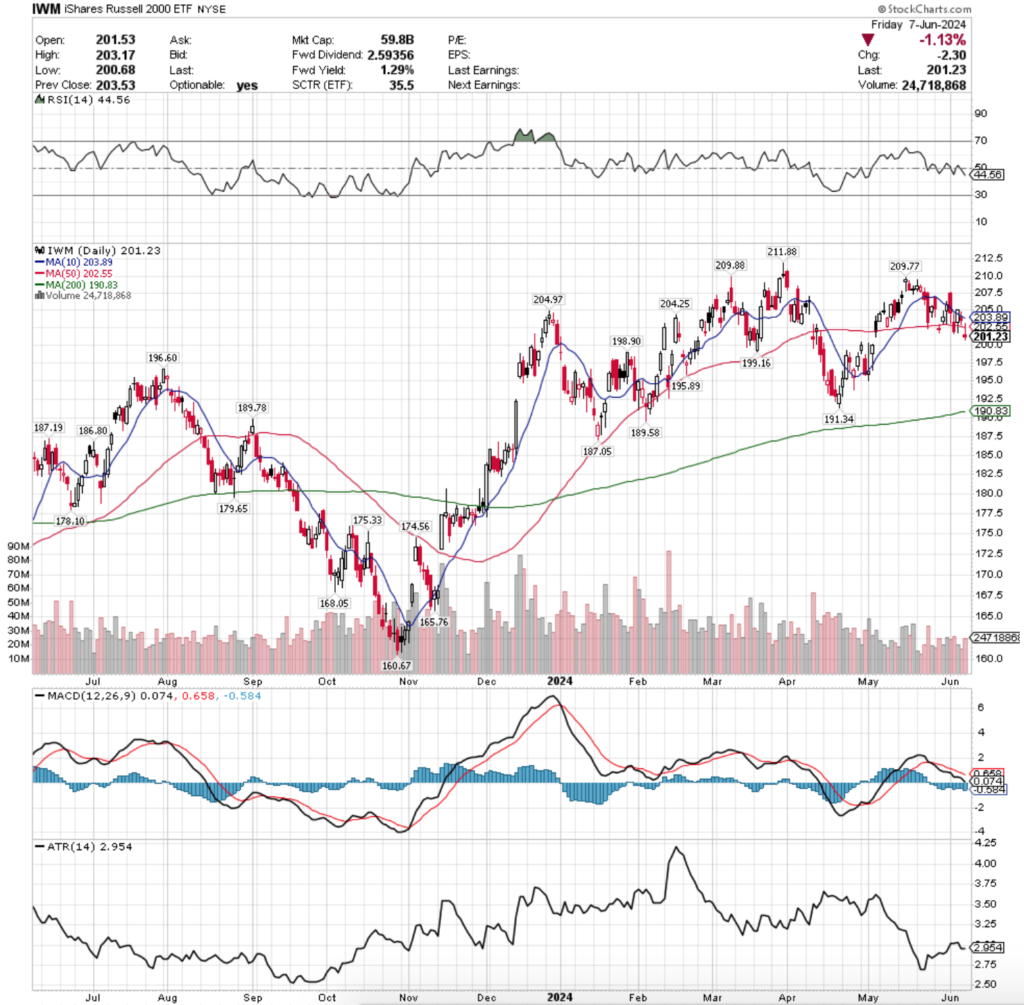
Their RSI is trending below the neutral level of 50 & currently sits at 44.56, while their MACD is still bearish following the crossover that occurred in mid-May.
Volumes were -33.08% below average compared to the prior year (22,737,264 vs. 33,975,688), as market participants await this week’s data announcements before making any further decisions on where to place money.
AS previously mentioned, IWM & DIA have broken off from the performance of SPY & QQQ recently due to the former not having NVDA as components.
This has led to the consolidation range that we have been seeing since May.
This should be concerning for the other indexes as it highlights that there is a lot of conflicting sentiment in the market right now.
Monday began on a gap higher than ultimately went below the 10 day moving average’s support to test the 50 DMA, which was able to hold up.
The price settled back up near the 10 DMA, but the session resulted in declines on modest volume.
Tuesday the bears were out in full force, as the week’s highest volume came from a session that opened on a gap down, failed to break the resistance of the 10 DMA on a test run & then crashed through the support of the 50 DMA & closed the day below it.
Wednesday was able to close above the 10 DMA barely, but the downside movement that IWM took during the day & the low volume despite wide trading range expose some cracks in the strength of IWM.
Thursday confirmed this with a bearish harami pattern emerging & a close to below the 10 DMA, which led to Friday’s gap down session that was unable to stay above the 50 day moving average’s support.
The theme of uncertainty was also revealed in Friday’s session as the candle ended the day as a spinning top on the lower range of the day’s prices & the gap up from early may began to be filled.
IWM’s Average True Range plateaued, but looks set to continue climbing with an increase in volatility this upcoming week.
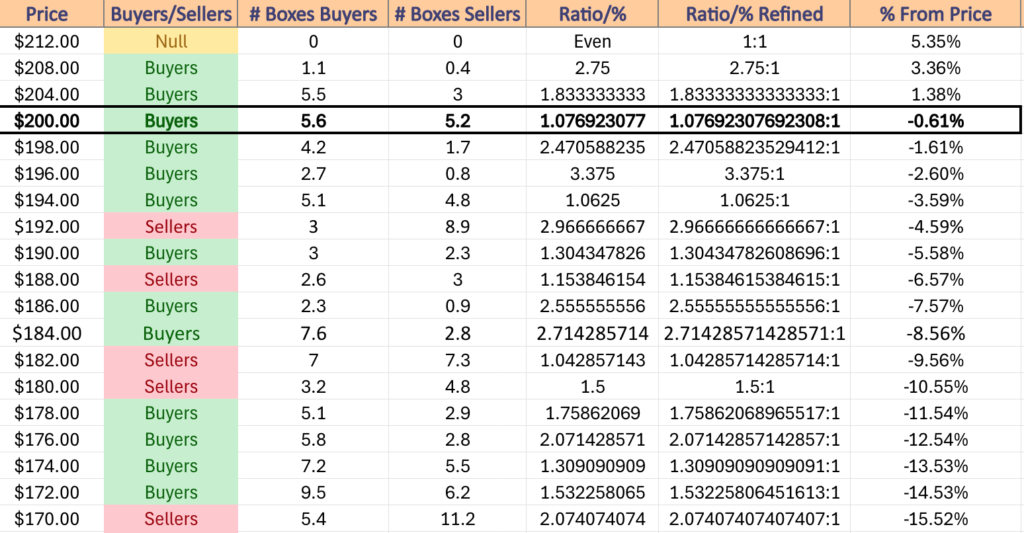
Due to the relatively tight range that IWM has traded in since December of 2023 there are many local support levels in relation to its current price which will be beneficial for it in the event that we see SPY & QQQ begin to correct.
In the event that the $195.89 support level is broken the $191.34 & the 200 day moving average of $190.83/share will be key areas to focus on, as otherwise IWM looks set to establish a new range in the $180’s.
IWM has support at the $199.16 (Volume Sentiment: Buyers, 2.47:1), $198.90 (Volume Sentiment: Buyers, 2.47:1), $196.60 (Volume Sentiment: Buyers, 3.38:1) & $195.89/share (Volume Sentiment: Buyers, 1.06:1) price levels, with resistance at the $202.55 (50 Day Moving Average, Volume Sentiment: Buyers, 1.08:1), $203.89 (10 Day Moving Average, Volume Sentiment: Buyers, 1.08:1), $204.25 (Volume Sentiment: Buyers, 1.83:1) & $204.97/share (Volume Sentiment: Buyers, 1.83:1) price level.
DIA, the SPDR Dow Jones Industrial Average ETF tread water for the week, adding only +0.25% as investors sit unsure of what the next move should be while awaiting this week’s data announcements.
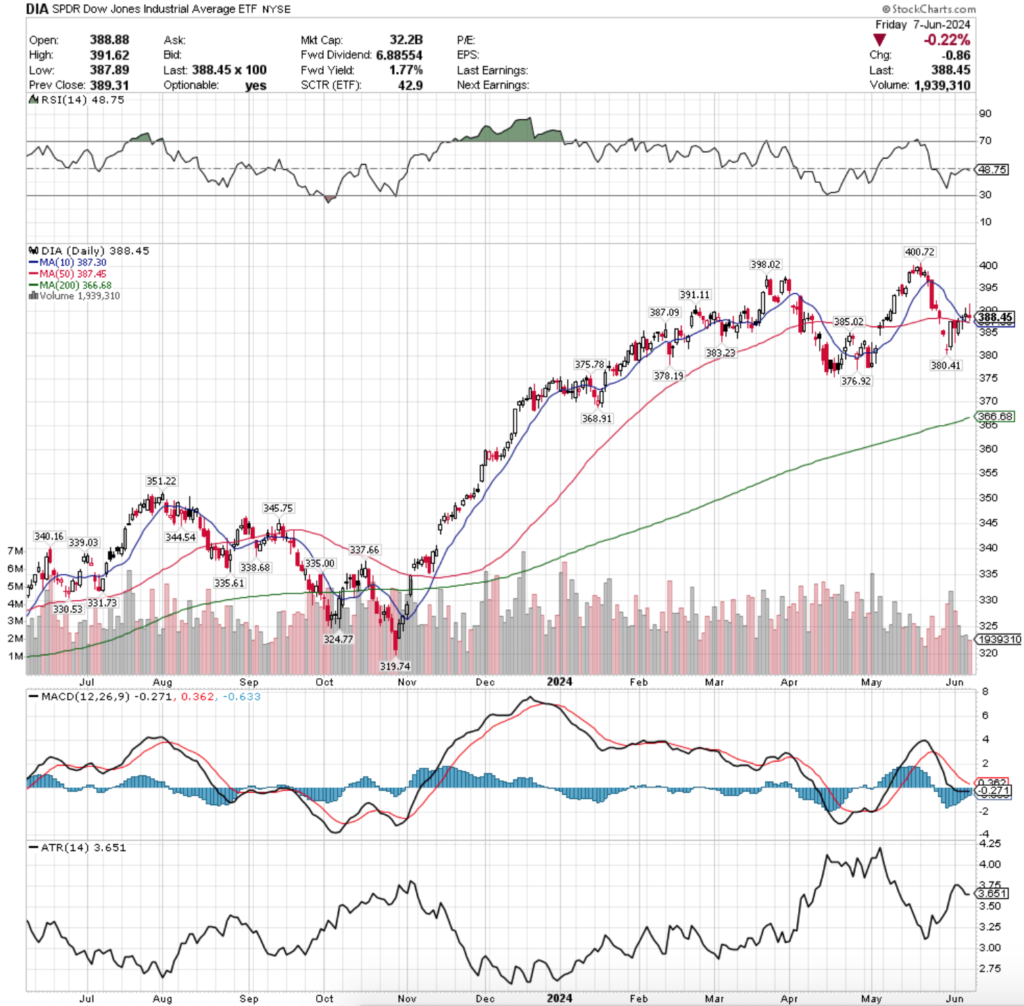
Their RSI is flat just below the neutral level & sits at 48.75, while their MACD is bearish currently, but has also flattened over the past week which will be something to keep an eye on moving into this week.
Volumes were -27.3% below average last week compared to the previous year (2,559,354 vs. 3,520,545) confirming that there is a great deal of indecision in the market, but it should be noted that last week’s highest volume session by a long-shot was Monday’s declining day.
Prices opened just above Friday’s close that day, were unable to break the 50 day moving average & instead tested lower, almost all the way to the Friday’s close before settling in what appears like a giant hanging man candle.
Tuesday was a bit more optimistic, DIA opened on a gap lower but was able to rally & temporarily cross through the 50 DMA’s resistance before closing just below it for an advancing session.
Things got interesting for DIA on Wednesday, when the day opened above both the 10 & 50 day moving averages, tested below both & wound up closing in a dragonfly doji just above them both.
While dragonfly dojis are typically indicative of a potential bullish reversal, the low volume levels & depth to the downside that the session tested are not a cause for optimism which the rest of the week echoed.
Thursday was another muted volume session that resulted in a spinning top on a high wave candle, indicating that there was no general consensus of where DIA was to be valued for the day.
The 10 & 50 DMAs were both support in relation to the day’s price range, but the open & close (real body portion of the candle) are concentrated closer to the lower end of the candle, indicating that there is more bearishness at these price levels than bullishness.
Friday confirmed this as well, as another weak volume session resulted in a spinning top (narrow body though, but too wide to be a doji) was able to test above Thursday’s high, but ultimately also tested near the low of Thursday as well before settling down lower for the day & “the range of indecision”.
While the close was above the support of the 10 & 50 day moving averages, the low volumes make it extremely difficult to see a bullish case in this situation.
In the event that there is one, there is a double top/emerging head & shoulders pattern with marks at the $398.02 (left) & $400.72/share price levels, which to see broken would require some serious market moving news, such as an FOMC rate cut.
DIA’s Average True Range has plateaued in recent days as there has not been much volatility, but that should perk up as this week progresses & volatility rises.
It will be impossible to not watch the 10 & 50 day moving averages this week, given that they’re just below DIA’s price & are sitting atop one another.
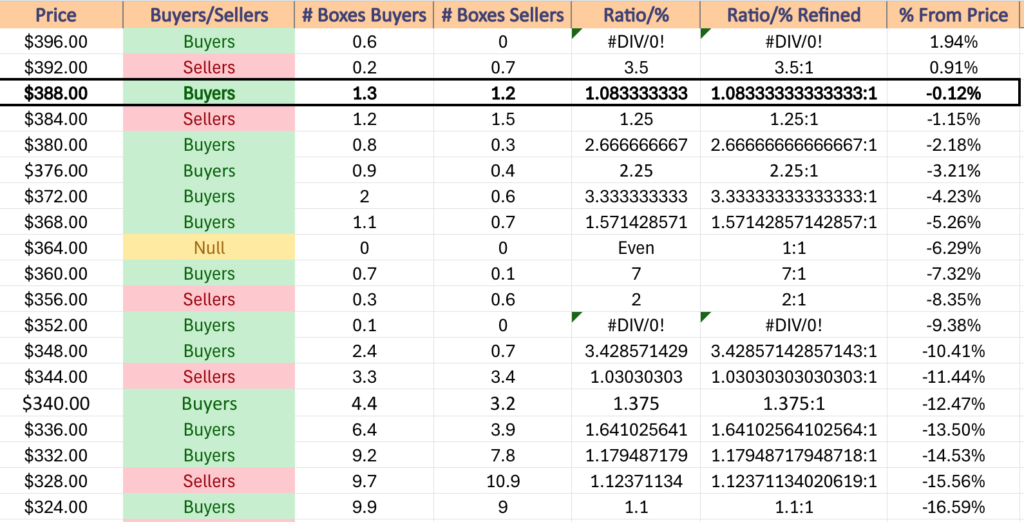
Due to this, in the event of a downside breakout all eyes should be on how resilient the $375.78-$378.19 support zone is, as if it crumbles the 200 day moving average is the only line of defense ($366.68) paired with the $368.91/share support level before the rapid advances of November & December 2023’s price range gets encroached, where there is no support for -4.22%.
Any upside moves right now should be viewed with caution, unless they’re accompanied by high volumes.
DIA has support at the $387.45 (50 Day Moving Average, Volume Sentiment: Sellers, 1.25:1), $387.30 (10 Day Moving Average, Volume Sentiment: Sellers, 1.25:1), $387.09 (Volume Sentiment: Sellers, 1.25:1) & $385.02/share (Volume Sentiment: Sellers, 1.25:1) price levels, with resistance at the $391.11 (Volume Sentiment: Buyers, 1.08:1), $398.02 (Volume Sentiment: Buyers, 0.6:0*) & $400.72/share (All-Time High, Volume Sentiment: NULL, 0:0*) price level.
The Week Ahead
The week begins on Monday on a quiet note with no economic data announcements scheduled.
Monday’s earnings reports feature FuelCell Energy & Lovesac before the opening bell, with Calavo Growers & Yext reporting after the session’s close.
Tuesday begins at 6 am with the NFIB Optimism Index data.
Academy Sports + Outdoors reports earnings results Tuesday morning before the bell, followed by Oracle & Casey’s General Stores after the closing bell.
Much anticipated Consumer Price Index, CPI Year-over-Year, Core CPI & Core CPI Year-over-Year data is released at 8:30 am on Wednesday, followed by the FOMC Interest-Rate Decision, Monthly U.S. Federal Budget data & Fed Chair Jerome Powell Press Conference all at 2pm.
Wednesday afternoon features earnings reports from Broadcom, Dave & Buster’s Entertainment, Oxford Industries & Torrid after the session’s closing bell.
Thursday features Initial Jobless Claims, Producer Price Index, Producer Price Index Year-over-Year, Core PPI & Core PPI Year-over-Year data all at 8:30 am.
Korn Ferry, Signet Jewlers, Veradigm & Wiley are all due to report earnings results on Thursday morning before the opening bell, with Adobe scheduled to report after the close.
The week winds down with Import Price Index & Import Price Index minus Fuel data at 8:30 am, followed by Consumer Sentiment (prelim) data at 10 am & there are no noteworthy earnings reports due.
See you back here next week!
*** I DO NOT OWN SHARES OR OPTIONS CONTRACT POSITIONS IN SPY, QQQ, IWM OR DIA AT THE TIME OF PUBLISHING THIS ARTICLE***