SPY, the SPDR S&P 500 ETF added +0.96% last week, while the VIX closed the week at 12.46, indicating a one day implied move of +/-0.79% & a one month implied move of +/-3.6%.
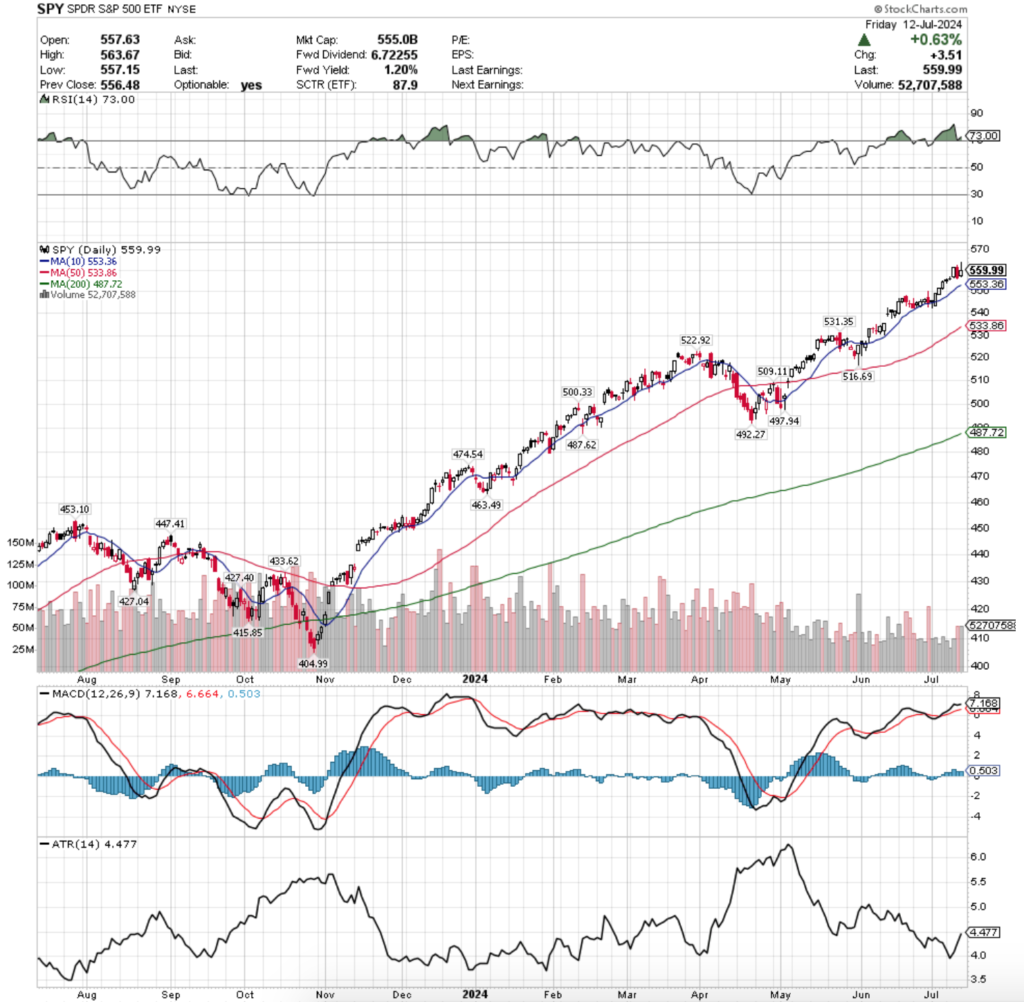
Their RSI is still in overbought territory despite having deflated slightly last week & still sits at 73, while their MACD remains bullish but is losing steam & looking like it will cross over the signal line bearishly in the first half of the week.
Volumes were -41.54% below the prior year’s average volume (41,637,020 vs. 71,227,029), indicating that there are still a lot of market participants who are sitting on the sidelines still watching to see what happens in the near-term.
Monday began the week on an uncertain note, where a low volume session resulted in a spinning top, however the open-closing price range was concentrated in the top of the day’s candle, signaling there was some appetite to go higher.
The trend continued into Tuesday, when prices advanced slightly on the week’s lowest volume & the day’s candle resulted in a doji, indicating further uncertainty & temporary equilibrium in prices for SPY.
Things began to heat up on Wednesday though, as prices opened slightly higher, tested a bit lower before making the biggest one day gain of the week & setting up what looks to be a new consolidation range based on the rest of the week’s price action.
Thursday saw some of the week’s highest volume in a session that resulted in a bearish engulfing candle, where there was a slight bit of interest in prices going higher based on the day’s upper shadow, but ultimately bears took control of the session & pushed prices down to close below Wednesday’s open.
Friday was a mixed bag, where prices opened above Thursday’s close & marched much higher, only to be met with extreme selling pressure as folks took a risk-off into the weekend approach to close the session only +0.63%.
While the upper shadow of Friday’s candle shows that there were some bullish folks out there, there was not enough staying power to keep them from selling & taking profits before heading off for the weekend.
As noted above, it looks like Wednesday’s session will prove to have established a new range that SPY will fluctuate around in for the near-term unless earnings reports turn out to be incredibly bullish.
With the waning histogram levels on the MACD & the slope of the line in relation to the signal, it appears that it is ready to make a move at a bearish crossover by later on this week.
Given that a new all-time high was reached on Friday, another area to watch is Friday’s high price, which has now become the only resistance level for SPY’s chart.
There’s extremely limited historical data for this price point, making it difficult to anticipate how market participants will behave at it, which makes it even more imperative to have a keen eye on it going into a new week.
Prices have separated themselves from the 10 day moving average following Wednesday’s move, making them further from their nearest support level.
This is important as upon any test of it there may be increased selling pressure based on how SPY has behaved previously when their 10 & 50 DMAs were the first two levels of SPY’s support.
Volume will also be a key area to be watching, as after months of low volume in relation to the previous year’s average levels any uptick in buying or selling pressure can be viewed as a sentiment factor at these high price levels.
If SPY is to continue grinding higher it’s going to need a strong increase in sentiment, as otherwise one or two days of profit taking can lead to steeper declines.
SPY’s Average True Range has been climbing over the past week, which should continue on into this week as volatility is likely to increase in the near-term.
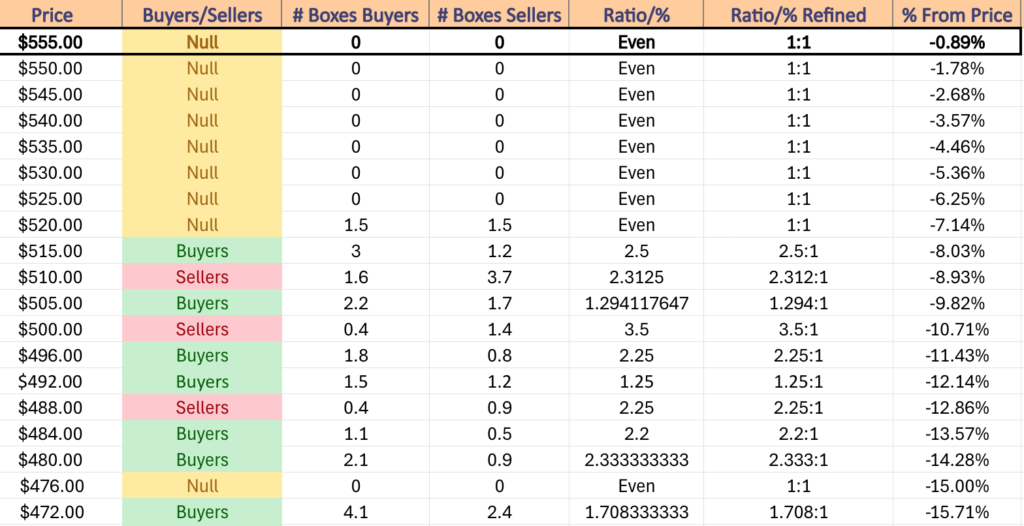
SPY has support at the $553.36 (10 Day Moving Average, Volume Sentiment: NULL, 0:0*), $533.86 (50 Day Moving Average, Volume Sentiment: NULL, 0:0*), $531.35 (Volume Sentiment: NULL, 0:0*) & $522.92/share (Volume Sentiment: NULL, 0:0*) price levels, with resistance at the $563.67/share (All-Time High, Volume Sentiment: NULL, 0:0*) price levels.
QQQ, the Invesco QQQ Trust ETF that tracks the NASDAQ 100 had the worst week of the major index ETFs, declining -0.27%.
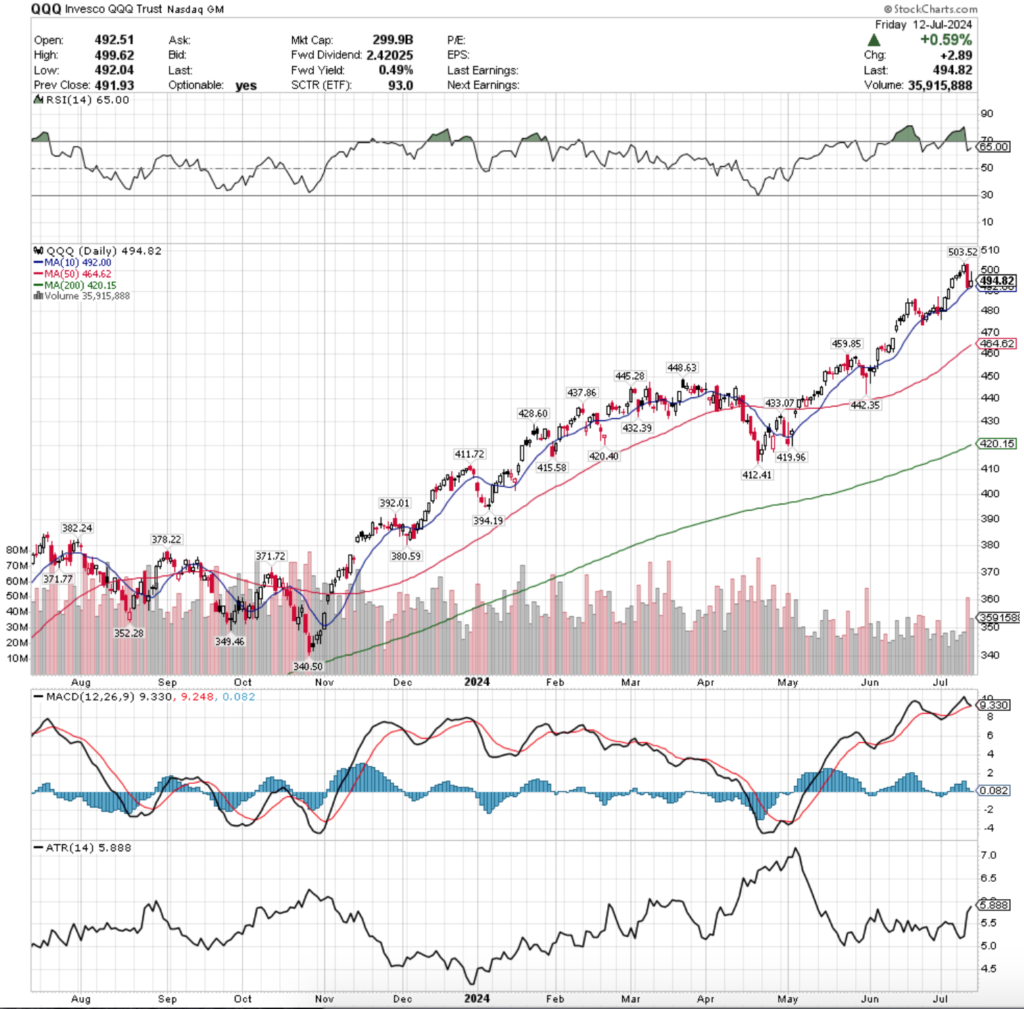
Their RSI is trending back towards overbought conditions & is currently at 65, while their MACD is bullish, but primed to cross over the signal line bearishly on Monday or Tuesday.
Volumes were -27.19% below the previous year’s average (32,556,580 vs. 33,409,553), which should raise an eyebrow given that the highest volume session of the week by a long-shot was Thursday’s declining session.
QQQ’s week started on a similar note to SPY’s, a spinning top candle on Monday indicated that there was a bit of hesitancy & indecision on the part of market participants, which was further confirmed by the session having the lowest volume of the week.
Tuesday is when the cracks began to show & it became evident that folks were getting a bit nervous & antsy, as the session opened higher & tested slightly above the open, only to succumb to the bears & be pushed to close lower than the open.
Wednesday began the three day pattern formation of the “%” (while I’ve never seen it written that way formally in my studies, it does look exactly like one), as prices opened higher & continued climbing into the session, establishing a new all-time high & closing not far beneath it.
Thursday exposed the weakness in QQQ, when a bearish engulfing candle showed that there was beginning to be a bit of fear in the market, as prices opened above Wednesday’s session & were pushed below even the previous Friday’s daily price range lows on volume levels not seen since late May.
Prices were supported by the 10 day moving average on Thursday, which is going to be a key area to keep an eye on this coming week.
Friday resulted in a bullish session, but it came with bearish implications, as based on the size of Friday’s candle’s upper shadow either bulls were out in full force & wanted to take some profits going into the weekend, or the well of enthusiasm for QQQ has begun to go dry in the near-term.
It should be noted that the 10 DMA held up as a support level on Friday too, but it is tough to tell how long that can last for heading into a new week of earnings & economic data.
QQQ’s MACD is another area to be focused on this week, as it is currently primed to cross over bearishly in the coming day or two.
If this happens, expect a lot more volatility & more advancing of their Average True Range, as well as a run to test the 50 day moving average, which is currently QQQ’s second level of support.
While there is also support in the window that formed by the gap up in the second week of June, the 50 DMA may have moved into that price window by the time of a test, given that the window begins just above the $470/share price level from the top & $467/share from the bottom.
While Friday’s candle did form a bullish harami with Thursday’s, we may be looking at a situation similar to April 4-5th, where prices fluttered around in the range of the 4th’s wide-range bearish candle for about a week before falling into decline.
This would form a double top with QQQ’s all-time high reached on Tuesday & confirm the strength of its resistance.
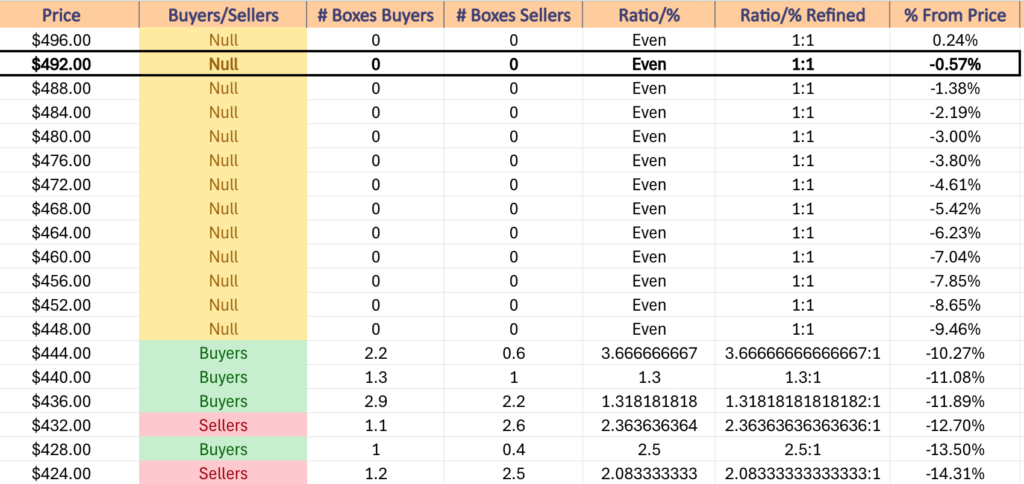
QQQ has support at the $492 (10 Day Moving Average, Volume Sentiment: NULL, 0:0*), $464.62 (50 Day Moving Average, Volume Sentiment: NULL, 0:0*), $459.85 (Volume Sentiment: NULL, 0:0*) & $448.63/share (Volume Sentiment: NULL, 0:0*) price levels, with resistance at the $503.52/share (All-Time High, Volume Sentiment: NULL, 0:0*) price levels.
IWM, the iShares Russell 2000 ETF advanced +6.11% last week, as small cap names were the darlings of the week.
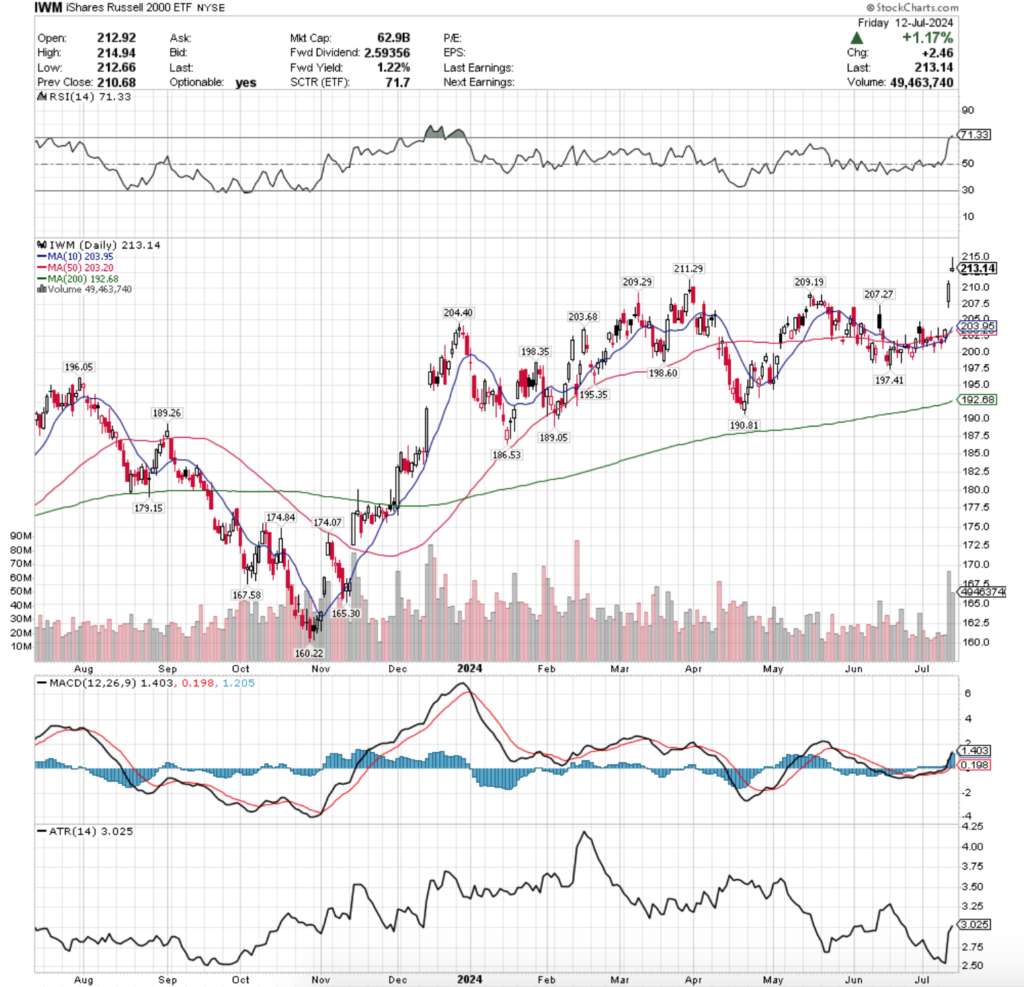
Their RSI crossed into overbought territory on Friday & is currently at 71.33, while their MACD is bullish, but does not appear to be on firm footing due to the rapid nature of its ascent.
Volumes were +4.28% above the previous year’s weekly average (34,840,240 vs. 33,409,553), due entirely to the strong bullish volume of the gap up sessions on Thursday & Friday.
Monday kicked the week off on a note of uncertainty, where low volumes & a long legged doji were the results of the day; prices tread water after having tested a good amount of price levels to the upside & downside & ultimately the support of the 50 day moving average was held in-tact.
Tuesday the bears got into IWM, with a session that opened lower than Monday, tested a bit higher but was rejected by the 50 DMA’s resistance & ultimately declined below the 10 DMA’s support before settling for the day in line with it.
There was a more optimistic air for IWM on Wednesday, when prices opened above Tuesday’s range & the 10 DMA, tested below the 10 DMAs support, before advancing beyond the resistance of the 50 DMA & managing to close above it as a support level.
Thursday opened with a gap up accounting for most of the week’s advances & was able to continue to climb higher on higher volumes than IWM has seen since February to close at over $210/share, breaking through the resistance zone that we’ve noted is at the $209/share price level.
The week wrapped up Friday with a similar, but less enthusiastic session that closed with a touch of warning.
Friday gapped up on the open & made a run at the $215/share level for IWM, but was unable to find footing & bears sent prices to close lower, with the day’s candle closing as a shooting star, which has near-term bearish implications.
IWM’s volume on Friday was high, which poses an interesting question: was the high volume due to folks who thought they missed the action on Thursday who went jumping into the water chasing IWM’s climb up, or was it more centered around people who’d profited already from earlier in the week selling & causing the long upper shadow of the shooting star candle?
The window created by Friday’s gap up will be an area of focus this week, as we wait to see if it serves as support or if it begins to fill.
Should it begin to fill the $211.29/share former 52-week high will be the first support level & how strong or weak it holds up will be key for determining the true strength behind the moves of the last two sessions.
December 12-13th of 2023 were the last time IWM’s RSI crossed into overbought territory, as it tends to stick more to oscillating around the neutral level in between the bounds of overbought & oversold.
When prices began to decline back from the RSI being in overbought territory there was a peak to trough decline of 8%+, which is something to be mindful of moving forward.
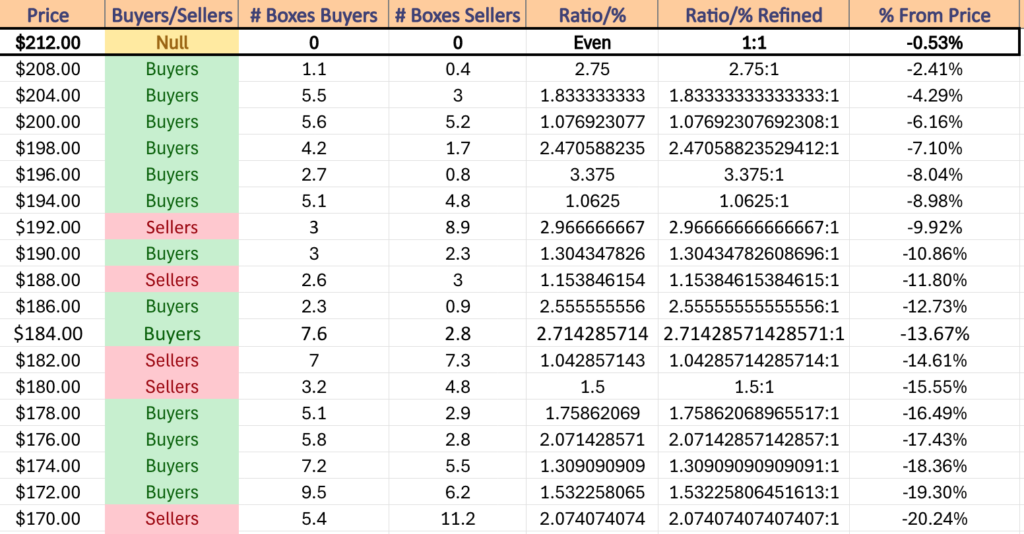
IWM has support at the $211.29 (Volume Sentiment: Buyers, 2.75:1), $209.29 (Volume Sentiment: Buyers, 2.75:1), $209.19 (Volume Sentiment: Buyers, 2.75:1) & $207.27/share (Volume Sentiment: Buyers, 1.83:1) price levels, with resistance at the $214.94/share (52-Week High, Volume Sentiment: NULL, 0:0*) price levels.
DIA, the SPDR Dow Jones Industrial Average ETF gained +1.68% this past week, closing the week with a fresh all-time high.
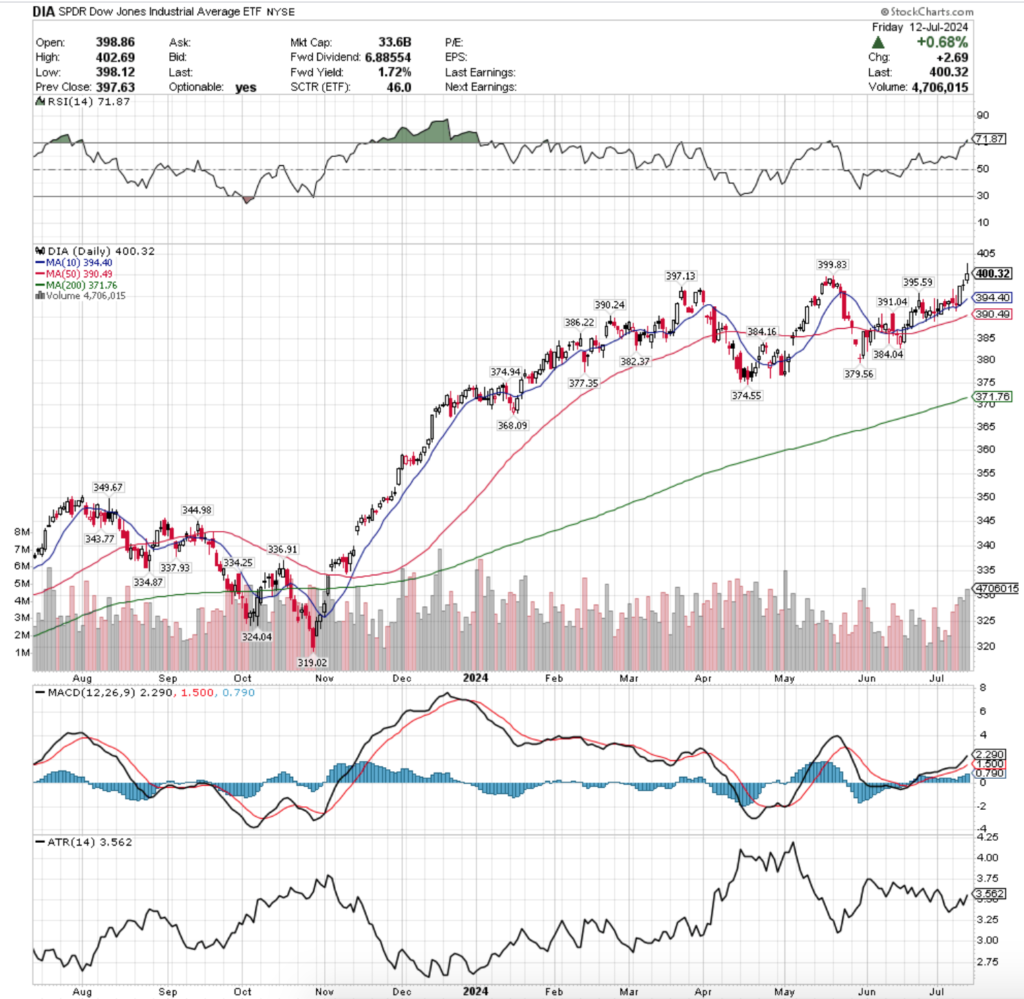
Their RSI just crossed into overbought territory on Friday & currently sits at 71.87, while their MACD is still bullish in the wake of the ascent that began in mid-June, which will be something to keep an eye on heading into the new week.
Volumes were the strongest for DIA last week of all the major indexes, coming in at +15.11% above average vs. the previous year (4,032,500 vs. 3,503,263), which provides some validation to the upwards price move, but is not entirely convincing just yet based on Friday’s price behavior.
DIA’s week started off on a rocky note, with Monday’s session having the lowest volumes of the week & resulting in a spinning top, indicating indecisiveness by market participants.
There was certainly a bullish appetite based on the long upper shadow, but the lower shadow also signaled that there were plenty of bears out there as well.
The 10 day moving average’s support did manage to hold up though & prices closed above it.
Tuesday was extremely similar to Monday, with less of a wise range between the open & closing prices on a declining session with slightly more volume.
Despite prices breaking temporarily below the 10 day moving average, they were able to recover & the session closed above it.
Wednesday provided a big leg up that was able to propel DIA into the close of the week, where the week’s second highest volume took an open at the 10 DMA & resulted in a +1% day-over-day gain.
The back end of the week is where trouble began brewing despite the advances.
Thursday was a showing of indecision as the session closed out as a doji just above the close of Wednesday on slightly less volume.
Friday looks at face value to have been a bullish sentiment day, but looking beneath the hood it isn’t entirely clear that that was truly the case.
DIA gapped up Friday morning on the open and based on its lower shadow briefly tested lower before powering to a new all-time high.
The troubling part comes down to the fact that the day’s candle closed as a shooting star with a slight lower shadow.
That lower shadow signals that there was still some bearish reluctance to continue higher in the direction of the opening gap during the session.
Another area of concern is the long upper shadow of the candle, as much like IWM’s Friday candle it can mean two things.
Either there was extreme optimism & most of that volume occurred due to the gap up & the bullish sentiment behind it, and or it occurred due to the long upper shadow, when market participants picked up some of their chips that they accumulated throughout the week & put them away before going into the weekend.
With this in mind, it will be wise to enter this week being prepared for some of the inflow volume of the latter end of the week to be sold as well.
DIA’s RSI is beginning to look like we may see a repeat of what occurred from mid-July 2023 to November of 2023, when overbought conditions persisted into August before declining through October.
Peak to trough that long-winded decline was -8.96% when all was said & done.
There are plenty of support levels for DIA that aren’t far off from their price as they have remained relatively bouncing around rangebound in 2024 following that steep November 2023 year end rally.
How this is impacted by any declines in the more fragile SPY or QQQ is yet to be seen, but will be something to keep an eye on should the time come.
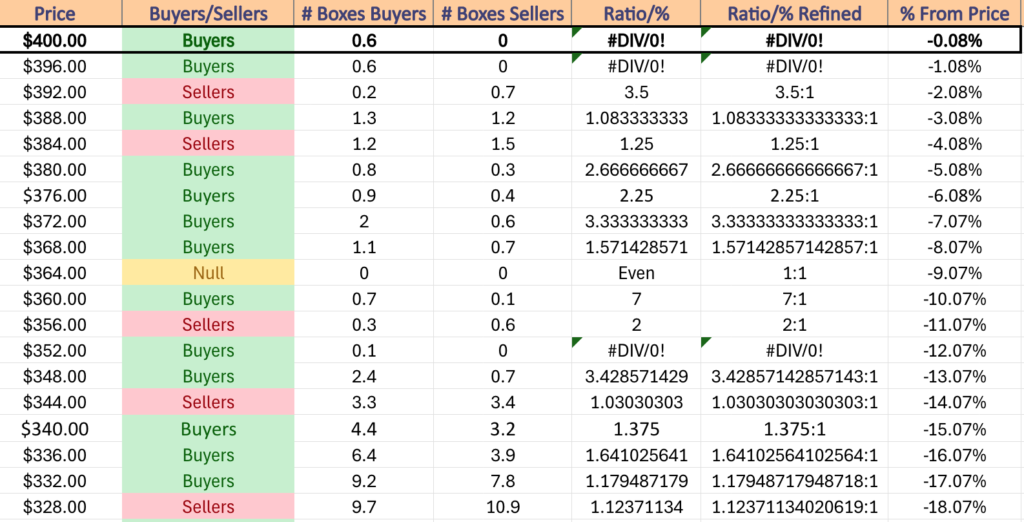
DIA has support at the $399.83 (Volume Sentiment: Buyers, 0.6:0*), $397.13 (Volume Sentiment: Buyers, 0.6:0*), $395.59 (Volume Sentiment: Sellers, 3.5:1) & $394.40/share (10 Day Moving Average, Volume Sentiment: Sellers, 3.5:1) price levels, with resistance at the $402.69/share (All-Time High, Volume Sentiment: NULL, 0:0*) price levels.
The Week Ahead
Monday starts the week off with Empire State Manufacturing Survey data at 8:30 am, followed by Fed Chairman Powell speaking at 12 pm.
BlackRock & Goldman Sachs report earnings before Monday’s opening bell.
U.S. Retail Sales, Retail Sales minus Autos, Import Price Index & Import Price Index minus Fuel data are all scheduled to be released at 8:30 am on Tuesday, followed by Business Inventories & Home Builder Confidence Index data at 10 am & Fed Governor Kugler speaking at 2:45 pm.
Tuesday morning begins with earnings reports from Bank of America, Morgan Stanley, PNC, Progressive, State Street & United Health Group, with Fulton Financial, Hancock Whitney, Interactive Brokers, J.B. Hunt Transport, Omnicom & Pinnacle Financial Partners scheduled to report after the closing bell.
Wednesday begins with Housing Starts & Building Permits data at 8:30 am, Industrial Production & Capacity Utilization data at 9:15 am & winds down with the Fed’s Beige Book at 2pm.
Johnson & Johnson, Ally Financial, ASML, Citizens Financial Group, Elevance Health, First Horizon, Northern Trust, Prologis, Synchrony Financial & U.S. Bancorp report earnings Wednesday morning, followed by Alcoa, Bank OZK, Cohen & Steers, Crown Castle, Discover Financial Services, Equifax, F.N.B. Corp., Home Bancshares, Kinder Morgan, Rexford Industrial Realty, SL Green Realty, Steel Dynamics, Synovus, United Airlines & Wintrust Financial reporting after the closing bell.
Initial Jobless Claims & Philadelphia Fed Manufacturing Survey data are released at 8:30 am on Thursday, before U.S. Leading Economic Indicators data comes out at 10 am.
Abbott Laboratories, Berkshire Hills Bancorp, Cintas, Commerce Bancshares, D.R. Horton, Domino’s Pizza, Hexcel, Insteel Industries, KeyCorp, M&T Bank, Manpower, Marsh & McLennan Companies, OFG Bancorp, Snap-On, Texas Capital, Textron, Virtu Financial & WNS report earnings Thursday before the opening bell, followed by Netflix, AAR Corp, Glacier Bancorp, PPG Industries, Resources Connection & Western Alliance Bancorp after the closing bell.
Friday ends on a quieter note, with NY Fed President Williams speaking at 10:40 am & Atlanta Fed President Bostic speaking at 1 pm.
American Express, Autoliv, Badger Meter, Comerica, Fifth Third Bancorp, Halliburton, Huntington Bancshares, Regions Financial, SLB & Travelers Companies are all due to report earnings before Friday morning’s opening bell.
See you back here next week!
*** I DO NOT OWN SHARES OR OPTIONS CONTRACT POSITIONS IN SPY, QQQ, IWM OR DIA AT THE TIME OF PUBLISHING THIS ARTICLE ***