SPY, the SPDR S&P 500 ETF fell -1.96% last week as low volumes continued on, while the VIX closed at 16.52, indicating a one day implied move of +/-1.04% & a one month implied move of +/-4.77%.
For those who missed it, check out last week’s post about how frequently SPY performs inside & outside of the VIX’s implied daily range & under varying levels of volume fluctuations here.
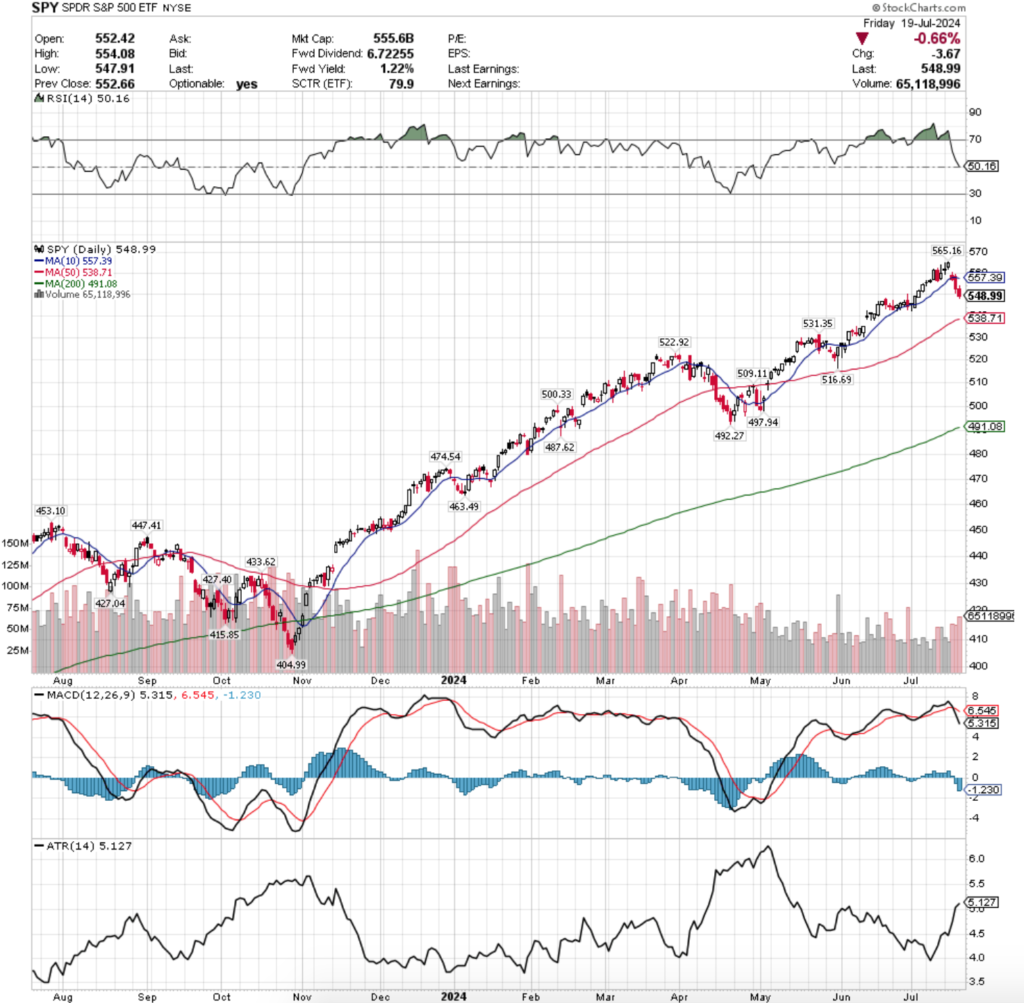
Their RSI is at the neutral level of 50.16 after being overbought for weeks, which will make the coming sessions interesting as we watch to see if 50 is deemed “enough is enough”, or if it continues sinking further.
SPY’s MACD is bearish & looks content to continue lower in the coming week based on its histogram & past history, which if proves true will show RSI values moving further downward towards the 30 mark, oversold territory.
Volumes were still weak for SPY, -27.8% below the prior year’s average volume (51,178,120 vs. 70,887,296), which is a cause for concern given that the highest volume sessions were on declining days where money was flowing out of SPY.
Volume will remain a key element of trade for all ETFs discussed in this article in the coming week, as it will lend clues into the true sentiment of market participants behind whatever price moves we experience.
Monday began the week indicating that there was some weakness on the horizon last week, as the session resulted in a long-legged doji candle on mediocre at best volume, slightly advancing.
Tuesday’s high marked a new 52-week & all-time high for SPY, but the weakness in volume indicated that there was about to be a change of tune from market participants, which came about on Wednesday, when prices opened on a gap down on volumes that eclipsed the prior two days & entire month of July.
After the opening gap down on Wednesday prices tried to stay above the 10 day moving average’s support, including the test higher shown by the session’s upper shadow, but ultimately the day closed lower, right below the 10 DMA’s resistance.
Thursday opened slightly higher than Wednesday’s close & tested slightly higher, before tumbling to close well below the day’s open & the resistance of the 10 DMA.
Risk-off sentiment carried through into Friday, where prices again opened lower, made a modest attempt at going higher, before ultimately continuing to decline -0.66% for the session on the week’s strongest volume.
As previously noted, volume will be key for all indexes this week, as earnings calls & PCE on Friday have the potential to cause markets to jump around a bit, but the conviction behind the jump will be more important than the actual day-over-day percent changes.
Another area to keep an eye on for SPY & the other index ETFs is going to be their oscillators & indicators.
Following a three consecutive session decline things such as their RSI & MACD look markedly bearish, but based on their neutral RSI there is potential for early signals as to what comes next based on how this week’s changes to it play out.
RSI does not have to go from overbought to oversold & can just as easily resume upward movement from the neutral level where it sits now.
This seems unlikely based on how aggressive last week’s declines were & due to the fact that the 10 DMA has now curled over & is applying downwards pressure on SPY’s price.
SPY’s current share price sits midway between the resistance of the 10 DMA & the support of the 50 DMA, which happens to be SPY’s nearest support level., ~2% below the current price.
As was noted last week, SPY’s price behavior of recent following the bearish engulfing session of two Thursday’s ago have some similarities, making it likely to see some form of price consolidation in a controlled decline between the two moving averages in the near-term (similar to last July & August’s price behavior).
Should this hold true & prices drop below the 50 DMA & march lower towards SPY’s other support levels.
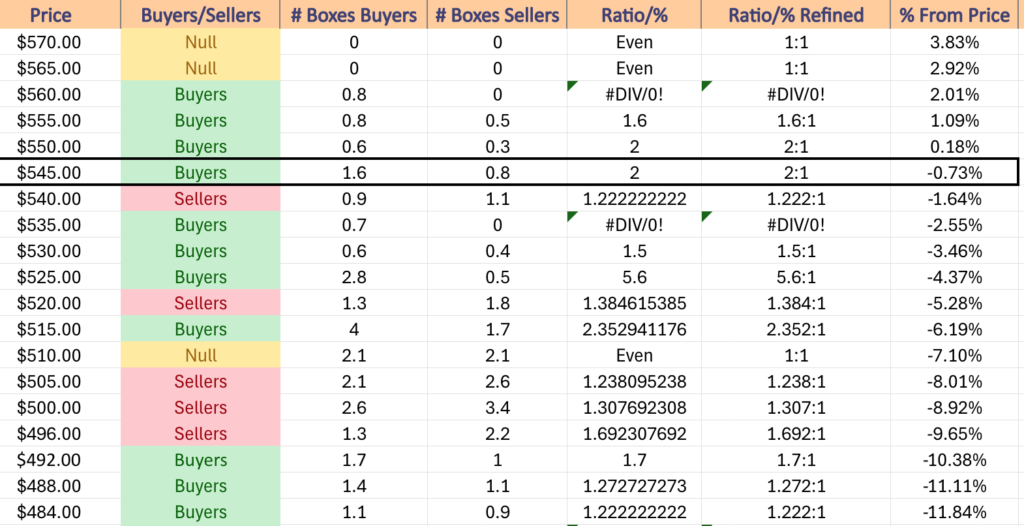
In the event of a 10% decline from the recently set all-time high, SPY’s price would decline to $508.64, which would mean there’d be a test of the support level at $509.11 that was established in late-April.
A decline to $544.99 would put SPY into a seller dominated price zone that would line it up for a test of the 50 DMA’s support, based on the limited data for these newly reached high price levels & the buyer:seller volume ratio.
Another important consideration when looking at the strength of support levels this close to all-time highs is that the data will be skewed towards the buyers, as most of the price levels have not been challenged much while prices marched higher.
With that in mind & looking at the most recent data below (will post a volume sentiment analysis later this week), the $525-529.99/share price level is the strongest in terms of historic buyer:seller volume sentiment.
Should prices continue lower through that & reach the $510-514.99/share level support will not be as strong, however the same concept related to the buyer’s strength at the high levels applies to the sellers strength at the levels that have historically seen more correcting price action to the downside before moving upwards again.
For the coming week expect to se further consolidation with perhaps a session or two of breath catching & mild advances until prices become wedged in tightly between the 10 & 50 DMA, unless there is some bad news event that causes outright sharp declines to continue.
Higher volatility & a higher Average True Range reading will likely continue into the next few weeks.
SPY has support at the $539.71 (50 Day Moving Average, Volume Sentiment: Buyers, 0.7:0*, $531.35 (Volume Sentiment: Buyers, 1.5:1), $522.92 (Volume Sentiment: Sellers, 1.39:1) & $516.69/share (Volume Sentiment: Buyers, 2.35:1) price levels, with resistance at the $557.39 (10 Day Moving Average, Volume Sentiment: Buyers, 1.6:1) & $565.16/share (All-Time High, Volume Sentiment: NULL, 0:0*) price levels.
QQQ, the Invesco QQQ Trust ETF that tracks the NASDAQ 100 had the worst week of the major four index ETFs, declining -3.96% for the week, as market participants shied away from the tech-heavy index.
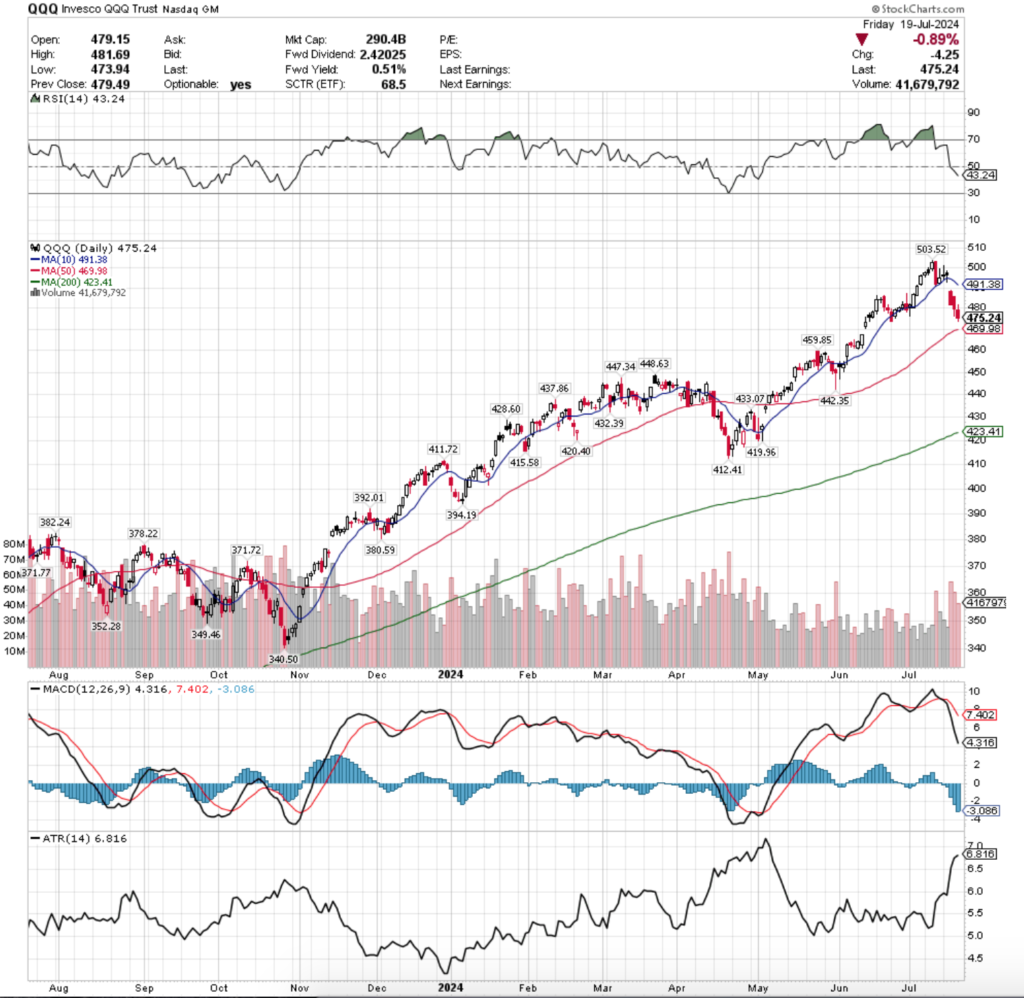
Their RSI crossed over the neutral 50 level via Wednesday’s gap down session & has continued moving towards oversold levels, currently sitting at 50.
QQQ’s MACD is bearish & its histogram isn’t indicating signs of slowing down in the near-term, at least until the 50 day moving average is tested.
Volumes were -8.06% below average compared to the previous year’s average (40,935,280 vs. 44,522,493), as some life was breathed back into QQQ last week.
As noted in previous weeks’ posts, due to the length of time that volumes were subdued (9+ weeks) the total average volume of the past year has gone down as 10 weeks is ~19% of the year.
This should also be taken into consideration when reviewing the volume sentiment data that was just discussed for SPY & will continue to be discussed throughout the article, as much of the price action at the levels discussed took place within this relatively calm period.
QQQ’s week kicked off on a bit more ominous looking note than SPY’s, with Monday’s session resulting in a long-legged doji as well that was a slight day-over-day increase from the prior Friday, where volumes were actually not terribly weak if compared to the previous few month’s volume levels.
Tuesday had weaker volume indicating that people were becoming hesitant & the hanging man candle that closed lower than it opened (bearish signal) showed there was blood in the water, which was further confirmed with the temporary intra-day breaking below QQQ’s 10 DMA’s support.
QQQ jumped off the diving board aggressively on Wednesday, where the week’s highest volume session opened on a gap down & didn’t look back, continuing lower throughout the day to close near its low price & showing that traders had lost faith in the two month rally.
Thursday opened midway between Wednesday’s price range, only for the bleeding to continue as sellers came out in droves once again forcing prices lower & opening the door to further near-term declines based on the lower shadow of the session’s candle.
It became very clear that there was little-to-no enthusiasm left for QQQ & the week closed out on the same note, a risk-off into the weekend Friday session that continued pushing prices lower on a -0.89% daily decline.
There were a few glimmers of hope for QQQ that SPY did not share, such as more upside appetite on Friday based on the candle’s upper shadow & the fact that seller volume pressure went down each day after Wednesday, whereas SPY’s negative volume sessions only saw more & more volume each successive day.
Part of the former may be attributed to the fact that QQQ is closer to its 50 DMA’s support than SPY is, which put some upside pressure on their price.
Similar themes for QQQ’s near-term future were outlined in SPY’s section, as they have behaved in similar fashions in the recent AI-frenzy.
QQQ’s volume patterns will be important in predicting how prices will behave, particularly as earnings calls begin featuring more names that are NASDAQ components, as so far earnings calls have mostly been financial companies, which are not components of QQQ.
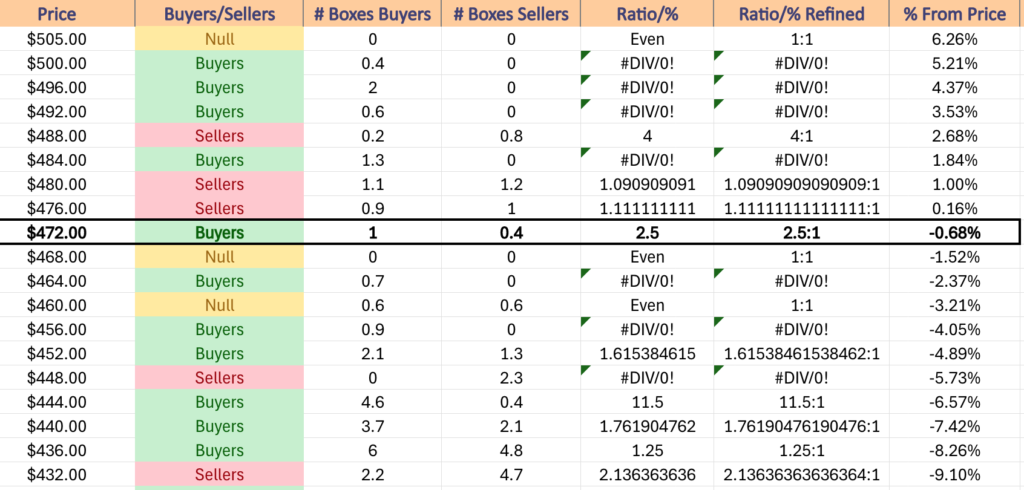
A -10% decline from QQQ’s all-time high that was set two weeks ago would bring prices to $453.17/share, putting it within the range of the Q1-Q2 consolidation range.
Should prices break down below the 50 DMA’s support that looks primed to be the destination of choice, especially given there is little-to-no data of value in terms of buyer:seller pressure for the $468-471.99/share price zone & the $460-463.99/share zone is a low volume gridlock between an even number of buyer & seller sentiment.
Given how much QQQ has already shed the more buyer-oriented extreme prices have passed, and similar to SPY, the $448-451.99/share zone that is currently lopsided to the sellers could become a strong support level that evens out vs. the current 2.3:0 ratio that favors the sellers.
Like SPY, expect to see QQQ’s Average True Range stay high in the coming week(s) as increasing volatility looks primed to continue.
QQQ has support at the $469.98 (50 Day Moving Average, Volume Sentiment: NULL, 0:0*), $459.85 (Volume Sentiment: Buyers, 0.9:0*), $448.63 (Volume Sentiment: Sellers, 2.3:0*) & $447.34/share (Volume Sentiment: Buyers, 11.5:1) price levels, with resistance at the $491.38 (10 Day Moving Average, Volume Sentiment: Sellers, 4:1) & $503.52/share (All-Time High, Volume Sentiment: Buyers, 0.4:0*) price levels.
IWM, the iShares Russell 2000 ETF had the strongest weekly performance of the major index ETFs on revived volume, advancing +1.74%.
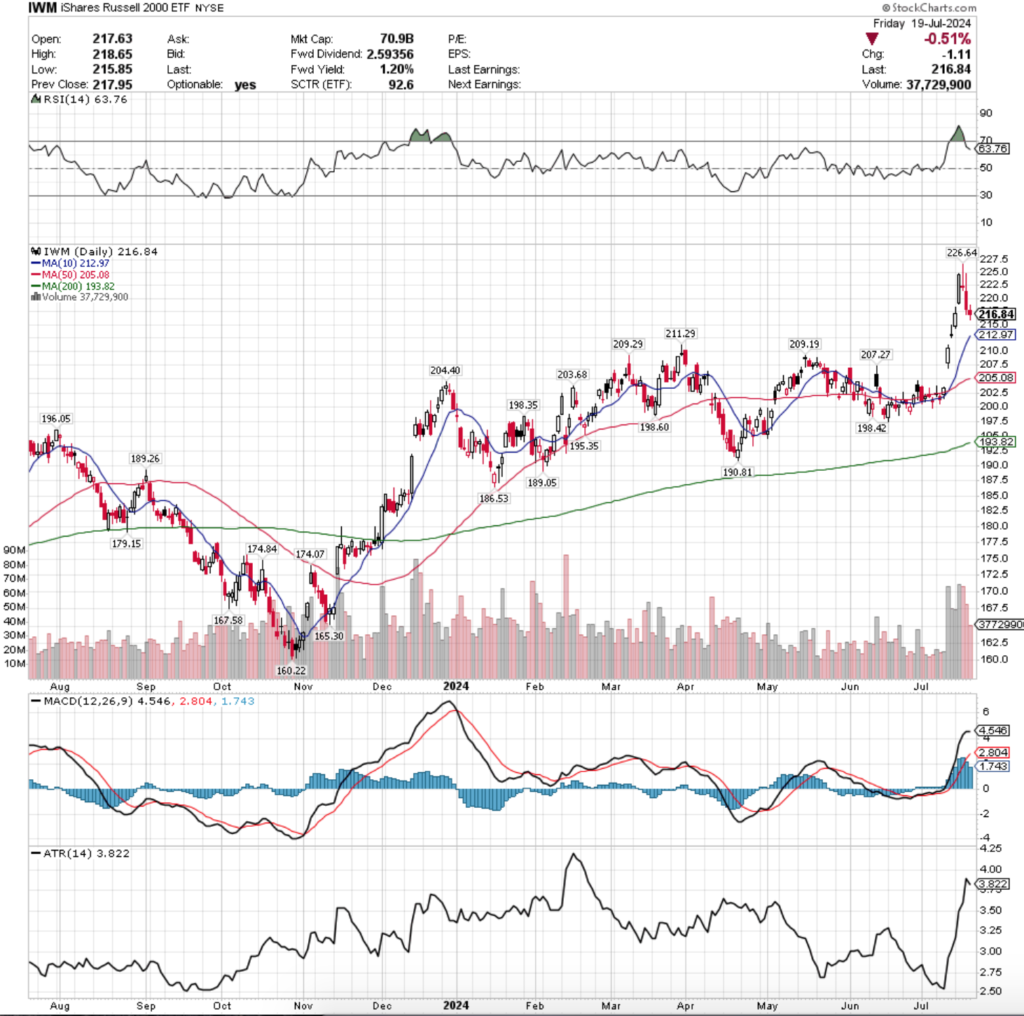
Their RSI crossed back from overbought territory on Wednesday/Thursday & sits at 63.73, while their MACD is still bullish but has curled over looking to likely cross the signal line by mid-week, which the histogram supports as it too is falling.
Volumes were +61.32% above average last week compared to the previous year’s average (54,809,160 vs. 33,976,390), reflecting a healthy mix of growth & profit taking when combined with the volumes of late in the week prior.
Monday continued IWM’s rally from the previous week, as a gap up open near the prior Friday’s high set the stage for another session of marching higher, although volumes were signaling that there was waning enthusiasm at these price levels.
Tuesday made one last march higher on a gap up session that had a wide price range as indicated by the large daily candle & the highest volume of the week showed that there was going to be one last dive into the pool before it became time to head out.
Wednesday was the major profit taking session, where declining session volume was only -2.7% below Tuesday’s volume.
Further pain was on the horizon though as the gravestone doji (bearish) candle also created a bearish harami pattern on the two highest volume sessions of the week; there was a marked change of sentiment coming from market participants & weakness began emerging.
This carried on for the rest of the week, when Thursday opened on a gap down & despite trying to rally higher ultimately closed lower & the candle’s lower shadow signaled that there was more appetite for prices to continue declining.
Thursday’s volume also showed that profit taking was still alive & healthy in the wake of the prior week’s run up for IWM & the gap between Monday & Tuesday’s candles was filled.
Friday ended the week on a note of uncertainty, as prices opened lower, wanted to advance but ultimately declined for the day & resulted in a spinning top.
The session’s volume waned from the levels seen over the prior six sessions indicating that there was still profit taking taking place but that folks were not certain of what direction IWM should be moving in next.
IWM’s week ahead looks a bit different than SPY or QQQ’s given they recently broke out of a months-long trading range & are now working their way back towards the support of the 10 day moving average (~2% below Friday’s closing price), where there is also other local support levels, notable at $211.29 & between a zone of $209.19-209.29.
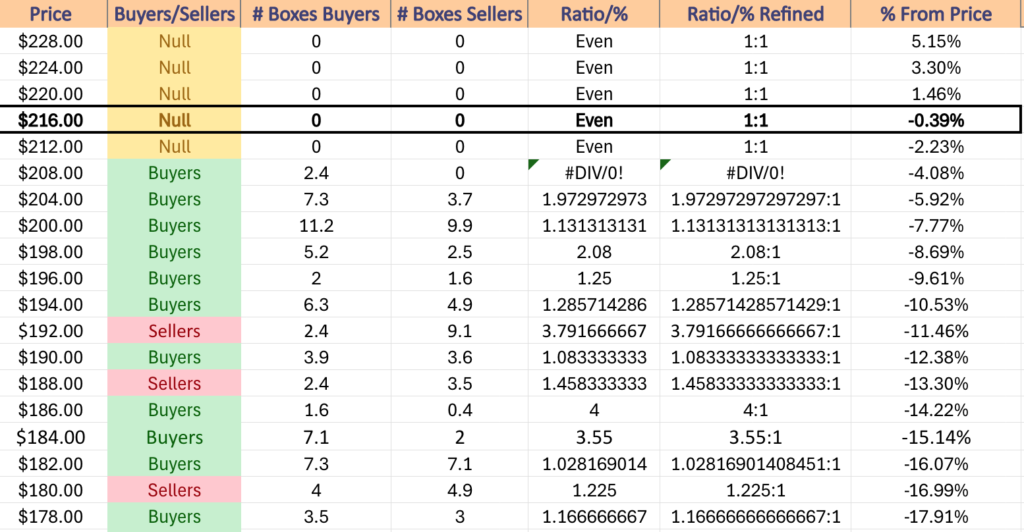
IWM’s support level strength will also have a few caveats, as prices are currently in a “NULL” range where there has yet to be enough data to sample in regards to buyer:seller strength, but there has been activity.
The next 8-10% downward is all buyer dominated, with the $198-199.99 zone currently the strongest & no seller zones until $192-193.99 (although that one is quite seller heavy, at 3.79:1).
IWM has support at the $212.97 (10 Day Moving Average, Volume Sentiment: NULL, 0:0*), $211.29 (Volume Sentiment: Buyers, 2.4:0*), $209.29 (Volume Sentiment: Buyers, 2.4:0*) & $209.19/share (Volume Sentiment: Buyers, 2.4:0*) price levels, with resistance at the $226.64/share (52-Week High, Volume Sentiment: NULL, 0:0*) price levels.
DIA, the SPDR Dow Jones Industrial Average ETF gained +0.71% last week, as volumes returned with Tuesday’s bullish session being the second highest volume session of the year.
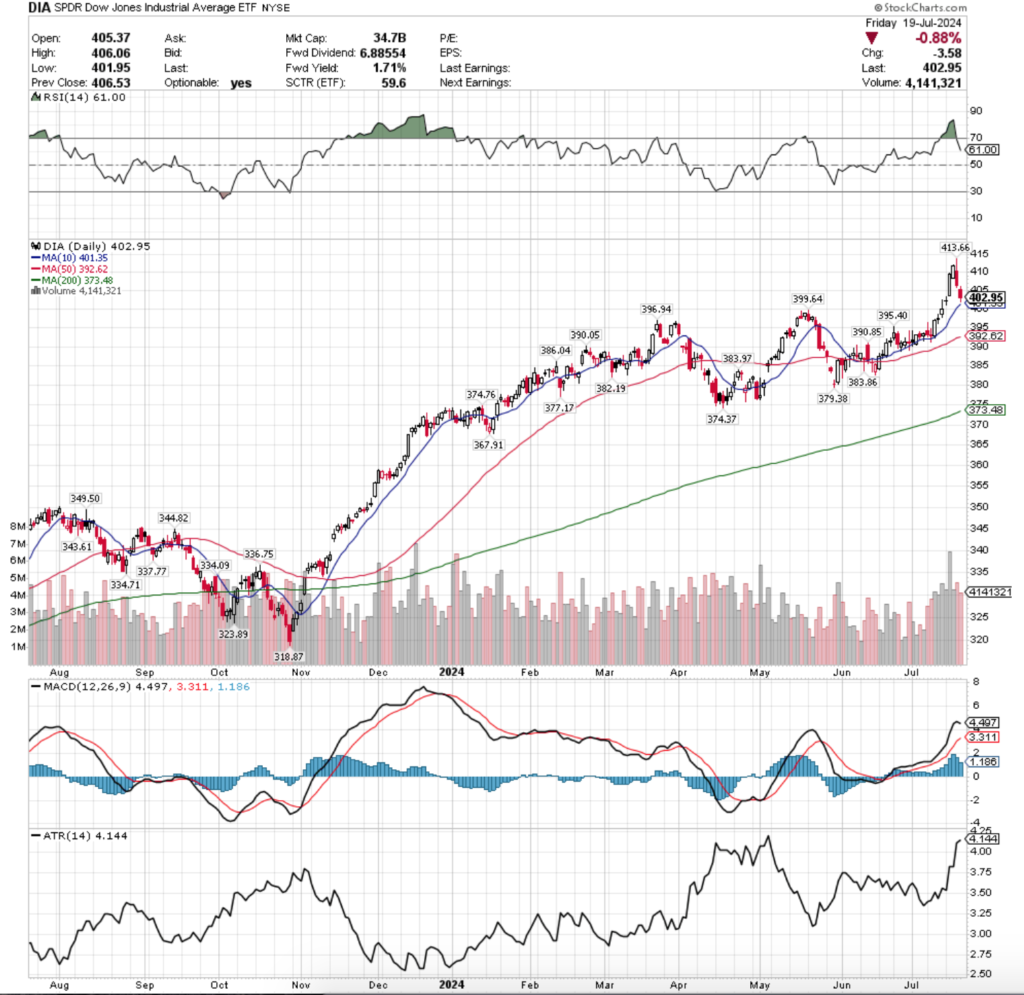
Their RSI has fallen from overbought levels since Thursday’s declines & currently sits at 61, while their MACD has curled over aggressively bearishly towards the signal line & the histogram shows impending weakness.
Volumes were +39.98% above average compared to the year prior last week (4,934,840 vs. 3,525,322), as it appears nature has (at least temporarily) healed, but the same concerns mentioned prior about how ~20% of the annualized average volume calculation has brought lower input levels & thus a lower average.
DIA is similar to IWM these days, as we’ve noted weekly for months now, mostly due to the fact that NVDA & other AI names are not components of them & have been driving SPY & QQQ higher for months now.
Monday kicked off last week on higher than average volume for DIA vs. the levels seen for the last few months, but indecision was in the air as the session opened up a gap up, but closed on a doji.
Tuesday the buyers came out in bunches to force prices to open on a gap up & a wide range session that resulted in a strong advance.
The tide signaled impending change on Wednesday though, when prices opened below Tuesday’s close & forced their way higher, but on less enthusiastic volume, indicating that there wasn’t much fuel left in the tank & signaling that there would indeed be some near-term profit taking.
Had Wednesday’s open not been below Tuesday’s close there would have been an evening star pattern created based on Thursday’s declining session, where the profit takers came out of the woodwork forcing the second highest volume session of the week on declines.
While it’s not a traditional shooting star, Thursday’s close carries with it the same negative sentiment in terms of a daily candle shape, bears adamantly denied the bullish attempt higher that did reset the all-time high for DIA & forced the close to be lower on the day.
Friday the negative sentiment continued, as volumes were slightly lower but still high on a gap down open that ultimately resulted in further declines on the day heading into the close.
The day’s lower shadow is larger than the upper one, signaling that there was (and still is) more room for downside movement as far as market participants are concerned, with the proximity of the 10 day moving average’s support to the price likely being one of the factors that managed to keep the close as high as it was.
IWM & DIA have traded similarly while they missed out on the AI-mania buying craze, and all eyes will be on watching the strength of the 10 DMA’s support & how the consolidation/trading range of the past few months holds up as strength of support levels.
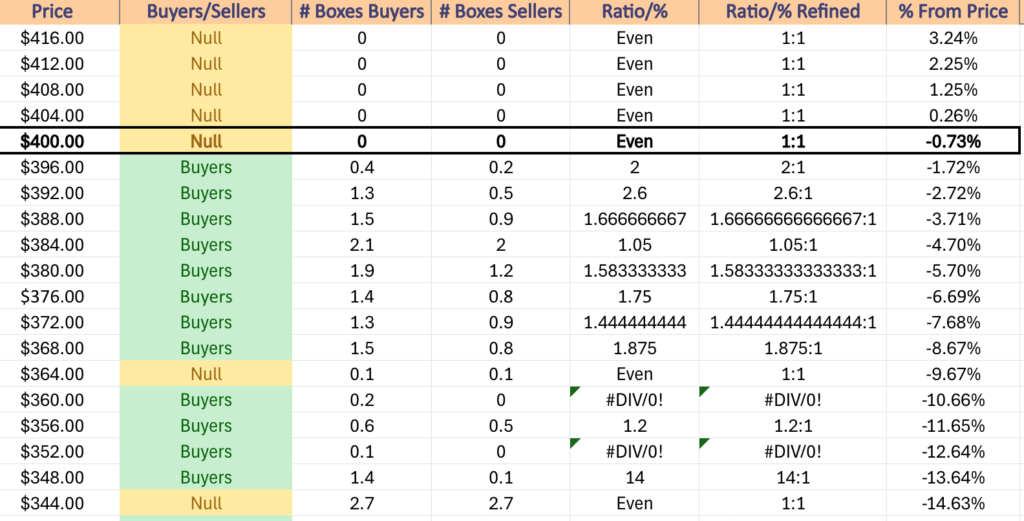
Based on how congested the space is between the 50 & 10 DMAs it is unclear if if prices will wind up consolidating between them ever or if we skip to them dipping below the two moving averages & then hoping for strength of support from the levels in the $380’s, in which case the $383-383.99 zone will likely be the strongest based on the total number of touch-points there.
Should those be broken, the $373-374 range also has a handful of support points, including the 200 day moving average & the next lowest level has the strongest buyer:seller sentiment ($368-371.99 is 1.88:1 Buyers:Sellers).
Daily volumes will give the clues as to what might happen & should be watched closely in the next few weeks.
DIA has support at the $401.35 (10 Day Moving Average, Volume Sentiment: NULL, 0:0*), $399.64 (Volume Sentiment: Buyers, 2:1), $396.94 (Volume Sentiment: Buyers, 2:1) & $395.40/share (Volume Sentiment: Buyers, 2.6:1) price levels, with resistance at the $413.66/share (All-Time High, Volume Sentiment: NULL, 0:0*) price levels.
The Week Ahead
The new week kicks off on a quiet note as there is no major economic data scheduled for release on Monday.
Monday’s before the bell earnings reports include Bank of Hawaii, IQVIA, Truist Financial & Verizon Communications, with Agilysys, AGNC Investment, Alexandria RE, BOK Financial, Brown & Brown, Cadence Bank, Cadence Design, Calix Networks, Cathay Bancorp, Cleveland-Cliffs, Crown Holdings, Equity Lifestyle Properties, HealthStream, Medpace, Nucor, NXP Semiconductors, RLI Corp, Simpson Manufacturing, W.R. Berkley & Zions Bancorp scheduled to report after the session’s close.
Existing Home Sales data is released Tuesday at 10 am.
Tuesday morning kicks off with A.O. Smith, Albertsons, Avery Dennison, Banc of California, Coca-Cola, Community Financial System, Constellium, Danaher, First Bancorp, Franklin Electric, Freeport-McMoRan, GATX, GE Aerospace, General Motors, Genuine Parts, HCA, Herc Holdings, Invesco, Kimberly-Clark, Lockheed Martin, Moody’s, MSCI, Northwest Bancshares, Old National Bancorp, PACCAR, Pentair, Philip Morris International, Polaris Industries, PulteGroup, Quest Diagnostics, Sherwin-Williams, Spotify, UPS & Webster Financial reporting earnings, followed by Alphabet, Artisan Partners Asset Management, Brandywine Realty, Cal-Maine Foods, Canadian National Railway, Capital One Financial, Chubb, CoStar Group, East West Bancorp, EastGroup, Enova International, Enphase Energy, EQT Corp., First Commonwealth, Matador Resources, Mattel, Nabors Industries, Packaging Corp of America, PennyMac, Range Resources, Red Rock Resorts, Renasant, Retail Opportunity Investments, Seagate Technology, Tesla, Texas Instruments, Trustmark, Veritex Holdings, Vicor & Visa, West Fraser Timber after the closing bell.
New Home Sales data comes out Wednesday morning at 10 am.
Alkermes, Allegion, Amphenol, AT&T, Boston Scientific, Check Point Software, Chemed, CME Group, Evercore, FirstService, Fiserv, Fortive, GE Vernova, General Dynamics, Group 1 Auto, Healthcare Services Group, Interpublic, International Paper, KBR, Lamb Weston, Lennox International, Navient, NextEra Energy, NextEra Energy Partners, Old Dominion Freight Line, Pacific Premier, Popular, PROG Holdings, Rogers Communications, Roper, Rush Enterprises, Silicon Labs, Taylor Morrison Home, TE Connectivity, Teledyne Technologies, Tenet Healthcare, Thermo Fisher Scientific, Tower Semiconductor, Travel + Leisure, United Community Banks, Vertiv, Wabash National & Weatherford International report earnings on Wednesday morning, with Chipotle Mexican Grill, Alamos Gold, Align Technology, Ameriprise Financial, Canadian Pacific Kansas City, Carlisle Cos, Celestica, Century Communities, Churchill Downs, Community Health, Core Labs, Edwards Lifesciences, Essential Properties Realty Trust, First American Financial, Flex, Ford Motor, Globe Life, Graco, Helmerich & Payne, IBM, ICON, Impinj, Invitation Homes, Kaiser Aluminum, KLA Corp, Knight-Swift Transportation, MaxLinear, Meritage Homes, Methanex, Moelis, Molina Healthcare, Newmont, Oceaneering International, O’Reilly Automotive, Pathward Financial, Pebblebrook Hotel Trust, Pegasystems, Plexus, QuantumScape, RenaissanceRe, Republic Services, Rollins, Sallie Mae, ServiceNow, South State, Teradyne, Tyler Technologies, United Rentals, Universal Health, Valmont Industries, Viking Therapeutics, Waste Connections, Waste Management & Wyndham Hotels & Resorts all scheduled to report after the session’s close.
Thursday the action picks up at 8:30 am when GDP, Initial Jobless Claims, Durable-Goods Orders, Durable-Goods minus Transportation, Advanced U.S. Trade Balance in Goods, Advanced Retail Inventories & Advanced Wholesale Inventories data are all scheduled for release.
AbbVie, Arch Resources, AstraZeneca, Bread Financial, Brunswick, CBRE Group, Comcast, Cullen/Frost, Darling Ingredients, Dover, Dow, DTE Energy, EMCOR Group, Expro Group, FTI Consulting, Harley-Davidson, Hasbro, HNI, Honeywell, IMAX, Integer Holdings, Keurig Dr Pepper, Lazard, Lear, LKQ, Masco, Mohawk, NASDAQ, Northrop Grumman, NovoCure, Pool, Precision Drilling, Reliance, RPM, RTX, Ryder System, Sanofi, Southside Banc, Southwest Air, STMicroelectronics, TechnipFMC, Teck Resources, Tractor Supply, Tradeweb Markets, TransUnion, TRI Pointe Homes, Union Pacific, Valero Energy, Valley National, Visteon & West Pharmaceutical Services all report earnings before Thursday’s opening bell, followed by Agnico-Eagle Mines, Allison Transmission, Ameris Bancorp, AppFolio, Arthur J. Gallagher, Baker Hughes, BJ Restaurants, Boston Beer, Boyd Gaming, Cincinnati Financial, Columbia Banking, Columbia Sportswear, Coursera, Cousins Properties, Customers Bancorp, Deckers Outdoor, Dexcom, Digital Realty Trust, Eastman Chemical, Edison, Exponent, Federated Hermes, First Financial Bancorp, First Interstate Bancsystem, Gaming and Leisure Properties, Hartford Financial, Healthpeak Properties, Juniper Networks, Kinsale Capital, L3Harris Technologies, LendingTree, LPL Financial, McGrath RentCorp, Minerals Technologies, NOV, Olin, Phillips Edison & Company, Principal Financial Group, Provident Financial Services, Selective Insurance, Skechers USA, SkyWest, SPS Commerce, SS&C Technologies, Terex, Texas Roadhouse, TFI International, Ultra Clean Holdings, Veralto, VeriSign, WesBanco, Weyerhaeuser, Willis Towers Watson & WSFS Financial after the closing bell.
Friday morning is also a busy one on the data-front, starting at 8:30 am when we get Personal Income (nominal), Personal Spending (nominal), PCE Index, PCE Year-over-Year, Core PCE Index & Core PCE Index Year-over-Year data, followed by Consumer Sentiment (final) data at 10 am.
3M reports earnings Friday morning, along with AllianceBernstein, Aon, Avantor, Balchem, Barnes Group, Booz Allen Hamilton, Bristol-Myers Squibb, Centene, Charter Communications, Colgate-Palmolive, First Hawaiian, Franklin Resources, Gentex, GrafTech International, Imperial Oil, Newell Brands, Portland General Electric, Saia, Sensient, Stellar Bank, T. Rowe Price, TriNet Group & WisdomTree.
See you back here next week!
*** I DO NOT OWN SHARES OR OPTIONS CONTRACT POSITIONS IN SPY, QQQ, IWM OR DIA AT THE TIME OF PUBLISHING THIS ARTICLE ***