SPY, the SPDR S&P 500 ETF gained +1.91%, as weak volumes continued to plague the major index ETFs, while the VIX closed the week out at 12.48, implying a one day move of +/-0.79% & a one month implied move of +/-3.61%.
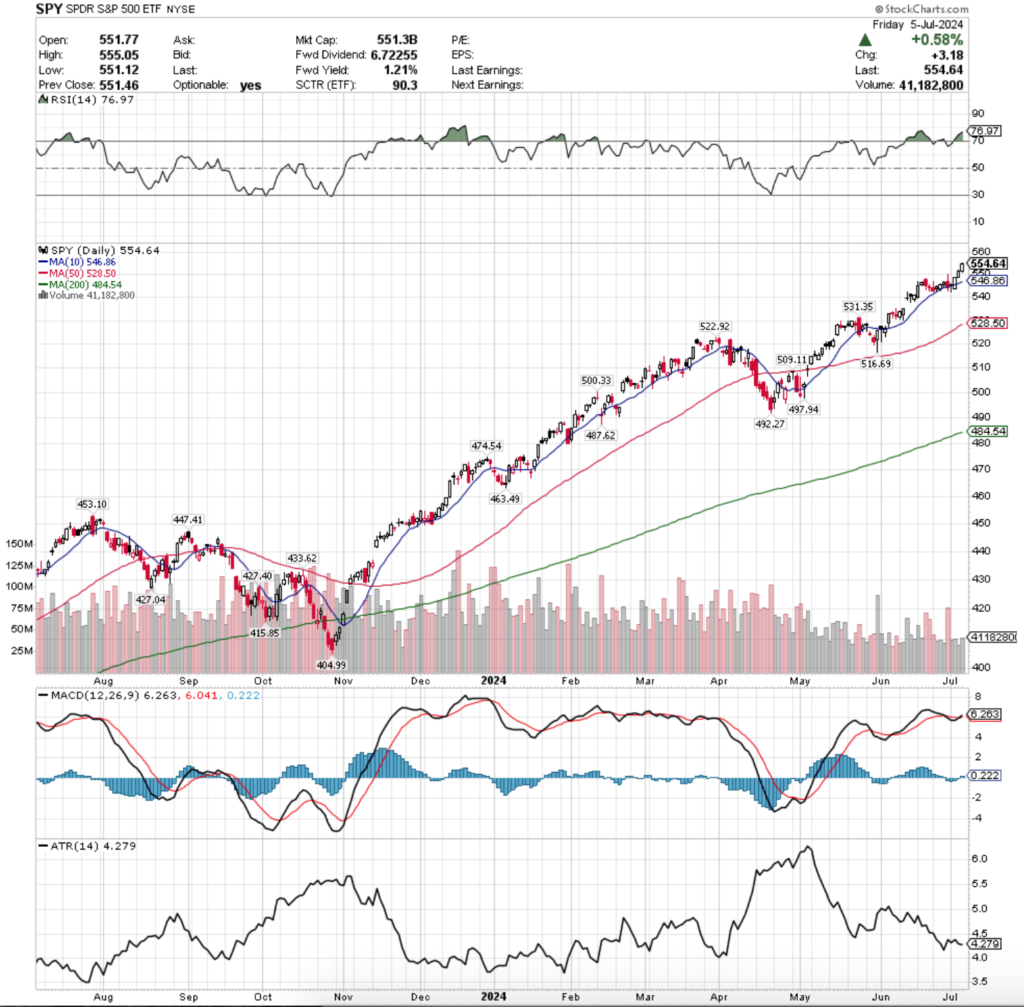
Volumes were well below average for the ninth consecutive week, coming in at -46.16% below the year prior’s average volume (38,725,950 vs. 71,930,498), which as we’ve noted each week is an area of increasing concern.
Despite the Fourth of July holiday & the half day trading session on the third reducing the week by ~30% there was still frothy light volume for now the ninth consecutive week.
While it is summertime, the low levels are still indicative of fear & reluctance to dive into markets while most of major indexes sit near all-time highs.
Monday signaled that the week ahead was likely in line with most peoples’ expectations, weak volume, but advancing.
A dragonfly doji set the stage for SPY to climb for the rest of the week, although the open & close were relatively in line with the 10 day moving average, which while it indicates that there is some strength in it as a support level, should be a cause of concern.
The rest of the week (which again, was 70% of a regular week in terms of the hours the market was open) continued to climb above the 10 DMA, but on volumes that looked more like the attendance at a kindergarten soccer game vs. a publicly traded ETF following the S&P 500.
Their RSI has climbed back into overbought territory after the surprise advances of the past week & currently sits at 76.97, while their MACD has crossed over bullishly, but is still tightly hugging the signal line.
While folks will say there is a stronger trend when candles are covering a wider range (particularly with little to no shadows), there is very little conviction behind the recent price movements.
This upcoming week has limited data releases aside from the CPI/PPI prints on Thursday & Friday, but earnings season is revived with the first of the big banks scheduled to report on Friday.
Indicators & oscillators suggest that the time for a mid-summer cool off is upon us, and the biggest question for most right now is what’s going to cause it?
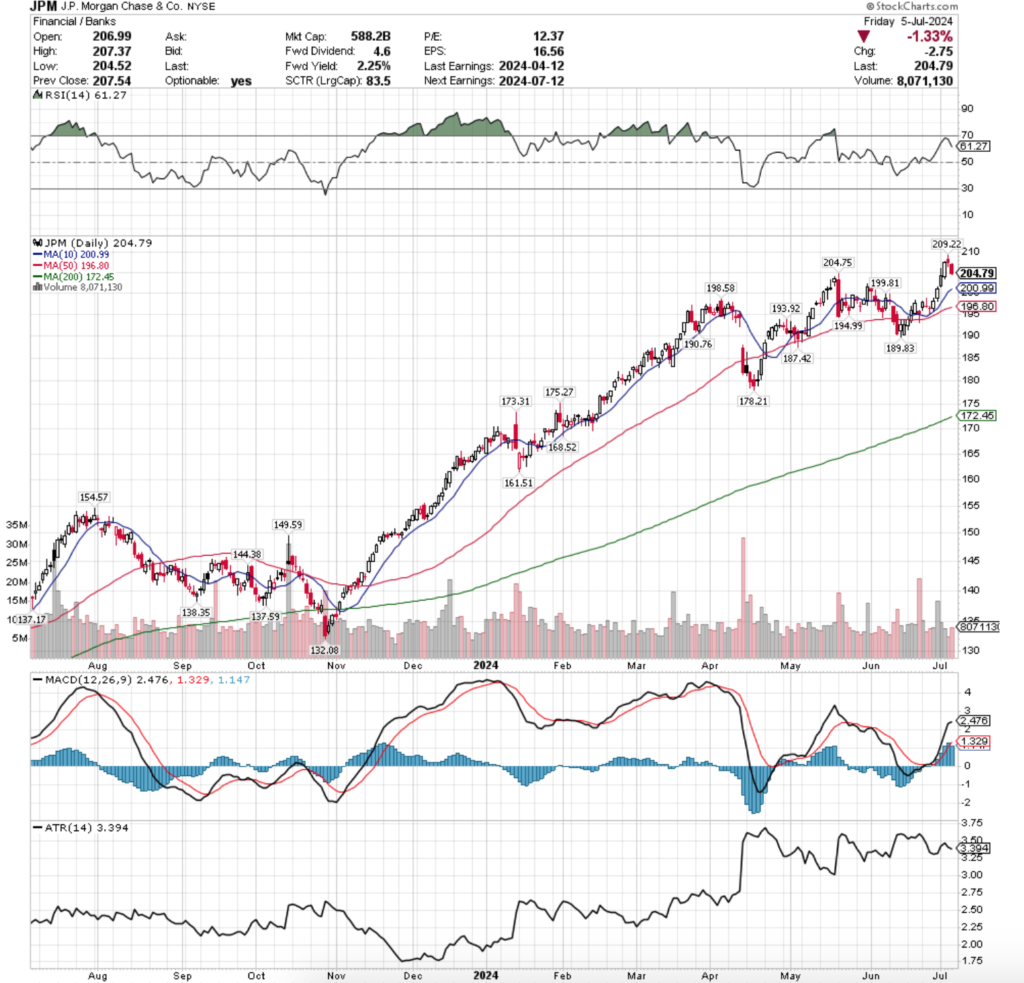
JPM’s chart’s evening star pattern seems to think so (per Sunday night reading, vacation time so this won’t be published until Wednesday PM) & bank stocks control the spigot that supplies the market hose (also hat tip to Jaime Dimon as this may be the first time a weekly post has featured an individual stock name).
Not much has changed in terms of what to look at for SPY from last week’s note given the nature of how it traded & on the shorter time frame.
While they managed a new all-time high, the amount of conviction & sentiment behind the move was minimal at best & it appears that we’re skating on thin ice.
Based on the prolonged low volumes (9 weeks now), it is hard to imagine much of a catalyst given where markets stand now that would be able to power SPY & co. much higher in the near-term.
As noted last week, it’s still more of a question of whether we have a small consolidation or outright correct.
Volatility decreased slightly last week, but again, not much has changed from last week in terms of what to keep an eye on.
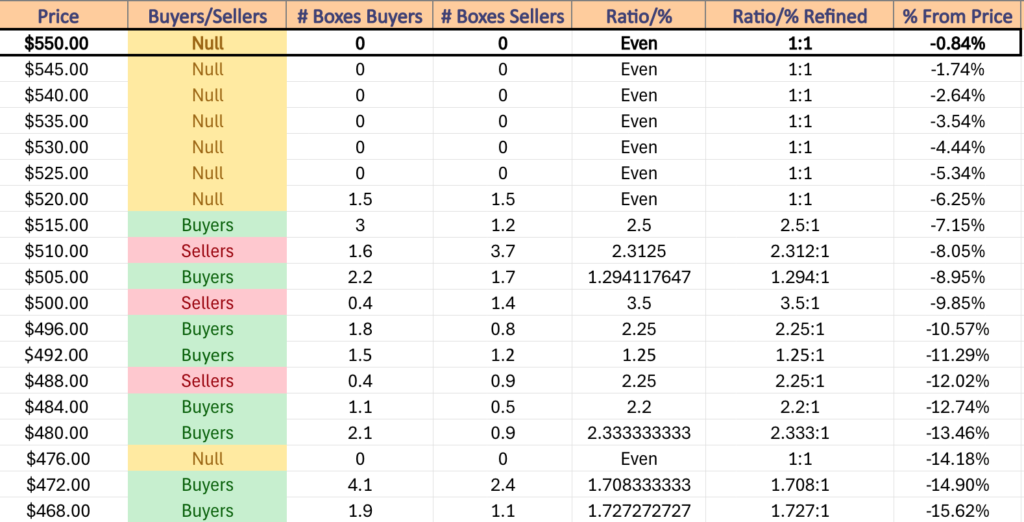
SPY has support at the $546.86 (All-Time High, Volume Sentiment: NULL, 0:0*), $531.35 (Volume Sentiment: NULL, 0:0*), $528.50 (50 Day Moving Average, Volume Sentiment: NULL, 0:0*) & $522.92/share (Volume Sentiment: Even, 1:1) price levels, with resistance at the $555.05/share (All-Time High, Volume Sentiment: NULL, 0:0*) price level.
QQQ, the Invesco QQQ Trust ETF that tracks the NASDAQ 100, had the strongest week of the major four index ETFs, advancing 3.56%.
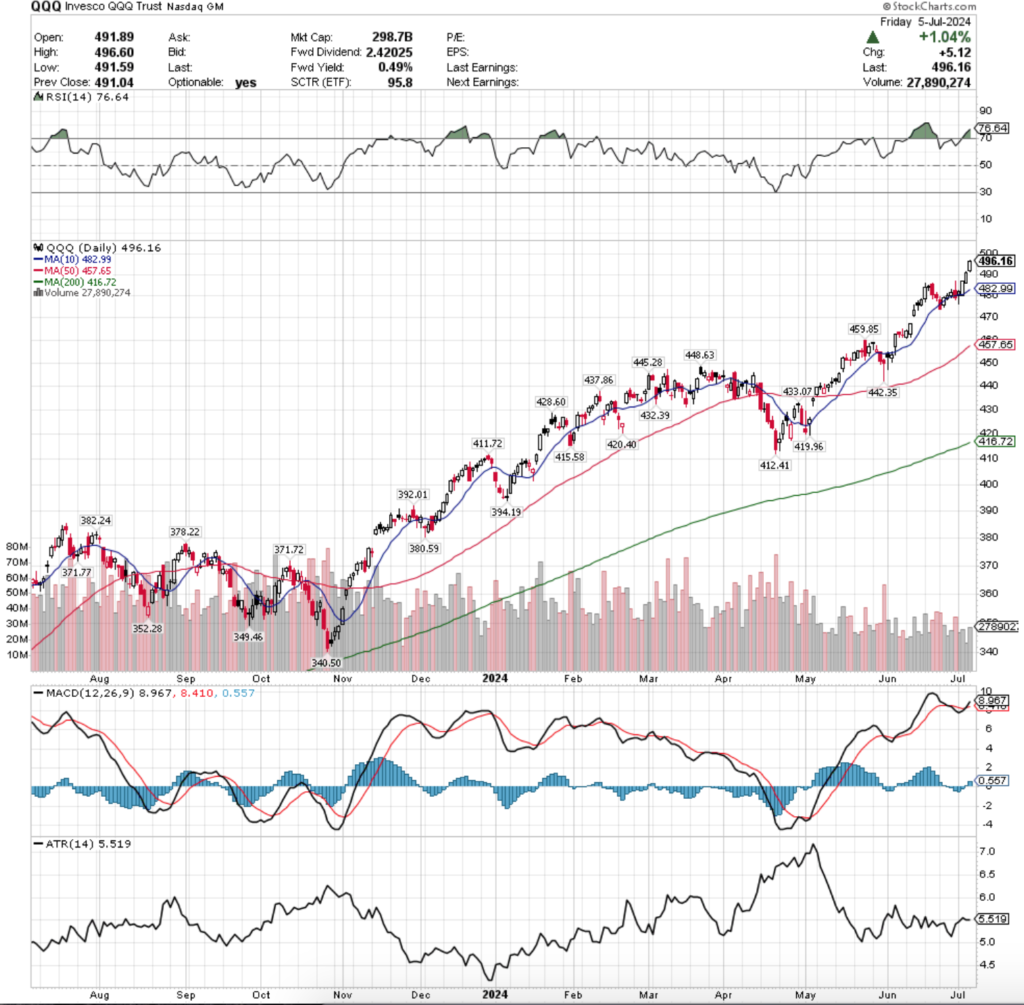
Their RSI has also trended into overbought territory & is currently 76.64, while their MACD has crossed over bullishly in the past week.
Volumes were -45.52% below the year prior’s average volume (24,538,100 vs. 45,038,444), as much like SPY & the other major index ETFs, everybody’s moved.
The primary difference between QQQ’s chart & SPY’s chart is the hammer candle from Monday’s session.
This indicated more conviction behind the move higher, contributing to QQQ being the strongest performing major index ETF of the four.
With the fluffy volume last week’s primary areas to look at are all still in play, perhaps we learn that last week was a silent squeeze.
For those that missed last week’s note, the strength of the 10 day moving average will set the stage for the next 3-4 weeks for QQQ & SPY.
The new all-time highs only make the declines more troubling, given that the primary support level is the 10 DMA, which is moving higher by its nature & becoming more decoupled from the regular price point support levels.
There is next to no volume strength at these levels, making a consolidation easily able to turn into a more serious decline.
CPI/PPI aren’t necessarily what market participants are holding in as high of regard for an inflation read vs. PCE, so what happens during earnings calls starting Friday will likely be what queues an issue, as it seems unlikely that folks have been holding out this much eagerly anticipating earnings reports to dive back into the pool.
For last week’s post & the areas to continue watching see here.
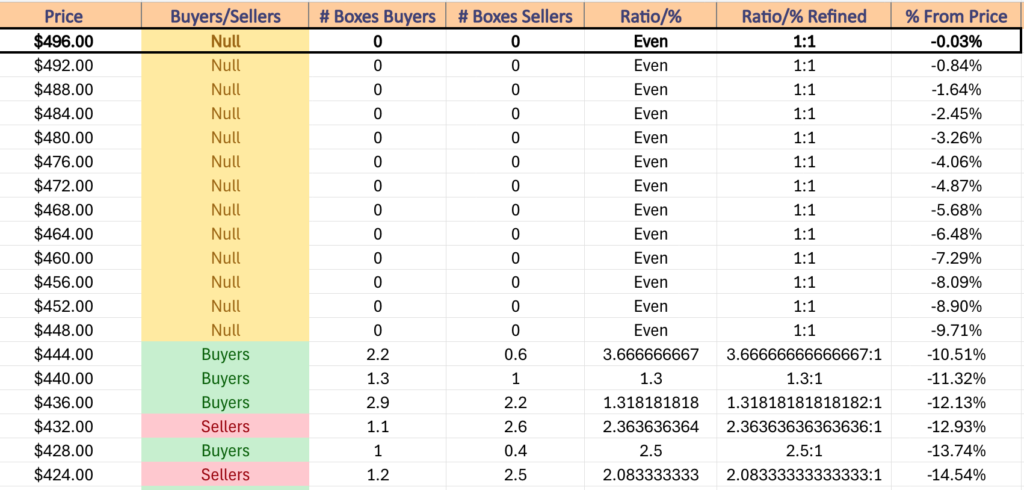
QQQ has support at the $482.99 (10 Day Moving Average, Volume Sentiment: NULL, 0:0*), $459.85 (Volume Sentiment: NULL, 0:0*), $457.65 (50 Day Moving Average, Volume Sentiment: NULL, 0:0*) & $448.63/share (Volume Sentiment: NULL, 0:0*) price levels, with resistance at the $496.60/share (All-Time High, Volume Sentiment: NULL, 0:0*) price level.
IWM, the iShares Russell 2000 ETF had the worst week of the major four index ETFs, declining -1% for the week.
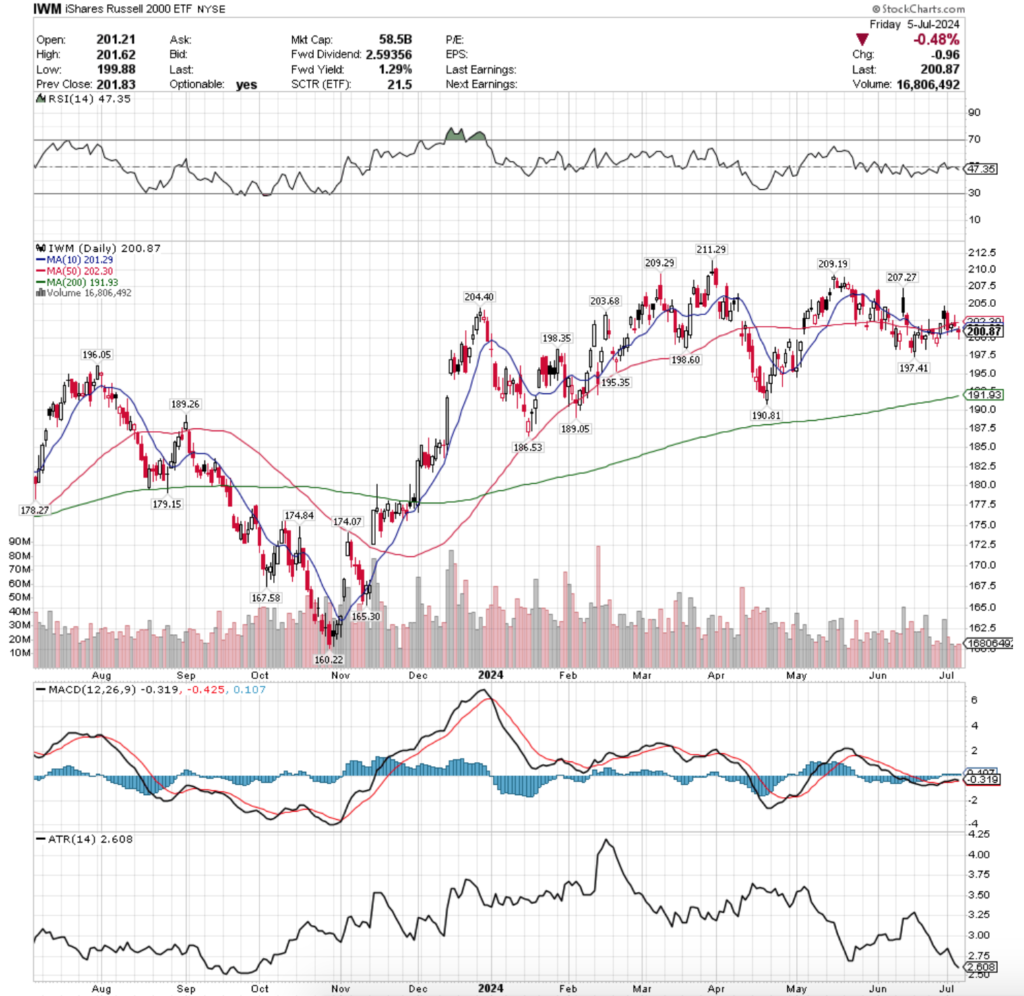
Their RSI is trending downward from the neutral level & sits currently at 47.35, while their MACD has been bullish, but remains tightly hugging the signal line due to the recent consolidation range IWM has traded in.
Volumes were -46.43% below average compared with the year prior (17,881,775 vs. 33,382,304), as even the small cap index can’t escape the lazy summer participation.
As has been noted every week for some time now, IWM & DIA charts have decoupled from SPY & QQQ for a while now, as AI names & other major tech components of the former indexes have helped keep them moving higher, while the former have spent more time consolidating.
What becomes more troubling about this is that since early May IWM has been consolidating alongside DIA, while SPY & QQQ have continued marching higher.
In the event of a consolidation or correction in SPY & QQQ, a large question becomes whether that will cause an equal reaction from IWM & DIA, or if it will cause some sort of pivot into their components & they will avoid major losses.
Monday last week began on a bearish note with prices opening mid-way through Friday’s range, testing below the support of both the 10 & 50 day moving averages, before ultimately settling just above the 10 DMA, but below the 50 DMA on the week’s highest volume session.
Tuesday made an attempt to break back above the 50 DMA, but was unsuccessful & closed just beneath it, but cracks were shown in IWM as prices temporarily dipped beneath the 10 DMA as well.
The weakness was confirmed with Wednesday & Friday’s sessions, when on Wednesday prices opened in line with the 50 day moving average before bounding higher to above the 50 day moving average, only to close lower, closer to in-line with the prior day’s close on the weakest volume of the week.
It should be noted that Wednesday was a half-day & should it have been a full session it was possibly going to be the highest volume of the week, but the candle closed as what would have been a shooting star if it occurred in a true uptrend, indicating bearish feeling.
The trouble continued into the close of the week when prices opened on a gap down in-line with the 10 DMA, only to temporarily dip above it before testing far below it & closing beneath the support of the 10 DMA.
The strength of the support zone between $197-198.60 will be a key area of focus in the coming weeks now that prices have broken down beneath the 10 & 50 day moving averages & while we await more meaningful volume to indicate strength of sentiment of IWM traders.
For last week’s post & the areas to continue watching see here.
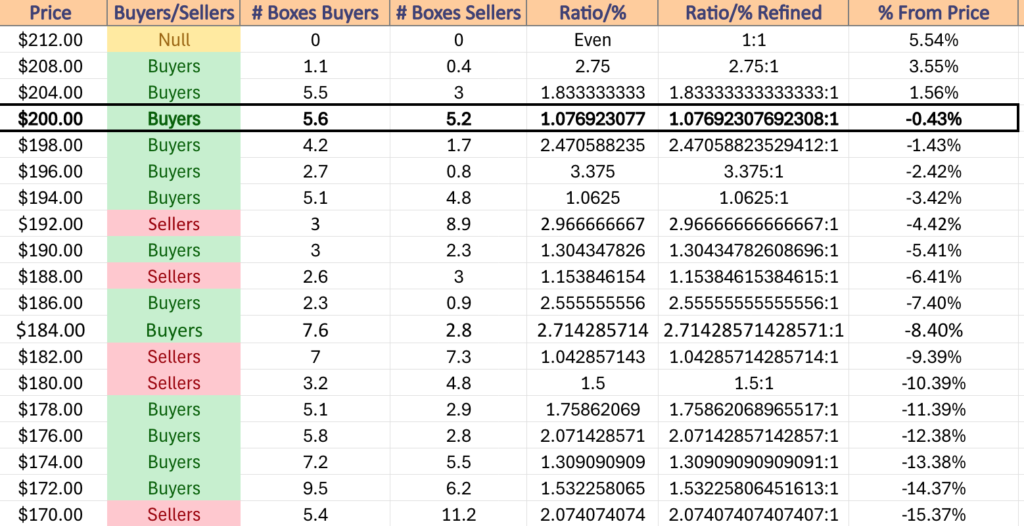
IWM has support at the $198.60 (Volume Sentiment: Buyers, 2.47:1), $198.35 (Volume Sentiment: Buyers, 2.47:1), $197.41 (Volume Sentiment: Buyers, 3.38:1) & $195.35/share (Volume Sentiment: Buyers, 1.06:1) price levels, with resistance at the $201.29 (10 Day Moving Average, Volume Sentiment: Buyers, 1.08:1), $202.30 (50 Day Moving Average, Volume Sentiment: Buyers, 1.08:1), $203.68 (Volume Sentiment: Buyers, 1.08:1) & $204.40/share (Volume Sentiment: Buyers, 1.83:1) price level.
DIA, the SPDR Dow Jones Industrial Average ETF climbed +0.66% last week.
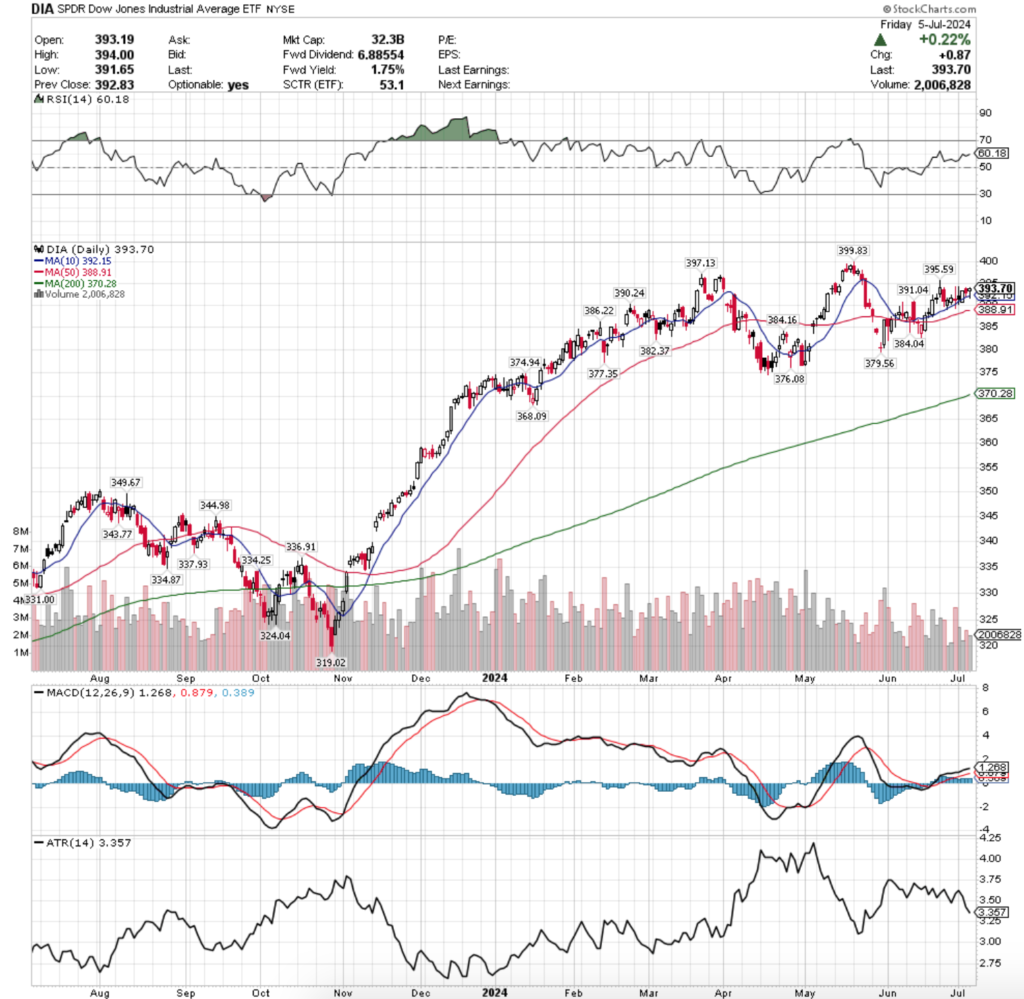
Their RSI is trending towards overbought (70) & currently sits at 60.18. while their MACD has stayed bullish following their recent consolidation.
Volumes were -38.48% below average compared with the year before’s average volumes (2,144,550 vs. 3,485,855), where it appears investors were doing the bare minimum to keep it afloat above the support of the 10 DMA.
Monday began DIA’s week on a weak outlook, where despite the week’s highest volumes prices were unable to crack above the prior Friday’s high & ultimately closed below where they opened just in-line with the 10 DMA’s support.
Tuesday opened below the 10 DMA, but was able to rally & push higher to close higher, but it should be viewed with a skeptical eye as despite completing the bullish engulfing 2 day pattern, the day’s wide range was not supported by the low volume.
Wednesday came in bearish for DIA, opening higher but showing that there was still more downside appetite than upside, as it tested the support of the 10 DMA, but ultimately closed just beneath Tuesday’s close.
It should be noted that the downside volume on Wednesday was slightly less than the upside volume on Monday, calling into question/further confirming the skeptical eye mentioned regarding Tuesday’s price action.
Friday ended the week on a further note of uncertainty, as the case for the bulls heading into the weekend was that the open-close price action was concentrated at the top of the day’s candle, but the reality of it was that the high of the day failed to break out of the recent high-range & the low of the day broke through the 10 DMA’s support.
The coming week’s performance will hinge upon whether or not that high range can be broken out of & or if the support of the 10 & 50 DMAs will be broken to the downside.
Their recent ascending triangle forming indicates that there is more appetite at the top of their recent trading range, but the lackluster volumes of the past couple of months don’t provide as much confirmation as one would like to see.
For last week’s post & the areas to continue watching see here.
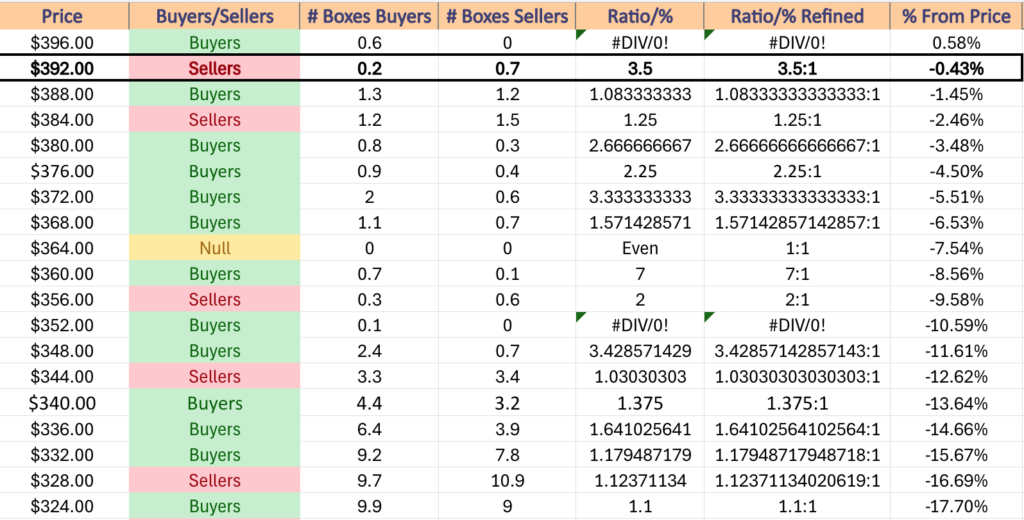
DIA has support at the $392.15 (10 Day Moving Average, Volume Sentiment: Sellers, 3.5:1), $391.04 (Volume Sentiment: Buyers, 1.08:1), $390.24 (Volume Sentiment: Buyers, 1.08:1) & $388.91/share (50 Day Moving Average, Volume Sentiment: Buyers, 1.08:1) price levels, with resistance at the $395.59 (Volume Sentiment: Sellers, 3.5:1), $397.13 (Volume Sentiment: Buyers, 0.6:0*) & $399.83/share (All-Time High, Volume Sentiment: Buyers, 0.6:0*) price level.
The Week Ahead
Next week begins on a slow note with Consumer Credit data released on Monday at 3pm.
Greenbrier reports earnings on Monday morning before the opening bell.
Tuesday brings us NFIB Optimism Index data at 6 am.
Helen of Troy reports earnings before Tuesday’s opening bell, before SMART Global reports after the close of trading.
Wholesale Inventories data is scheduled to be released Wednesday at 10 am.
Wednesday’s earnings calls include AZZ, PriceSmart &WD-40, all due to report after the closing bell.
Things heat up on Thursday with Initial Jobless Claims, Consumer Price Index, XPI Year-over-Year, Core CPI & Core CPI Year-Over-Year data at 8:30 am, followed by St. Louis Fed President Musalem speaking at 1pm &Monthly U.S. Federal Budget data at 2 pm.
Thursday morning kicks off with earnings from Delta Air Lines & Pepsi Co.
Friday the week wraps up with Producer Price Index, PPI Year-over-Year, Core PPI & Core PPI Year-over-Year data at 8:30 am, followed by Consumer Sentiment (prelim) data at 10 am.
Big bank earnings come back to town Friday, starting with JP Morgan Chase, Bank of New York Mellon, CitiGroup & Wells Fargo, with Fastenal also scheduled to report before the opening bell.
See you back here next week!
*** I DO NOT OWN SHARES OR OPTIONS CONTRACT POSITIONS IN SPY, QQQ, IWM OR DIA AT THE TIME OF PUBLISHING THIS ARTICLE ***