SPY, the SPDR S&P 500 ETF fell -2.12% last week, while the VIX closed the week at 23.39, implying a one day move of +/-1.47% & a one month move of +/-5.04%, as market volatility increased as SPY’s Average True Range shows.
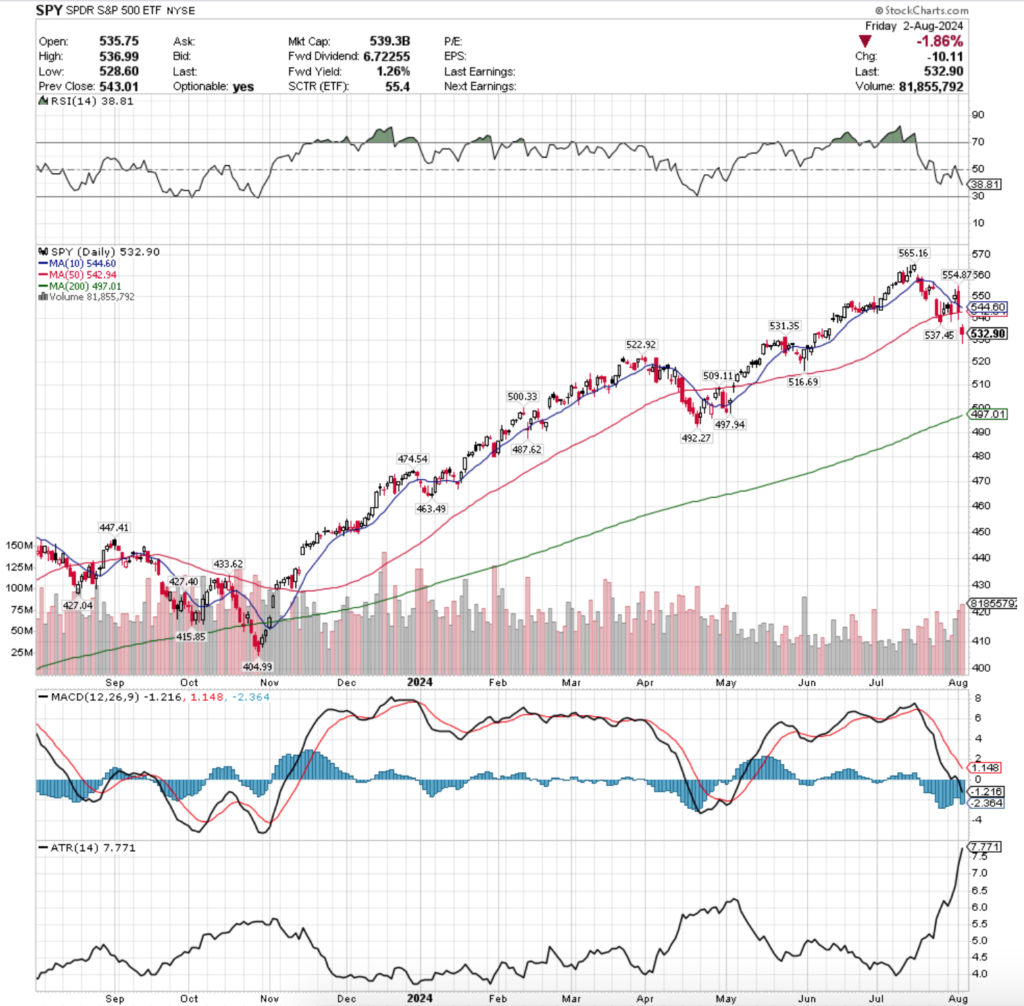
Their RSI is currently trending towards oversold levels & sits at 38.81, while their MACD continues its bearish freefall of the last couple of weeks.
Volumes were -11.6% lower than the previous year’s average level (62,220,620 vs. 70,382,825), which has continued to be a cause for concern given the declining volume, as the two highest volume sessions of last week came on declining days.
Monday kicked SPY’s last week off with a bearish sentiment, opening on a gap up from Friday’s close that tested higher, but ultimately closer lower than it opened.
Wedged between the 10 & 50 day moving averages it tested lower towards the 50 DMA more closely than it did to the upside at the 10 DMA & Monday’s session had the lightest volume of the week.
Tuesday the bearishness continued, as the session opened between the 10 & 50 DMA again, tested to the upside where the 10 DMA’s resistance denied it, tested to the downside & temporarily broke out below the support of the 50 DMA, before finally closing just above the 50 DMAs support.
Low volumes also plagued Tuesday’s session, before market participants began coming out more strongly on Wednesday through the rest of the week.
Wednesday was won by the bulls, but the bears were still out in strong force as shown by the tall upper shadow on the session’s candle, as a gap up open above the 10 DMA got market participants off of the sidelines & the 10 DMA’s support was able to sustain & keep the session’s prices propped up.
The session also resulted in a spinning top candle, indicating that there was a good deal of indecision among market participants.
Thursday is where the bears came out in full force for the rest of the week, as the session opened slightly higher than Wednesday & temporarily pushed higher, before SPY’s legs gave out underneath it & the price dropped below the 10 DMA & temporarily below the 50 DMA, before ultimately settling near the 50 DMAs support.
It was a risk-off heading into the weekend sentiment Friday, as prices opened on a gap down below the support of the 50 DMA on the highest volume of the week.
Between the high volumes of Thursday & Friday there was a lot of profit taking from Wednesday’s pump, and bearish sentiment had crept into markets.
With the 10 & 50 day moving averages both well above Friday’s closing price, this coming week’s focus should be on volume, particularly after such a long period of below average weekly volume.
SPY opened Monday down ~3%+ & has support nearby, but the intraday volumes will be what gives clues about what market participants will be doing next.
Monday’s volume is currently ~80% of what Friday’s was before noon, and if that negative sentiment continues on forward expect to see more declines throughout the upcoming week.
There is downward pressure from the 10 & 50 day moving averages which will also be something to consider when assessing the strength of support & resistance levels.
Upon a consolidation range it would be beneficial to be prudent & wait to see solid volume readings before diving back into the market, as volatility is expected to continue, so without a trend of solid, strong volume there are elevated near-term risks in SPY.
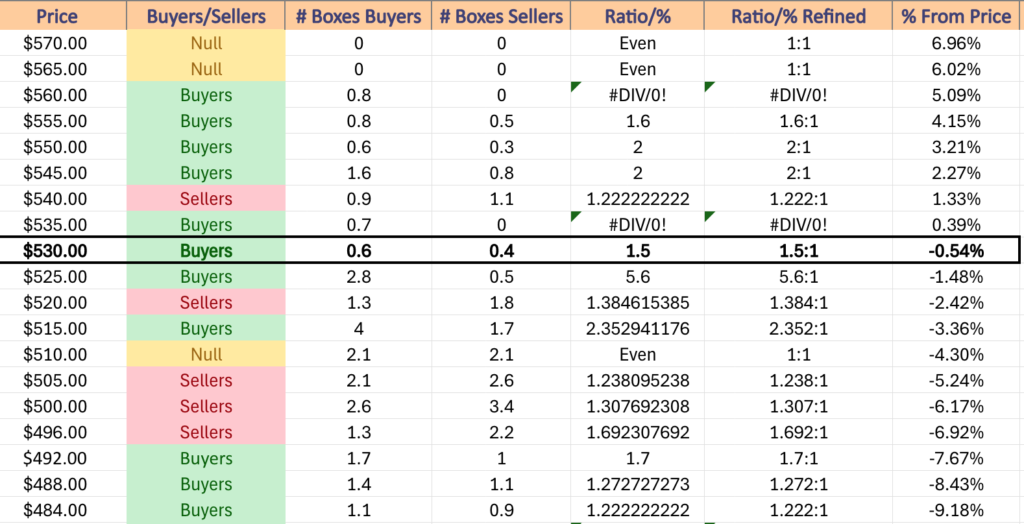
SPY has support at the $531.35 (Volume Sentiment: Buyers, 1.5:1), $522.92 (Volume Sentiment: Sellers, 1.38:1), $516.69 (Volume Sentiment: Buyers, 2.35:1) & $509.11/share (Volume Sentiment: Sellers, 1.24:1) price levels, with resistance at the $542.94 (50 Day Moving Average, Volume Sentiment: Sellers, 1.22:1), $544.60 (10 Day Moving Average, Volume Sentiment: Sellers, 1.22:1), $554.87 (Volume Sentiment: Buyers, 2:1) & $565.16/share (All-Time High, Volume Sentiment: NULL, 0:0*) price levels.
QQQ, the Invesco QQQ Trust ETF that tracks the NASDAQ 100 dropped -3.07% last week, as investors were eager to get out of the tech heavy names that make up a large portion of the index.
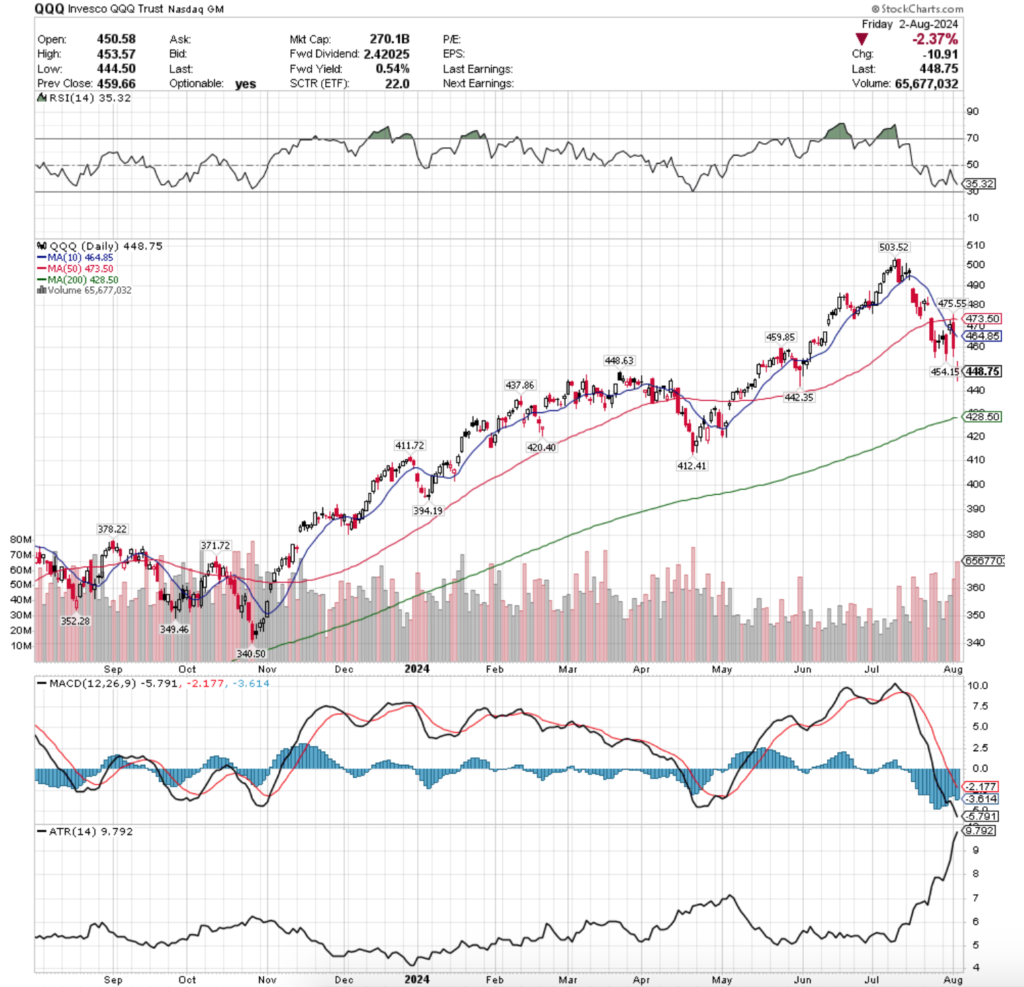
Their RSI is downtrending towards oversold levels & sits currently at 35.32, while their MACD is in bearish decline.
Volumes were +7.18% above average vs. the previous year (47,385,540 vs. 44,210,526), which should be cause for concern among market participants given that most of their volume came on declining sessions.
QQQ’s week looked very similar to SPYs, as has been the case for some time now as both have been driven by big tech’s strong performance this year.
Monday opened up with a spinning top that closed lower than it opened, expressing uncertainty with a side of negative sentiment & the session’s volume was the lowest of the week.
Tuesday the negative sentiment was confirmed, as the day resulted in declines & hosted a lower shadow that signaled that there was more downside appetite than where the session closed.
Volumes were also relatively muted on Tuesday though, as investors were still on the fence about which direction QQQ would ultimately move in.
Wednesday offered a glimmer of optimism, momentarily, as QQQ opened on a gap up around the 10 day moving average, tested slightly lower (lower shadow), before advancing up to the 50 DMAs resistance level & closing midway between the 10 & 50 day moving averages.
This was all wiped away on Friday though, when a wide-range bearish engulfing candle was the result of QQQ’s trading day & the close was well beneath the 10 & 50 DMAs’ resistance points.
Volumes ticked up for Thursday & continued to go even higher on Friday, when a -2.37% gap down session occurred, resulting in a spinning top candle, indicating that there was quite a bit of fear & uncertainty in QQQ & its components.
This bearish sentiment has carried over into the new week, and much like SPY, QQQ’s week ahead will be interesting to watch from a volume perspective to see where support really lies for the near-term.
QQQ has more nearby support levels than SPY due to their less rapid ascent over the past year, but there is still room for further declines, particularly if big tech profit taking & pivoting out of continues for the rest of the week.
XLK dipped beneath its 200 day moving average’s support on Friday & today’s (Monday) price range for QQQ has dipped below the 200 DMA’s support level, which carries more bearish sentiment moving forward.
Watching QQQ’s volume trends this coming week(s) will be what helps investors figure out where the floor may be for support for QQQ to consolidate in & form a base before they can continue higher.
If the 200 DMA’s support is unable to keep QQQ afloat, expect further declines in the near-term.
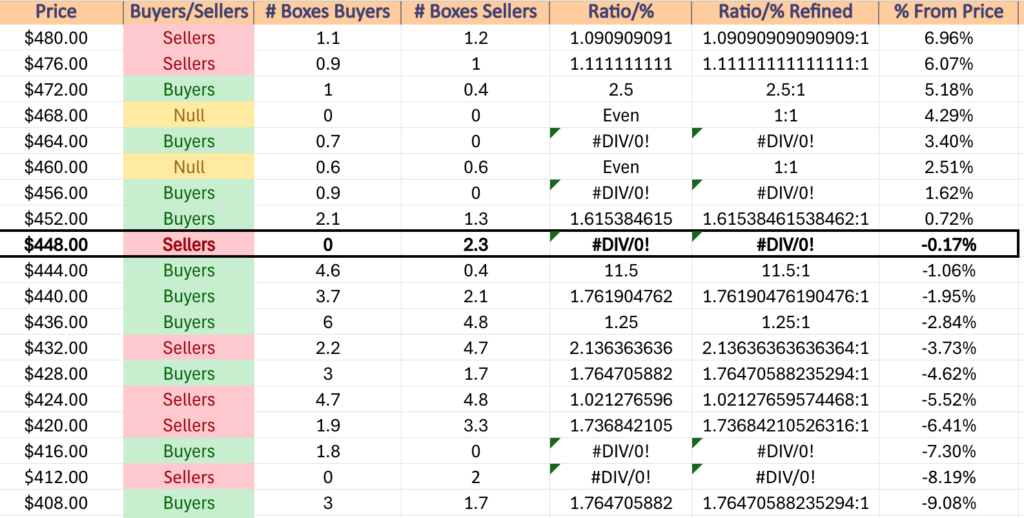
QQQ has support at the $448.63 (Volume Sentiment: Sellers, 2.3:0*), $442.35 (Volume Sentiment: Buyers, 1.76:1), $437.86 (Volume Sentiment: Buyers, 1.25:1) & $428.50/share (200 Day Moving Average, Volume Sentiment: Buyers, 1.77:1) price levels, with resistance at the $454.15 (Volume Sentiment: Buyers, 1.62:1), $459.85 (Volume Sentiment: Buyers, 0.9:0*), $464.85 (10 Day Moving Average, Volume Sentiment: Buyers, 0.7:0*) & $473.50/share (50 Day Moving Average, Volume Sentiment: Buyers, 2.5:1) price levels.
IWM, the iShares Russell 2000 ETF declined -6.82%, as small caps were the least favorite of the major four indexes & profit taking from their recent pump up came into fashion.
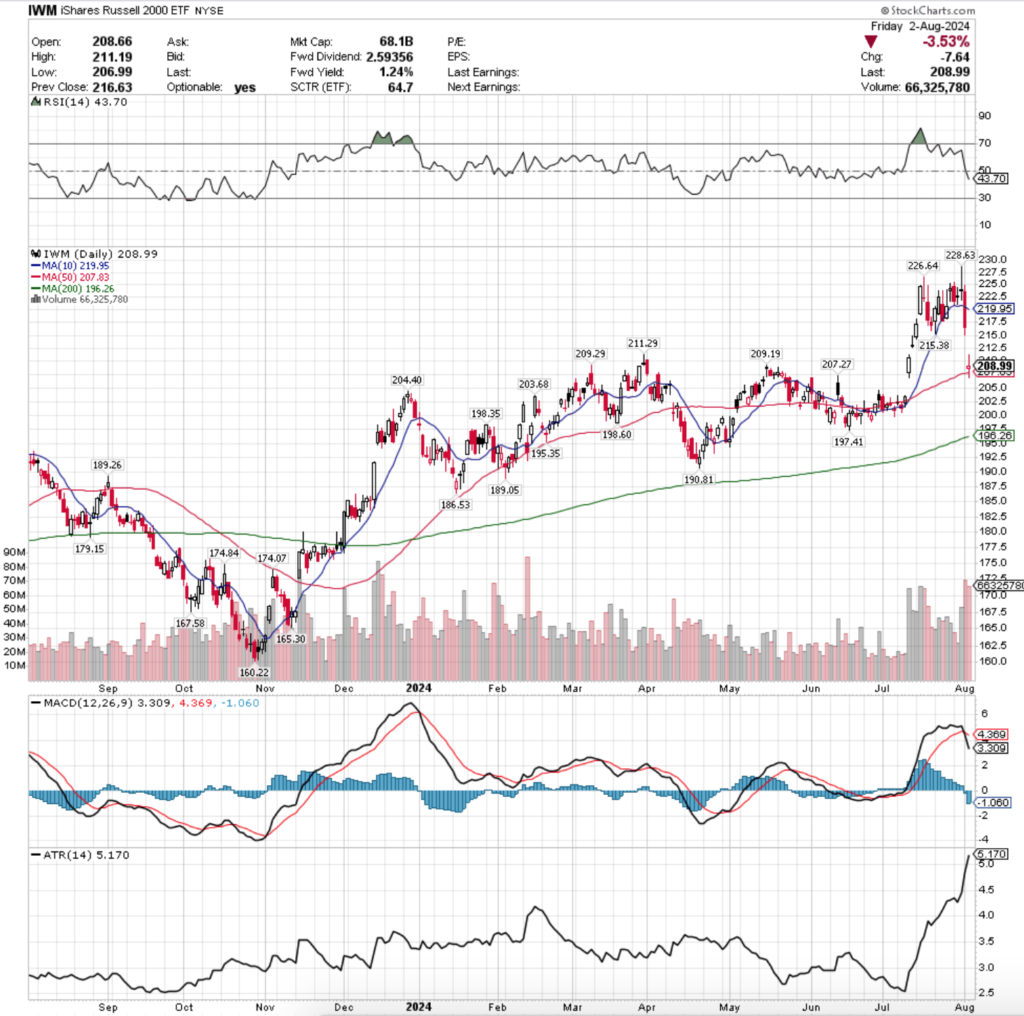
Their RSI is trending bearishly towars oversold & sits currently at 43.7, while their MACD recently crossed over bearishly.
Volumes were +44.33% above average compared to the prior year (50,274,600 vs. 34,832,746), driven mostly by late in the week profit taking following their strong July 2024 performance.
Monday signaled it was near the end of the line for IWM’s recent rally, as a bearish engulfing candle on low volumes kicked the week off; however the 10 day moving average’s support remained strong & in tact.
Tuesday the low volume theme continued but uncertainty crept into the market, as the session resulted in a long-legged doji, that while it formed a bullish harami pattern with the prior day’s candle, there was not much bullish sentiment & it began to indicated that IWM had become exhausted.
Wednesday followed in Tuesday’s footsteps, but with higher volume as it appeared that market participants were ready for one last pump before the risk-off sentiment came in at the end of the week.
Thursday was the breaking point, with a declining ride-range session that broke through the support of the 10 day moving average on the week’s highest volume, indicating that the part was over for IWM.
Friday continued lower on a gap down open resulting in a high wave candle that closed just above where it opened, but indicated that there was appetite below the support of the 50 DMA for IWM to continue lower.
Much like SPY & QQQ, given the high volatility that is expected to continue during this week, IWM’s volumes should be paid close attention to this week to see when they may be able to find support.
Volatility should be expected to continue until a volume trend shows some form of bullishness to serve as support.
While IWM has more local support levels that either of the previous two index ETFs, due to the index being comprised of small cap stocks there is an added likelihood that in prolonged volatility that market participants will sell the lesser know small cap names in favor of keeping cash safe on the sidelines, or in favor of less risky assets such as bonds.
Having an understanding of price level sentiment based on historic volume will be imperative for navigating moving forward for IWM.
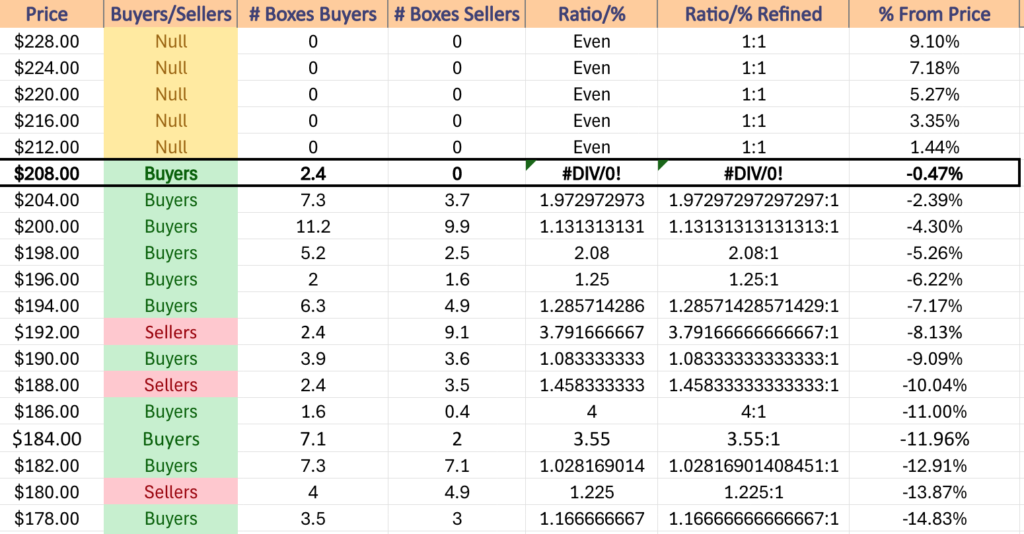
IWM has support at the $207.83 (50 Day Moving Average, Volume Sentiment: Buyers, 1.97:1), $207.27 (Volume Sentiment: Buyers, 1.97:1), $204.40 (Volume Sentiment: Buyers, 1.97:1) & $203.68/share (Volume Sentiment: Buyers, 1.13:1) price levels, with resistance at the $209.19 (Volume Sentiment: Buyers, 2.4:0*), $209.29 (Volume Sentiment: Buyers, 2.4:0*), $211.29 (Volume Sentiment: Buyers, 2.4:0*) & $215.38/share (Volume Sentiment: NULL, 0:0*) price levels.
DIA, the SPDR Dow Jones Industrial Average ETF dipped -2.18% last week, as even larger cap stocks were not spared from the increase in volatility.
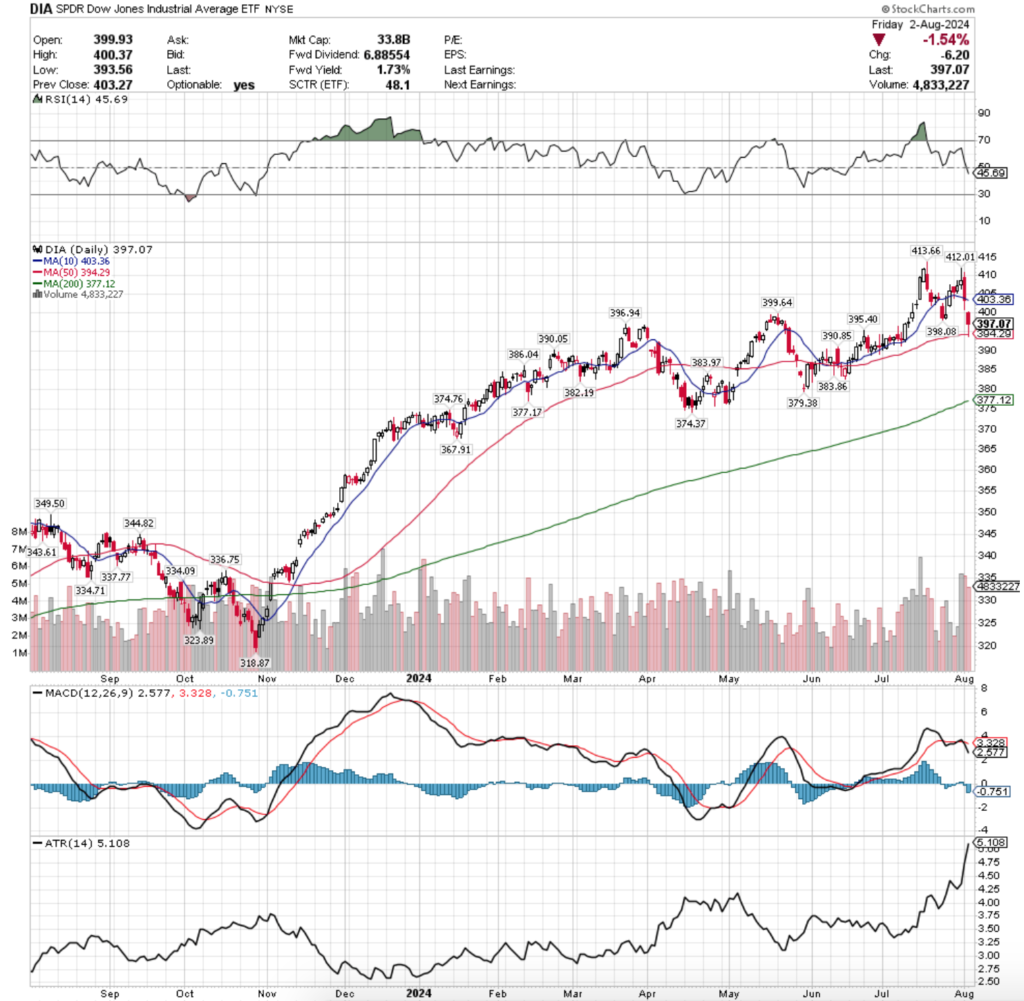
Their RSI is trending bearishly and sits at 45.69, while their MACD has recently crossed over the signal line bearishly.
Volumes were +16.66% above average compared to the previous year (4,118,180 vs. 3,530,175), which is interesting as their highest volume session of last week was bullish, but there was massive amounts of profit taking on Thursday & Friday.
DIA’s week opened up on a bearish note, as prices temporarily dipped beneath the support of the 10 day moving average, indicating that there was weakness on the horizon, especially due to their low volumes.
Tuesday featured another low volume session that nudged slightly higher, before Wednesday signaled sentiment was shifting in a high volume bullish session where bears came out in droves & forced the long upper shadow on the session’s candle, despite the bears attempting to march higher.
Thursday the profit taking began, and the session’s volume was close to the levels seen the day prior, as prices closed below the support of the 10 DMA & the session’s lower shadow indicated that there was more downside appetite.
This continued on into Friday, where a gap down open led to a -1.54% session where the support of the 50 DMA was temporarily broken, signaling that there is further uncertainty about DIA & more volatility on the near-term horizon.
Like the other index ETFs mentioned above, this week all eyes should be on volume trends for DIA as that will shed light into whether or not further declines continue, or if there will be some form of consolidation & support will be found.
DIA has many local support levels which will help ease any further declines to a degree, but the volume will be what’s most important to be keeping an eye on in the coming week, particularly once the 50 DMA’s support has been crossed below.
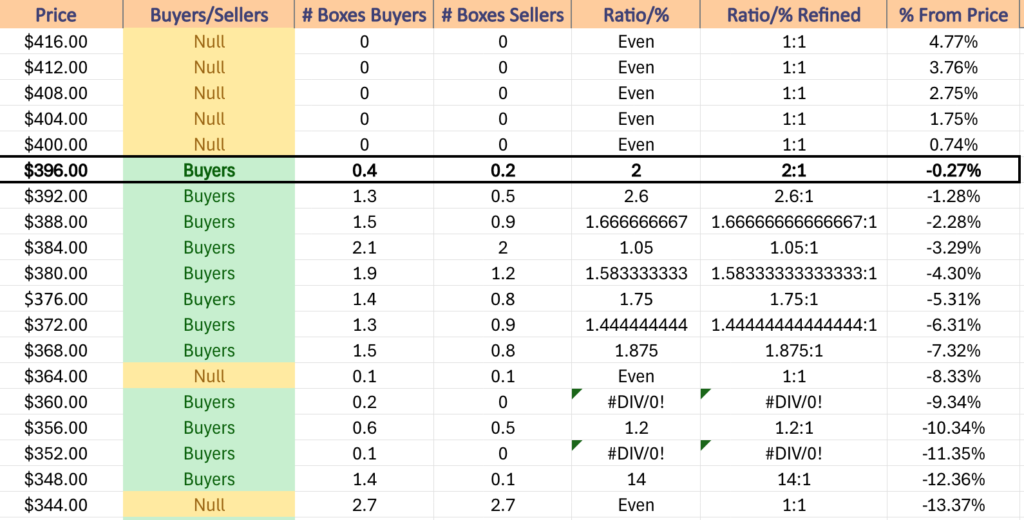
DIA has support at the $396.94 (Volume Sentiment:Buyers, 2:1), $395.40 (Volume Sentiment: Buyers, 2.6:1), $394.29 (50 Day Moving Average, Volume Sentiment: Buyers, 2.6:1) & $390.85/share (Volume Sentiment: Buyers, 1.67:1) price levels, with resistance at the $398.08 (Volume Sentiment: Buyers, 2:1), $399.64 (Volume Sentiment: Buyers, 2:1), $403.36 (10 Day Moving Average, Volume Sentiment: NULL, 0:0*) & $412.01/share (Volume Sentiment: NULL, 0:0*) price levels.
The Week Ahead
Monday kicks the week off with Chicago Fed President Goolsbee speaking at 8:30 am, followed by S&P Final U.S. Services PMI at 9:45 am & ISM Services data at 10 am.
Alpha Metallurgical Resources, BioCryst Pharmaceuticals, BioNTech, Carlyle Group, Freshpet, Krystal Biotech, Sonic Automotive, Sotera Health, TreeHouse Foods & Tyson Foods all report earnings before Monday’s opening bell, with Addus HomeCare, ADTRAN, Aecom Tech, Ameresco, American Healthcare REIT, Atlas Energy Solutions, Avis Budget, BellRing Brands, BioMarin Pharmaceutical, Boise Cascade, BWX Technologies, Cabot, Capital Southwest Corp., Chegg, CSX, Definitive Healthcare, Diamondback Energy, Encompass Health, Essential Utilities, EverQuote, Fidelity National, Golub Capital, Helios Technologies, HighPeak Energy, Hims & Hers Health, Huntsman, Innovative Industrial Properties, J&J Snack Foods, James River Group, Kemper, Materion, Mueller Water, National Storage Affiliates, Navitas Semiconductor, ONE Gas, ONEOK, Otter Tail Power, Palantir Technologies, Palomar Holdings, Playa Hotels & Resorts, Primoris Services, Quaker Chemical, Realty Income, Simon Properties, Spirit Aerosystems, Summit Materials, Teradata, The Aaron’s Company, TrueBlue, Unisys, Vimeo, Viper Energy Partners, Vista Outdoor, Vornado Realty Trust, Williams Cos, Yum China & ZoomInfo Technologies all due to report earnings after the session’s close.
U.S. Trade Deficit data is released Tuesday morning at 8:30 am.
Tuesday morning’s earnings calls begin with Caterpillar, Acushnet, AdaptHealth, Adient, Alight, ANI Pharma, Aramark, ATI Inc., Atkore International, Avient, Ballard Power, Baxter, Bentley Systems, Bloomin’ Brands, Broadridge Financial, Bruker, Builders FirstSource, Celsius, Clarivate, Constellation Energy, Delek US Holdings, Duke Energy, Energizer, Enpro, Expeditors International of Washington, Fidelity National Information Services, First Watch Restaurant Group, Fox Corp, Genius Sports, GlobalFoundries, Green Plains, GXO Logistics, Harmony Biosciences, Henry Schein, Hillman Solutions, Hyatt Hotels, CHOR Corp, IDEXX Labs, Ingredion, Jacobs Solutions, Jones Lang LaSalle, Kenvue, Knife River Corp, LCI Industries, Marathon Petroleum, Molson Coors Brewing, MPLX LP, Organon, Owens Corning, Planet Fitness, Portillo’s, Restaurant Brands International, Shutterstock, Starwood Property Trust, Tempur Sealy International, Thoughtworks, TopBuild, TPG Inc, Transdigm Group, Trimble, Uber Technologies, Vulcan Materials, Westlake, WK Kellogg Co, Yum! Brands & Zoetis, before ACADIA Pharmaceuticals, Adtalem Global Education, Airbnb, Albany International, American Financial Group, American States Water, Amgen, Andersons, Applied Optoelectronics, Arcadium Lithium, Ashland, Aspen Technology, Assurant, Astera Labs, Axon, Azenta, B&G Foods, BlackLine, California Resources Corp, Certara, Cirrus Logic, Compass Minerals, Coupang, DaVita, Devon Energy, EverCommerce, Exelixis, Flywire, Fortinet, Globus Medical, GoPro, Grocery Outlet, Halozyme Therapeutics, Hecla Mining, IAC Inc, Illumina, Inogen, Instacart, International Flavors & Fragrances, iRobot, Jack In The Box, Lumen Technologies, Luminar Technologies, Matterport, Mosaic, MRC Global, Myriad Genetics, OraSure, Permian Resources, Progyny, Qualys, Reddit, Redfin, Revolve Group, Rivian Automotive, Skyline Champion, Stem, Stride, Sunrun, Super Micro Computer, Toast, Traeger, TripAdvisor, Upstart, V.F. Corp, Veeco Instruments & Wynn Resorts report after the closing bell.
Wednesday afternoon features Consumer Credit data at 3pm.
Walt Disney, ACM Research, Astec Industries, Avista, B2Gold, Brinks, Brookfield Corp, Ceva, Charles River, Conduent, CVS Health, Dine Brands, Dynatrace, Editas Medicine, Emerson, Enovis Corp, Extreme Networks, Global Payments, Gogo, Griffon, Hilton, Holley, International Money Express, International Seaways, Intra-Cellular Therapies, Kennametal, Kornit Digital, Kymera Therapeutics, Louisiana-Pacific, Lyft, New York Times, NiSource, Nomad Foods, ODP Corp, OGE Energy, Oscar Health, Payoneer, Playtika, Ralph Lauren, Reynolds Consumer Products, Rockwell Automation, RXO, Inc, Shopify, Suncor Energy, Sunoco, Taboola, Target Hospitality, Triumph Group, United Parks & Resorts, Valvoline, Vertex, Vishay, Warner Music Group, Wix.com, Wolverine World Wide & Zimmer Biomet all report earnings Wednesday before the opening bell, followed by Robinhood Markets, ACV Auctions, AerSale, Allogene, Amdocs, AppLovin, Atmos Energy, Beyond Meat, Blink Charging, Boot Barn Holdings, Brighthouse Financial, Bumble, CACI International, Central Garden, CF Industries, Chord Energy, Clean Energy Fuels, Coeur Mining, CoreCivic, Curtiss-Wright, Digi International, Digital Turbine, DigitalBridge, Dolby Labs, Duolingo, Dutch Bros, Encore Capital, Energy Transfer, Enersys, Envista, Equinix, Fastly, Fluence, Forward Air, Franco-Nevada, Genco Shipping & Trading, Guardant Health, Health Catalyst, Hillenbrand, Horace Mann, HubSpot, Hudson Pacific Properties, ICU Medical, Jackson Financial, JFrog, Klaviyo, Kratos Defense and Security, Kulicke & Soffa, LegalZoom.com, Leslie’s, LiveRamp, Magnite, Manitowoc, Mannkind, Manulife Financial, Marathon Oil, McKesson, Monster Beverage, Nutrien, Occidental Petroleum, Pan Am Silver, PetIQ, Primerica, Rayonier, Royal Gold, Sarepta Therapeutics, Sinclair Broadcast, SiTime, SM Energy, SolarEdge Technologies, Sonos, STAAR Surgical, Talos Energy, Topgolf Callaway Brands, UGI Corp, Upwork, Viasat, Vital Energy, Warner Bros. Discovery, Watts Water Technologies, Western Midstream, Ziff Davis & Zillow after the closing bell.
Initial Jobless Claims data is released Thursday morning at 8:30 am, followed by Wholesale Inventories data at 10 am & Richmond Fed President Barkin speaking at 3pm.
Thursday morning’s earnings calls include Amicus Therapeutics, Cars.com, Cheniere Energy, Choice Hotels, Cogent Communications, Commscope, CyberArk Software, Datadog, Eli Lilly, Endeavor Group, First Advantage, Frontier Group Holdings, Geron, GoodRx, Hanesbrands, Hilton Grand Vacations, Himax Technologies, Insmed, Ironwood Pharmaceuticals, Kelly Services, Koppers Holdings, Krispy Kreme, Lamar Advertising, LifeStance Health Group, Martin Marietta Materials, MDU Resources, Murphy Oil, Nexstar, NRG Energy, Papa John’s, PAR Technology, Parker-Hannifin, PENN Entertainment, Piedmont Lithium, Plug Power, Privia Health, Sally Beauty, Sealed Air, SharkNinja, Spectrum Brands, Tennant, TKO Group Holdings, Under Armour, US Foods, Viatris, Vital Farms, Walker & Dunlop, Warby Parker, XPEL & YETI Holdings, followed by Akamai Technologies, Alarm.com, AMN Healthcare, Amplitude, Arlo Technologies, Array Technologies, Arrowhead, Bloom Energy, Capri Holdings, CarGurus, Chesapeake Utilities, CleanSpark, Collegium Pharmaceutical, CONSOL Energy, Cytokinetics, DigitalOcean, Diodes, Douglas Emmett, Doximity, Dropbox, e.l.f. Beauty, Evolent Health, Expedia Group, Five9, Funko, Genpact, Gilead Sciences, Green Dot, Iovance Biotherapeutics, Mercer International, MeridianLink, Natera, News Corp, Nu Skin, Open Lending, Paramount Global, Paymentus, Pembina Pipeline, Pitney Bowes, PubMatic, Rackspace Technology, RB Global, Rocket Lab, Savers Value Village, Scripps, Solventum, SoundHound AI, StepStone Group, Sun Life, Sweetgreen, Synaptics, Synaptics, TechTarget, The Beauty Health Company, The Trade Desk, TTEC Holdings, Unity Software, Viavi, Westrock Coffee Company, Wheaton Precious Metals & Yelp after the session’s close.
Friday features no major economic news & Algonquin Power & Utilities, AMC Networks, American Axle, Berry Petroleum, Construction Partners, Embecta, Evergy, Legend Biotech, Sylvamo & Victory Capital are all scheduled to report earnings before the opening bell.
See you back here next week!
*** I DO NOT OWN SHARES OR OPTIONS CONTRACT POSITIONS IN SPY, QQQ, IWM OR DIA AT THE TIME OF PUBLISHING THIS ARTICLE ***