SPY, the SPDR S&P 500 ETF gained +0.57% in another week with subpar volumes, while the VIX closed at 16.96, indicating an implied one day move of +/-1.07% & an implied one month move of +/-4.9%.
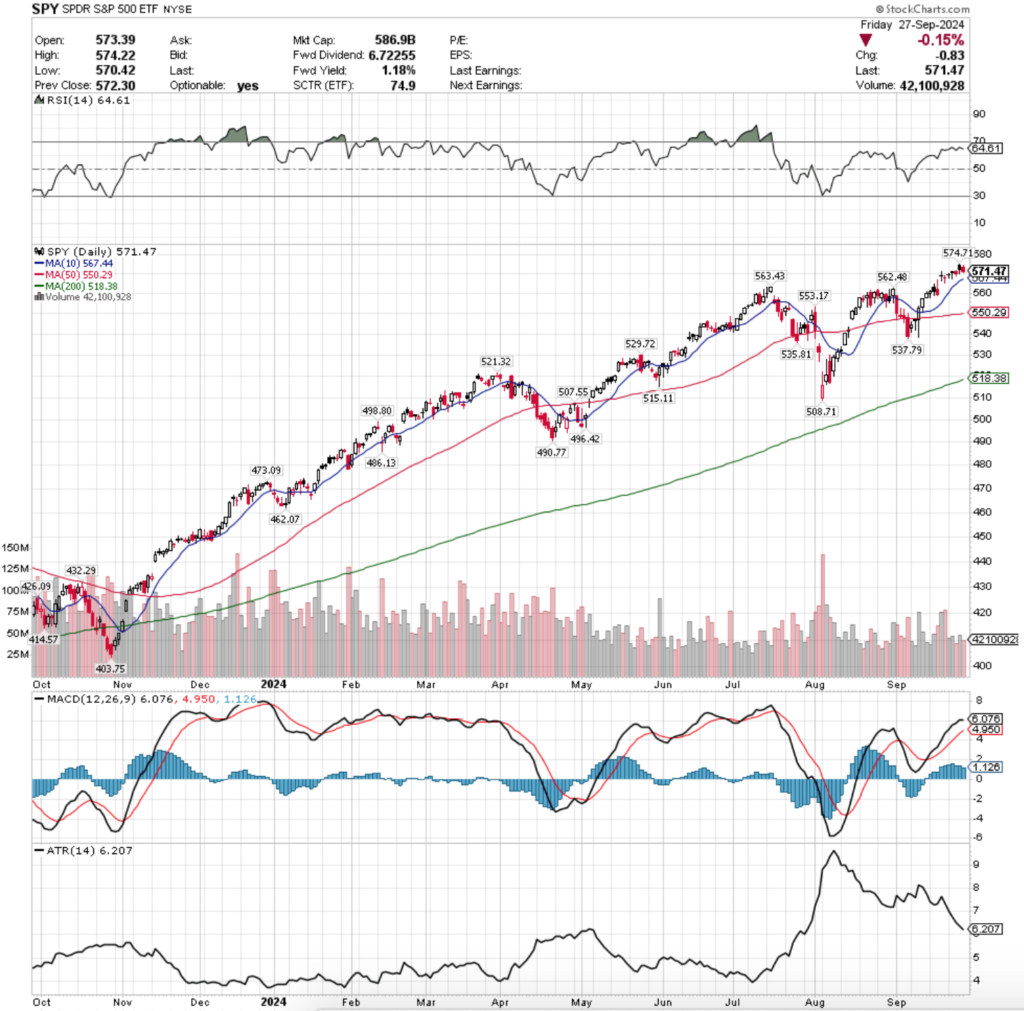
Their RSI is currently at 64.61 & has begun to curl over bearishly, heading back towards the neutral level while their MACD is also curling over bearishly & looks set to cross the signal line bearishly in the coming days.
Volumes were -34.28% below the previous year’s average last week (43,960,000 vs. 66,888,340) as market participants are still largely sitting on the sidelines uneasily as prices continue to set & flirt with new all-time highs.
As we’ve highlighted on here over the past month or so, volumes when compared to the average volume of the year before April 2024 are even lower, as for the past ~5 months volumes have been extremely muted.
In our report on 3/31/2024 the average prior year’s volume for SPY was 77,829,780, making today’s average previous year’s volume -14% lower than where it was in March, which is a fairly decent size drop off & not a signal of confidence in the S&P 500.
SPY’s week started off on an uncertain note, as Monday’s session resulted in a dragonfly doji, indicating that there was some downside appetite but the day was able to open & close near the high end of its price range.
Monday’s session was the third highest volume session of the week, as investors were not overly eager to jump back into SPY right out of the gate.
Tuesday this trend continued, as volumes were the second highest of the week on another session that resulted in a dragonfly doji.
The lower shadow on Tuesday’s candle also indicated that there was a lot of downside appetite, but that the bulls were able to drive the price back up to close just above the day’s opening price.
Wednesday is when things began to flash weakness for SPY, as the session opened just below Tuesday’s close & proceeded lower throughout the day.
However, much like the prior two days there was a lack of volume as Wednesday was SPY’s least active session of the week.
Thursday things gave a glimmer of optimism after the PBOC announced new easing measures, but it came with a hint of doubt.
The session gapped higher but was unable to continue higher, tested into Wednesday’s candle’s real body before closing slightly higher than Wednesday, but at a lower price than their open.
Thursday also had the strongest volumes of the week for SPY, indicating that there was a bit of profit taking throughout the day & that the reality was slowly becoming more risk-off after five consecutive sessions of dojis that came after a gap up the prior Thursday.
Friday the risk-off sentiment was echoed, as SPY closed down -0.15%, although it should be noted that the two lowest volume sessions of the week came on the declining days.
As noted before, there has been little but indecision & mixed signals in the market since last Thursday’s session, when SPY gapped up on the open & proceeded to close below the opening price.
Market participants are beginning to look more & more skittish each passing week & there has not been such long consecutive string of doji candles in the past year, which gives off the feeling that we’re approaching at least a temporary falling of the Jenga tower.
Like last week, the 10 day moving average & its relationship to SPY’s price will be a key area of importance to track this coming week.
Any breakdown of that support level will begin to put pressure on SPY’s price, particularly at times where the volumes have been so low such as this past week.
Given how close they are to their all-time high there is little to measure against for SPY’s upside potential this week, but given the low level of major earnings reports & high number of Fed speakers continuing into the week combined with their RSI & MACD readings it looks like SPY is set to pump the brakes this week.
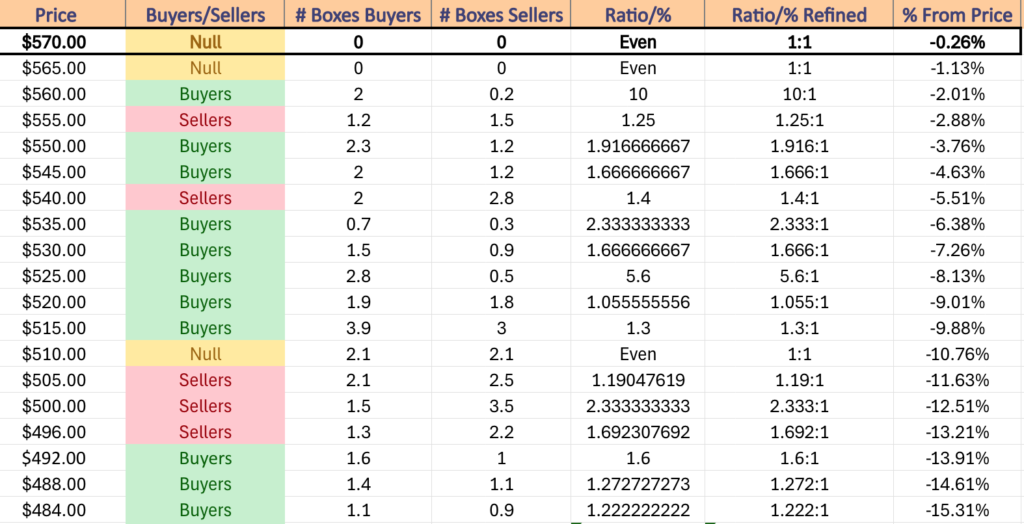
It should be noted that SPY’s 50 DMA’s support level is ~4% below their current price & edging higher, and currently sits just below a price zone that is dominated by Sellers at a rate of 1.25:1, which will be another area to keep an eye on in the event of declines.
Should the 50 DMA be broken through to the downside the $537.79-535.81 support levels will be in play, also occurring just after a Seller dominated price zone (1.4:1).
SPY has support at the $567.44 (10 Day Moving Average, Volume Sentiment: NULL, 0:0*), $563.43 (Volume Sentiment: Buyers, 10:1), $562.48 (Volume Sentiment: Buyers, 10:1) & $553.17/share (Volume Sentiment: Buyers, 1.92:1) price levels, with resistance at the $574.71/share (All-Time High, Volume Sentiment: NULL, 0:0*) price levels.
QQQ, the Invesco QQQ Trust ETF that tracks the NASDAQ 100 advanced +0.89% last week, having the strongest week of the major four index ETFs.
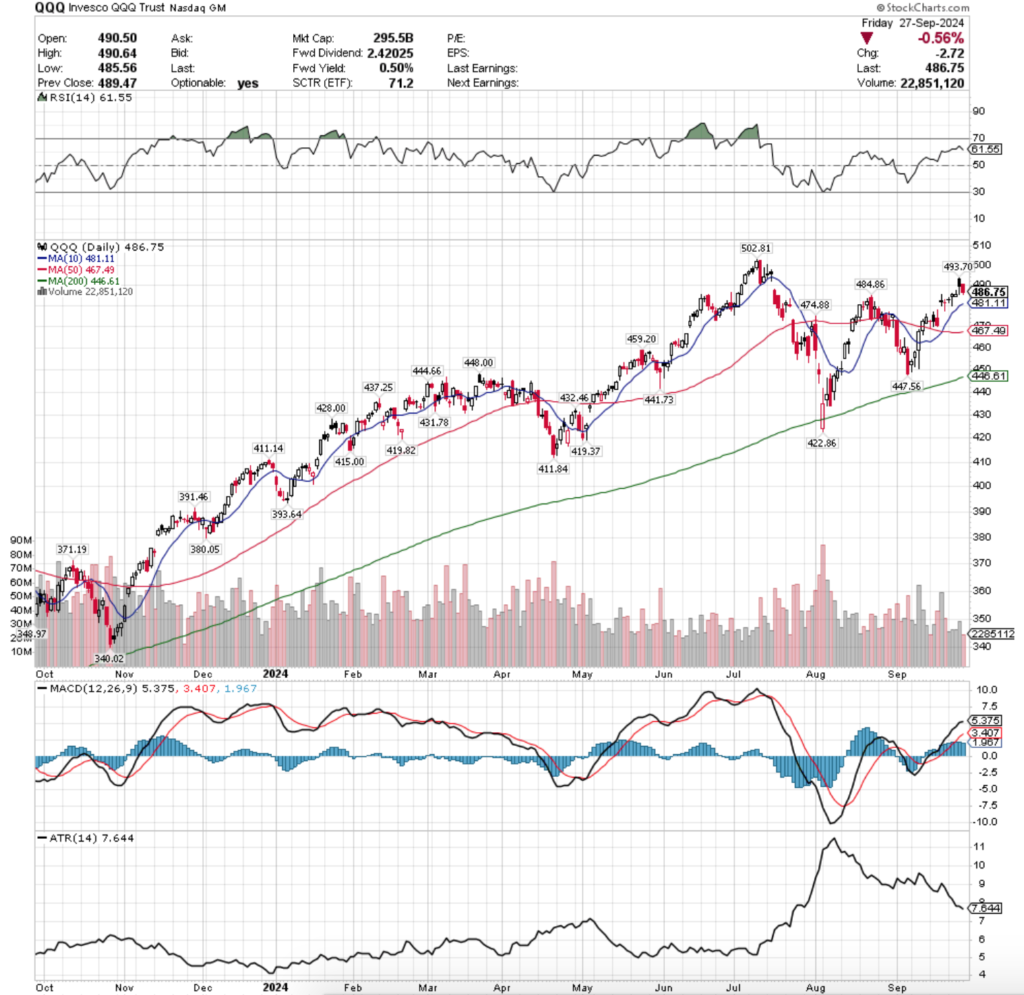
Their RSI looks similar to SPY’s in that it has begun to curl over & head downward following Friday’s declines & it currently sits at 61.55, while their MACD looks primed to cross the signal line bearishly in the coming week.
Volumes were also extremely weak for QQQ, coming in at -37.61% below the prior year’s average (26,442,000 vs. 42,380,464), as the tumbleweeds blew across the tech heavy index.
Much like SPY, QQQ’s average past year volume is -13.95% lower than it was back on March 31, 2024 (49,253,412).
QQQ’s week began in a similar fashion to SPY’s as Monday’s session resulted in a doji candle on the second weakest volume of the week, indicating that there was hesitancy on the part of market participants heading into a new week.
However, this all seemed to fade away for the next two days, but there was still downside appetite as shown by Tuesday’s candle’s lower shadow.
Tuesday opened higher day-over-day, but tested much lower down to the $480.17/share mark before rallying higher & closing the day on a slight advance.
It should be noted that Tuesday’s candle flashed an ominous signal though as the session closed in a hanging man candle, which was then confirmed by Wednesday’s session’s inability to test much higher.
Wednesday resulted in a shooting star candle, indicating that there was still trouble on the horizon for QQQ.
Thursday saw the highest volumes of the week, but like SPY the PBOC pump resulted in profit taking, lending to the week’s highest volume being for a session that opened higher, tested down to near Wednesday’s close before closing below the day’s opening price.
This set the stage for Friday’s risk-off heading into the weekend session where QQQ declined -0.56%.
It should be noted that this occurred on the lowest volumes of the week, but considering Thursday’s high volume & wide range of price action & ultimate lower close than opening price that may be a function of folks hopping out of the pool a day prior.
Thursday was not able to produce a new all-time nor a 52-week high which indicates that there is unlikely to be much along the lines of near-term upside appetite for QQQ.
QQQ looks ready to take a breather at minimum due to the inability to continue trudging higher last week & all eyes will be on the relationship between their price & the 10 day moving average’s support heading into the new week.
In the event the price breaks through it to the downside then we will likely see if continue further until it tests the 50 DMA’s support, as there is only one other support touchpoint between them ($474.88).
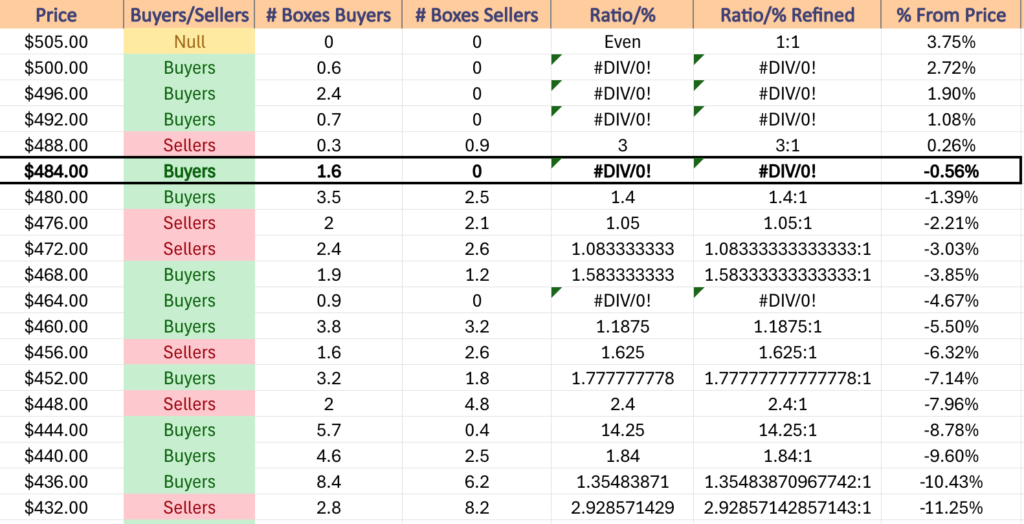
This is where things could become interesting as the $472-479.99/share price levels are Seller dominated over the past ~2 years (1.05:1 & 1.08:1) & the 50 DMA currently sits at $467.49/share & is rising.
The good news for bulls should this happen is that since July’s decline we have been making higher lows & there is a support zone between the 200 Day Moving Average at $446.61 to $448/share.
However, bears will be quick to point out that QQQ’s most recent peak was only +1.82% higher than the previous peak & the 200 DMA’s support was broken through temporarily in August, indicating that there is appetite to see that happen again.
As has been noted in previous weeks, QQQ has more support levels due to the steadier ascent they took since the Q4 2023 rally, particularly the prices from Q1 into Q2 2024.
QQQ has support at the $484.86 (Volume Sentiment: Buyers, 1.6:0*), $481.11 (10 Day Moving Average, Volume Sentiment: Buyers, 1.4:1), $474.88 (Volume Sentiment: Sellers, 1.08:1) & $467.49/share (50 Day Moving Average, Volume Sentiment: Buyers, 0.9:0*) price levels, with resistance at the $493.70 (Volume Sentiment: Buyers, 0.7:0*) & $502.81/share (All-Time High, Volume Sentiment: Buyers, 0.6:0*) price levels.
IWM, the iShares Russell 2000 ETF declined -0.56%, as the small cap index had the worst week out of the major four index ETFs.
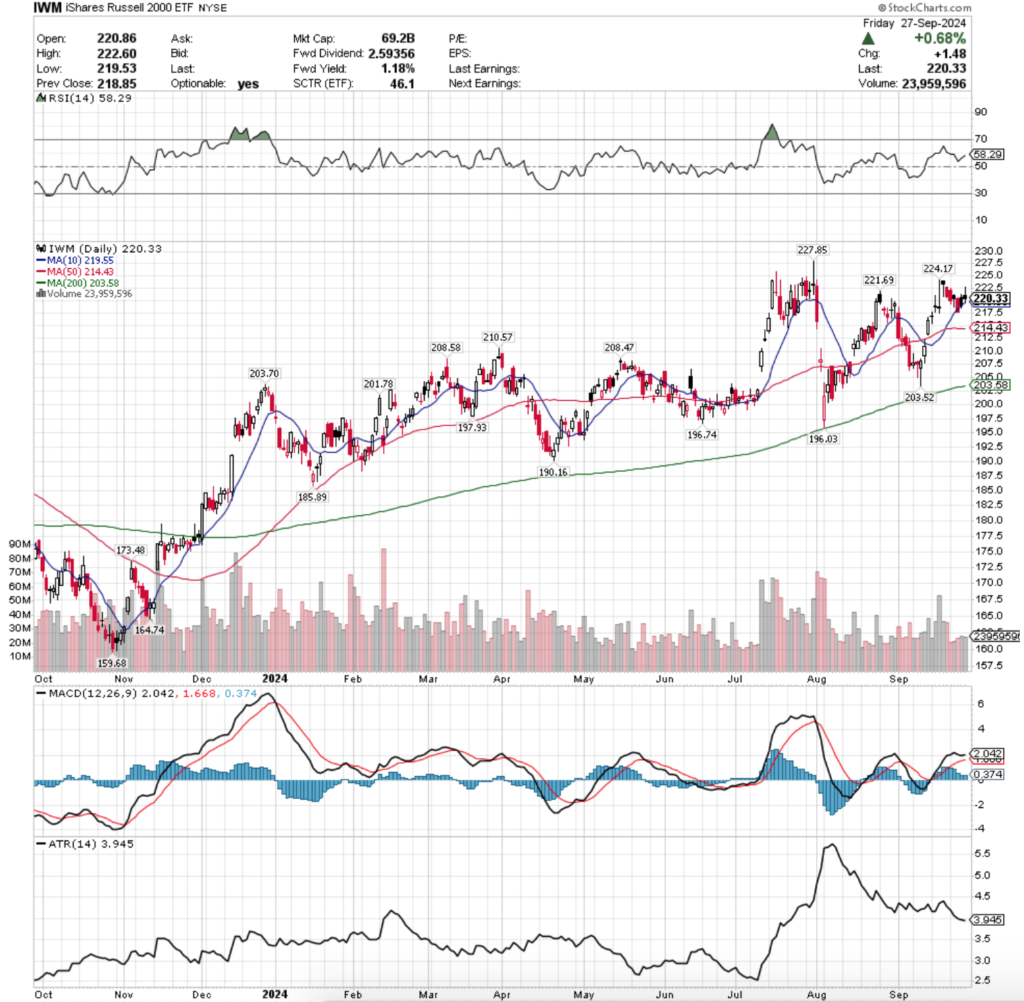
Their RSI is currently at 58.29, while their MACD has flattened & looks ready to cross the signal line bearishly in the coming days.
Volumes were -35.95% below the previous year’s average (22,654,000 vs. 35,367,549), as market participants were not seeking risk & taking profits from the recent run up in small cap names.
Unlike SPY & QQQ, IWM’s average past year’s volume is now +3.18% above where it was back on 3/31/2024 (34,276,900).
This looks like complacency for investors in IWM & its components, given it was a week of moderate declines for IWM but less people were selling than normal.
IWM’s week kicked off Monday to more profit taking following Friday’s declining session & last Thursday’s hanging man candle that closed lower than it opened despite gapping up to open (bearish).
Tuesday threw mixed signals out, as the session closed as a hammer candle which can indicate that there is a reversal coming in the wake of declines like the ones that preceded it & it formed a bullish harami with the prior session’s candle.
However, caution should be taken as the session closed lower than it opened & the lower shadow shows that there was quite a bit of downside appetite that the bulls were able to at least temporarily fight back from.
Wednesday confirmed that there is bearishness in the air for IWM, as the session opened lower & continued to test lower, breaking down through the support of the 10 day moving average & closing beneath it.
Thursday opened on a gap up, tested slightly higher than it opened, but in the end the bears were able to force IWM’s price down to close below their opening price & in-line with the 10 DMA, echoing the bearish sentiment of the prior five sessions despite closing slightly up.
Friday was able to open slightly higher than Thursday & tested higher, breaking abvoe the $222.50-mark briefly before moving lower & testing down to the 10 DMA’s support.
Support held up & forced the close to be a spinning top candle, but it should be noted that the close was lower than the open, which carries bearish sentiment.
Friday had the second highest volume of the week as market participants were eager to remove risk before the weekend commenced.
This week will have the 10 DMA in focus, as it has so far proven to be sturdy but has shown signals of weakness & with repeated testing it seems that market participants are unsure if they want prices to remain above it or not for IWM.
In the event that it breaks down, the next support level is -2.33% lower at the 50 day moving average, which is currently ~2% above the next highest support level & moving higher.
With the hanging man candle from the previous Thursday’s session marking the recent high that is where to keep an eye on in the event prices break upwards, but based on last week’s price action it looks like IWM is ready to continue lower in the coming week.
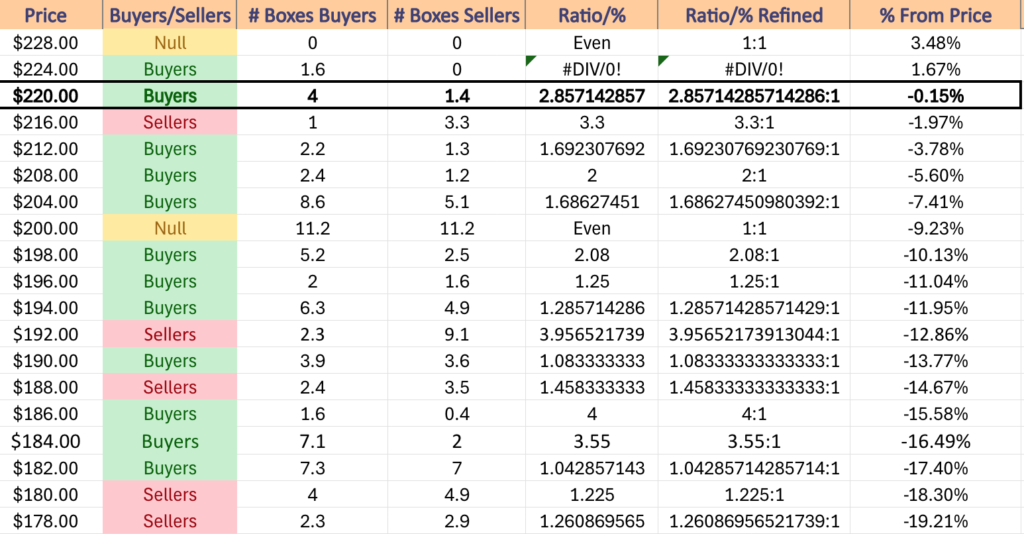
IWM has support at the $219.55 (10 Day Moving Average, Volume Sentiment: Sellers, 3.3:1), $214.43 (50 Day Moving Average, Volume Sentiment: Buyers, 1.69:1), $210.57 (Volume Sentiment: Buyers, 2:1) & $208.58/share (Volume Sentiment: Buyers, 2:1) price levels, with resistance at the $221.69 (Volume Sentiment: Buyers, 2.86:1), $224.17 (Volume Sentiment: Buyers, 1.6:0*) & $227.85/share (52-Week High, Volume Sentiment: Buyers, 1.6:0*) price levels.
DIA, the SPDR Dow Jones Industrial Average ETF also finished the week up +0.57% like SPY & also had a week of very light volume too.
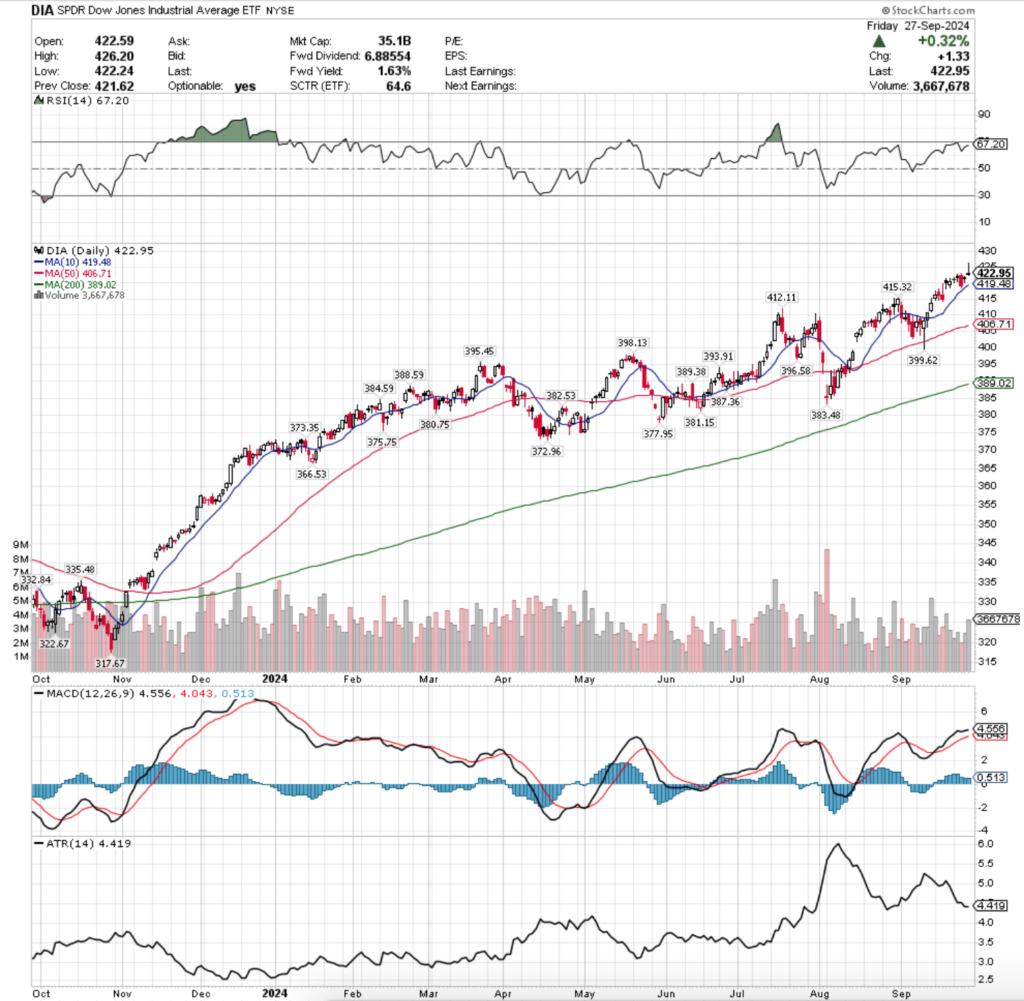
Their RSI is trending into overbought territory & currently sits at 67.2, while their MACD is still bullish but beginning to flatten out & their histogram has been waning the past three sessions.
This sign of weakness will likely lead to a bearish crossover of their signal line in the coming week.
As noted above, volumes were lackluster for DIA, coming in -23.91% below the previous year’s average volume (2,706,000 vs. 3,556,245), as it is looking like investors are running out of steam at their current price levels.
Like IWM, DIA’s current previous year’s average volume is actually higher than it was on 3/31/2024, coming in +4.44% above it’s late-March counterpart (3,405,069).
DIA’s week kicked off on uncertain footing, as Monday’s session ended in a doji on very light advancing volume.
Tuesday was another advancing session, but it resulted in a hanging man candle (bearish), which set the stage for the risk-off action that DIA saw on Wednesday’s bearish engulfing candle that went down to come near testing the support of their 10 day moving average.
Thursday saw volumes kick up a bit more, but opened just below the high end of Wednesday’s real body, tested lower & ultimately closed lower than it opened as a hanging man candle.
While Thursday also could be categorized as a bullish harami formation with Wednesday, the fact that it closed below its open diminishes the fact that it was an advancing session & it should be viewed as bearish sentiment.
This was confirmed on Friday, when DIA gapped up, tested above the $425/share price level, before closing as a shooting star candle for the day on the week’s highest volume.
The volume should be regarded as profit taking given the wide range of prices the day covered & that their open/close were both concentrated at the bottom of the session’s candle.
The first area to watch for this week with DIA will be the window that was formed by Friday’s session, as it is likely to fill earlier on in the week as Friday’s all-time high does not look to be on stable footing.
This will bring DIA to the support level of their 10 day moving average, which if broken through will open the door to support levels ~1% away from one another until DIA reaches the 50 DMA, which currently sits at $406.71.
Should this occur DIA’s next target will be a support zone between $399-398/share, but it will have the resistance of both the 10 & 50 DMAs applying downward pressure on price, while their 200 DMA’s support level is then only ~2.5% below ($389.02).
Of course, keep an eye on their volumes as well, as the more active market participants are in the coming price moves the stronger they will be.
In terms of what to watch for on the upside it is hard to say, given that Friday’s session set an all-time high, making it more important to have an understanding of what can happen to the downside & a plan of action for if this is to occur.
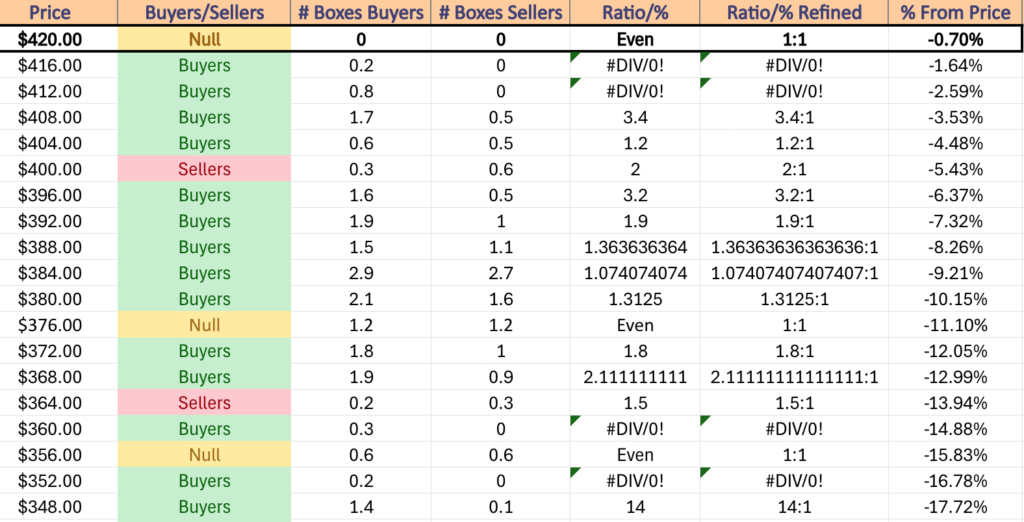
DIA has support at the $419.48 (10 Day Moving Average, Volume Sentiment: Buyers, 0.2:0*), $415.32 (Volume Sentiment: Buyers, 0.8:0*), $412.11 (Volume Sentiment: Buyers, 0.8:0*) & $406.71/share (Volume Sentiment: Buyers, 1.2:1) price levels, with resistance at the $426.20/share (All-Time High, Volume Sentiment: NULL, 0:0*) price levels.
The Week Ahead
Monday kicks the week off with Fed Governor Bowman speaking at 8:50 am, followed by the Chicago Business Barometer (PMI) data at 9:45 pm & Fed Chair Powell speaking at 1:55 pm.
Carnival reports earnings before Monday’s opening bell.
S&P Final U.S. Manufacturing PMI data comes out at 9:45 am Tuesday, followed by ISM Manufacturing, Construction Spending & Job Openings data at 10 am, Fed Governor Cook speaking at 11:10 am & Fed Presidents Barkin, Bostic & Collins having a panel discussion about technology at 6:15 pm & Auto Sales data is also expected on Tuesday.
Tuesday morning’s earnings reports include Lamb Weston, Acuity Brands, McCormick, Paychex & United Natural Foods, with Nike, Cal-Maine Foods & Resources Connection reporting after the session’s close.
Wednesday features the ADP Employment data reports at 8:15 am, followed by Fed President Hammack speaking at 9 am, Fed Governor Bowman speaking at 11 am & Fed President Barkin speaking at 12:15 pm.
Conagra & RPM Inc. report earnings before Wednesday’s opening bell, with Levi Strauss due to report after the session’s close.
Initial Jobless Claims data is scheduled to come out Thursday morning at 8:30 am, followed by S&P Final U.S. Services PMI data at 9:45 am, ISM Services & Factory Orders data at 10 am & Fed Presidents Kashkari & Bostic having a discussion at 10:40 am.
Thursday morning begins with AngioDynamics & Constellation Brands reporting earnings, with Tilray Brands coming in after the closing bell.
Friday morning starts with U.S. Nonfarm Payroll, U.S. Unemployment Rate, U.S. Hourly Wages & Hourly Wages Year-over-Year data at 8:30 am, before Fed President Williams speaking at 9 am & Apogee Enterprises reports earnings before the session opens.
See you back here next week!
*** I DO NOT OWN SHARES OR OPTIONS CONTRACT POSITIONS IN SPY, QQQ, IWM OR DIA AT THE TIME OF PUBLISHING THIS ARTICLE ***