This past week was much like the previous; lots of noise coming from earnings reports & global economic data that lead to cautious movements for the most part dictated around how indexes opened. It was almost like watching a bunch of deaf folks play musical chairs in the dark, lots of early-round momentum lead to folks moving in one direction, but prices didn’t indicate that anyone knew where they were going, or why.
If Things Are Better Than The Worst Case Expectations, Is That Really Good?
Clearly markets agree with that statement more often than not; they’re supposed to be a judge of the current value of businesses contained within them, but as growth stocks have been favorites over the last number of years, they also project a certain amount of hopes & expectations. “We should be trading on 2021 expectations” has become an overused drinking phrase on the daily market TV coverage, which is going to be especially difficult to gauge, given most folks don’t seem to have an idea as to how bad these global economic shutdowns will be in the coming weeks, much less years.
Benjamin Graham made it pretty clear that predicting the future isn’t an easy task, much less one that you should base investments & trades on, yet folks don’t seem to care.
At the end of the day, Mr. Market will come back to straighten things out…
What I’m Watching This Week
Earnings reports will slow down this week, which will likely change the structure of volume we’ve seen over the last few weeks, as less people will be trying to play the reports one way or the other.
I’ve also noted that the technical’s ratings for Materials Sector stocks seem to be outpacing the growth of their share prices, which still have shown W-o-W growth. I am in ADES, which has seen 25% growth in the last couple of weeks since I bought it.
CPI numbers will be reported Tuesday in the US, EIA Crude Stocks Wednesday, Jobless Claims on Thursday & Retail Sales, JOLTS Job Openings & the Michigan Consumer Sentiment Index.
While Friday was a strong close to the week, I’m not as confident in this upcoming week.
Checking In On The S&P 500 & NASDAQ Charts
Looking at charts for the NASDAQ & S&P 500, I’m still not certain we are out of the woods just yet.
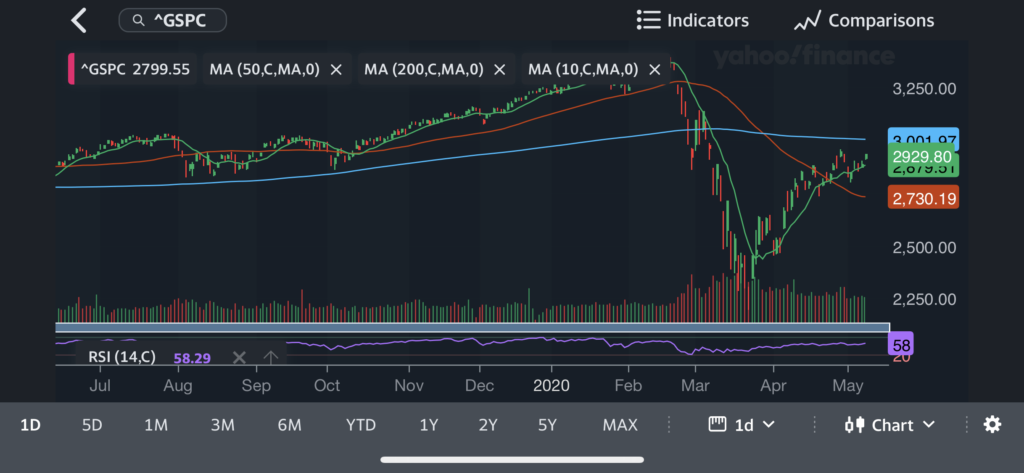
The S&P 500 is still facing downwards pressure from the 50-Day & 200-Day Moving Averages, with an RSI of 58 on the 1 year chart, showing it is heating up a bit.
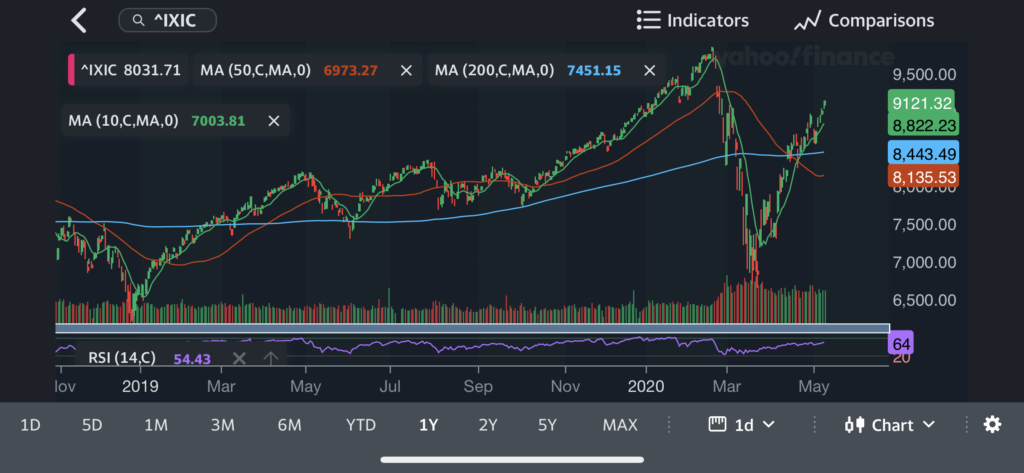
While the NASDAQ chart looks a bit more bullish, note the RSI is at 64, where a number over 80 in considered over-bought territory.
Tying It All Together
As I noted last week, a 2.5% drop in either index would be able to spur a technical sell-off of sorts. With last week’s gains that has built up a safety cushion.
With that being said, bad but not the worst-case scenario data may have been able to hide out behind massive amounts of earnings calls these last few weeks. Now that the Fed has cut down on the amount of their buying programs, and data will still be most likely coming out bad but not the worst, we should see some giveback from the indexes.
I would still be favoring names with good value & safe dividend yields, as they will continue to growth & be better suited to weather any potential storms. I also am still short the indexes & long volatility, although I did some rebalancing last week to favor more volatility.