SPY, the SPDR S&P 500 ETF fell -2.07%, while the VIX closed the week at 26.78, indicating an implied one day move of +/-1.69% & an implied one month move of +/-7.74%.
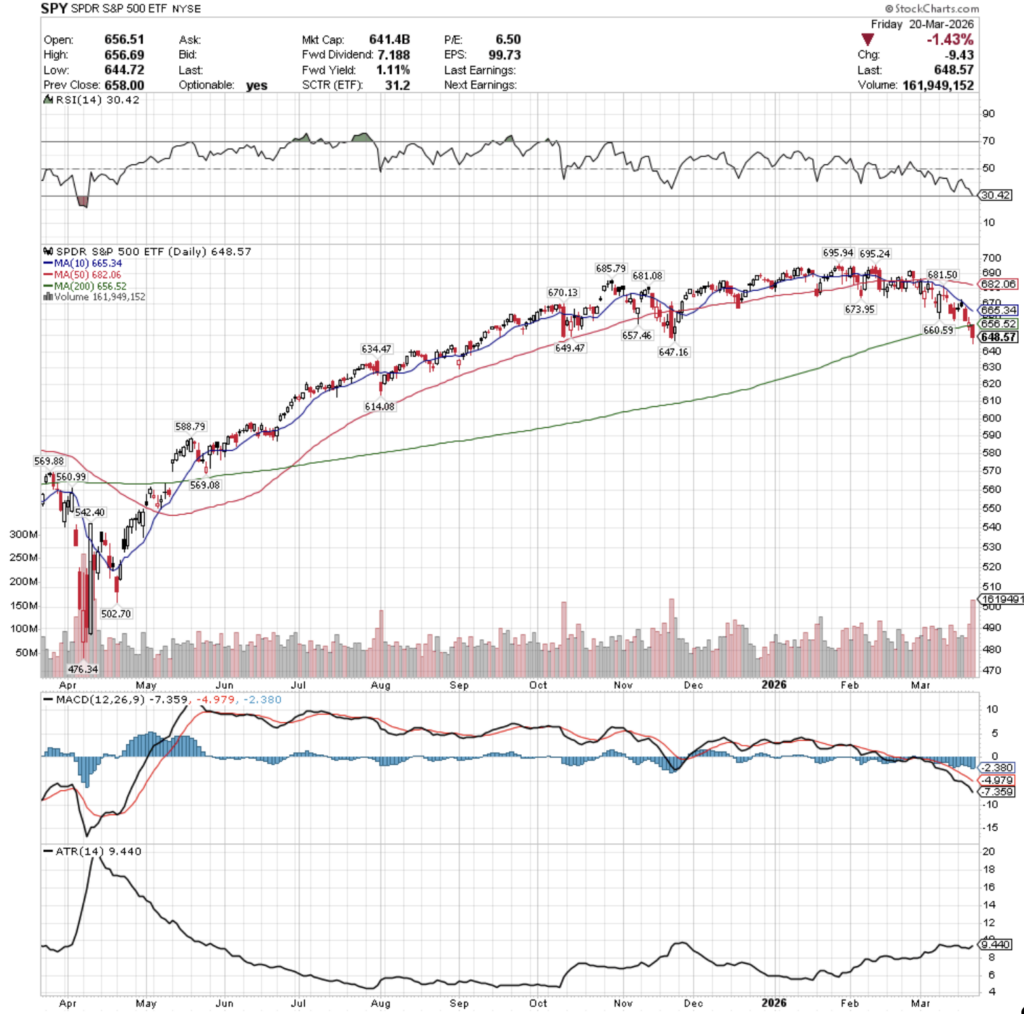
Their RSI is trending down & approaching the oversold 30-mark, currently at 30.42, as well as an MACD that continues to be bearish, like it has for the overwhelming amount of time since mid-January 2026.
Volumes were +32.92% higher than the prior year’s average (105,220,000 vs. 79,160,359), which is rather chilling when you consider that each session of the week declined from its opening price.
Monday opened higher, made a run at the 10 day moving average’s resistance, but ultimately sunk lower throughout the session on low volume, closing the day as a skinny spinning top, indicating that there was a bit of hesitency among market participants.
Tuesday was similar, where a gap up open ran at the 10 DMA’s resistance, temporarily broke through it, but ultimately sunk lower to close below its opening price on slightly higher volume than Monday.
Wednesday the cracks became exposed and the fear market participants were feeling came into plain view, as a gap down open made one lasts attempt at the resistance of the short-term trendline, only to decline -1.4% on the day, bringing the support of the 200 day moving average into play.
Thursday the quiet part was said aloud, as SPY opened in-line with the 200 DMA, sunk lower, but managed to rally higher, temporarily retracing into Wednesday’s range, before closing -0.25% and signaling that there was limited faith in the long-term trendline.
Friday opened lower, again in-line with the 200 day moving average, and risk-off sentiment carried SPY to its first close below the 200 DMA since 5/21/2026 on the week’s highest volume, signaling that there was a bit of fear & loss of confidence in the S&P 500.
Heading into a new week there will be a few things to be mindful of.
Firstly, the lower shadow on Friday’s candle signals that there is still downside appetite, but that some bulls stepped in thinking they’d found a buying opportunity.
Secondly, the 10 DMA is quickly approaching the 200 DMA bearishly, which will likely result in a death-cross by EOW.
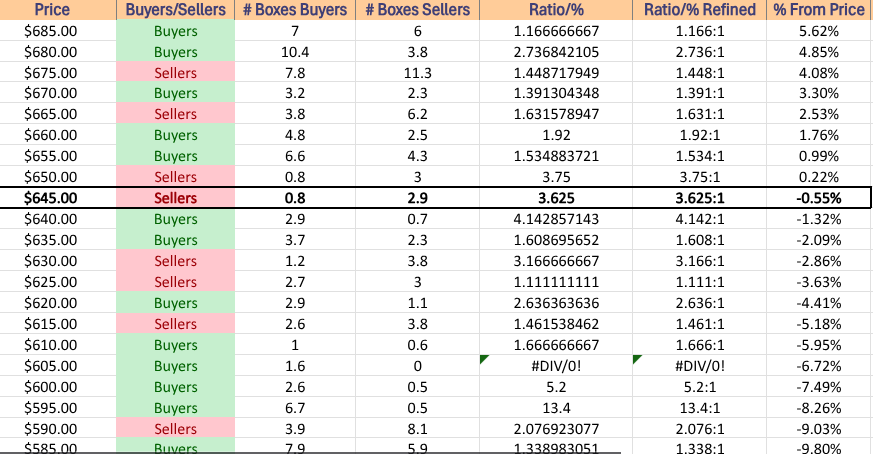
Third, the volume sentiment numbers below show support levels to be sparse and with Selling pressure still near the closing price of Friday’s session
The upside case revolves around SPY gaining traction with advancing volume that enables an uptrend, but based on last week’s volume trends there appears to be reluctance towards that at the moment, particularly with the moving 10 & 50 DMA’s coming down on the 200 DMA.
There also is a Seller zone that houses SPY’s first resistance test, so that adds to the difficulty of a significant breakout taking place immediately following last week’s declines.
The consolidation view figures oscillations around the 200 DMA until the 10 DMA draws nearer, which likely then leads to more near-term declines.
In the declining case things get interesting, as the next two support levels are in historic Seller zones, leaving SPY to look for footing at their third support levels, $634.47.
Should the footing not be found, a proper -10% from SPY’s all-time high in January 2026 would be ~$626.35, bringing that fourth levels below of $614.08 into play potentially.
$614.08 becomes the gatekeeper to the unfilled gaps of last May & June as well, which means there could be further breakdowns if it doesn’t hold strong.
Use the table below to identify strength/weakness of support/resistance levels.
SPY has support at the $647.16 (Volume Sentiment: Sellers, 3.63:1 ((updated volume numbers used in this article, will be published in Volume-centric post by mid-week))), $634.47 (Volume Sentiment: Sellers, 3.17:1), $614.08 (Volume Sentiment: Buyers, 1.67:1) & $588.79/share (Volume Sentiment: Buyers, 1.34:1) price levels, with resistance at the $649.47 (Volume Sentiment: Sellers, 3.63:1), $656.52 (200 Day Moving Average, Volume Sentiment: Buyers, 1.54:1), $657.46 (Volume Sentiment: Buyers, 1.54:1) & $660.59/share (Volume Sentiment: Buyers, 1.92:1) price levels.
QQQ, the Invesco QQQ Trust ETF dropped -1.96% for the week, having a similar looking chart to SPY.
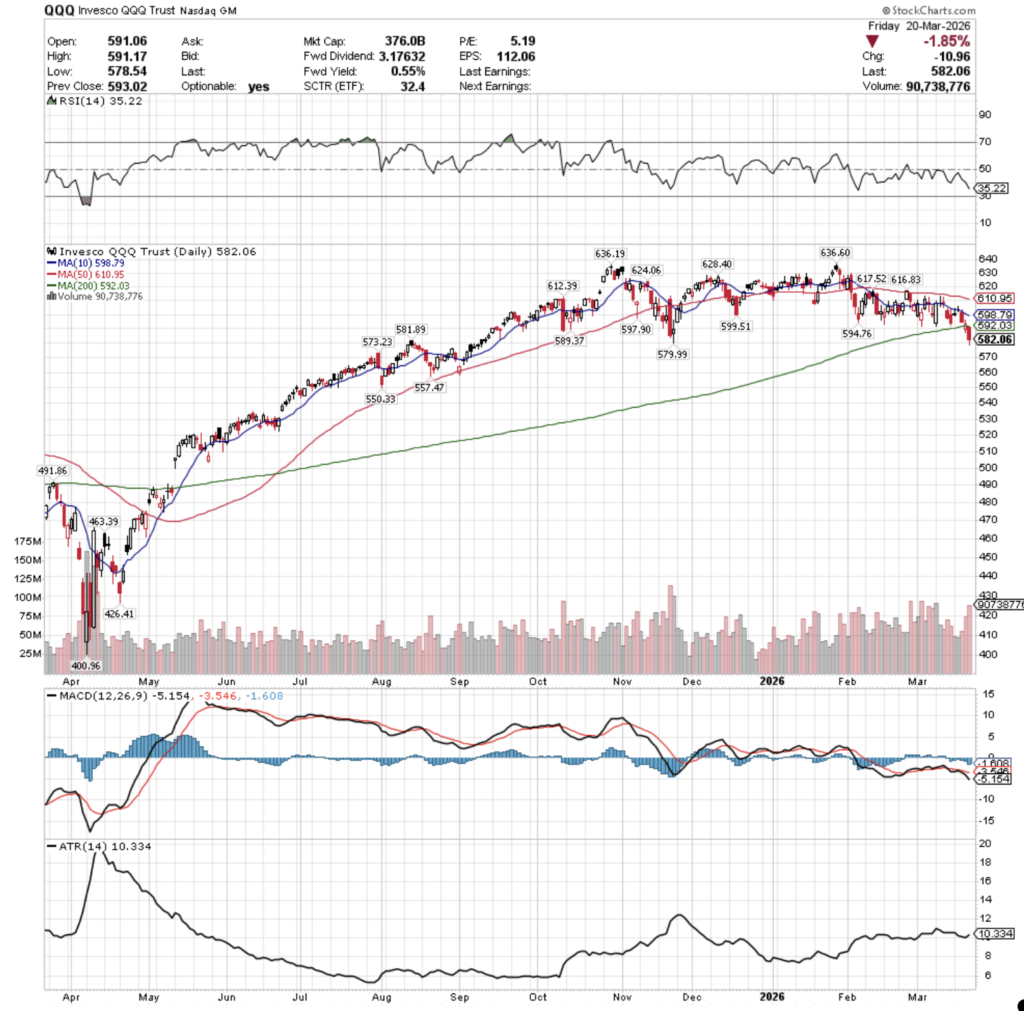
Their RSI is trending bearishly towards the neutral 30-mark, currently at 35.22, with an MACD that is bearish & breaking off more bearishly per its histogram.
Volumes were +17.42% higher than the prior year’s average (63,976,000 vs. 54,485,139), which has bearish implications for the same reasons cited above for SPY, all sessions ended lower than they opened & the top three volume sessions were outright declines.
Monday opened higher, tested higher to get rejected by the 10 day moving average’s resistance, before closing lower on the day as a skinny spinning top on low volume, indicating hesitency & uncertainty.
Tuesday opened on a gap up in-line with the 10 DMA, broke above temporarily, then dipped below it, ultimately closing as a doji in-line with it on the week’s lowest volume, which did not project any signals of confidence among market participants.
Wednesday opened on a gap lower, and proceeded to decline -1.39% and volume perked up above the levels of the week’s first two sessions.
Thursday opened on another gap lower below the 200 day moving average, signaling that the tech-heavy index had broken down the long-term trend, but after briefly declining more bulls stepped in to push its close higher than the open, on the second highest volume of the week.
This volume spike is attributed to both the original gap down selling, as well as the buying pressure that it took to push back to close above the 200 DMA.
Friday opened lower, in-line with the 200 DMA & sunk throughout the session in a selloff into the weekend, as nobody wanted to take risk home with them given the current international/war environment.
Heading into the new week, the upside case relies around breaking out above the 200 day moving average’s resistance & then breaking out above the 10 DMA, which along with the 50 DMA are approaching the 200 DMA bearishly with the 10 DMA looking to death cross by Wednesday.
The consolidation case sees QQQ oscillating around the 200 DMA awaiting an upside or downside catalyst (else the arrival of the moving averages mentioned above).
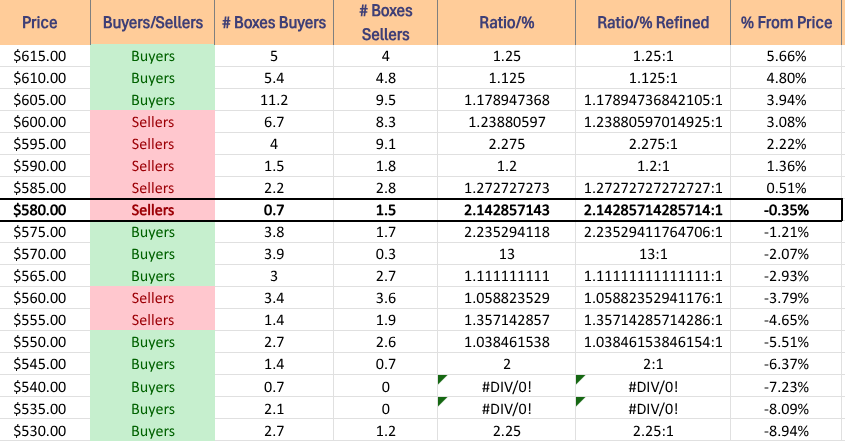
The downside case gets intersting, as the first support level is in a Seller zone, the next two are in Buyer zones & the fourth is in a Seller zone.
Should we see those passed through all eyes should go to the gatekeeper support levels of $550.33, as should that break down the gaps of last May & June look likely to fill to the downside.
QQQ has support at the $581.89 (Volume Sentiment: Sellers, 2.14:1), $579.99 (Volume Sentiment: Buyers, 2.24:1), $573.23 (Volume Sentiment: Buyers, 13:1) & $557.47/share (Volume Sentiment: Sellers, 1.36:1) price levels, with resistance at the $589.37 (Volume Sentiment: Sellers, 1.27:1), $592.03 (200 Day Moving Average, Volume Sentiment: Sellers, 1.2:1), $594.76 (Volume Sentiment: Sellers, 1.2:1) & $597.90/share (Volume Sentiment: Sellers, 2.28:1) price levels.
IWM, the iShares Russell 2000 ETF lost -1.77% for the week, as the small cap index had the strongest week of the four major index ETFs.
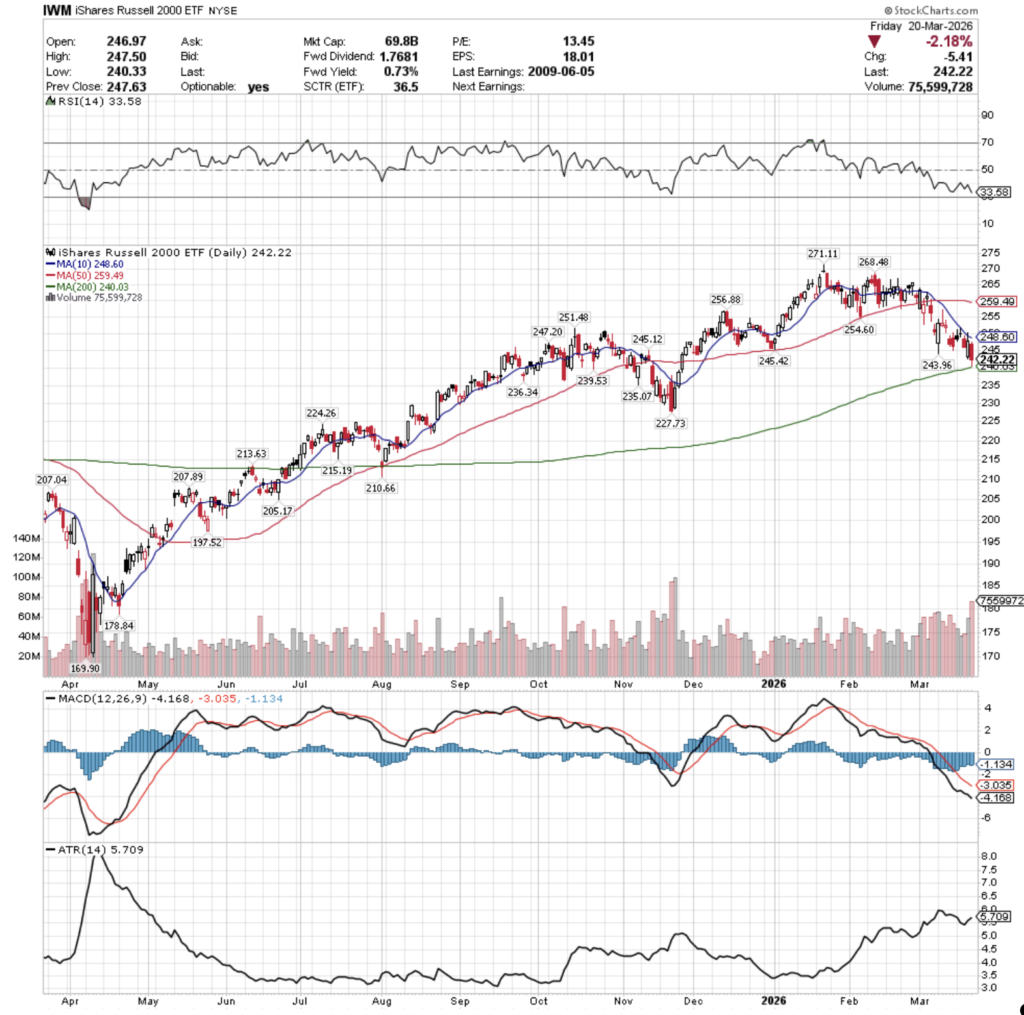
Their RSI is trending bearishly towards the oversold 30 level & is currently at 33.58, while their MACD is still bearish, as it has since late January 27, 2026.
Volumes were +38.6% higher than the prior year’s average (53,712,000 vs. 38,752,390), which should catch some eyeballs given there was only one true advancing session throughout the week.
Monday opened on a gap higher, made a run at the 10 day moving average’s resistance, but was stopped short & sunk to close lower on the day on the week’s third highest volume.
Tuesday opened on a gap higher, ran up & through the resistance of the 10 DMA, before slumping back down to test lower & ultimately close as a doji +0.63% on the day on weak volume, indicating that there was uneasiness in the air.
Wednesday showed a gap down, that attempted to run higher, but ultimately sunk throughout the session.
Thursday opened on a gap lower, tested lower, before powering higher to temporarily break above the 10 DMA’s resistance, but settled lower to post daily gains of +0.65% on the week’s second highest volume.
Friday opened lower, made a brief attempt higher, before risk came off the table & IWM sunk-2.18% on the week’s highest volume heading into the weekend, while also temporarily breaking down below the 200 day moving average.
Heading into the new week, the upside case revolves around breaking out and staying above the 10 day moving average’s resistance, as the short-term trend has remained sustainable& sturdy for the better part of since mid-January.
This will require a lot of increased advancing volume to accomplish, as you can see it has either held resilient, or been sticky with IWM oscillating around it for the majority of that period.
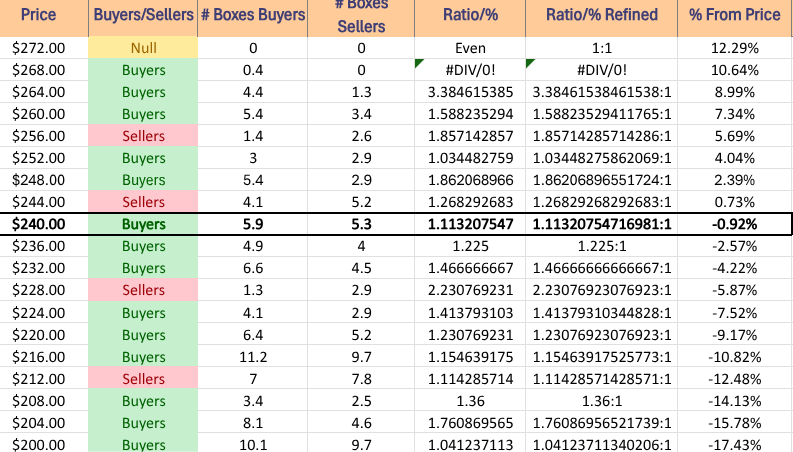
IWM has support at the $240.03 (200 Day Moving Average, Volume Sentiment: Buyers, 1.11:1), $239.53 (Volume Sentiment: Buyers, 1.23:1), $236.34 (Volume Sentiment: Buyers, 1.23:1) & $235.07/share (Volume Sentiment: Buyers, 1.47:1) price levels, with resistance at the $243.96 (Volume Sentiment: Buyers, 1.11:1), $245.12 (Volume Sentiment: Sellers, 1.27:1), $245.42 (Volume Sentiment: Sellers, 1.27:1) & $247.20/share (Volume Sentiment: Sellers, 1.27:1) price levels.
DIA, the SPDR Dow Jones Industrial Average ETF declined -2.26% for the week, faring the worst of the four major index ETFs as investors dumped blue chip names.
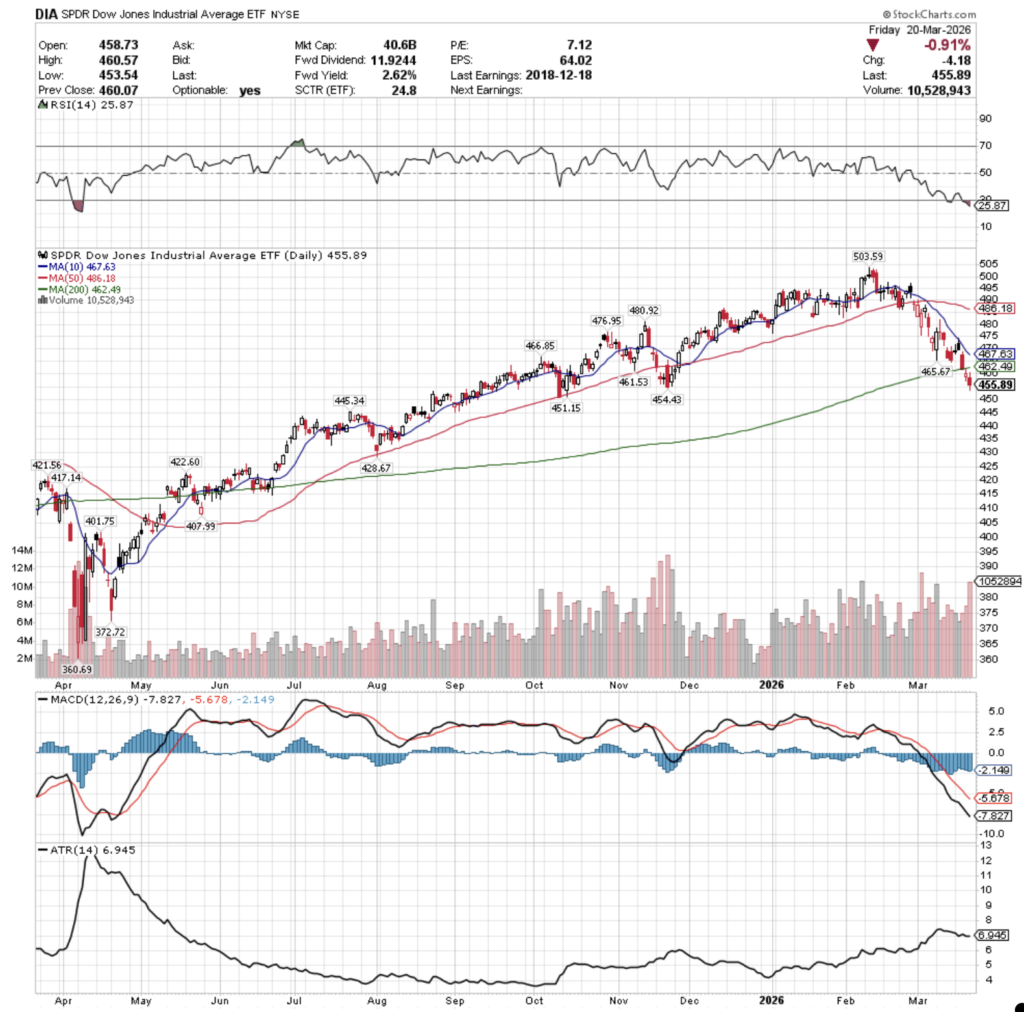
Their RSI is in oversold territory, currently at 25.87, while their MACD is bearish, as it has been for the majority of the past month and a half.
Volumes were +49.21% higher than the prior year’s average levels (7,752,000 vs. 5,195,299), which paints quite a risk-off story for the blue chip index, especially after its resilience through times where other indexes saw volatility.
Monday opened on a gap up, fell short of reaching the 10 DMA’s resistance & ultimately closed the session as a doji on the week’s second lowest volume, not inspiring confidence & showing that there was not much bullishness or enthusiasm to be found anywhere.
Tuesday opened on a gap up just below the 10 DMA, temporarily poked its upper shadow through it, but then declined throughout the rest of the session to close below its opening price.
Wednesday opened on a gap down & continued lower to close just below the 200 day moving average, as even the long-term trend of the blue chipswasn’t spared.
Thursday opened on a gap lower below the 200 DMA, but managed to run higher and close down for the day but above its opening price as a spinning top candle that never breached the resistance of the 200 DMA, signaling bearish indecision.
Friday also opened on a gap lower, temporarily breaking above the $400/share mark, but ultimately sank -0.91% on the day.
Heading into the new week the upside case revolves around being able to break out above the 200 DMA with strong advancing volume.
Without that volume mentioned there will not be much strength of support behind the move & it should be viewed with skepticism.
The consolidation case revolves around staying within the range of Thursday & Friday’s candles while awaiting an upside or downside catalyst as the 10 DMA crosses below the 200 DMA bearishly to catch up to price.
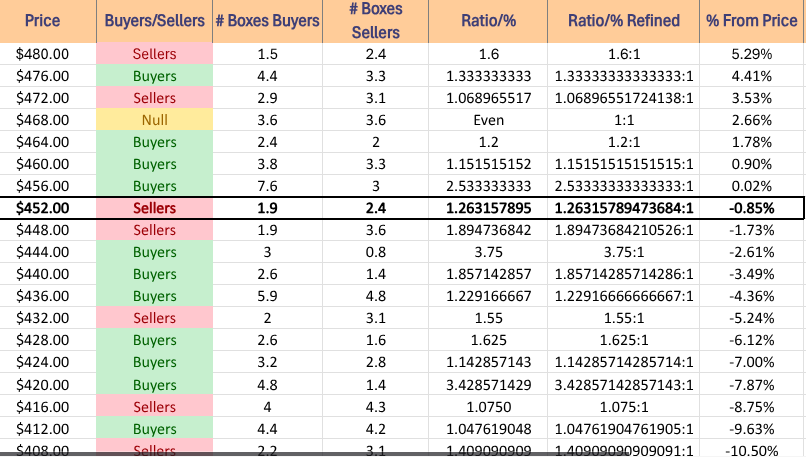
The downside case shows the next two support levels are in Seller zones, while the following two are in Buyer zones.
The fourth support level is the gatekeeper to the gap ups of May & June of 2025, which will make it a key area to watch in the event of a decline.
DIA has support at the $454.43 (Volume Sentiment: Sellers, 1.26:1), $451.15 (Volume Sentiment: Sellers, 1.9:1), $445.34 (Volume Sentiment: Buyers, 3.75:1) & $428.67/share (Volume Sentiment: Buyers, 1.63:1) price levels, with resistance at the $461.53 (Volume Sentiment: Buyers, 1.15:1), $462.49 (200 Day Moving Average, Volume Sentiment: Buyers, 1.15:1), $465.67 (Volume Sentiment: Buyers, 1.2:1) & $466.85/share (Volume Sentiment: Buyers, 1.2:1) price levels.
The Week Ahead
Monday the week begins with Construction Spending (Delayed Report*) data at 10 am & there are no major earnings reports scheduled for release.
U.S. Productivity (Revision) data is released Tuesday at 8:30 am, before S&P Flash U.S. Services PMI & S&P Flash U.S. Manufacturing PMI data comes out at 9:45 am & Fed Governor Barr speaks at 6:30 pm.
Tuesday’s earnings reports start off with Concentrix, Core & Main and Smithfield Foods before the opening bell, followed by AAR Corp., Braze, KB Home & Worthington Enterprises after the session’s close.
Wednesday features Import Price Index & Import Price Index minus Fuel data at 8:30 am, followed by Fed Governor Miran speaking at 4:10 pm.
Chewy reports earnings Wednesday morning, along with Cintas, Kingsoft Cloud, Paychex & Winnebego, followed by Enerpac Tool Group, H.B. Fuller, JBS SA, Jefferies, Karman Space & Defense, MillerKnoll, Navan & Worthington Steel after the session’s close.
Initial Jobless Claims data comes out Thursday at 8:30 am, followed by Fed Governor Cook speaking at 4pm, Fed Governor Miran speaking at 6:30 pm, Fed Vice Chair Jefferson speaking at 7pm & Fed Governor Barr speaking at 7:10 pm.
Thursday morning’s earnings reports include BRP Inc., Commercial Metals, Lovesac & Shoe Carnival, before Argan, BitGo Holdings & Oxford Industries after the closing bell.
Friday the week winds down with Consumer Sentiment (final) data at 10 am.
Carnival & Legence Corp. report earnings before Friday’s opening bell.
See you back here next week!
*** I DO NOT OWN SHARES OR OPTIONS CONTRACT POSITIONS IN SPY, QQQ, IWM OR DIA AT THE TIME OF PUBLISHING THIS ARTICLE ***