Quite a lot has taken place since our last check-in on Volume Sentiment Analysis in January, between international relations, wars & Federal Reserve policy & shakeups there’s been an escalation in volatility.
MACDs have been bearish & Average True Ranges rising for the major indexes for much of 2026, with seemingly limited upside catalysts coming anytime soon.
In such situations it is imperative to understand market participants behavior when assessing the strength/resistance of support/resistance levels whether you’re day-trading in short time intervals, swing trading, or just a buy & hold investor who’s looking for places to put their stop orders in.
What’s become more interesting is that the two pairs of SPY & QQQ and IWM & DIA which tend to move similar to one another are all now showing similar behavior, indicating that there is some fear out there.
The data from this post is based on Friday 3/20/2026’s close, where the VIX closed at 26.78, indicating an implied one day move of +/-1.69% & an implied one month move of +/-7.74%.
Given that SPY was already ~6.8% below the January all-time high & the sparse support levels gatekeeping the unfilled gaps of May & June of 2025 it is a solid time to check in on volume sentiment at each price level the four major indexes have traded at historically.
Each section below contains a view of each index ETF’s chart (for a technical breakdown of each’s chart, see last week’s market review note, this week’s will be published tomorrow), as well as a list of their current one year support & resistance levels with the volume sentiment noted beneath it on the table.
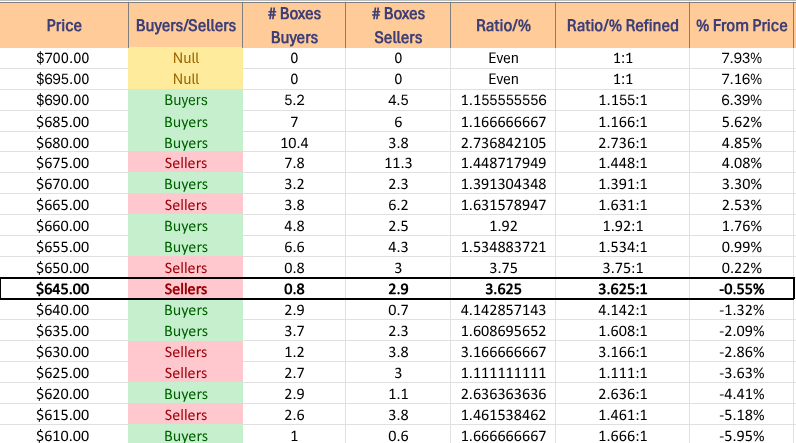
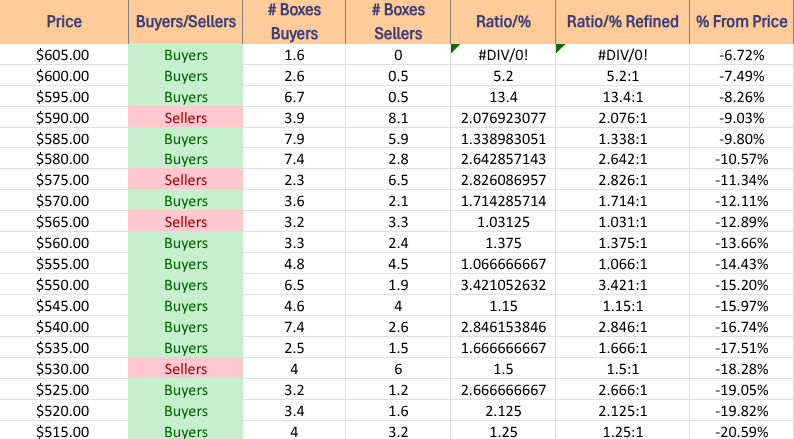
There is an additional table beneath this table with each price level’s sentiment, as well as a typed text version below that is able to be copied & pasted.
Note that “NULL, 0:0*” values denote areas that each name has traded at (or gapped through, in some instances) but with limited volume data to work with from a comparison standpoint in terms of creating a ratio of buyers:sellers (or vice versa) or is the outlier above the highest/lowest level with price data.
Also, prices that do have a ratio of Buyers:Sellers (Sellers:Buyers) where the denominator is 0 are denoted with an asterisk “*”.
In the written lists of the price levels & volume sentiments the price levels that contain support & resistance levels are marked in BOLD.
Recall that at price extremes such as the highs that we have recently hit there will tend to be skewed data due to the small sample size & factor that into how you interpret each price level’s reported sentiment.
This is intended to serve as an additional tool, similar to a barometer to use during your due diligence process & is not meant to replace doing your own research & is not financial advice.
Price Level:Volume Sentiment Analysis For SPY, The SPDR S&P 500 ETF
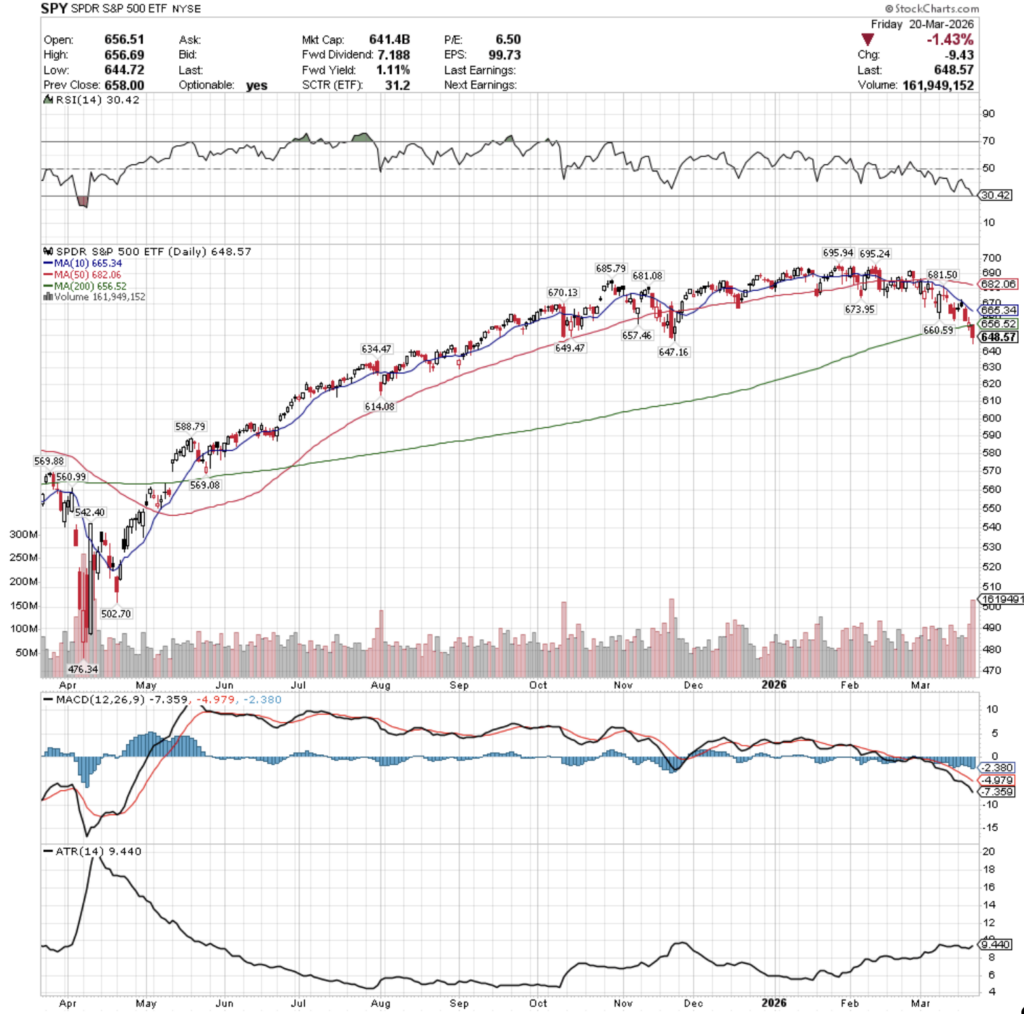
SPY, the SDR S&P 500 ETF‘s Bollinger bands expanded as predicted in the January 6th note on Volume Sentiment, welcoming in the beginning of months of volatility, which only looks to increase.
In addition to the factors mentioned above, there is also delayed data from government shutdown periods impacting the upcoming performance for SPY.
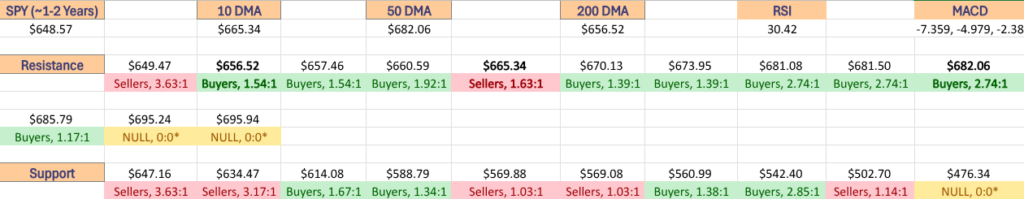
This makes the tables below well worth reviewing, as the top one highlights the volume sentiment at one year support/resistance levels using the past ~1-2 years worth of data for each price level.
The tables below show the full on data for each price level, and beneath that is a copy & pastable list to aid in your due diligence.
This is a barometer to aid in research & due diligence and is not financial advice.
$700 – NULL – 0:0*, +7.93% From 3/20/2026’s Closing Price
$695 – NULL – 0:0*, +7.16% From 3/20/2026’s Closing Price
$690 – Buyers – 1.16:1, +6.39% From 3/20/2026’s Closing Price
$685 – Buyers – 1.17:1, +5.62% From 3/20/2026’s Closing Price
$680 – Buyers – 2.74:1, +4.85% From 3/20/2026’s Closing Price – 50 Day Moving Average*
$675 – Sellers – 1.45:1, +4.08% From 3/20/2026’s Closing Price
$670 – Buyers – 1.39:1, +3.3% From 3/20/2026’s Closing Price
$665 – Sellers – 1.63:1, +2.53% From 3/20/2026’s Closing Price – 10 Day Moving Average*
$660 – Buyers – 1.92:1, +1.76% From 3/20/2026’s Closing Price
$655 – Buyers – 1.53:1, +0.99% From 3/20/2026’s Closing Price – 200 Day Moving Average*
$650 – Sellers – 3.75:1, +0.22% From 3/20/2026’s Closing Price
$645 – Sellers – 3.63:1, -0.55% From 3/20/2026’s Closing Price – Current Price Level*
$640 – Buyers – 4.14:1, -1.32% From 3/20/2026’s Closing Price
$635 – Buyers – 1.61:1, -2.09% From 3/20/2026’s Closing Price
$630 – Sellers – 3.17:1, -2.86% From 3/20/2026’s Closing Price
$625 – Sellers – 1.11:1, -3.63% From 3/20/2026’s Closing Price
$620 – Buyers – 2.64:1, -4.41% From 3/20/2026’s Closing Price
$615 – Sellers – 1.46:1, -5.18% From 3/20/2026’s Closing Price
$610 – Buyers – 1.67:1, -5.95% From 3/20/2026’s Closing Price
$605 – Buyers – 1.6:0*, -6.72% From 3/20/2026’s Closing Price
$600 – Buyers – 5.2:1, -7.49% From 3/20/2026’s Closing Price
$595 – Buyers – 13.4:1, -8.26% From 3/20/2026’s Closing Price
$590 – Sellers – 2.08:1, -9.03% From 3/20/2026’s Closing Price
$585 – Buyers – 1.34:1, -9.8% From 3/20/2026’s Closing Price
$580 – Buyers – 2.64:1, -10.57% From 3/20/2026’s Closing Price
$575 – Sellers – 2.83:1, -11.34% From 3/20/2026’s Closing Price
$570 – Buyers – 1.71:1, -12.11% From 3/20/2026’s Closing Price
$565 – Sellers – 1.03:1, -12.89% From 3/20/2026’s Closing Price
$560 – Buyers – 1.38:1, -13.66% From 3/20/2026’s Closing Price
$555 – Buyers – 1.07:1, -14.43% From 3/20/2026’s Closing Price
$550 – Buyers – 3.42:1, -15.2% From 3/20/2026’s Closing Price
$545 – Buyers – 1.15:1, -15.97% From 3/20/2026’s Closing Price
$540 – Buyers – 2.85:1, -16.74% From 3/20/2026’s Closing Price
$535 – Buyers – 1.67:1, -17.51% From 3/20/2026’s Closing Price
$530 – Sellers – 1.5:1, -18.28% From 3/20/2026’s Closing Price
$525 – Buyers – 2.67:1, -19.05% From 3/20/2026’s Closing Price
$520 – Buyers -2.13:1, -19.82% From 3/20/2026’s Closing Price
$515 – Buyers – 1.25:1, -20.59% From 3/20/2026’s Closing Price
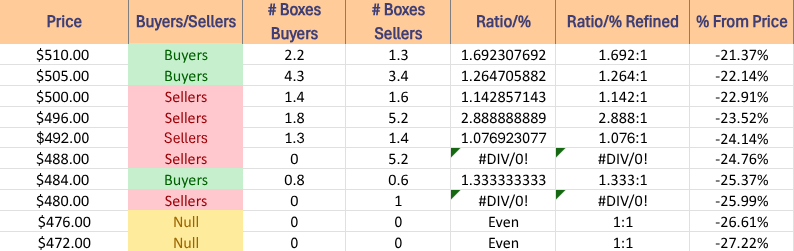
$510 – Buyers – 1.69:1, -21.37% From 3/20/2026’s Closing Price
$505 – Buyers – 1.27:1, -22.14% From 3/20/2026’s Closing Price
$500 – Sellers – 1.14:1, -22.91% From 3/20/2026’s Closing Price
$496 – Sellers – 2.89:1, -23.52% From 3/20/2026’s Closing Price
$492 – Sellers – 1.08:1, -24.14% From 3/20/2026’s Closing Price
$488 – Sellers – 5.2:0*, -24.76% From 3/20/2026’s Closing Price
$484 – Buyers – 1.33:1, -25.37% From 3/20/2026’s Closing Price
$480 – Sellers – 1:0*, -25.99% From 3/20/2026’s Closing Price
$476 – NULL – 0:0*, -26.61% From 3/20/2026’s Closing Price
$472 – NULL – 0:0*, -27.22% From 3/20/2026’s Closing Price
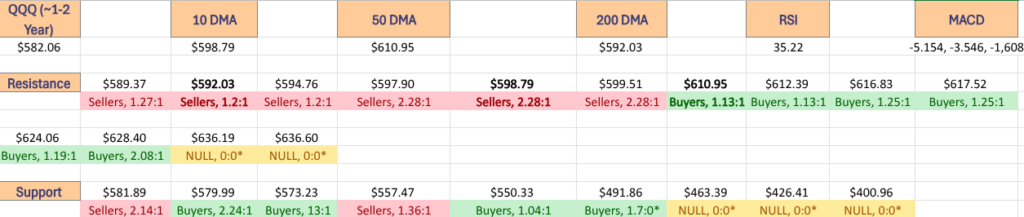
Price Level:Volume Sentiment Analysis For QQQ, The Invesco QQQ Trust ETF
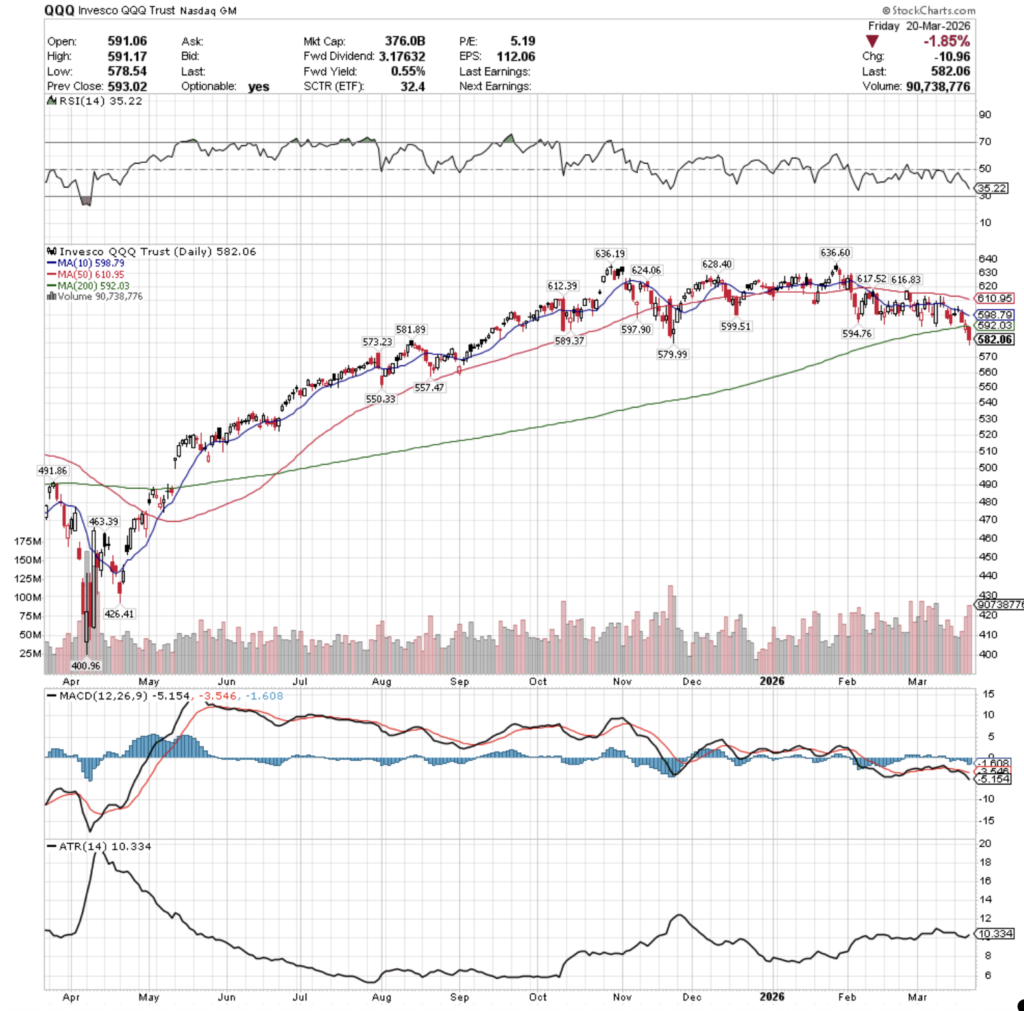
QQQ, the Invesco QQQ Trust ETF has also shown an uptick in volatility in 2026, as it seems that folks have begun to realize that the AI/tech trades have gotten ahead of themselves.
While they’ve moved similarly to SPY over the past few years, it is worth examining them more closely on their own in the coming volatile environment.
Referencing the tables below can be of value both for QQQ & for understanding how their major components may move in the future when comparing the two.
The$570-574.99/share level is the primary anchor point in terms of Buyer strength, but that also may become heavily diluted given it is currently leaning 13:1 in terms of Buyers:Sellers, which will be important to watch.
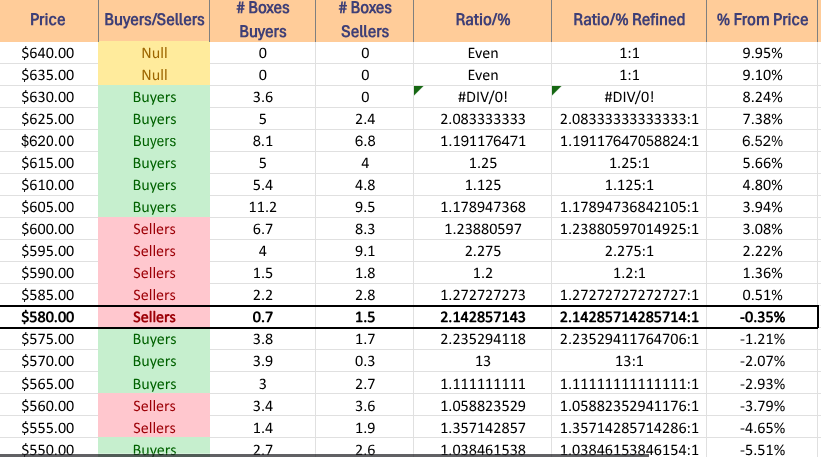
$640 – NULL – 0:0*, +9.95% From 3/20/2026’s Closing Price
$635 – NULL – 0:0*, +9.1% From 3/20/2026’s Closing Price
$630 – Buyers – 3.6:0*, +8.24% From 3/20/2026’s Closing Price
$625 – Buyers – 2.08:1, +7.38% From 3/20/2026’s Closing Price
$620 – Buyers – 1.19:1, +6.52% From 3/20/2026’s Closing Price
$615 – Buyers – 1.25:1, +5.66% From 3/20/2026’s Closing Price
$610 – Buyers – 1.13:1, +4.8% From 3/20/2026’s Closing Price – 50 Day Moving Average*
$605 – Buyers – 1.18:1, +3.94% From 3/20/2026’s Closing Price
$600 – Sellers – 1.24:1, +3.08% From 3/20/2026’s Closing Price
$595 – Sellers – 2.28:1, +2.22% From 3/20/2026’s Closing Price – 10 Day Moving Average*
$590 – Sellers – 1.2:1, +1.36% From 3/20/2026’s Closing Price – 200 Day Moving Average*
$585 – Sellers – 1.27:1, 0.51% From 3/20/2026’s Closing Price
$580 – Sellers – 2.14:1, -0.35% From 3/20/2026’s Closing Price, Current Price Level*
$575 – Buyers – 2.24:1, -1.21% From 3/20/2026’s Closing Price
$570 – Buyers – 13:1, -2.07% From 3/20/2026’s Closing Price
$565 – Buyers – 1.11:1, -2.93% From 3/20/2026’s Closing Price
$560 – Sellers – 1.06:1, -3.79% From 3/20/2026’s Closing Price
$555 – Sellers – 1.36:1, -4.65% From 3/20/2026’s Closing Price
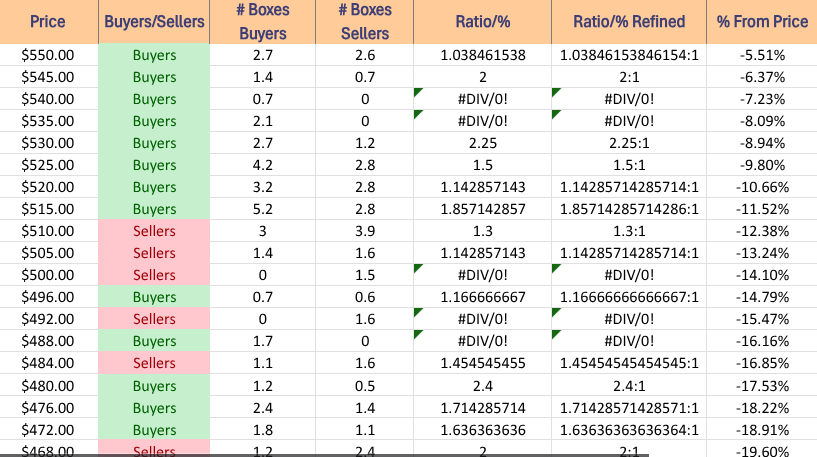
$550 – Buyers – 1.04:1, -5.51% From 3/20/2026’s Closing Price
$545 – Buyers – 2:1, -6.37% From 3/20/2026’s Closing Price
$540 – Buyers – 0.7:0*, -7.23% From 3/20/2026’s Closing Price
$535 – Buyers – 2.1:0*, -8.09% From 3/20/2026’s Closing Price
$530 – Buyers – 2.25:1, -8.94% From 3/20/2026’s Closing Price
$525 – Buyers – 1.5:1, -9.8% From 3/20/2026’s Closing Price
$520 – Buyers – 1.14:1, -10.66% From 3/20/2026’s Closing Price
$515 – Buyers – 1.86:1, -11.52% From 3/20/2026’s Closing Price
$510 – Sellers – 1.3:1, -12.38% From 3/20/2026’s Closing Price
$505 – Sellers – 1.14:1, -13.24% From 3/20/2026’s Closing Price
$500 – Sellers – 1.5:0*, -14.1% From 3/20/2026’s Closing Price
$496 – Buyers – 1.17:1, -14.79% From 3/20/2026’s Closing Price
$492 – Sellers – 1.6:0*, -15.47% From 3/20/2026’s Closing Price
$488 – Buyers – 1.7:0*, -16.16% From 3/20/2026’s Closing Price
$484 – Sellers – 1.46:1, -16.85% From 3/20/2026’s Closing Price
$480 – Buyers – 2.4:1, -17.53% From 3/20/2026’s Closing Price
$476 – Buyers – 1.71:1, -18.22% From 3/20/2026’s Closing Price
$472 – Buyers – 1.64:1, -18.91% From 3/20/2026’s Closing Price
$468 – Sellers – 2:1, -19.6% From 3/20/2026’s Closing Price
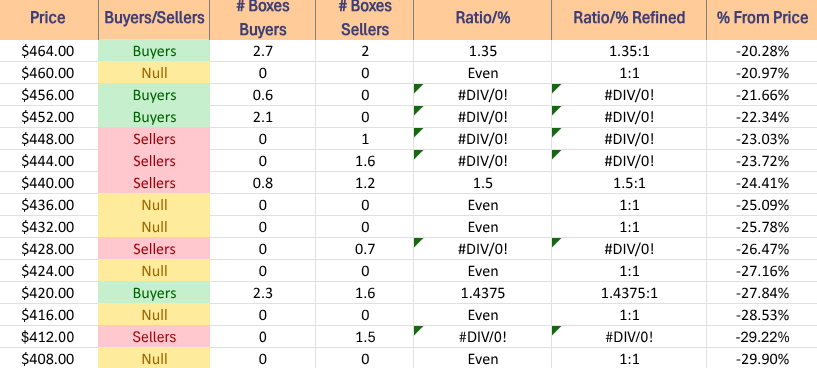
$464 – Buyers – 1.35:1, -20.28% From 3/20/2026’s Closing Price
$460 – NULL – 0:0*, -20.97% From 3/20/2026’s Closing Price
$456 – Buyer s- 0.6:0*, -21.66% From 3/20/2026’s Closing Price
$452 – Buyers – 2.1:0*, -22.34% From 3/20/2026’s Closing Price
$448 – Sellers – 1:0*, -23.03% From 3/20/2026’s Closing Price
$444 – Sellers – 1.6:0*, -23.72% From 3/20/2026’s Closing Price
$440 – Sellers – 1.5:1, -24.41% From 3/20/2026’s Closing Price
$436 – NULL – 0:0*, -25.09% From 3/20/2026’s Closing Price
$432 – NULL – 0:0*, -25.78% From 3/20/2026’s Closing Price
$428 – Sellers – 0.7:0*, -26.47% From 3/20/2026’s Closing Price
$424 – NULL – 0:0*, -27.16% From 3/20/2026’s Closing Price
$420 – Buyers – 1.44:1, -27.84% From 3/20/2026’s Closing Price
$416 – NULL – 0:0*, -28.53% From 3/20/2026’s Closing Price
$412 – Sellers – 1.5:0*, -29.22% From 3/20/2026’s Closing Price
$408 – NULL – 0:0*, -29.9% From 3/20/2026’s Closing Price
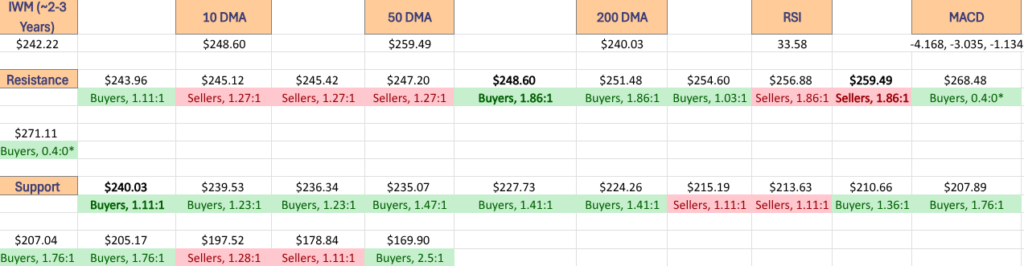
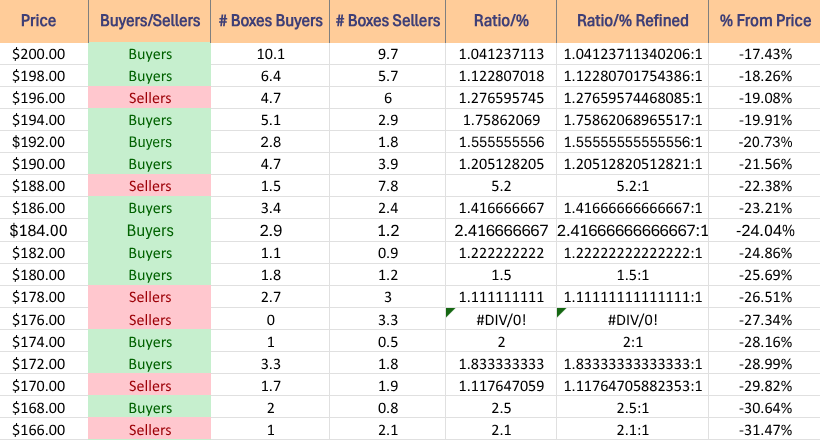
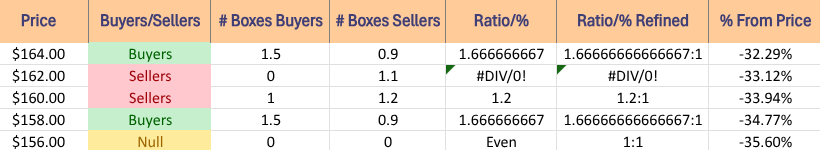
Price Level:Volume Sentiment Analysis For IWM, The iShares Russell 2000 ETF
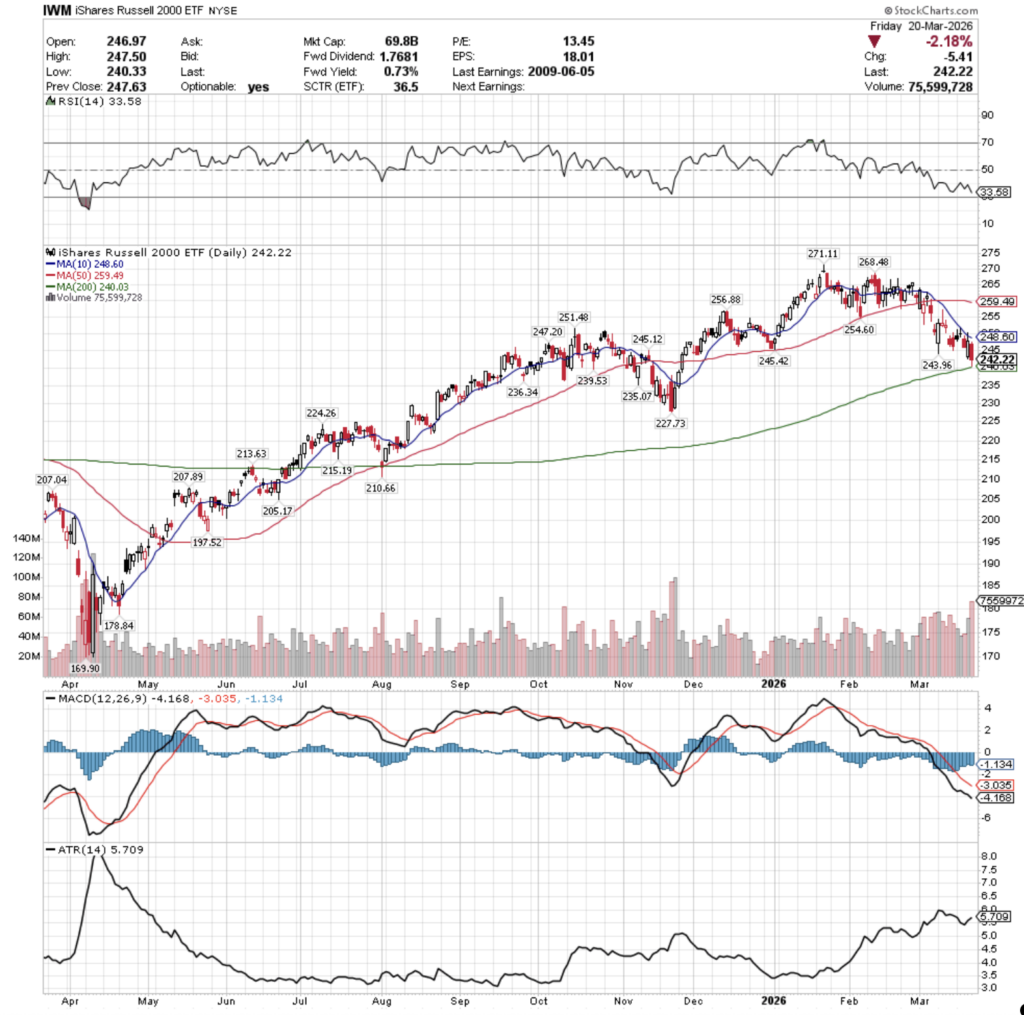
IWM, the iShares Russell 2000 ETF‘s Bollinger Bands are contracting cururrently, but look set to expand within a week, which indicates heightened volatility.
While the small cap index is likely to follow the lead of its larger peers in terms of macro sentiment, it is still worth having an understanding of where it may catch support/break resistance based on the difference of speculation between the market cap sizes, shown below.
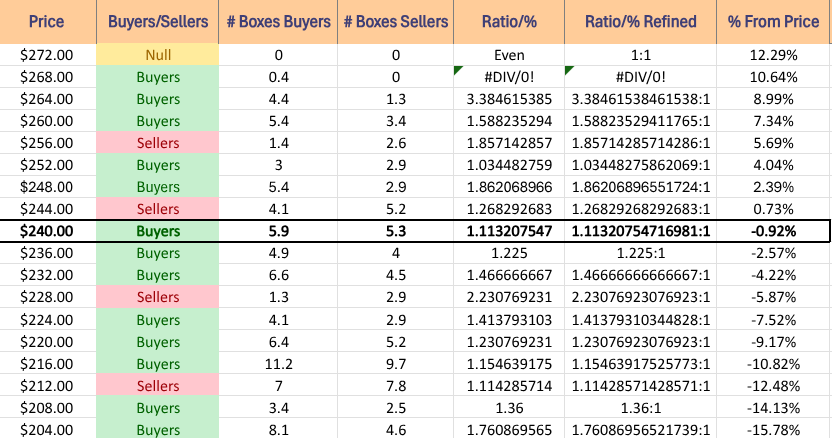
$272 – NULL – 0:0*, +12.29% From 3/20/2026’s Closing Price
$268 – Buyers – 0.4:0*, +10.64% From 3/20/2026’s Closing Price
$264 – Buyers – 3.39:1, +8.99% From 3/20/2026’s Closing Price
$260 – Buyers – 1.59:1, +7.34% From 3/20/2026’s Closing Price
$256 – Sellers – 1.86:1, +5.69% From 3/20/2026’s Closing Price -50 Day Moving Average*
$252 – Buyers – 1.04:1, +4.04% From 3/20/2026’s Closing Price
$248 – Buyers – 1.86:1, +2.39% From 3/20/2026’s Closing Price – 10 Day Moving Average*
$244 – Sellers – 1.27:1, +0.73% From 3/20/2026’s Closing Price
$240 – Buyers – 1.11:1, -0.92% From 3/20/2026’s Closing Price – Current Price Level & 200 Day Moving Average**
$236 – Buyers – 1.23:1, -2.57% From 3/20/2026’s Closing Price
$232 – Buyers – 1.47:1, -4.22% From 3/20/2026’s Closing Price
$228 – Sellers – 2.23:1, -5.87% From 3/20/2026’s Closing Price
$224 – Buyers – 1.41:1, -7.52% From 3/20/2026’s Closing Price
$220 – Buyers – 1.23:1, -9.17% From 3/20/2026’s Closing Price
$216 – Buyers – 1.16:1, -10.82% From 3/20/2026’s Closing Price
$212 – Sellers – 1.11:1, -12.48% From 3/20/2026’s Closing Price
$208 – Buyers – 1.36:1, -14.13% From 3/20/2026’s Closing Price
$204 – Buyers – 1.76:1, -15.78% From 3/20/2026’s Closing Price
$200 – Buyers – 1.04:1, -17.43% From 3/20/2026’s Closing Price
$198 – Buyers – 1.12:1, -18.26% From 3/20/2026’s Closing Price
$196 – Sellers – 1.28:1, -19.08% From 3/20/2026’s Closing Price
$194 – Buyers – 1.76:1, -19.91% From 3/20/2026’s Closing Price
$192 – Buyers – 1.56:1, -20.73% From 3/20/2026’s Closing Price
$190 – Buyers – 1.21:1, -21.56% From 3/20/2026’s Closing Price
$188 – Sellers – 5.2:1, -22.38% From 3/20/2026’s Closing Price
$186 – Buyers – 1.42:1, -23.21% From 3/20/2026’s Closing Price
$184 – Buyers – 2.42:1, -24.04% From 3/20/2026’s Closing Price
$182 – Buyers – 1.22:1, -24.86% From 3/20/2026’s Closing Price
$180 – Buyers – 1.5:1, -25.69% From 3/20/2026’s Closing Price
$178 – Sellers – 1.11:1, -26.51% From 3/20/2026’s Closing Price
$176 – Sellers – 3.3:0*, -27.34% From 3/20/2026’s Closing Price
$174 – Buyers – 2:1, -28.16% From 3/20/2026’s Closing Price
$172 – Buyers – 1.83:1, -28.99% From 3/20/2026’s Closing Price
$170 – Sellers – 1.12:1, -29.82% From 3/20/2026’s Closing Price
$168 – Buyers – 2.5:1, -30.64% From 3/20/2026’s Closing Price
$166 – Sellers – 2.1:1, -31.47% From 3/20/2026’s Closing Price
$164 – Buyers – 1.67:1, -32.29% From 3/20/2026’s Closing Price
$162 – Sellers – 1.1:0*, -33.12% From 3/20/2026’s Closing Price
$160 – Sellers – 1.2:1, -33.94% From 3/20/2026’s Closing Price
$158 – Buyers – 1.67:1, -34.77% From 3/20/2026’s Closing Price
$156 – NULL – 0:0*, -35.6% From 3/20/2026’s Closing Price
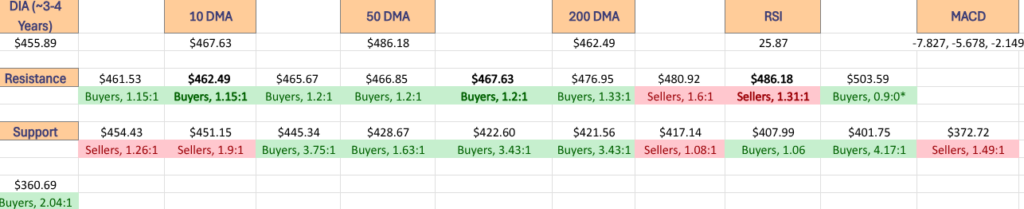
Price Level:Volume Sentiment Analysis For DIA, The SPDR Dow Jones Industrial Average ETF
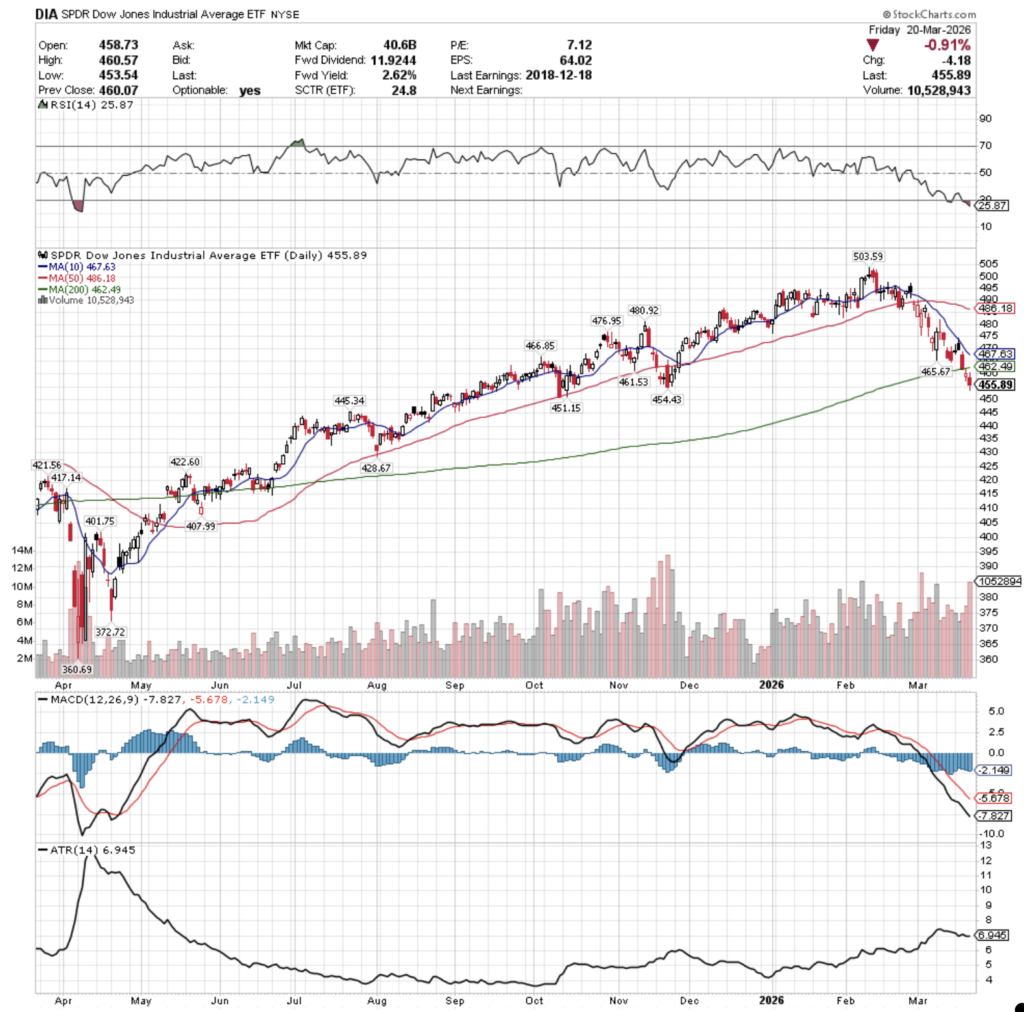
DIA, the SPDR Dow Jones Industrial Average ETF has finally shown surging volumes and signs of fatigue from the “buy & hold” blue-chip crowd.
Tie in the fact that the first two support levels are Seller oriented & there may be more declines on the horizon, especially given how resilient the index has remained vs. the other 3 majors.
The charts & data below may lend aid to analysis of where DIA winds up going next in terms of breaking through support/resistance levels.
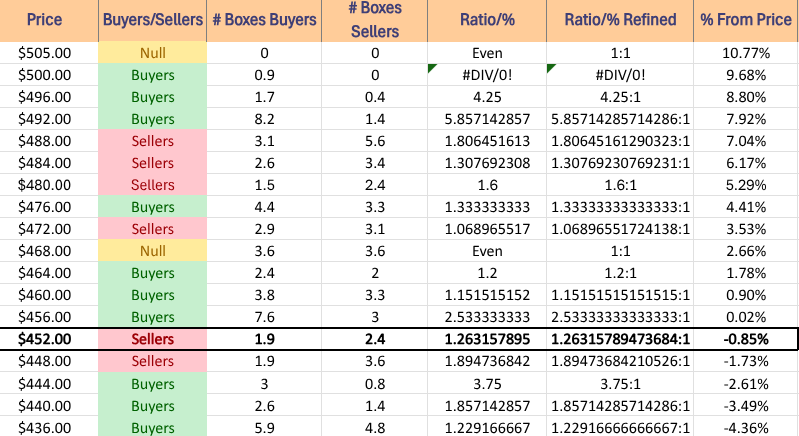
$505 – NULL – 0:0*, +10.77% From 3/20/2026’s Closing Price
$500 – Buyers – 0.9:0*, +9.68% From 3/20/2026’s Closing Price
$496 – Buyers – 4.25:1, +8.8% From 3/20/2026’s Closing Price
$492 – Buyers – 5.86:1, +7.92% From 3/20/2026’s Closing Price
$488 – Sellers – 1.81:1, +7.04% From 3/20/2026’s Closing Price
$484 – Sellers – 1.31:1, +6.17% From 3/20/2026’s Closing Price
$480 – Sellers – 1.6:1, +5.29% From 3/20/2026’s Closing Price
$476 – Buyers – 1.33:1, +4.41% From 3/20/2026’s Closing Price
$472 – Sellers – 1.07:1, +3.53% From 3/20/2026’s Closing Price
$468 – Even – 1:1, +2.66% From 3/20/2026’s Closing Price
$464 – Buyers – 1.2:1, +1.78% From 3/20/2026’s Closing Price
$460 – Buyers – 1.15:1, +0.9% From 3/20/2026’s Closing Price
$456 – Buyers – 2.53:1, +0.02% From 3/20/2026’s Closing Price
$452 – Sellers – 1.26:1, -0.85% From 3/20/2026’s Closing Price – Current Price Level*
$448 – Sellers – 1.9:1, -1.73% From 3/20/2026’s Closing Price
$444 – Buyers – 3.75:1, -2.61% From 3/20/2026’s Closing Price
$440 – Buyers – 1.86:1, -3.49% From 3/20/2026’s Closing Price
$436 – Buyers – 1.23:1, -4.36% From 3/20/2026’s Closing Price
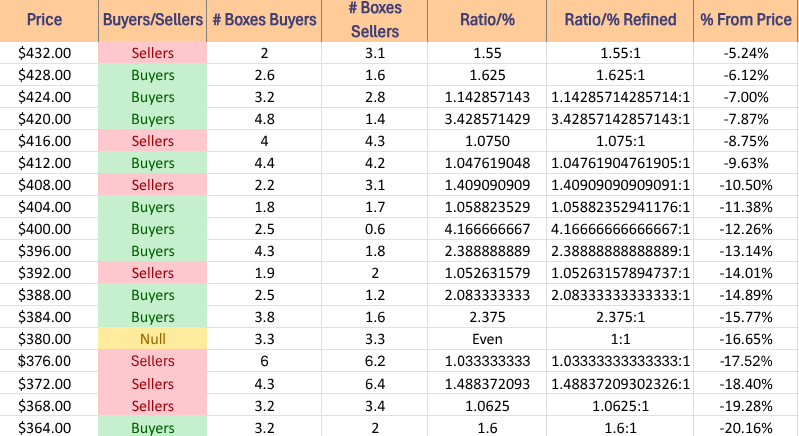
$432 – Sellers – 1.55:1, -5.24% From 3/20/2026’s Closing Price
$428 – Buyers – 1.63:1, -6.12% From 3/20/2026’s Closing Price
$424 – Buyers – 1.14:1, -7% From 3/20/2026’s Closing Price
$420 – Buyers – 3.43:1, -7.87% From 3/20/2026’s Closing Price
$416 – Sellers – 1.08:1, -8.75% From 3/20/2026’s Closing Price
$412 – Buyers – 1.05:1, -9.63% From 3/20/2026’s Closing Price
$408 – Sellers – 1.41:1, -10.5% From 3/20/2026’s Closing Price
$404 – Buyers – 1.06:1, -11.38% From 3/20/2026’s Closing Price
$400 – Buyers – 4.17:1, -12.26% From 3/20/2026’s Closing Price
$396 – Buyers – 2.39:1, -13.14% From 3/20/2026’s Closing Price
$392 – Seller s- 1.05:1, -14.01% From 3/20/2026’s Closing Price
$388 – Buyers – 2.08:1, -14.89% From 3/20/2026’s Closing Price
$384 – Buyers – 2.38:1, -15.77% From 3/20/2026’s Closing Price
$380 – Even – 1:1, -16.65% From 3/20/2026’s Closing Price
$376 – Sellers – 1.03:1, -17.52% From 3/20/2026’s Closing Price
$372 – Sellers – 1.49:1, -18.4% From 3/20/2026’s Closing Price
$368 – Sellers – 1.06:1, -19.28% From 3/20/2026’s Closing Price
$364 – Buyers – 1.6:1, -20.16% From 3/20/2026’s Closing Price
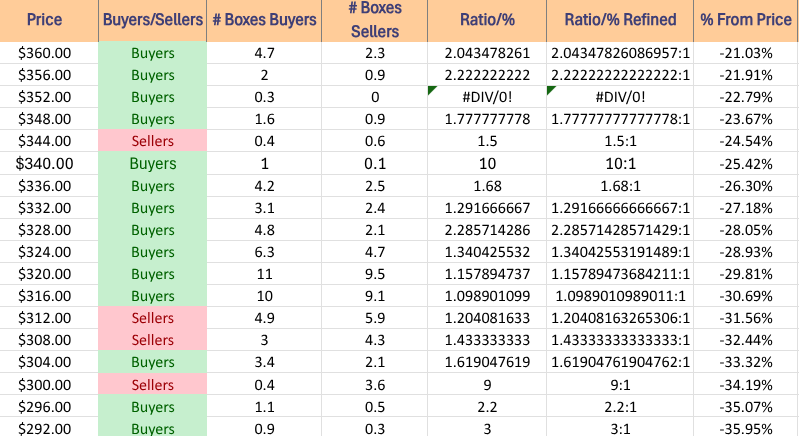
$360 – Buyers – 2.04:1, -21.03% From 3/20/2026’s Closing Price
$356 – Buyers – 2.22:1, -21.91% From 3/20/2026’s Closing Price
$352 – Buyers – 0.3:0*, -22.79%% From 3/20/2026’s Closing Price
$348 – Buyers – 1.78:1, -23.67% From 3/20/2026’s Closing Price
$344 – Sellers – 1.5:1, -24.54% From 3/20/2026’s Closing Price
$340 – Buyers – 10:1, -25.42% From 3/20/2026’s Closing Price
$336 – Buyers – 1.68:1, -26.3% From 3/20/2026’s Closing Price
$332 – Buyers – 1.29:1, -27.18% From 3/20/2026’s Closing Price
$328 – Buyers – 2.29:1, -28.05% From 3/20/2026’s Closing Price
$324 – Buyers – 1.34:1, -28.93% From 3/20/2026’s Closing Price
$320 – Buyers – 1.16:1, -29.81% From 3/20/2026’s Closing Price
$316 – Buyers – 1.1:1, -30.69% From 3/20/2026’s Closing Price
$312 – Sellers – 1.2:1, -31.56% From 3/20/2026’s Closing Price
$308 – Sellers – 1.43:1, -32.44% From 3/20/2026’s Closing Price
$304 – Buyers – 1.62:1, -33.32% From 3/20/2026’s Closing Price
$300 – Sellers – 9:1, -34.19% From 3/20/2026’s Closing Price
$296 – Buyers – 2.2:1, -35.07% From 3/20/2026’s Closing Price
$292 – Buyers – 3:1, -35.95% From 3/20/2026’s Closing Price
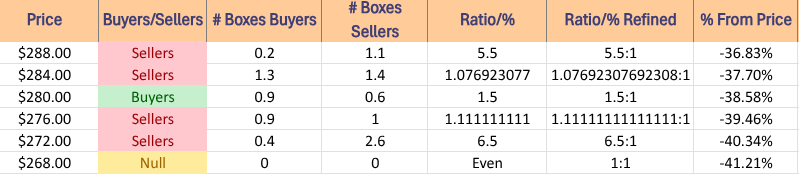
$288 – Sellers – 5.5:1, -36.83% From 3/20/2026’s Closing Price
$284 – Sellers – 1.08:1, -37.7% From 3/20/2026’s Closing Price
$280 – Buyers – 1.5:1, -38.58% From 3/20/2026’s Closing Price
$276 – Sellers – 1.11:1, -39.46% From 3/20/2026’s Closing Price
$272 – Sellers – 6.5:1, -40.34% From 3/20/2026’s Closing Price
$268 – NULL – 0:0*, -41.21% From 3/20/2026’s Closing Price
*** I DO NOT OWN SHARES OR OPTIONS CONTRACT POSITIONS IN SPY, QQQ, IWM OR DIA AT THE TIME OF PUBLISHING THIS ARTICLE ***