This weekend I had a look at Escalade Inc. stock, which trades under the ticker ESCA. ESCA closed for trading on 7/31/20 at $15.35 per share, and offers a number of strengths from fundamental, technical & growth perspectives.
Escalade Inc. $ESCA Stock Fundamentals Look Strong
ESCA has a P/E (ttm) of 24.4, with a P/B of 1.73, and an attractive Dividend Yield of 3.26%.
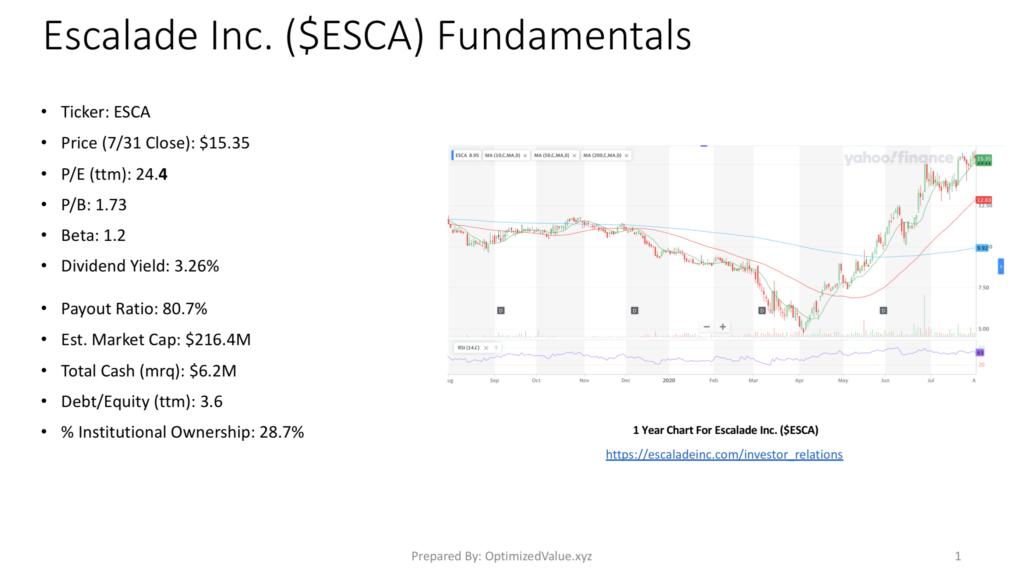
Escalade Inc.’s Payout Ratio is high at 80.7%, but their Debt/Equity (ttm) is stellar compared to their peers, at 3.6. They have a Market Cap of $216.4M, with $6.2M in Total Cash (mrq), which makes them less likely to have a high percentage of Institutional Investors (28.7%)
Escalade Inc. $ESCA’s Stock Technicals Broken Down
ESCA’s 10-Day Moving Average is 15.11, and their 50-Day MA is 12.83, both showing signs of strength when their 200-Day MA of 9.92 is taken into consideration.
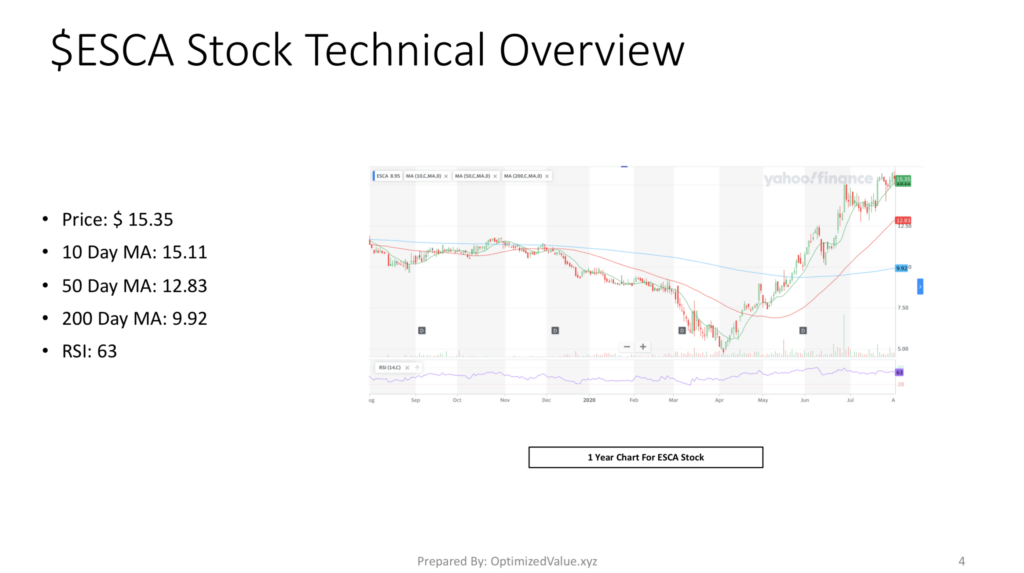
Their RSI is currently 63, which indicates that they are a little more overbought than average, which is expectable after seeing the recent growth that is shown on their chart.
Escalade Inc. ESCA Has Dramatically Outperformed the S&P 500 & NASDAQ Since It IPO’d
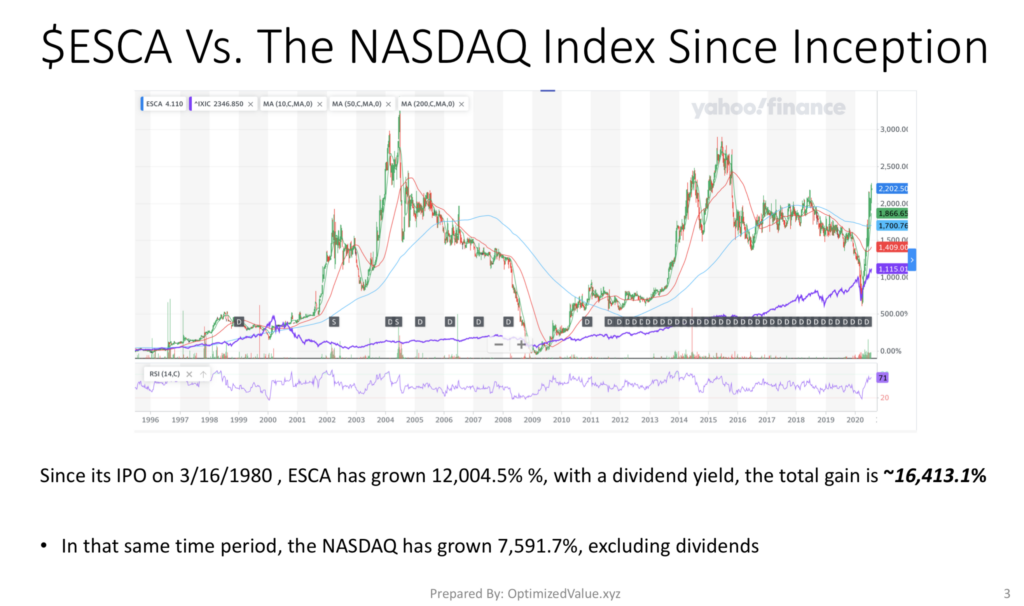
Escalade Inc.’s stock IPO’d on 3/16/1980, and has since grown over 12,004.5%, despite performing multiple stock splits over the years; growing by 16,413.1% total when we factor in Dividends collected over the lifetime of shares.
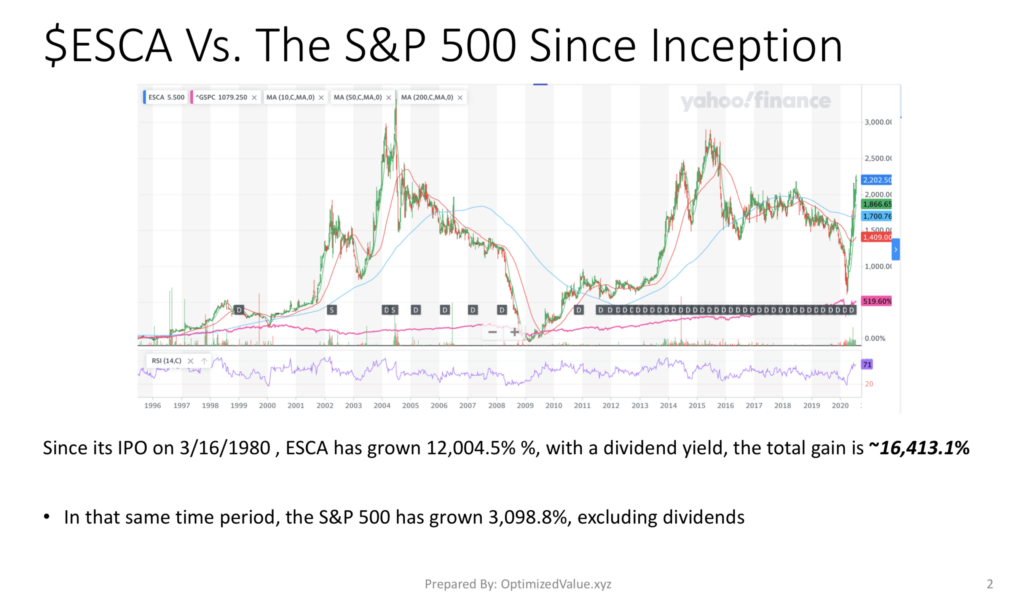
The S&P 500 has only grown 3,098.8% in that time (excluding dividends), with the NASDAQ increasing by 7,591.7% (excluding dividends), making ESCA an advantageous long-term investment over the years.
Escalade Inc. ESCA Stock Fundamentals Are Stronger Than Their Consumer Discretionary Peers
ESCA trades at 73% less on a price-per-share basis than the average Consumer Discretionary Sector stock. Their P/E (ttm) is 59% lower than average, with a ~77% lower P/B.
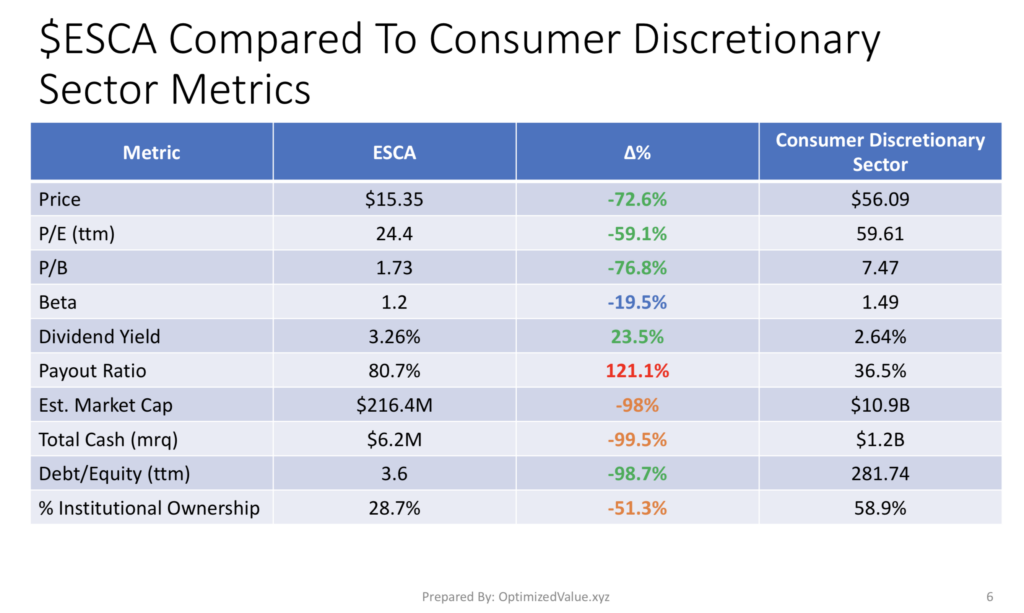
ESCA’s Dividend Yield is ~24% higher than averagem with a Debt/Equity (ttm) that is almost 99% lower than the sector average.
While their market cap is 98% less than average and their Total Cash (mrq) is 99.5% less than average, they only trail by 51% when we examine their % Institutional Ownership.

Escalade Inc. ESCA Stock Fundamentals Compared To The Leisure Products Industry Averages
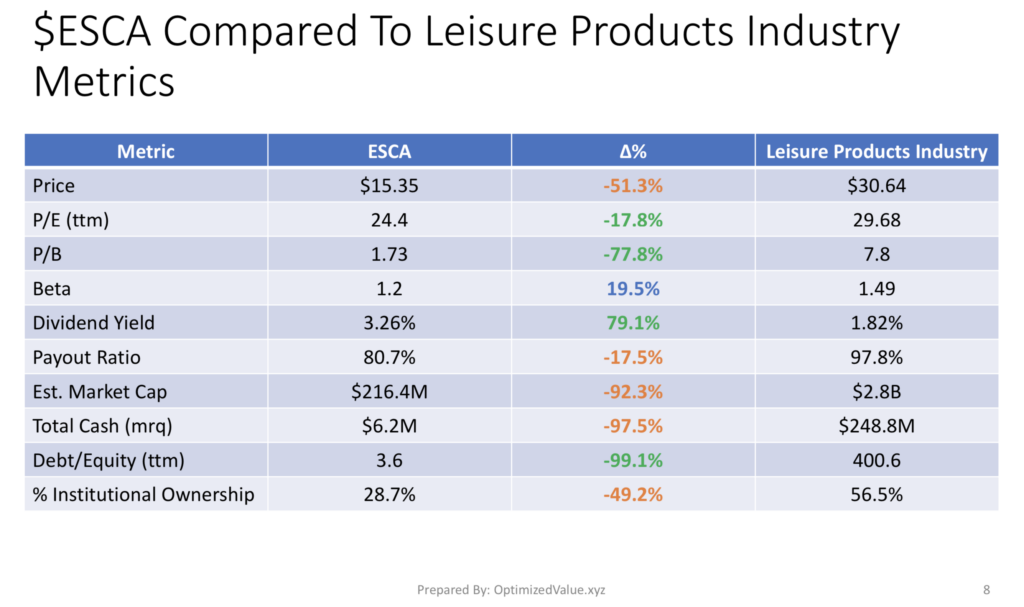
ESCA’s P/E (ttm) is 18% lower than average for Leisure Products Industry stocks, and their P/B is 78% less than average. Pair this with a 79% larger than average Dividend Yield & a 99% lower Debt/Equity (ttm) and they stand out from the crowd, despite being 92% smaller by Average Market Cap.

Tying It All Together
Escalade Inc.’s stock has shown impressive growth since it IPO’d in 1980. Their fundamentals are all very appealing, especially when viewed through the lens of comparing them to their average peer, and their recent technical strength from their chart makes them worth considering for an investment. I will be eyeing an entry after seeing the next bit of price pull-back, with an eye specifically around the $13.50/share mark to see what the trend lines suggest.
For Full PDF Report:
*** I DO NOT OWN SHARES OF ESCALADE INC. ESCA STOCK ***