This week I reviewed Watsco, Inc.’s stock, whose ticker is $WSO, which closed for trading on 7/24 at $227.32 per share.
Watsco, Inc. WSO Stock’s Appealing Fundamentals & Dividend
WSO stock has a P/E (ttm) of 37, with a P/B of 6.07. Their Dividend Yield is 3.12%, offering solid interest on your investment should you hold it for the long term.
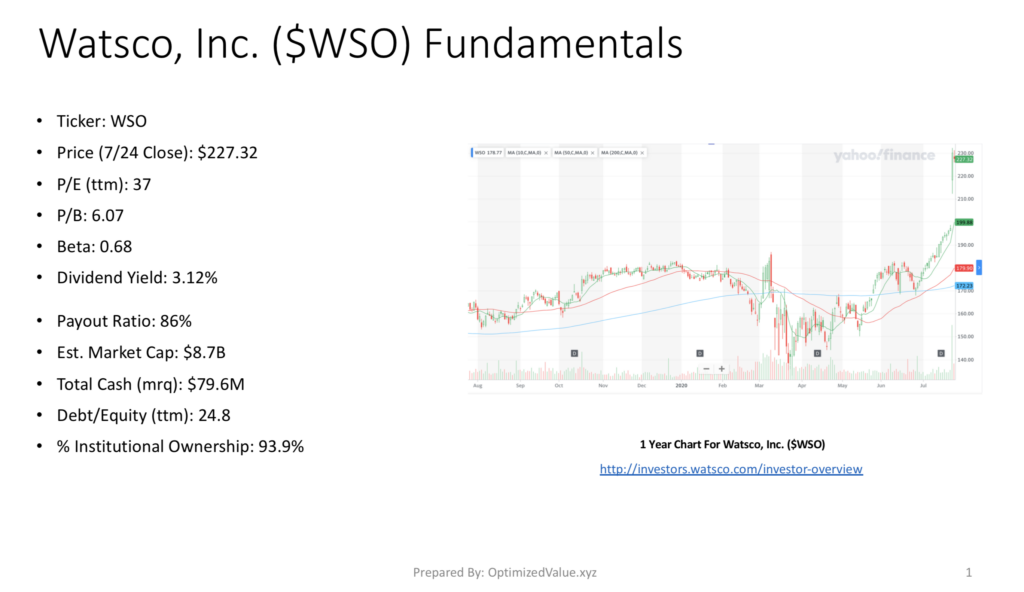
While WSO’s Payout Ratio (ttm) is high at 86%, their Debt/Equity (ttm) is 24.8, which looks quite appealing in market conditions with the high levels of uncertainty that we have now.
With a Market Cap of $8.7B & $79.6M in Total Cash, paired with a Beta of 0.68, it is no wonder that Watsco, Inc. has a 93.9% % Institutional Investors.
Watsco, Inc. WSO Stock Technicals Show Strength
Watsco, Inc.’s current price of $227.32 is well above its 10-Day Moving Average of 199.88, which is also stronger than its 50-Day Moving Average of 179.9 & its 200-Day Moving Average of 172.23.
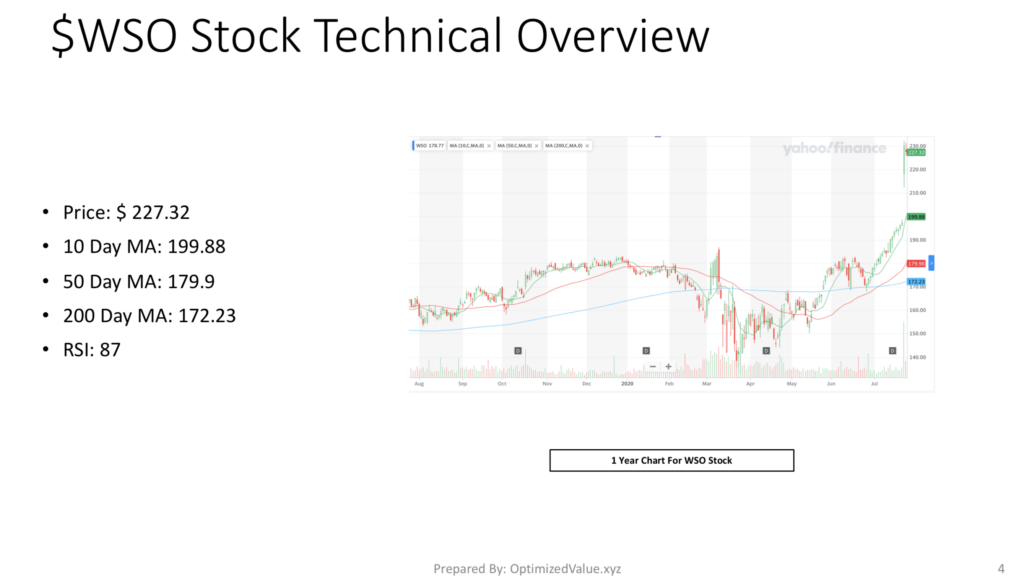
While its current RSI of 87 is showing signs of being overbought, this is being impacted by a recent large gap-up day, when the stock opened far above where it closed on the previous day.
The RSI should decrease over time to a more normal level as time passes, and WSO’s technical levels are much higher than their Industry & Sector peers.
Our Technical Strength formula rates WSO’s stock at 167.7, much higher than its Industrials Sector peers at 7.17 & far superior to its Trading Companies & Distributors Industry peers average score of 0.53.
Watsco, Inc. WSO Stock’s Fundamentals Performance Compared To The Industrials Sector
WSO’s P/E (ttm) is 7% less than that of its Industrials Sector peers, and its Dividend Yield is 27% higher than average. Watsco, Inc.’s Market Cap is 55% higher than their sector average.
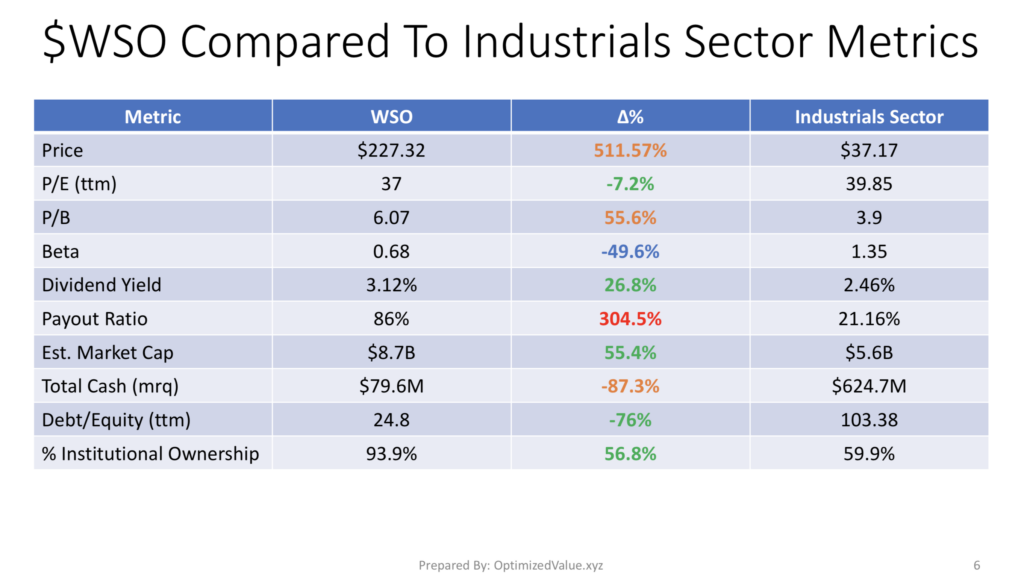
Their Debt/Equity (ttm) is 76% better than average & their Beta is almost 50% lower than average, which contributes to their 57% higher than average % Institutional Ownership.
While their P/B is much higher than average (+55.6%) & their Total Cash (mrq) is lower than average, they still offer many interesting advantages to their sector peers.
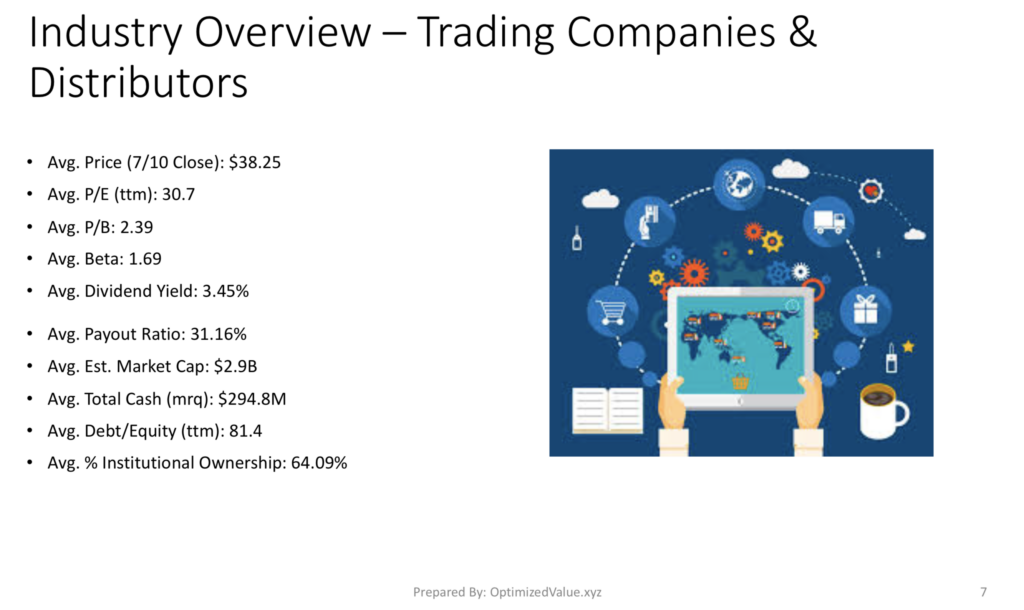
Watsco, Inc. WSO’s Fundamentals Vs. The Trading Companies & Distributors Industry Averages
Watsco’s Market Cap is 200% larger than the average Trading Companies & Distributors Industry Average, and they offer a 70% lower Debt/Equity (ttm) level, with a 47% stronger % Institutional Investors & a 60% lower than average Beta.
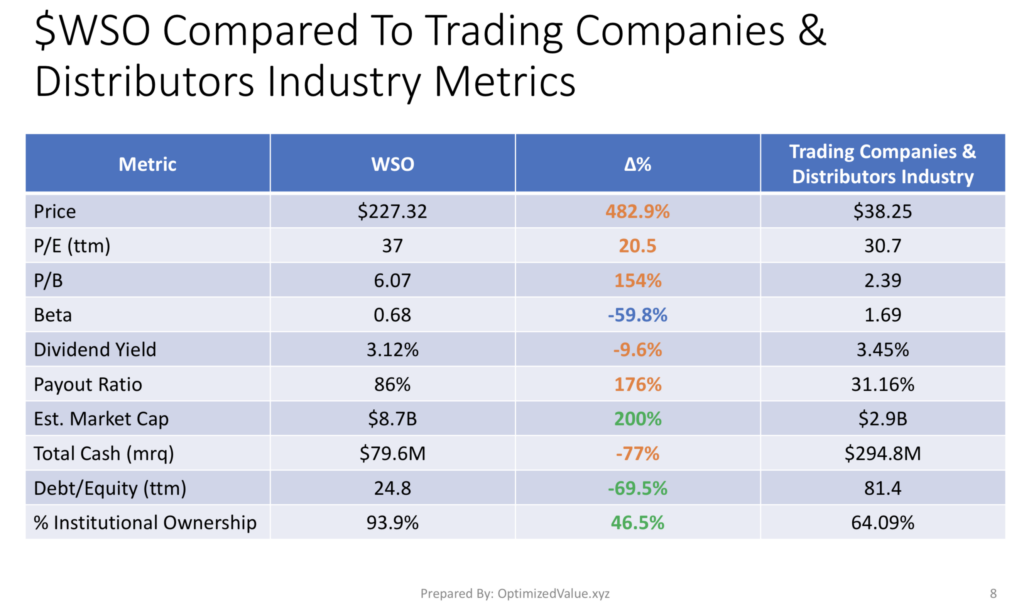
These strengths combined with their stronger than average technicals enable us to look past their higher than average P/E (ttm) (+21%), P/B (+154%) and 9% lower than average Dividend Yield.
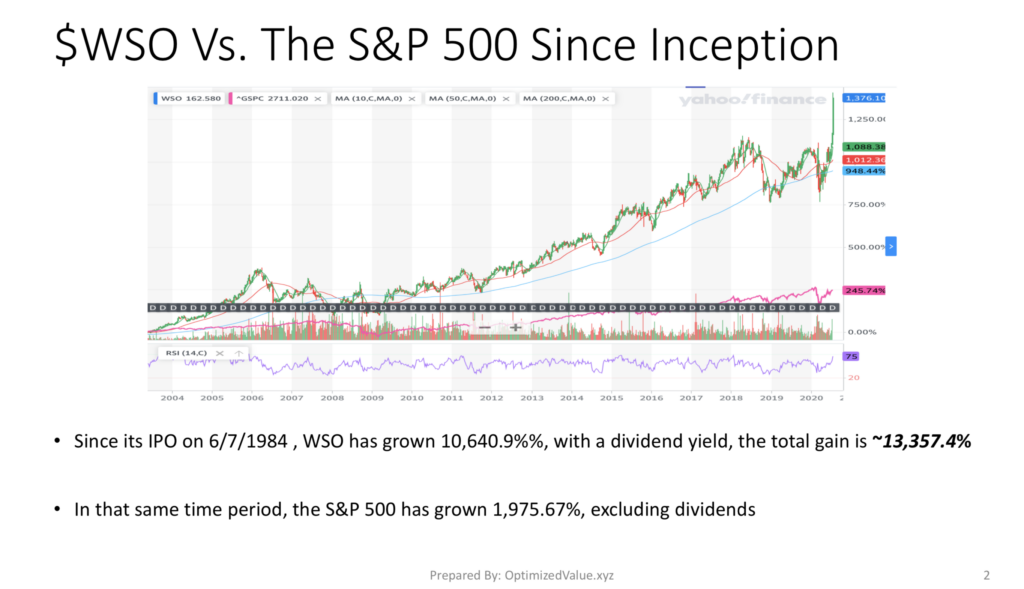
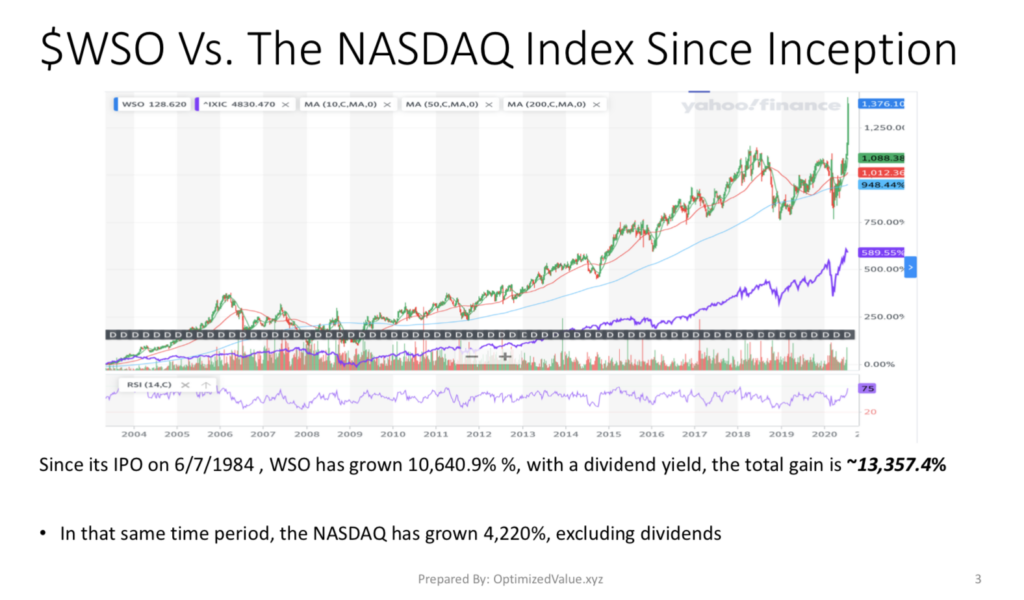
Watsco, Inc. WSO Has Dramatically Outperformed The S&P 500 & NASDAQ Since IPO
Since their IPO on 6/7/1984, Watsco, Inc.’s stock has grown by 10,640.9%, for a total adjusted gain of 13,357.4% when their consistent Dividend Yield is factored into the calculation .
The S&P 500 has only grown 1,975.7% excluding dividends in that same time period.
WSO Stock has also dramatically outperformed the NASDAQ in that time, which has only grown by 4,220% in that same time span, excluding dividends.
Tying It All Together
Watsco, Inc. WSO’s Stock is worth taking a closer look at from an investment & trading perspective. Their strong fundamentals & technicals, combined with their lifetime growth performance show that they have many advantages over other stocks.
Being able to grow at the rates that they have since 1984, drastically outperforming the market, while also having responsible & manageable levels of debt gives them big leg up the the modern day’s competition, particularly in market environments like we are in now.
I’ll be looking at the charts to see if there is a good entry point coming up, as after their recent gap up on the 23rd there is no established clear support level within a reasonable range to work with.
For Full PDF Report:
*** I DO NOT CURRENTLY OWN SHARES IN WSO ***