SPY, the SPDR S&P 500 ETF fell -4.14% last week, while the VIX closed at 22.38, indicating a one day implied move of +/-1.41% & a one month implied move of +/-6.47%.
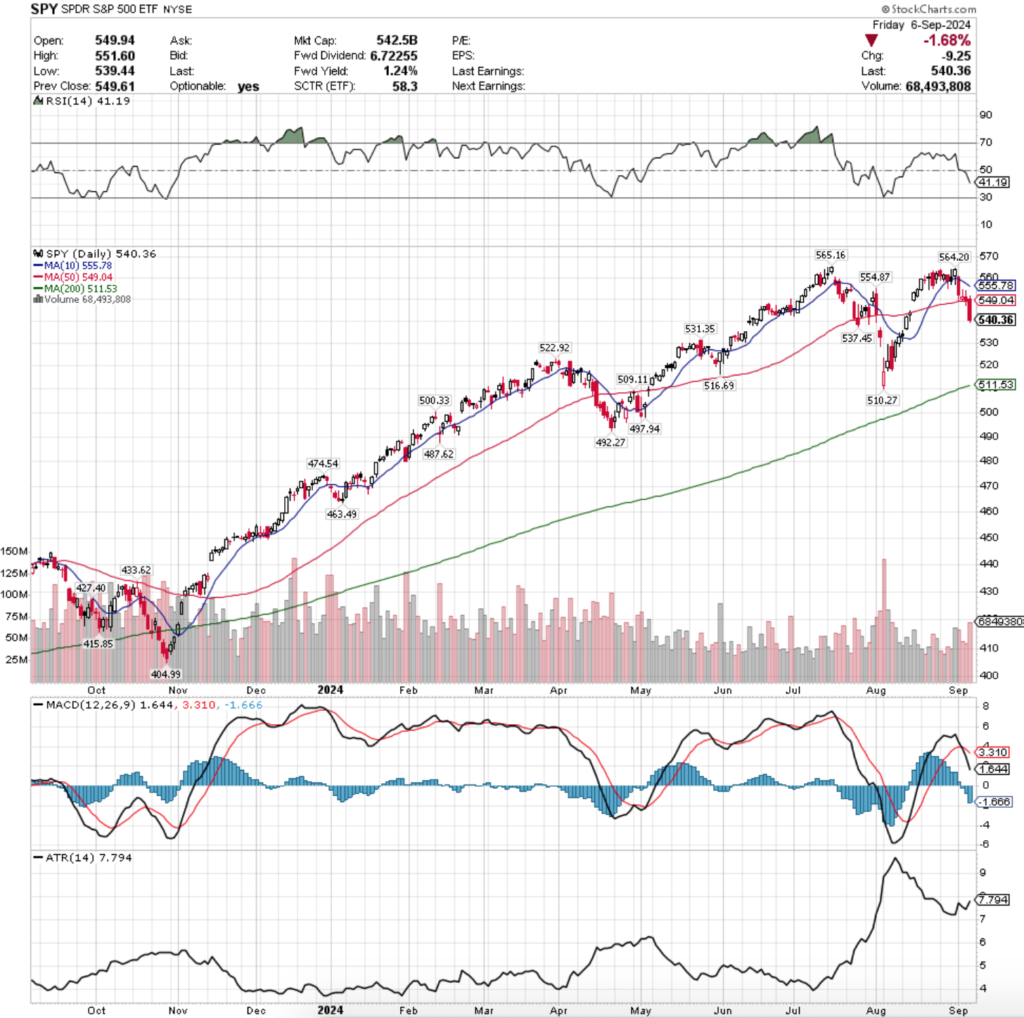
Their RSI is trending downward & sits at 41.19, while their MACD has crossed over bearishly & is in decline.
Volumes were still weak, coming in -19.47% below the previous year’s average volume (55,142,500 vs. 68,478,379 ((Note that this week’s data source is different, hence the rounded weekly figure*))), which as noted in previous weeks when we look at from the perspective of March 31,2024’s market note we see that this is even weaker participation, given that volumes have declined markedly following April 2024.
The average calculation has been using a low volume environment for coming on five months, meaning that the benchmark average volume calculation is nearly half diluted with very low volume compared to prior year’s.
This makes the clear lack of confidence in the market based on volume even more jarring, but is not something that is being mentioned very frequently.
September started with a bang for SPY, as last Tuesday on the first trading day of the month following the Monday holiday, when the day opened above the 10 day moving average’s support before blowing through it to the downside to test the 50 DMA’s support.
The 50 DMA held & the session closed above it, while volumes were close to the previous Friday’s advancing volume.
The negativity continued on Wednesday when SPY opened just above the 50 day moving average’s support, tested lower but the 50 DMA maintained strength & SPY would up testing higher & settled the session still down, but higher than it opened.
Wednesday’s candle was a spinning top, indicating that there was some uncertainty on the part of market participants, which is supported by the session’s low volume.
Thursday the uncertainty continued, as the session opened within the prior candle’s real body, tested higher before breaking down through the 50 DMAs support thanks to the bears, but the bulls were able to force the close to be back around that 50 DMA, resulting in a bearish spinning top candle on a low volume session, waning confidence & uncertainty continued.
Friday the 50 DMA broke down on a wide range session that resulted in a daily decline of -1.68% on the highest volume of the week; folks were ready to get out of the pool going into the weekend.
Given CPI & PPI are due to be released in the week ahead folks are a bit on edge, particularly as to see what magnitude the readings may contribute towards the impending rate cut later this month.
This coming week all eyes will remain on the volume noted above to see if it increases & in which direction, as that will be the best measurement of market sentiment currently.
The other primary place to keep an eye on will be the 10 & 50 day moving averages, both of which are now acting as resistance levels pressuring down on SPY’s price.
The view of the past few weekly notes that compare the current market situation to last September & October’s are still in play, but an eye will also be kept on July/August as well before that squeezed rally of mid-August that couldn’t must up the ability to break the all-time high for SPY set in July.
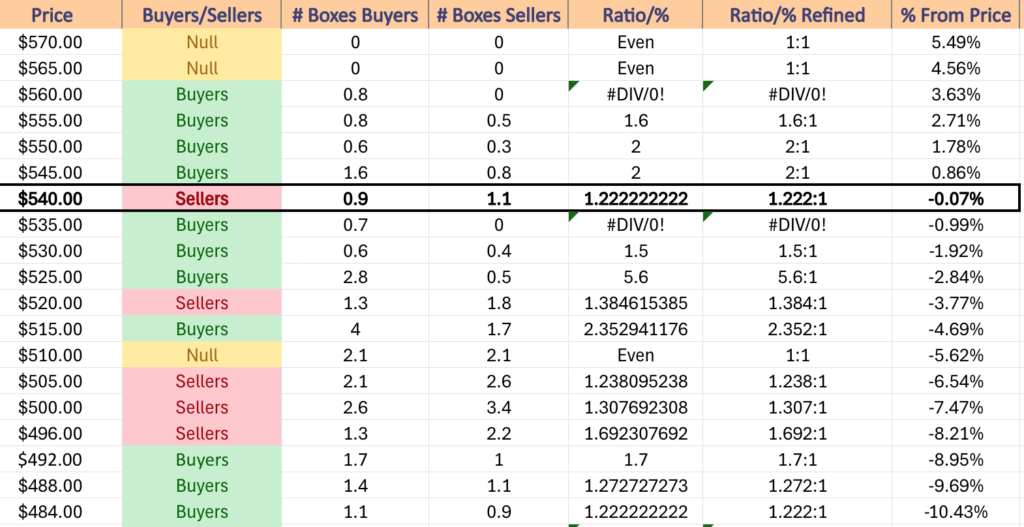
The chart below is worth taking a look at when looking at SPY’s current support levels, as they are a bit spaced out, making it even more important to have a read on price level sentiment as they are approached in the future.
SPY has support at the $537.45 (Volume Sentiment: Buyers, 0.7:0*), $531.35 (Volume Sentiment: Buyers, 1.5:1), $522.92 (Volume Sentiment: Sellers, 1.39:1) & $516.69/share (Volume Sentiment: Buyers, 2.36:1) price levels, with resistance at the $549.04 (50 Day Moving Average, Volume Sentiment: Buyers, 2:1), $554.87 (Volume Sentiment: Buyers, 2:1), $555.78 (10 Day Moving Average, Volume Sentiment: Buyers, 1.6:1), & $564.20/share (Volume Sentiment: Buyers, 0.8:0*) price levels.
QQQ, the Invesco QQQ Trust ETF that tracks the NASDAQ 100 declined -5.79% last week, faring the worst of the major four index ETFs.
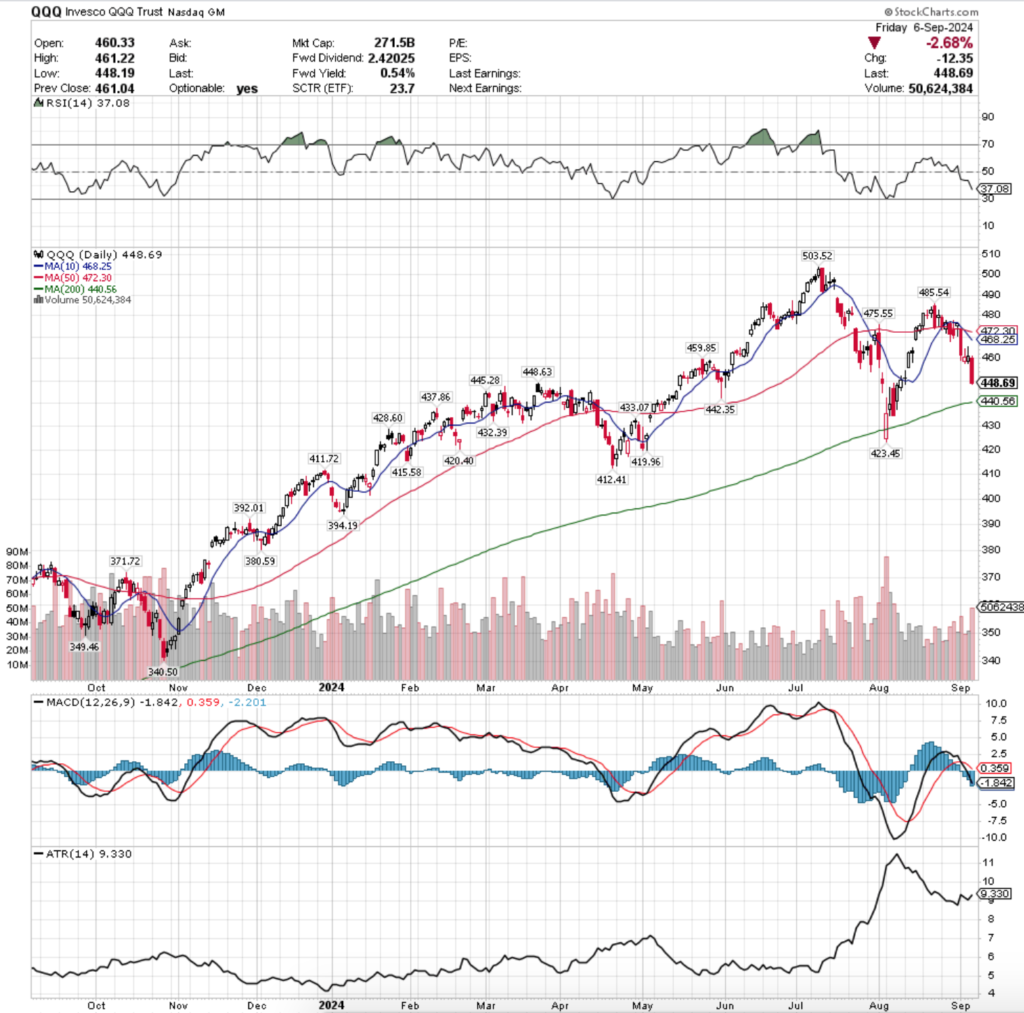
Their RSI is in decline & trending towards the oversold 30 mark, currently sitting at 37.08 while their MACD is in bearish decline.
Volumes were only -5.93% below the prior year’s average last week (40,642, 500 vs. 43,204,980), which while it is the best of the major four index ETFs, it should be noted that there was only one advancing day for QQQ last week, making this rather negative sentiment.
QQQ’s week began on a more sour note than SPY’s, as the ETF broke below the 50 day moving average & continued lower throughout the session to close with the 10 & 50 DMAs as overhead resistance on the second highest volume of the week.
Tuesday & Wednesday were equally as confused as SPY’s as both sessions resulted in spinning top candles on lackluster volume compared to the other days of the week, but QQQ’s Thursday did at least offer a glimmer of hope & optimism as the session did result in an advance, after Wednesday’s opened lower but despite closing down on the day did close above the opening price.
All of this happened while the 10 DMA was crossing bearishly through the 50 DMA, setting up the decline for Friday’s risk off into the weekend -2.68% decline.
While we’ve often noted how NVDA & the other semiconductor/AI components of SPY & QQQ have caused them to advance in similar fashion, one main distinction is how near the 200 day moving average QQQ is.
QQQ sits <2% above their 200 day moving average’s support, which is broken will be indicative of a major loss of investor confidence in the tech-heavy index.
This already happened once briefly in the past month & a half, as one declining session was a large gap down that ultimately pushed higher to close the day down, but higher than the opening price.
This will also be an interesting area to watch as there are a number of ETFs that are specifically focused on individual names & sectors that are components of QQQ, which will likely all be adversely impacted should QQQ trend below their 200 DMA.
As has been previously mentioned on here, QQQ’s slower & more gradual ascent over the past year has set it up with a more solid number of support levels than SPY.
With this in mind, QQQ’s lack of exposure to banks/financials may cause it to drift lower faster than SPY, despite having healthcare names due to the emphasis on technology companies.
It will also be interesting to see if volume from last week holds up, and if it does in which direction the price action is in & the daily range said prices cover as that will be a big tell on market participant sentiment.
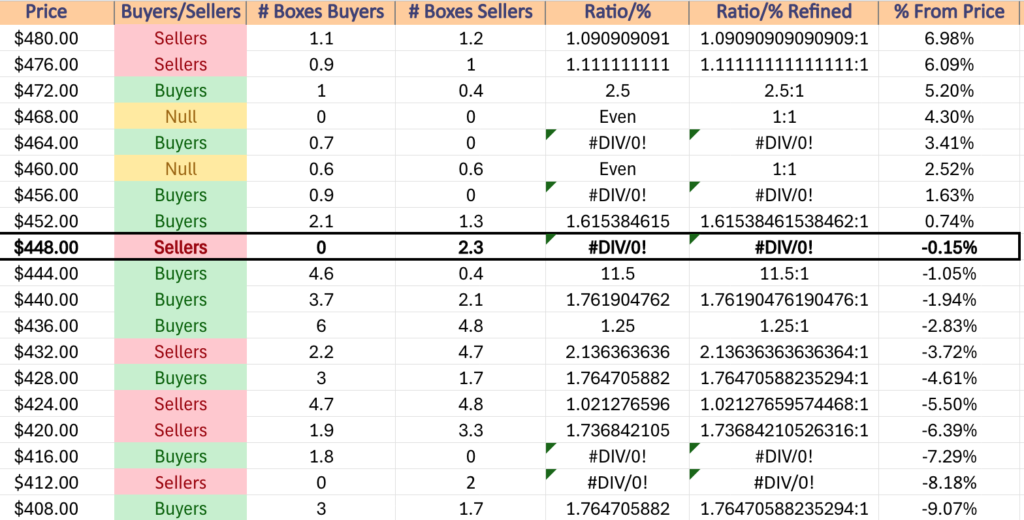
QQQ has support at the $448.63 (Volume Sentiment: Sellers, 2.3:0*), $445.28 (Volume Sentiment: Buyers, 11.5:1), $442.35 (Volume Sentiment: Buyers, 1.76:1) & $440.56/share (200 Day Moving Average, Volume Sentiment: Buyers, 1.76:1) price levels, with resistance at the $459.85 (Volume Sentiment: Buyers, 0.9:0*), $468.25 (10 Day Moving Average, Volume Sentiment: NULL, 0:0*), $472.30 (50 Day Moving Average, Volume Sentiment: Buyers, 2.5:1), & $475.55/share (Volume Sentiment: Buyers, 2.5:1) price levels.
IWM, the iShares Russell 2000 ETF dropped -5.53% last week, as even the small cap index was unable to fly under the radar during a week of declines.
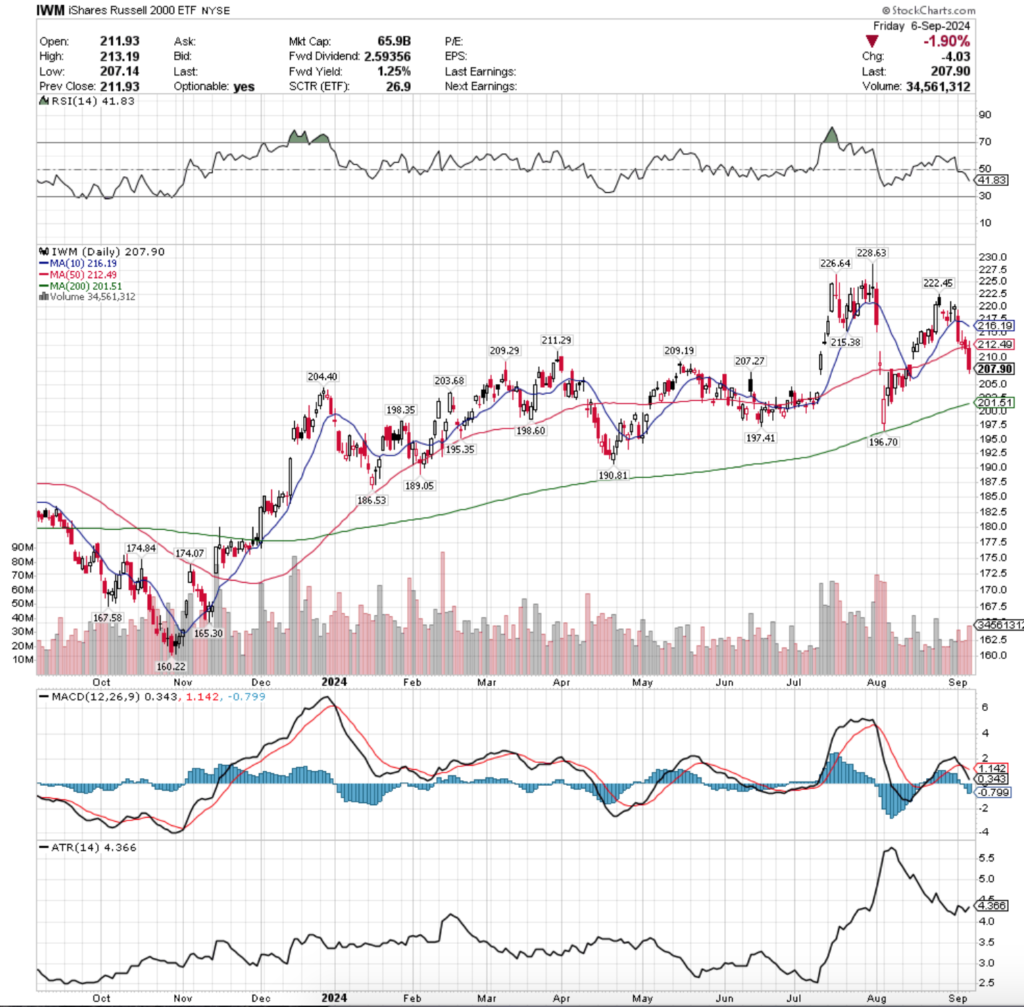
Their RSI is declining & currently at 41.83, while their MACD has crossed over bearishly & is in decline.
Volumes were -19.21% below the previous year’s average (2,838,000 vs. 3,539,407), as all four days of the week declined on subpar volume.
Tuesday the party got started for IWM with an open above the 10 day moving average’s support & a brief advance higher before tumbling to the downside straight through it on the week’s second highest volume.
Wednesday showed the same lack of conviction but negative feelings as SPY & QQQ, as the day opened on a gap lower, tested & briefly dipped below the 50 day moving average’s support before rallying back & closing higher but still on a declining session with low volume.
Thursday was able to close below the 50 day moving average, turning it from support to resistance, but also confirming that the negative sentiment is here to stay at least in the near-term as the day’s candle completed a bearish engulfing pattern.
Friday confirmed this as the session opened lower, tested back above the resistance of the 50 DMA, before ultimately settling down -1.9% on the day.
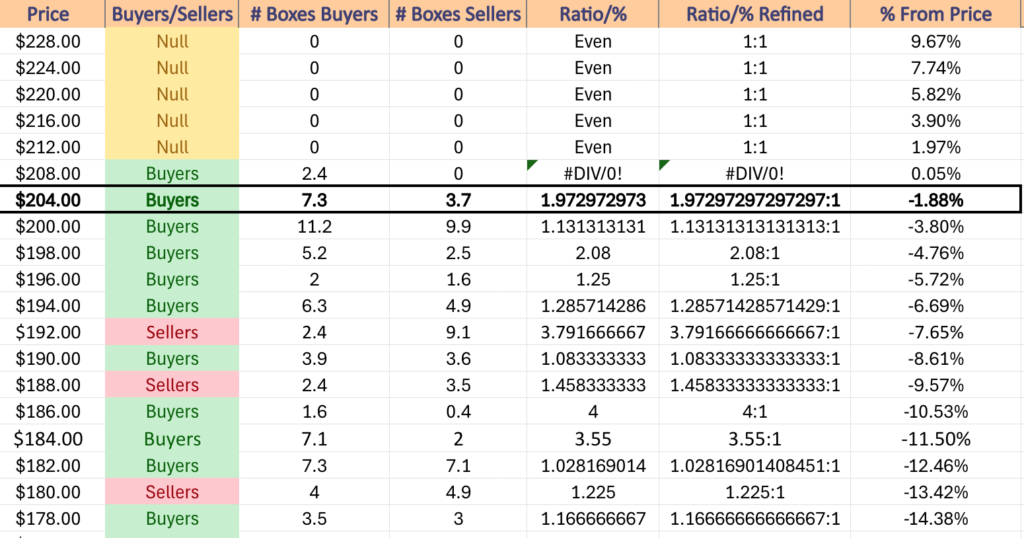
IWM is near a number of support levels after a -1% decline further due to the relatively range-bound oscillating it’s price action does as it gradually advances & declines.
However it would be wise to assess the strength & weakness of each support level’s price on the table below to have an understanding of how strong or weak the volume sentiment has previously deemed the price level.
The volume levels of the coming week(s) will also be important for IWM, as it will shed insight into overall market sentiment & whether the small cap names may be a safe haven of sorts during any further decline.
IWM’s 200 day moving average is also only ~3% from Friday’s closing price, causing similar concerns to what was just outlined about QQQ, with the notable difference being that IWM was supported during their recent brief daily brush with the support level in early August.
IWM has support at the $207.27 (Volume Sentiment: Buyers, 1.97:1), $204.40 (Volume Sentiment: Buyers, 1.97:1), $203.68 (Volume Sentiment: Buyers, 1.13:1) & $201.51/share (200 Day Moving Average, Volume Sentiment: Buyers, 1.13:1) price levels, with resistance at the $209.19 (Volume Sentiment: Buyers, 2.4:0*), $209.29 (Volume Sentiment: Buyers, 2.4:0*), $211.29 (Volume Sentiment: Buyers, 2.4:0*), & $212.49/share (50 Day Moving Average, Volume Sentiment: NULL, 0:0*) price levels.
DIA, the Dow Jones Industrial Average ETF dipped -2.82% last week, faring the best for a second consecutive week out of the major four index ETFs.
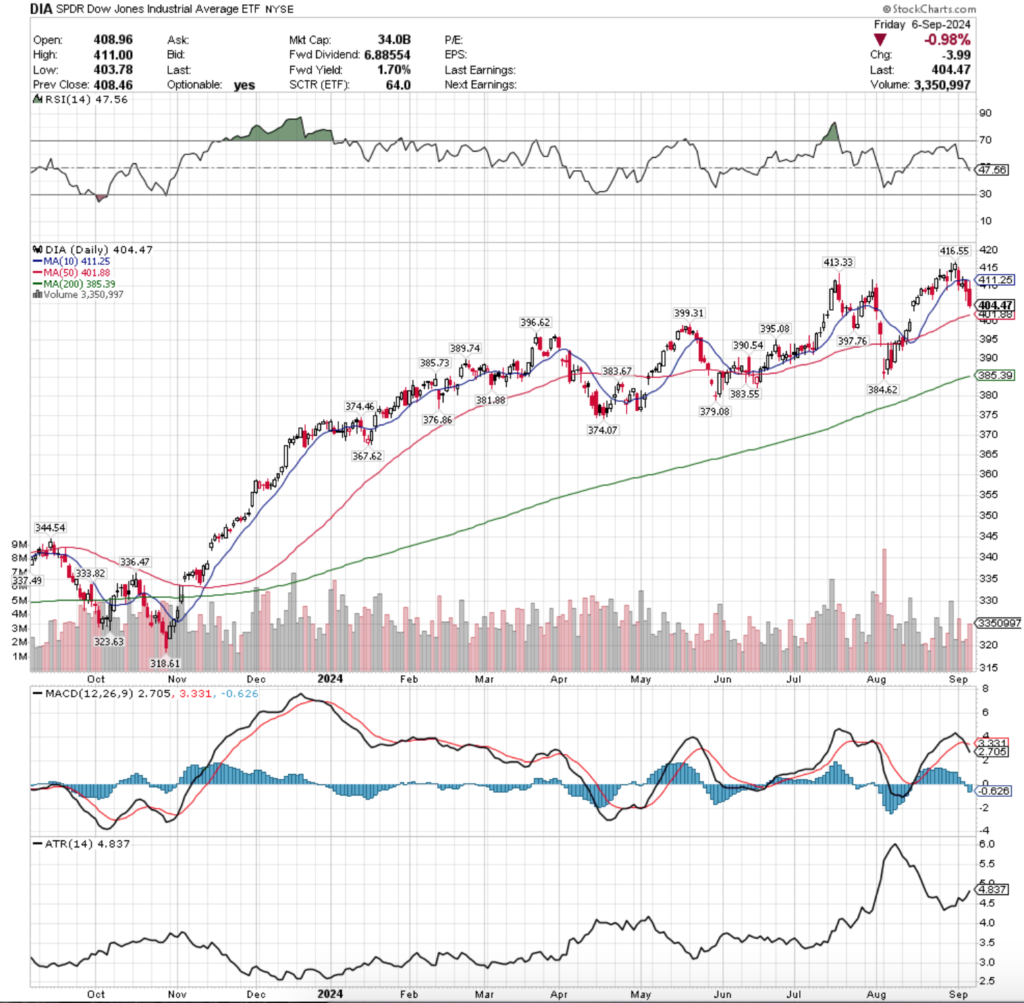
Their RSI just crossed bearishly through the neutral 50 mark & sits currently at 47.56, while their MACD is in bearish decline.
Volumes were weak though, -19.05% below the previous year’s average (2,865,000 vs. 3,539,407), which is indicative of waning enthusiasm on the part of investors, especially given the blue chip nature of DIA’s component stocks & the fact that three of the past four sessions were declining sessions.
Tuesday started the week off on weak footing for DIA, as prices declined through the support at the 10-day moving average on the highest volume of the week.
Wednesday offered a glimmer of optimism as the session opened higher, went above the 10 DMA’s resistance briefly, but ultimately resulted in what would be a shooting star candle if it came at the end of an uptrend, indicating that there was still blood in the water & bears had unfinished business to handle.
Thursday confirmed the bearish sentiment, as prices opened in line with the 10 DMA’s resistance, before testing much lower & still settling on a decline.
Friday made one last run at the 10 DMA’s resistance before ultimately declining for a -.098% daily loss heading into the weekend on the week’s second highest volumes.
This week DIA’s 50 DMA will be in focus, as prices closed last week within 1% of the support level, but with a lot of bearish sentiment behind the name.
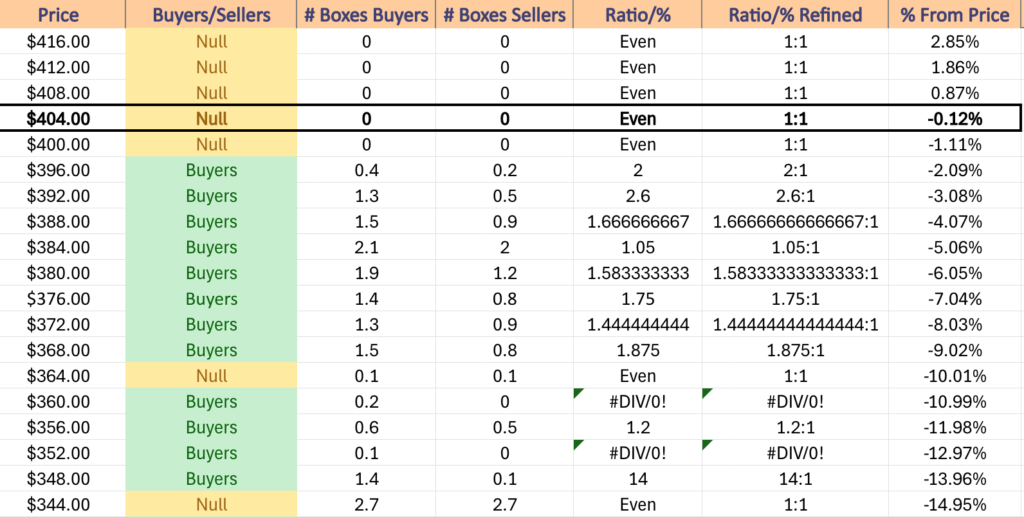
Their 10 DMA’s resistance level is now curled over & applying downwards pressure on price, but much like IWM, DIA has a solid floor of support levels beneath it, making it worth looking at the table below to see how strong each price level is & how likely it is to maintain strength or succumb to selling pressure.
Like the other index ETF’s previously discussed, the period about one year ago from today is a good place to look for clues into how markets may treat DIA in the near-term, particularly in the event that their 200 DMA’s support is tested (-4.72% from Friday’s closing price).
DIA has support at the $401.88 (50 Day Moving Average, Volume Sentiment: NULL, 0:0*), $399.31 (Volume Sentiment: Buyers, 2:1), $397.76 (Volume Sentiment: Buyers, 2:1) & $396.62/share (Volume Sentiment: Buyers, 2:1) price levels, with resistance at the $411.25 (10 Day Moving Average, Volume Sentiment: NULL, 0:0*), $413.33 (Volume Sentiment: NULL, 0:0*) & $416.55/share (All-Time High, Volume Sentiment: NULL, 0:0*) price levels.
The Week Ahead
Monday the week begins with Wholesale Inventories at 10 am & Consumer Credit data at 3pm.
Calavo Growers, Mission Produce, Oracle & Rubrik all report earnings after Monday’s closing bell.
NFIB Optimism Index data is reported at 6 am on Tuesday.
Academy Sports + Outdoors & Cognyte Software report earnings Tuesday morning before the opening bell, with Dave & Buster’s Entertainment, GameStop & Petco Health & Wellness due to report after the session’s closing bell.
Wednesday morning Consumer Price Index, CPI Year-over-Year, Core CPI & Core CPI Year-over-Year are all reported at 8:30 am.
Oxford Industries reports earnings after Wednesday’s closing bell.
Initial Jobless Claims, Producer Price Index, Core PPI, PPI Year-over-Year & Core PPI Year-over-Year are all due to be reported at 8:30 am Thursday, with the Monthly U.S. Federal Budget data coming out at 2pm.
Thursday morning’s earnings reports include Caleres, Kroger, Lovesac & Signet Jewelers, with Adobe & RH scheduled to report after the session’s close.
Friday the week winds down with Import Price Index & Import Price Index minus Fuel at 8:30 am, followed by Consumer Sentiment (prelim) data at 10 am & there are no noteworthy earnings reports scheduled for the day.
See you back here next week!
*** I DO NOT OWN SHARES OR OPTIONS CONTRACT POSITIONS IN SPY, QQQ, IWM OR DIA AT THE TIME OF PUBLISHING THIS ARTICLE ***