SPY, the SPDR S&P 500 ETF gained +0.29% last week, while the VIX closed at 14.22, indicating an implied one day move of +/-0.9% & an implied one month move of +/-4.11%.
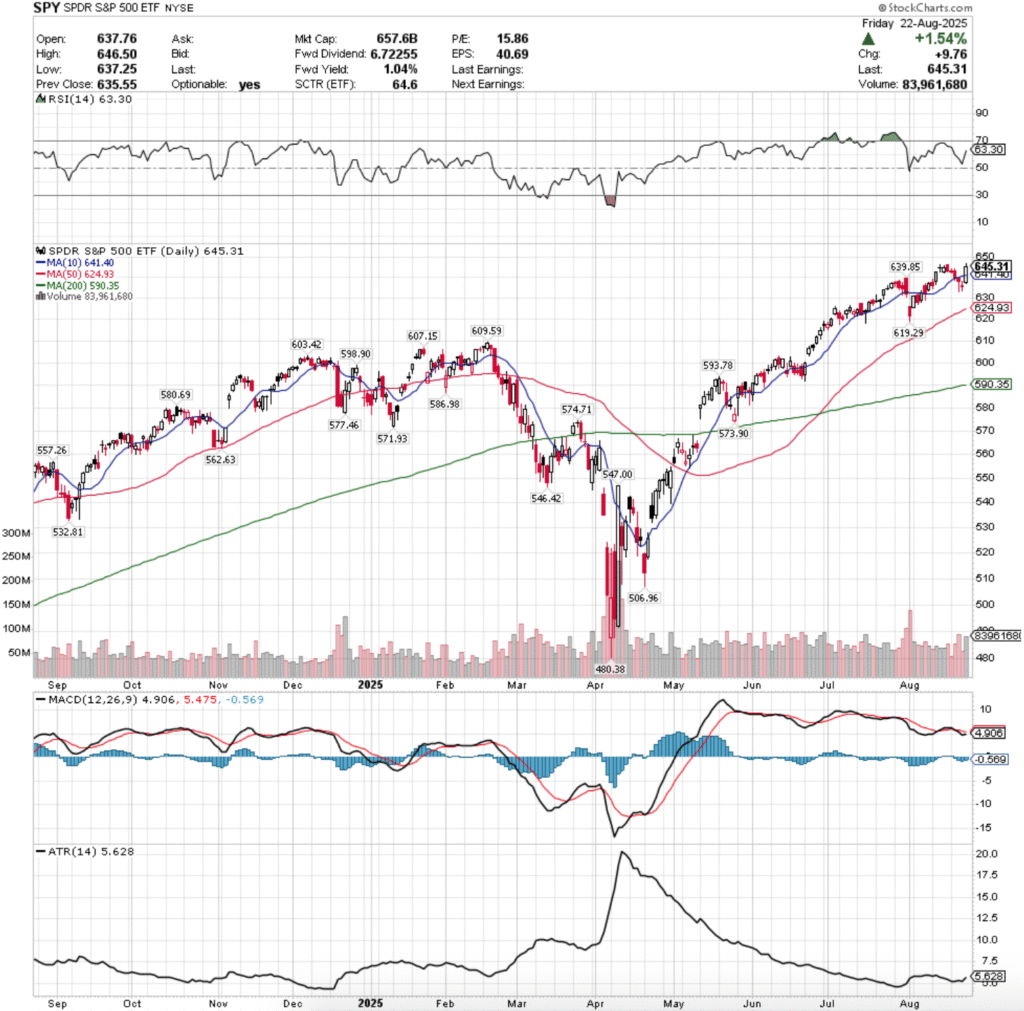
Their RSI is trending higher & currently at 63.3, while their MACD is still bearish, but has flattened & could cross the signal line bullishly by mid-week in the event of no declining sessions.
Volumes were +9.85% above the prior year’s average (67,362,000 vs. 61,323,412.7), which is something to keep in mind giving that the highest volume session of the week was declining volume & four of the five sessions resulted in declines.
The week kicked off hinting at uncertainty on Monday, as a weak volume session resulted in a decline that’s real body was slightly larger than a doji, but not quite a spinning top, indicating that there was a wait & see feeling among market participants.
Tuesday it became more evident that there was a mix of uncertainty & fear in SPY, as the session resulted in the third highest volume of the week while forming a bearish engulfing pattern & resting atop the support of the 10 day moving average.
Wednesday opened in-line with the 10 DMA, but selling pressure came in to force the heaviest volume session of the week that say SPY fall -0.27%, but the support of the 20 day moving average broke down temporarily & the lower shadow of the day’s candle indicated that there was urgency to take profits down at these high valuation levels.
Thursday opened on a gap down & left a taste of uncertainty among market participants at the close, as Fed Chair Powell’s remarks from Jackson Hole on Friday were eagerly anticipated.
The session ended as a spinning top candle, indicating the uncertainty of the marketplace, which stayed within the lower shadow of Wednesday’s candle.
Friday opened on a gap higher, and after Powell’s remarks were interpreted as dovish the 10 day moving average’s resistance was broken through, but the volume should be noted for it was only the second highest volume of the session.
This raises questions of sustainability coming in a week with many interesting names reporting earnings, including NVDA, and PCE data coming in on Friday.
It should come as no surprise to anyone that this week will have all eyes on NVDA’s earnings call Wednesday afternoon, as well as PCE data on Friday in hopes of finding a catalyst to move the markets.
The upside case remains the same as its been for some time now, these new all-time highs need more advancing volume behind them in order to be sustainable & continue SPY marching higher at these already heightened valuations.
Without more volume, this is like watching the waning turns of a game of Jenga.
The consolidation case also looks the same as it has, with oscillations around the 10 day moving average likely to be the norm as we await an upside or downside catalyst.
The short-term trendline has acted as a safe haven of sorts in recent weeks/months, and will likely continue to do so in times of uncertainty.
The downside case requires a breakdown of the support of the 10 day moving average.
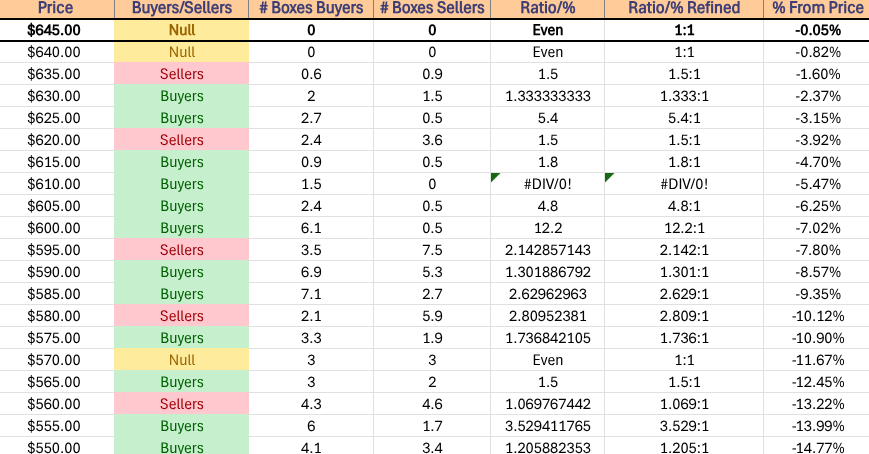
After this, the next two support levels reside in Seller oriented zones (1.5:1, each), making the $619.29/share an interesting level to watch, as should it break down support doesn’t appear for another ~2% at the $609.59/share level.
While there is heavy Buyer historic sentiment in that support zone , if $599.99/share is broken into then all attention shifts to the 200 day moving average’s support.
The table below can be used to reference the strength & weakness of support/resistance levels in the event of re-tests.
SPY has support at the $641.40 (10 Day Moving Average, Volume Sentiment: NULL, 0:0*), $639.85 (Volume Sentiment: Sellers, 1.5:1), $624.93 (50 Day Moving Average, Volume Sentiment: Sellers, 1.5:1) & $619.29/share (Volume Sentiment: Buyers, 1.8:1) price levels, with resistance at the $646.50/share (All Time High, Volume Sentiment: NULL,0:0*) price levels.
QQQ, the Invesco QQQ Trust ETF dipped -0.93% last week, as the tech heavy index fared the worst of the four majors.
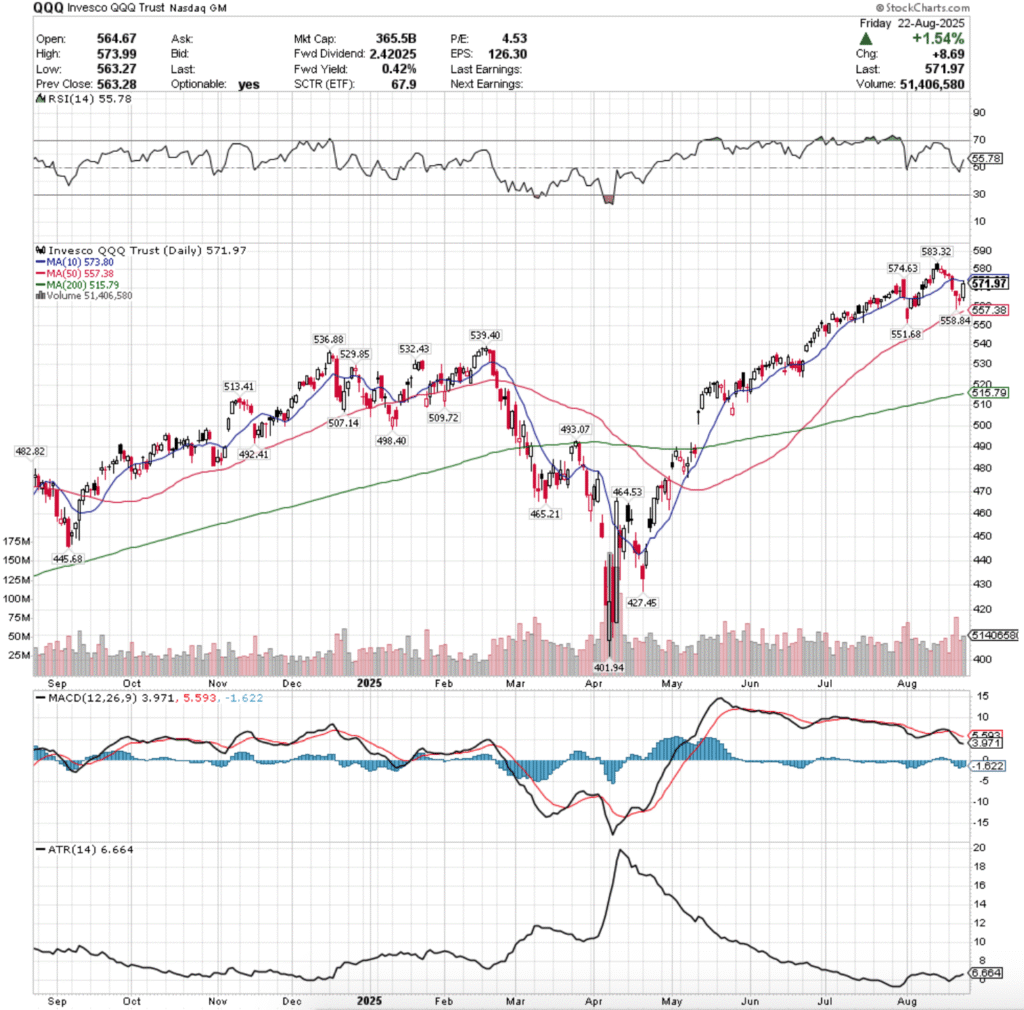
Their RSI is trending higher & currently sits at 55.78, just above the neutral 50 mark, while their MACD is bearish, but may flatten out by midweek towards the signal line in the event of a couple of advancing sessions.
Volumes were +28.55% higher than the prior year’s average (51,126,000 vs. 39,772,222.22), which like SPY is not a telling sign of strength as it was mostly declining volume.
There will need to be more advancing volume that remains consistently higher before any meaningful upside enthusiasm can be felt.
Monday the week opened up in a similarly eerie fashion to SPY, declining & closing as midway between a spinning top & a doji, and also on extremely low volume.
Tuesday the trend continued, with QQQ dropped on the open & managed to decline through the support of the 10 day moving average, with volume indicating that there was a lot of profit taking & uncertainty/fear had crept into the market.
Wednesday the trend continued lower, except with the highest volume of the past week, and the gap down open saw a lot of bleeding, down almost to the 50 day moving average’s support, but was able to recover into the close from the day’s lows, but still had a day-ver-day decline of -0.59%.
Thursday opened with another gap down, but this time on weaker volume, indicating that there was subdued selling pressure, but that uncertainty still ran high.
Friday opened on a slight gap up, tested lower temporarily but was able to rally, but only temporarily broke out above the 10 day moving average’s resistance, indicating that the short-term trendline was strong & that market participants were respecting it.
Much like SPY, the upside case for QQQ will require heavy lifting in the advancing volume department & will need to show sustainability & confirm longevity before being bought into.
The consolidation case looks like QQQ will be oscillating between & around the 10 & 50 day moving averages awaiting an upside or downside catalyst.
One area of interest that differs between QQQ & SPY’s charts is beginning to show & it is an area of concern given that in the past we’ve noted that any decline in the near-term is likely to be led by QQQ.
QQQ spent much of last week treading water below the 10 day moving average’s resistance, indicating that there is a bit of uncertainty about their near-term.
In the process, a bearish head & shoulders pattern has begun to emerge since late July, with the $574.63/share mark making the left shoulder & the $583.32/share forming the head.
While it’s certainly too soon to tell, that is going to be something to keep an eye on in the coming week, as will be the support of the 50 day moving average.
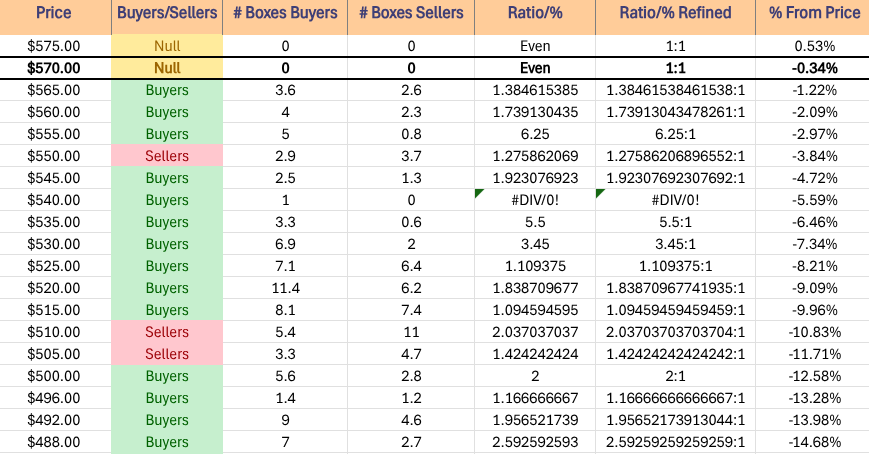
Currently that level is heavily Buyer influenced in recent history, but if it breaks down the $539.40/share level is the next support levels, which if reached signals that there will be a window filled in from late June.
In the event that this occurs there are other windows that may also fill in such as the large one in May of 2025, and the 200 day moving average’s support is also going to be called into question.
QQQ has support at the $558.84 (Volume Sentiment: Buyers, 6.25:1), $557.38 (50 Day Moving Average, Volume Sentiment: Buyers, 6.25:1), $551.68 (Volume Sentiment: Sellers, 1.28:1), & $539.40/share (Volume Sentiment: Buyers, 5.5:1) price levels, with resistance at the $573.80 (10 Day Moving Average, Volume Sentiment: NULL, 0:0*), $574.63 (Volume Sentiment: NULL, 0:0*) & $583.32/share (Volume Sentiment: NULL, 0:0*) price levels.
IWM, the iShares Russell 2000 ETF advanced +3.39% last week, as the small cap index was the favorite among market participants after having spent some time in consolidation.
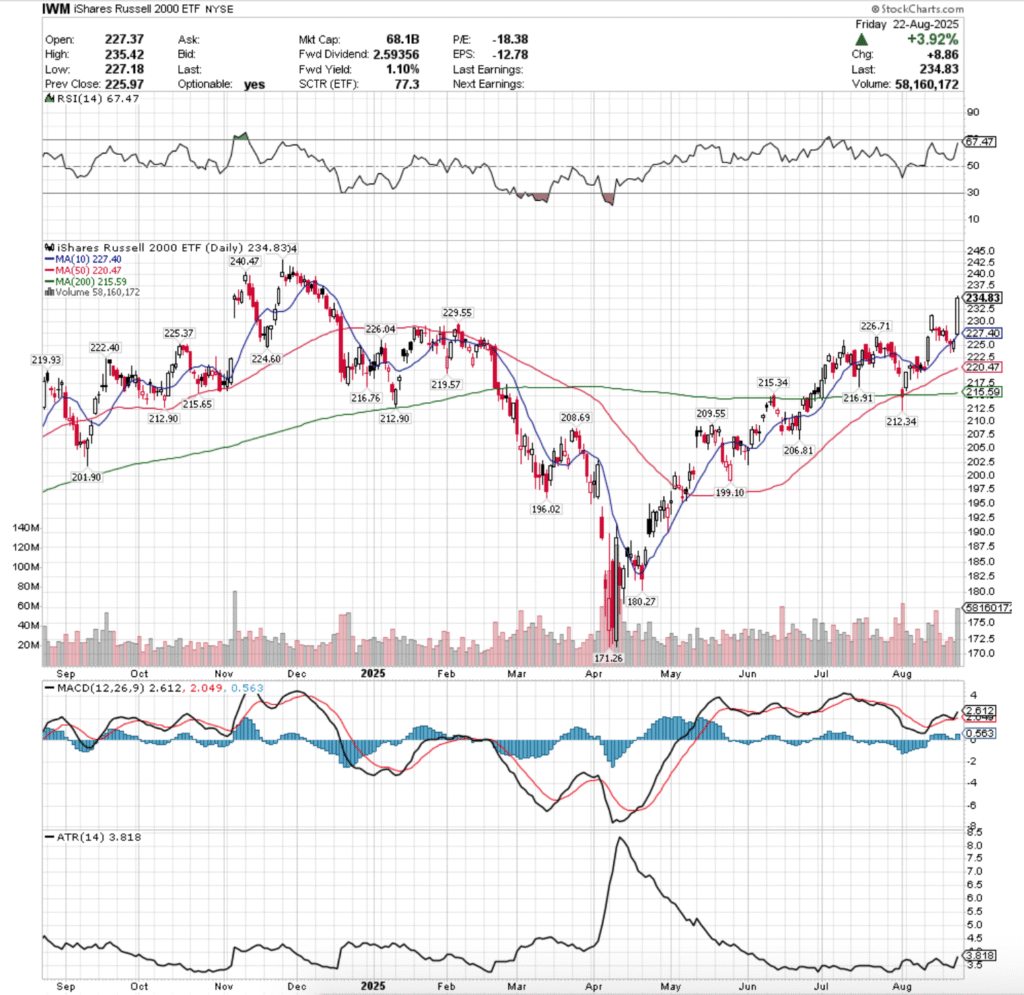
Their RSI is approaching the overbought level of 70 & sits currently at 67.47, while their MACD is still bullish, having recently bounced off of the signal line in the wake of Friday’s advances, which will be something to keep an eye on in the coming week.
Volumes were +1.39% higher than the prior year’s average (30,996,000 vs. 30,570,714), which mostly came from Friday’s outsized advancing volume that eclipsed almost every session we’ve had since April of 2025 & even most of the 2024 portion of the last one year chart.
Monday kicked IWM’s week off in a unique fashion, with a bullish harami spinning top on extraordinarily low volume; more or less the equivalent of a shrug & an “I don’t know” from a chart’s perspective.
The next day opened higher, was able to gain a little momentum, but ultimately faded out & declined into a bearish engulfing pattern.
Wednesday opened on a gap down, temporarily broke through the support of the ten day moving average, but managed to recover enough to close down -0.35% on the day, closing in-line with the 10 day moving average.
Thursday opened lower, but gave a shimmer of optimism after rising up to close in-line with the 10 day moving average’s resistance, but higher than Wednesday’s open leading to the formation of a bullish engulfing pattern.
Thursday too lacked sufficient volume in terms of the increased levels that we would like to see for a more meaningful rally.
Friday opened on a gap higher that pulled the 10 day moving average much higher (up to about its opening level) & the week’s strongest volume produced a session that advanced +3.92% heading into the weekend.
Moving into the new week any upside movements is likely to be predicated on the performance of the other larger indexes, as at these heights small caps are not favorable to larger names.
The consolidation case looks similar to QQQ’s, where the price will oscillated back & forth between the 10 & 50 day moving averages.
The declining case here will also be impacted by the larger names, and it will be interesting to see whether or not there are outright declines or if there is appetite for a rotation play into the smaller cap names.
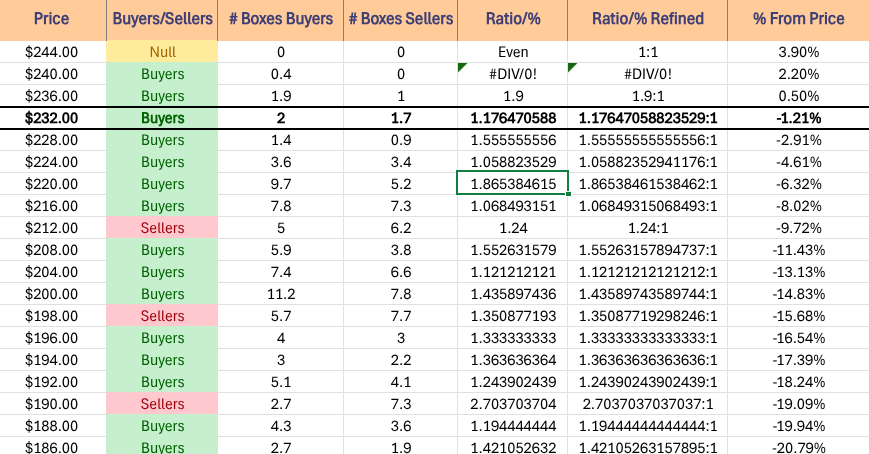
IWM has traveled in a much more compact fashion, which provides it with more support levels relative to its price vs. the other indexes, but that does not imply that IWM will be immune to declines in larger indexes.
The 200 day moving average will be an area to keep an eye on, as that would be a decline of ~10% & should the long-term trend line break down it resides ina Seller oriented zone, which may cause more selling after the support levels gives out.
IWM has support at the $229.55 (Volume Sentiment: Buyers, 1.56:1), $227.40 (10 Day Moving Average, Volume Sentiment: Buyers, 1.06:1), $226.71 (Volume Sentiment: Buyers, 1.06:1) & $226.04/share (Volume Sentiment: Buyers, 1.06:1) price levels, with resistance at the $240.47 (Volume Sentiment: Buyers, 0.4:0*) & $243.04/share (All-Time High, Volume Sentiment: Buyers, 0.4:0*) price levels.
DIA, the SPDR Dow Jones Industrial Average ETF climbed +1.58% last week, having the second best week of the major four index ETFs.
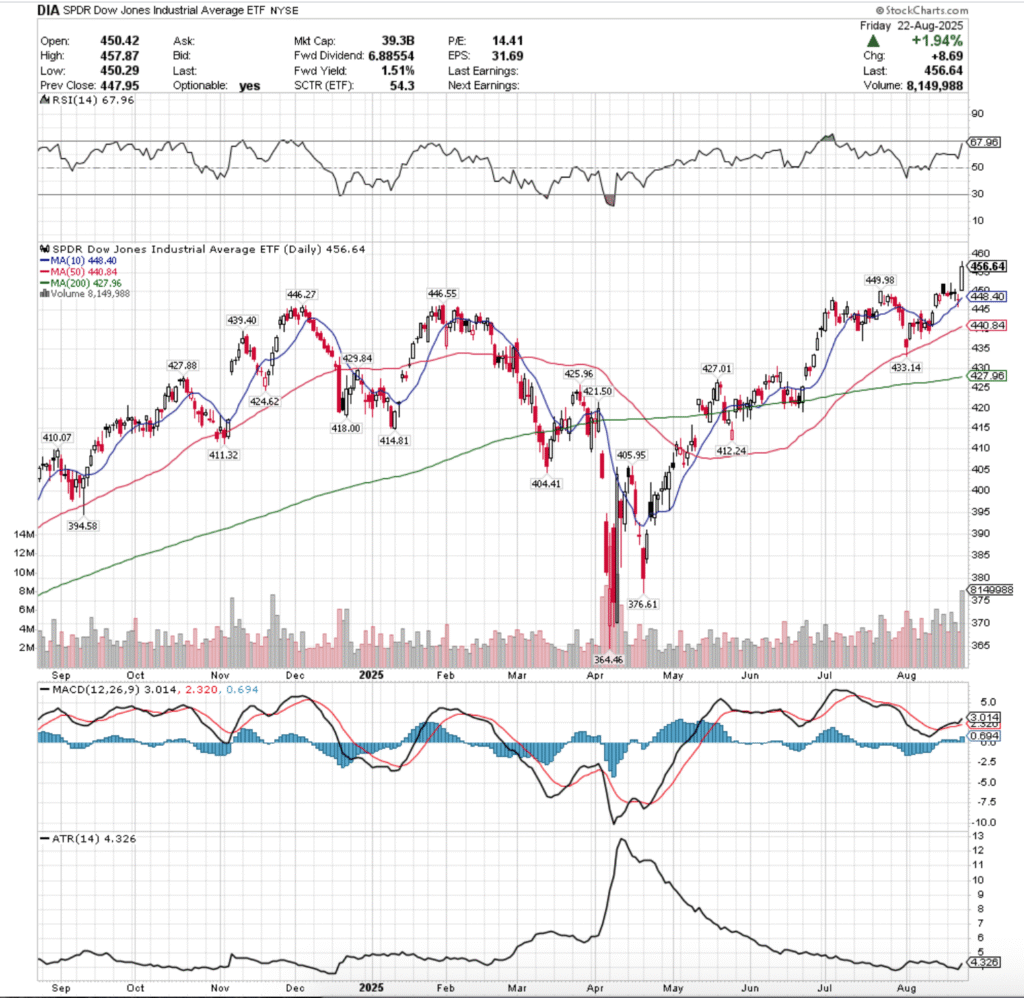
Their RSI is advancing higher & currently sits near overbought territory at 67.96, while their MACD is bullish & creeping higher following Friday’s session.
Volumes were +59.2% higher than the prior year’s average levels (5,222,000 vs. 3,280,119), which seems to be a bit of optimism & FOMO based on the week’s candles & volume patterns.
Monday the week opened up on a similar note of uncertainty, as the declining session saw late week profits taken from DIA & the spinning top candle signaled that there was a bit of uncertainty in the blue chip index.
Tuesday showed that there was really quite more uncertainty in the air than originally anticipaned, as the session opened higher & ran above the $452/share level, before falling lower & ultimately closing below its opening price as a doji candle.
This indicated that there was a bit of uncertainty in the air, and the elevated volume throughout the day points to short-term profit taking while awaiting to see where major indexes move next.
Wednesday opened slightly higher, but the story remained the same, minus slightly less volume & the testing was more to the downside vs. Tuesday’s upside tests & the day resulted in a doji candle.
Thursday opened on a gap lower to be in-line with the 10 day moving average’s support & ended as a high wave doji, indicating that there was some profits taking & some folks creating new positions, but at the end of the day there was uncertainty in the air.
The short-term trendline was a place of refuge & appeared to be the safe haven of choice by market participants.
Friday opened on a major gap up on the week’s highest volume (which was also some of the highest volume of the 2025), and a new all-time high was reached.
The upside case for DIA is the same as the ones for SPY & QQQ, new all-time highs aren’t sustainable without increased advancing volume.
The consolidation case looks similar too, oscillations around the 10 & 50 day moving averages while we wait & see what the next upside or downside catalyst will be.
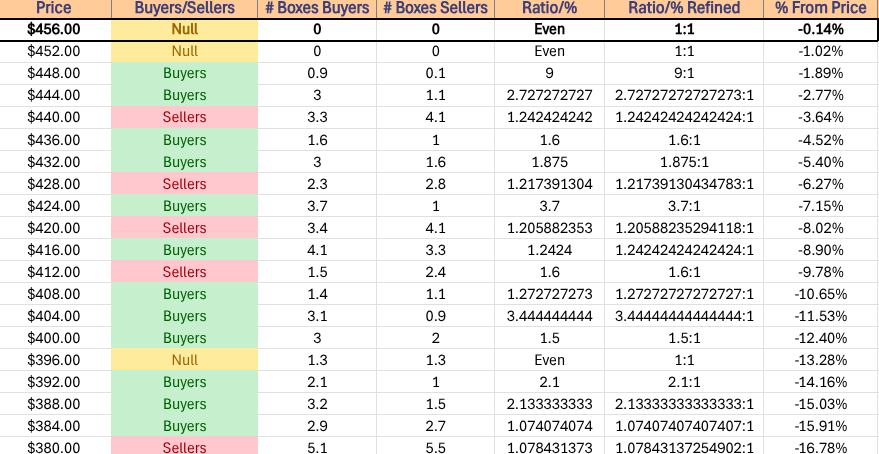
To the downside the $446.27-446.55/share zone is going to be an important support level, as should it decline through there teh 50 day moving average is opened up for a retest, which should it fail opens up DIA to a retest of the 200 Day moving average based on gaps that need to be filled.
While DIA has enjoyed a lot of Buyer-focused sentiment, that type of breakdown would force prices down into price zones where Sellers are more prominent, which could further declines.
DIA has support at the $449.98 (Volume Sentiment: Buyers, 9:1), $448.40 (10 Day Moving Averge, Volume Sentiment: Buyers, 9:1), $446.55 (Volume Sentiment: Buyers, 2.73:1) & $446.27/share (Volume Sentiment: Buyers, 2.73:1) price levels, with resistance at the $457.87/share (All-Time High, Volume Sentiment: NULL, 0:0*) price levels.
The Week Ahead
The week kicks off with New Home Sales data at 10 am, Fed President Logan speaking at 3:15 pm & Fed President Williams speaking at 7:15pm on Monday.
Monday morning also features earnings from PDD Holdings, before HEICO & Semtech report after the session’s close.
Tuesday begins with Durable-Goods Orders & Durable-Goods minus Transportation data at 8:30 am, before S&P Case-Shiller Home Price Index (20 Cities) data at 9:30 am & Consumer Confidence data at 10 am.
Bank of Nova Scotia & KE Holdings report earnings before Monday’s opening bell, with Box, MongoDB, nCino, Okta & PVH scheduled to report after the session’s closing bell.
There are no major economic data points scheduled for release on Wednesday.
Wednesday morning begins with Royal Bank of Canada’s earnings call, as well as Abercrombie & Fitch, Bank of Montreal, Donaldson, J.M. Smucker, Kohl’s, MasterCraft & Phototronics, before the highly anticipated NVIDIA earnings call & Agilent, Bill.com, Cooper, CrowdStrike, Five Below, Greif, HP, NetApp, Nutanix, Pure Storage, Snowflake, Trip.com, Urban Outfitters & Veeva Systems after the closing bell.
Thursday brings us Initial Jobless Claims & GDP (First Revision) data at 8:30 am, followed by Pending Home Sales at 10 am.
Bath & Body Works, Best Buy, Brown-Foreman, Burlington Stores, CIBC, Dick’s Sporting Goods, Dollar General, Hormel Foods, Li Auto, Malibu Boats, Ollie’s Bargain Outlet, Toronto-Dominion Bank & Victoria’s Secret report earnings before the opening bell on Thursday, before Affirm, Ambarella, Autodesk, Dell, Domo, Elastic, Gap, Marvell, Petco Health & Wellness, SentinelOne & Ulta Beauty report after the session closes.
Personal Income, Personal Spending, PCE Index, PCE (Year-over-Year), Core PCE Index, Core PCE (Year-over-Year), Advanced U.S. Trade Balance in Goods, Advanced Retail Inventories & Advanced Wholesale Inventories data is scheduled for release at 8:30 am on Friday, before Chicago Business Barometer (PMI) data at 9:45 am & Consumer Sentiment (Final) data at 10 am.
Alibab reports earnings Friday morning before the opening bell.
See you back here next week!
*** I DO NOT OWN SHARES OR OPTIONS CONTRACT POSITIONS IN SPY, QQQ, IWM OR DIA AT THE TIME OF PUBLISHING THIS ARTICLE ***