Weekly Stock & ETF Market Review 9/21/2025

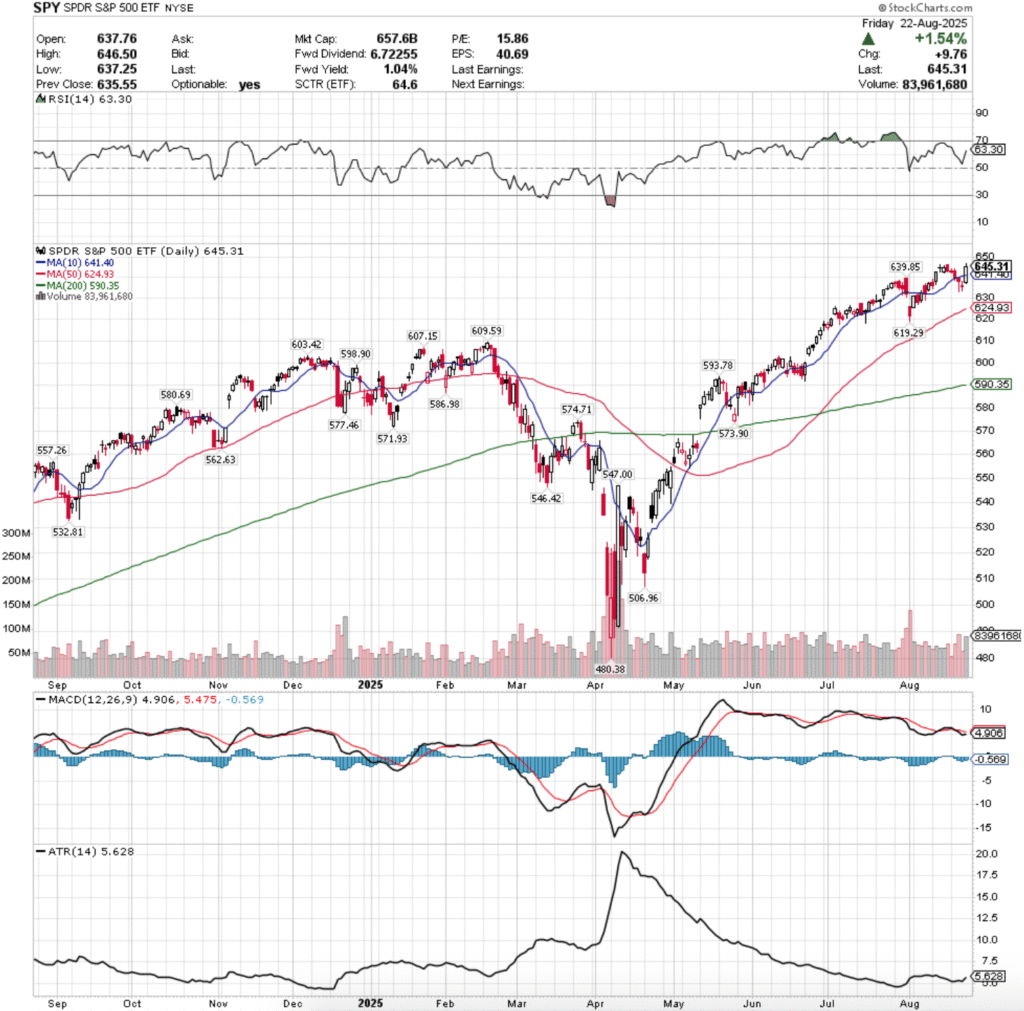
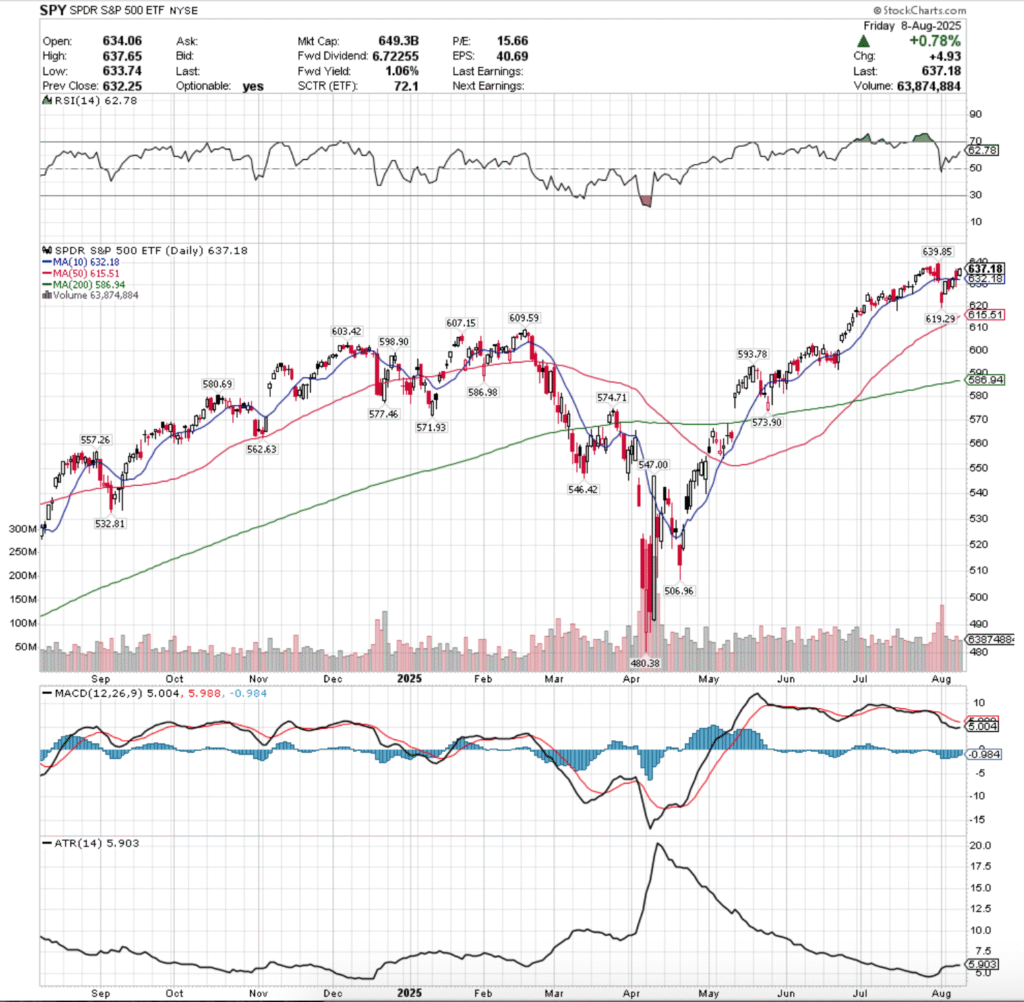
SPY, the SPDR S&P 500 ETF added +0.96% this week, while the VIX closed at 15.45, indicating an implied one day movement range of +/-0.97 % & an implied one month movement range of +/-4.47%.

SPY ETF - SPDR S&P 500 ETF's Technical Performance Over The Past Year
SPY ETF – SPDR S&P 500 ETF’s Technical Performance Over The Past Year

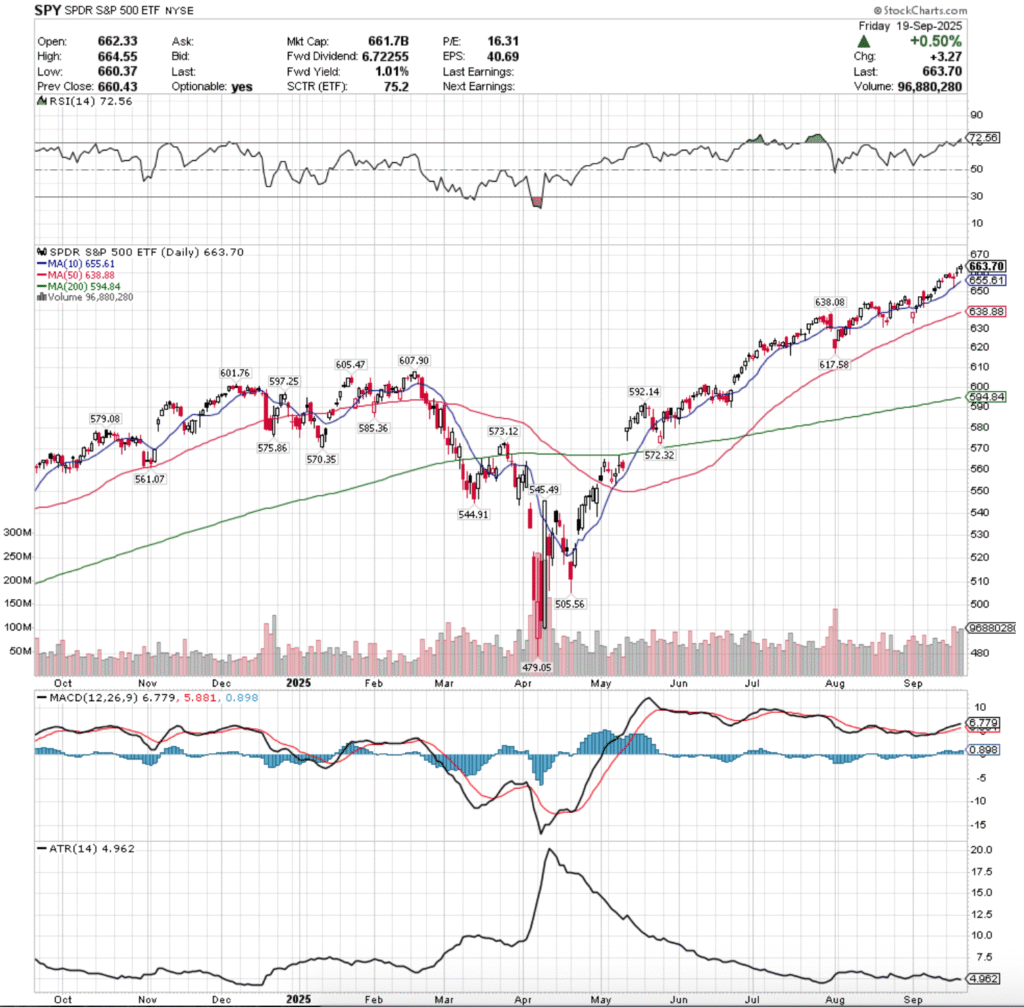
Their RSI is in overbought territory, currently at 72.56, while their MACD is bullish, but has flattened towards the end of the week, indicating that the trend may be losing steam.

Volumes were +31.57% above the prior year’s average (83,060,000 vs. 63,130,000), which is something to keep in mind given that the highest volume session of the week came on Wednesday’s decline.

Monday the week began on a muted, but bullish note, as the week’s second lowest volume session resulted in a gap up that was never able to break above the $660/share level.

Tuesday also opened on a gap up, but was also unable to break above the $660/share level, resulting in a declining session on slightly lower volume than Monday’s.

Wednesday opened slightly higher than Tuesday, rallied higher, but was unable to get as high as either of the past two days & profit taking resulted in a decline that temporarily went down to test the strength of the 10 day moving average’s support, but recovered higher by the end of the day to close -0.12%.

The mix of profit taking & the rally to force the close higher & mitigate the day’s losses combined to form the strongest volume session of the week around the Federal Reserve’s FOMC rate decision, matching the uncertainty Chairman Powell echoed & putting extra importance on the litany of Fed speakers this week.

Thursday opened on a gap up at $660.06, broke higher to $663.05, with a low of $658.44, before settling +0.47% on the day as a gravestone doji candle, indicating that there was waning sentiment in the bull run.

Friday also opened on a gap higher, tested & found support down by the $660/share level, and rallied higher to close +0.5% higher day-over-day on the week’s second highest volume.

It should be noted that Friday’s candle is a hanging man, and while it came on a bullish session there may be some support at these price levels, the spinning top with the lower shadow indicates that sentiment is waning & folks are becoming indecisive.

Heading into the new week, the upside case continues to be that there will need to be higher, sustained advancing volume in order to continue to set new all-time highs (such as Friday).

This is especially true now that there are some cracks showing in sentiment.

The consolidation case focuses on the $660/share level & the 10 day moving average, with prices oscillating around the two as we await an upside or downside catalyst, which will be influenced by what we hear from all of the Fed speakers (list is in last section), PCE/Core PCE, & GDP data.

Given the wide range of views on the most recent dot plot, the speakers will likely be some of the stronger clues for this week, especially given Powell’s remarks about the .25 bps being a hedge against the unseen.

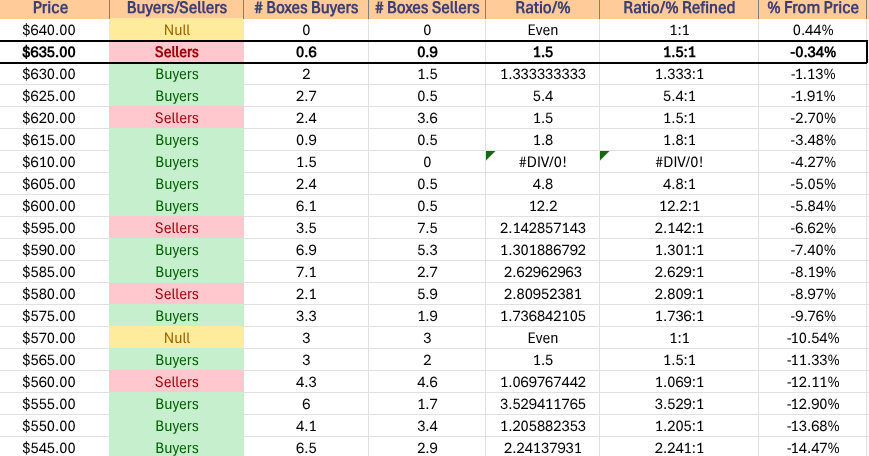
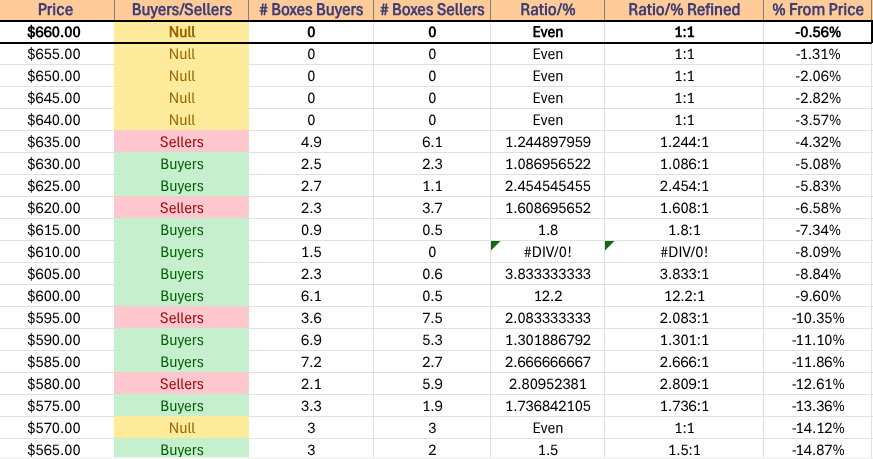
The downside case now puts the $638-638.99/share support zone in the spotlight, which if it holds up can create a new consolidation range for SPY to grow from in the future after it’s built up some support.

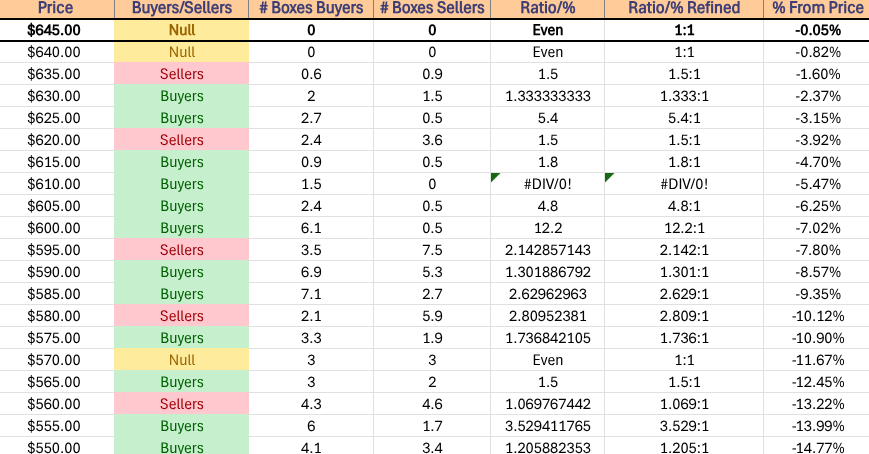
The tricky thing here is that the zone resides in a Seller dominated zone in terms of historic volume sentiment (1.25:1) from the past ~3 years, which increases the likelihood of a breakdown.

Should that happen the $617.58/share level becomes the next line of support, which opens up a new can of worms, as the late-June unfilled gap by $600/share comes within view, as does the 200 day moving average.

There are other support levels between them, but it will begin to be on folks’ radars.

The table below lists SPY’s historic volume sentiment by price level for the past ~3 years.

SPY has support at the $655.61 (10 Day Moving Average, Volume Sentiment: NULL, 0:0*), $638.88 (50 Day Moving Average, Volume Sentiment: Sellers, 1.25:1), $638.08 (Volume Sentiment: Sellers, 1.25:1) & $617.58/share (Volume Sentiment: Buyers, 1.8:1) price levels, with resistance at the $664.55/share (All-Time High, Volume Sentiment: NULL, 0:0*) price levels.

SPY ETF's Price Level:Volume Sentiment Over The Past ~3 Years
SPY ETF’s Price Level:Volume Sentiment Over The Past ~3 Years

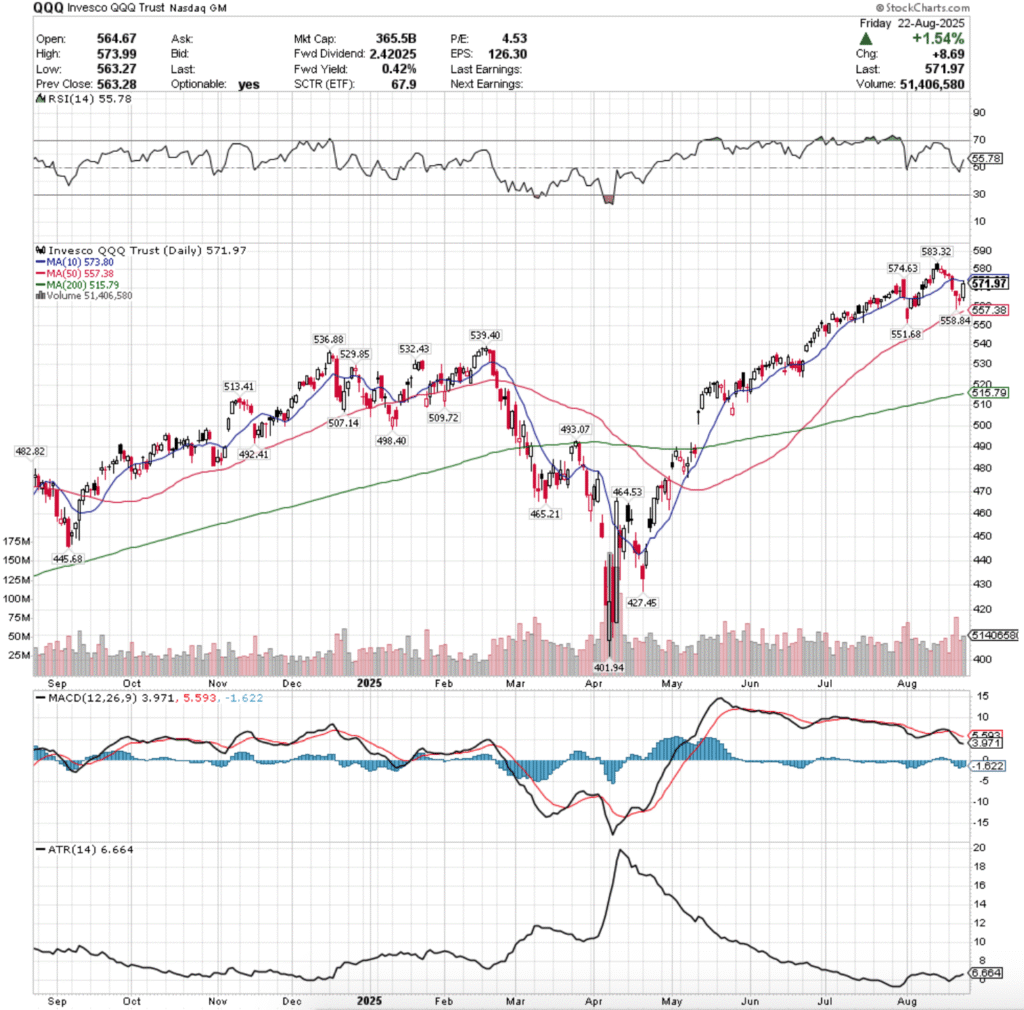
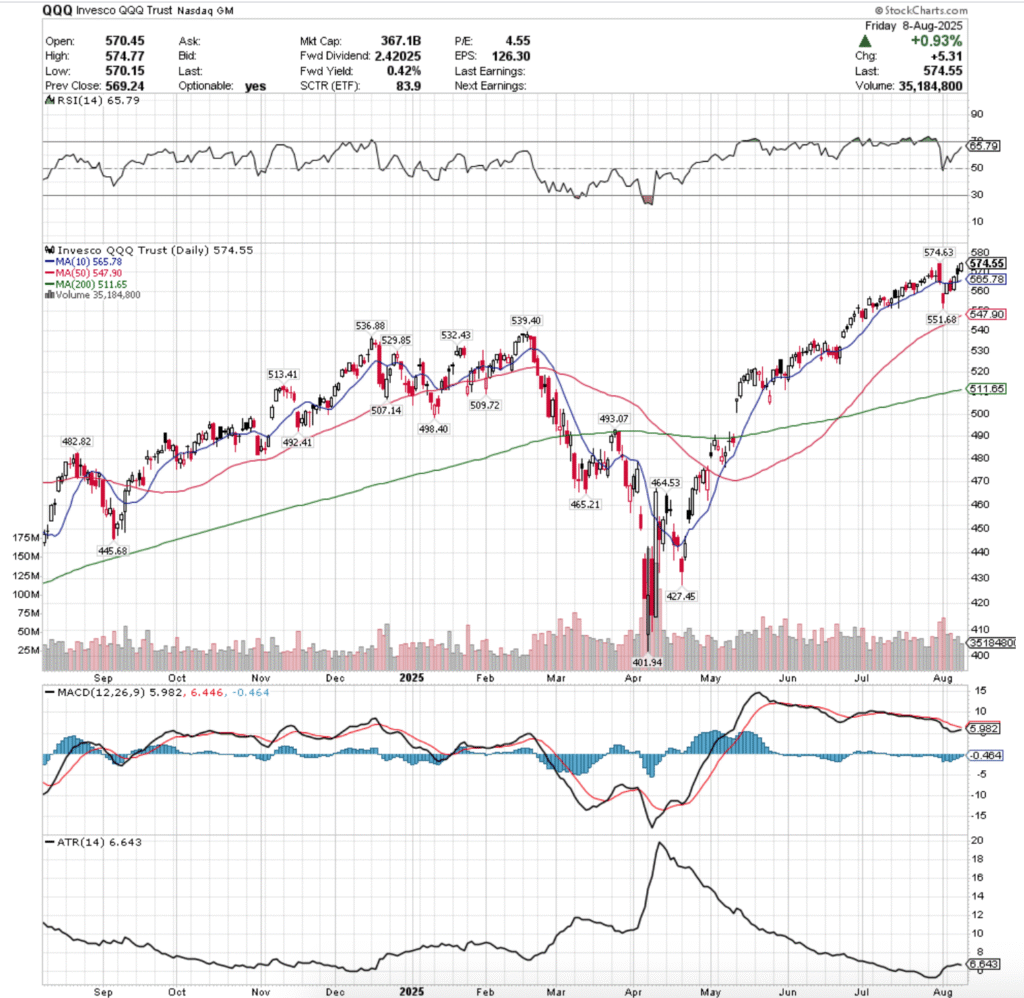
QQQ, the Invesco QQQ Trust ETF advanced +2.16% for the week, having the strongest weekly performance of the four major indexes.

QQQ ETF - Invesco QQQ Trust ETF's Technical Performance Over The Past Year
QQQ ETF – Invesco QQQ Trust ETF’s Technical Performance Over The Past Year

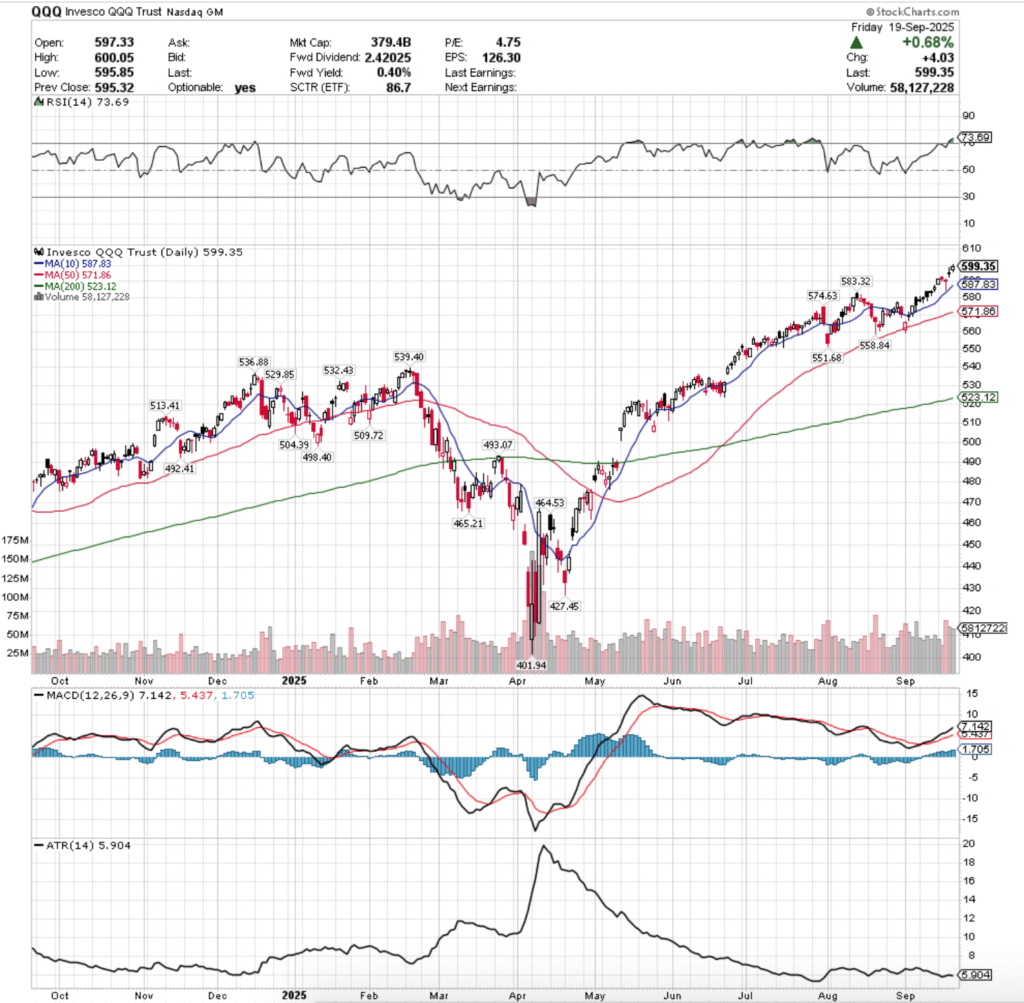
Their RSI is in overbought territory, currently at 73.69, while their MACD is bullish.

Volumes were +32.04% higher than the prior year’s average (53,990,000 vs. 40,888,446), which based on Friday’s performance signals that there is some hesitency for QQQ components compared to SPY’s performance.

Monday the week began on a gap up, bringing QQQ to above the $590/share level on the second lowest volume of the week.

Tuesday opened on another gap higher, but enthusiasm fell, as did QQQ on the week’s lowest volume.

Wednesday opened on a gap lower, tested higher, before giving out to go test the support of the 10 day moving average, but managing to recover -0.2% down for the day on the week’s highest volume.

Again, much like SPY the profit taking pre-FOMC announcement & the subsequent rally after its conclusion created said volume, indicating that there is a lot of uncertainty among market participants.

Thursday this uncertainty began to show, as a gap up open tested higher to the $597.45/share level, but retreated throughout the day & closed as a tight spinning top that closed below its opening price.

The indecision signaled there shows that caution has entered the market for QQQ & its components.

Friday opened again on another gap up, temporarily crossed $600/share, but closed +0.68% higher on the day at $599.35/share.

As we move forward, recall that in weeks’ prior notes it has been mentioned that QQQ is currently leading SPY, making it important to watch the moves of both, which adds more importance to the volume heading into the weekend trend.

SPY’s advanced heading into the weekend, while QQQ’s Friday volume did not reflect the same enthusiasm as Thursday’s volume level, which may be market participants growing weary at such high levels.

Heading into the new week the upside case continues to be the same as before for months & in SPY’s, new all-time highs will continue but they’ll need sustainable advancing volume behind them to continue driving higher.

The upside level of $600/share will be of importance though, as to carry higher it must be broken through & in the case of consolidation it will also be a point to watch.

In the consolidation case, QQQ is likely to oscillate between the $600/share level & the 10 day moving average ($587.83) while awaiting the next major upside/downside news catalyst.

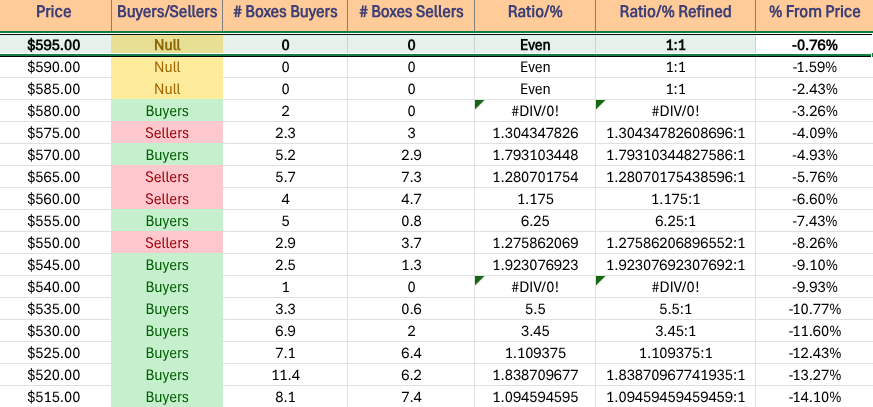
The downside case for QQQ is important to watch, with the strength of the 10 DMA’s support being the first major test.

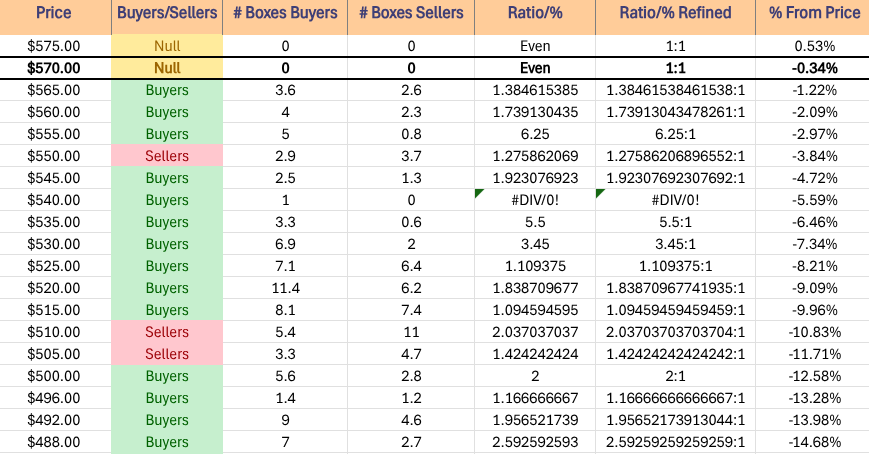
This price zone has limited volume sentiment data available at the moment, so the approach to the 10 DMA will be interesting to lend clues into whether or not there is untold Buyer sentiment, or if the Sellers are out waiting to take profits & run.

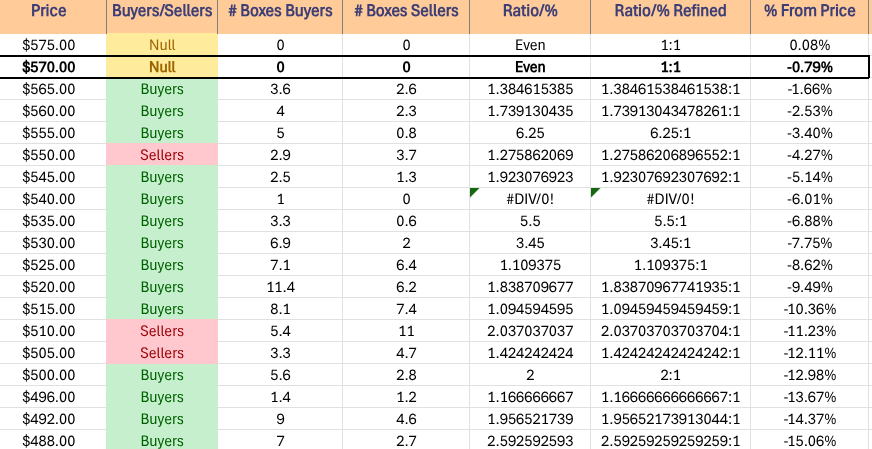
Should it break down, the 50 DMA comes into play, as does eyes on the unfilled gap from early September, especially given that there is elevated Seller entiment all around it, Per the table below.

QQQ has support at the $587.83 (10 Day Moving Average, Volume Sentiment: NULL, 0:0*), $583.32 (Volume Sentiment: Buyers, 2:0*), $574.63 (Volume Sentiment: Buyers, 1.79:1) & $571.86/share (50 Day Moving Average, Volume Sentiment: Buyers, 1.79:1) price levels, with resistance at the $600.05/share (All-Time High, Volume Sentiment: NULL, 0:0*) price levels.

QQQ ETF - Invesco QQQ Trust ETF's Price Level:Volume Sentiment Over The Past 
~1 Year
QQQ ETF – Invesco QQQ Trust ETF’s Price Level:Volume Sentiment Over The Past
~1 Year

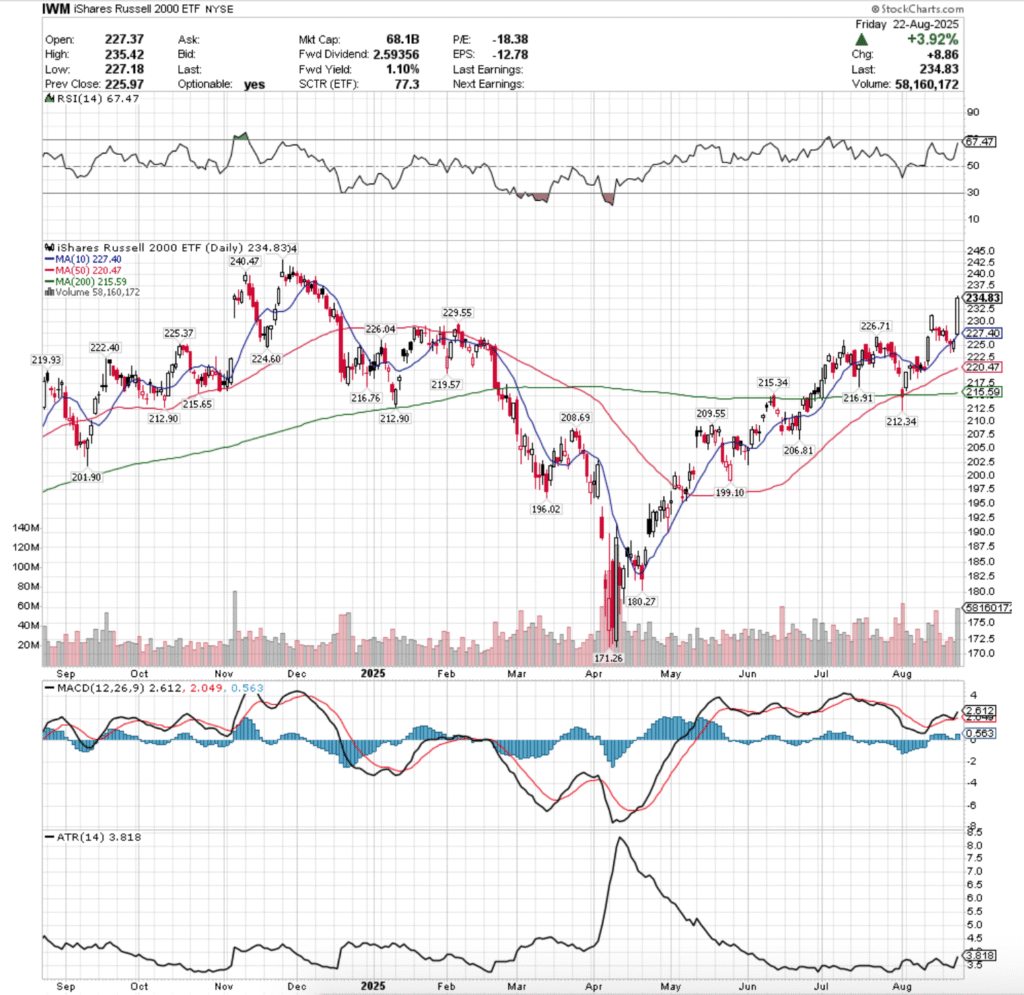
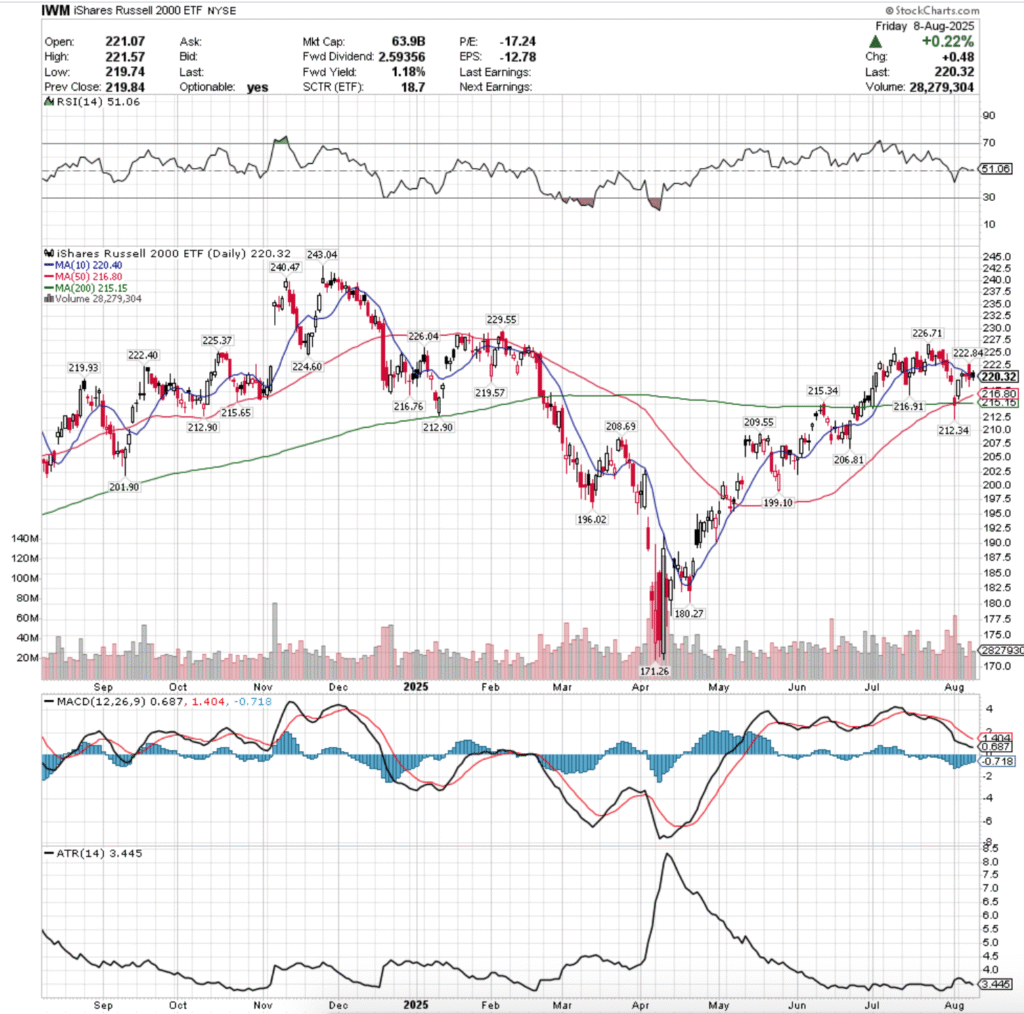
IWM, the iShares Russell 2000 ETF gained +1.95%, having the week’s second strongest performance among the four majors.

IWM ETF - iShares Russell 2000 ETF's Technical Performance Over The Past Year
IWM ETF – iShares Russell 2000 ETF’s Technical Performance Over The Past Year

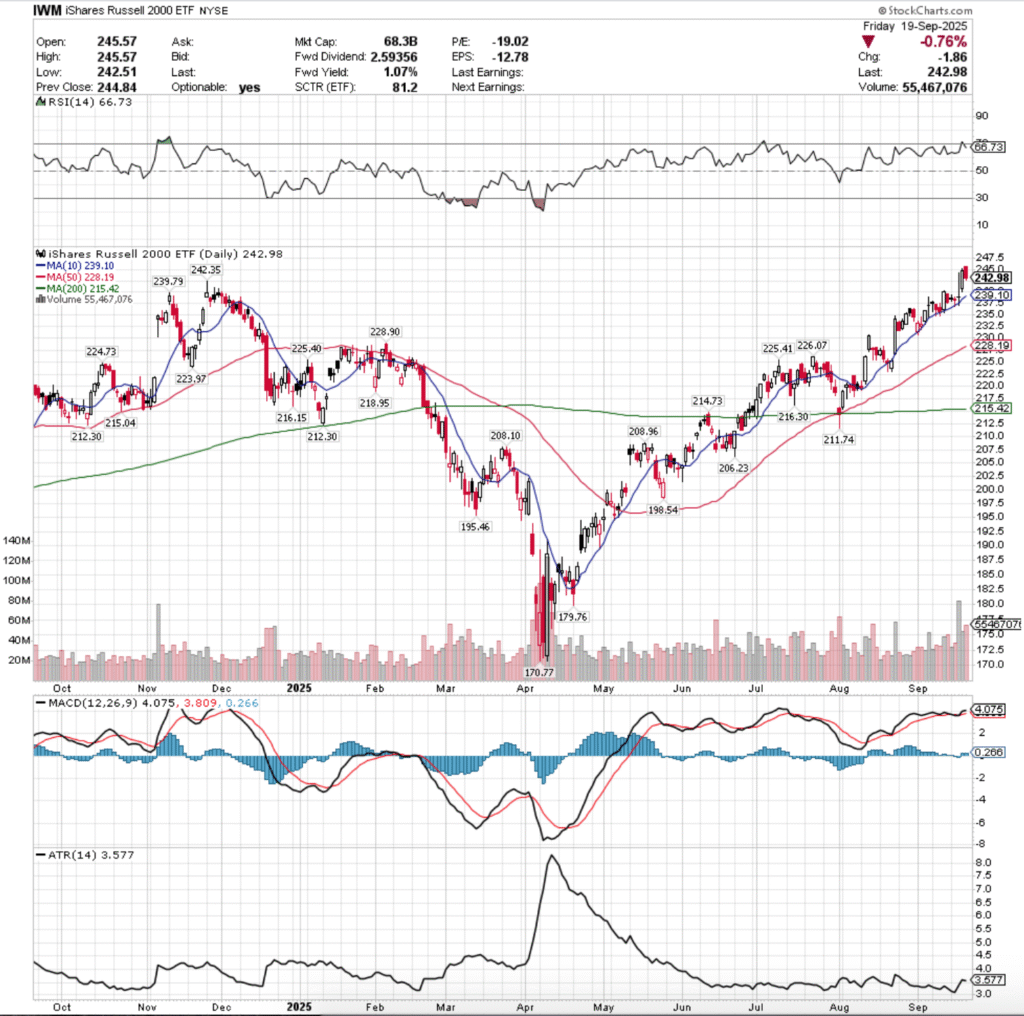
Their RSI is coming back from overbought levels following Friday’s session & is at 66.73, while their MACD is bullish, but flat following Thursday & Friday’s sessions.

Volumes were +62.75% higher than the prior year’s average (51,058,000 vs. 31,372,430), which paints a mixed picture in terms of broader sentiment, particularly given that IWM just reached a new all-time high.

Monday IWM kicked off higher, but resulted in a thin spinning top candle on the week’s thinnest volume, which did not inspire confidence & showed that market participants felt uneasy.

Tuesday opened lower, tested down to the support of the 10 day moving average, before rallying higher but still closing the day down -0.16%.

Wednesday opened on a gap higher & had quite the intraday whipesaw, testing as low as $272.02 & the 10 DMA’s support & as high as $244.28, before settling only +0.26% for the day.

An argument an be made that Wednesday’s highest volume of the week due to intraday pumps & profit taking is a gravestone doji, which carries negative bearish sentiment into the new week, which will be an area of focus.

Thursday opened on a gap higher & managed to push beyond the high of Wednesday as there was strong short-term euphoria pulling IWM higher on the week’s third highest volume.

Friday though is where things began to unwind, as after a gap up open, profit taking took over & IWM slumped -0.76% on the second highest volume of the week, which is not an indicator of near-term confidence.

The upside case for IWM continues as it’s been, particularly as they’re at all-time highs, they’ll keep following the larger indexes higher at a subdued pace, as the risks associated with small cap names are not considered advantegeous to larger caps in this current rate environment.

The consolidation case focuses on the range between the all-time high & the 10 day moving average, with oscillations occurring between them establishing a base that could provide additional support higher in the event of an upside catalyst.

The downside case becomes interesting, as the appetite is clearly there & IWM’s spent much of the past two months & beyond straddling the 10 day moving average.

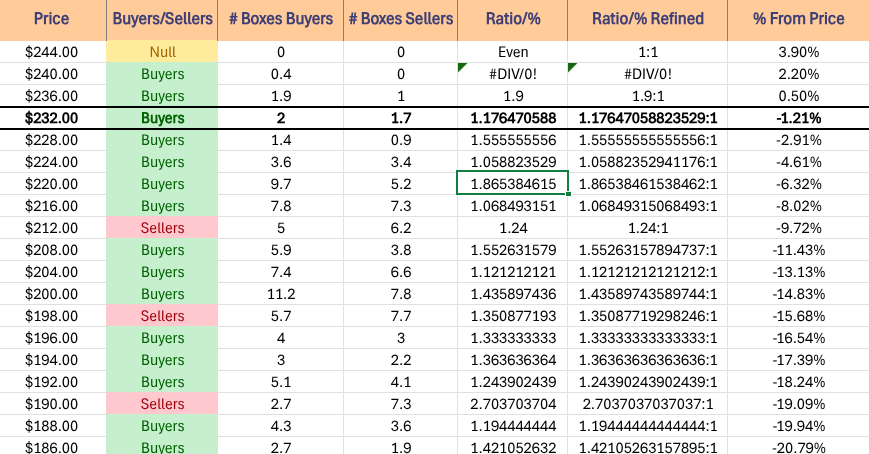
When that breaks down, the 50 day moving average & the $228.90/share level will become important areas of interest.

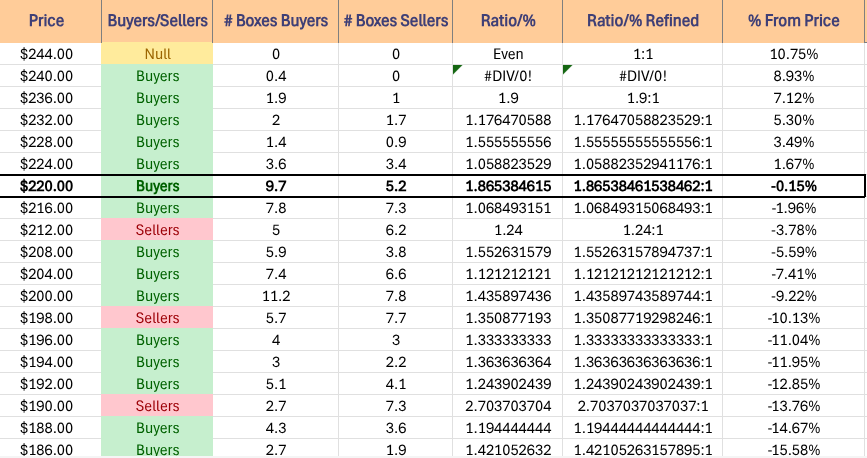
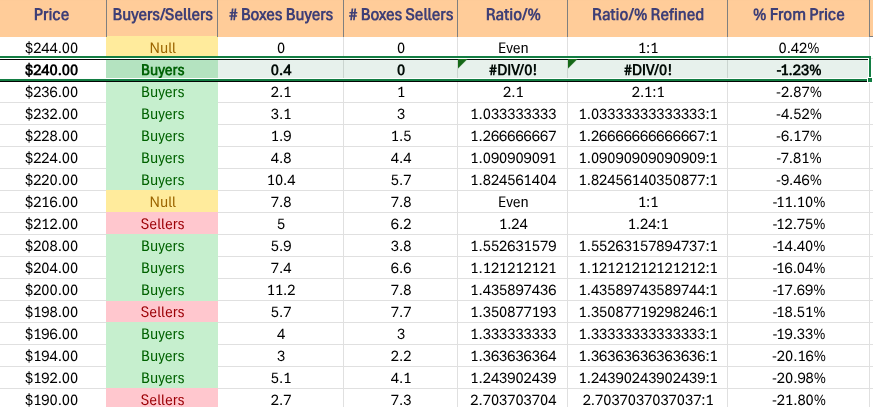
Much of their historic sentiment from the past ~2-3 years has been Buyer orienteuntil their $219.99/share level, which brings questions of how strong those levels above & the $223.97-226.07/share support zone will be, as we may see their ratios dilute with increased Seller Senitment, forcing a breakdown, or at best a consolidation range similar to the support levels mentioned.

IWM has support at the $242.35 (Volume Sentiment: Buyers, 0.4:0*), $239.79 (Volume Sentiment: Buyers, 2.1:1), $239.10 (10 Day Moving Average, Volume Sentiment: Buyers, 2.1:1) & $228.90/share (Volume Sentiment: Buyers 1.27:1) price levels, with resistance at the $245.57/share (All-Time High, Volume Sentiment: NULL, 0:0*) price levels.

IWM ETF - iShares Russell 2000 ETF's Price Level:Volume Sentiment Over The Past ~2-3 Years
IWM ETF – iShares Russell 2000 ETF’s Price Level:Volume Sentiment Over The Past ~2-3 Years

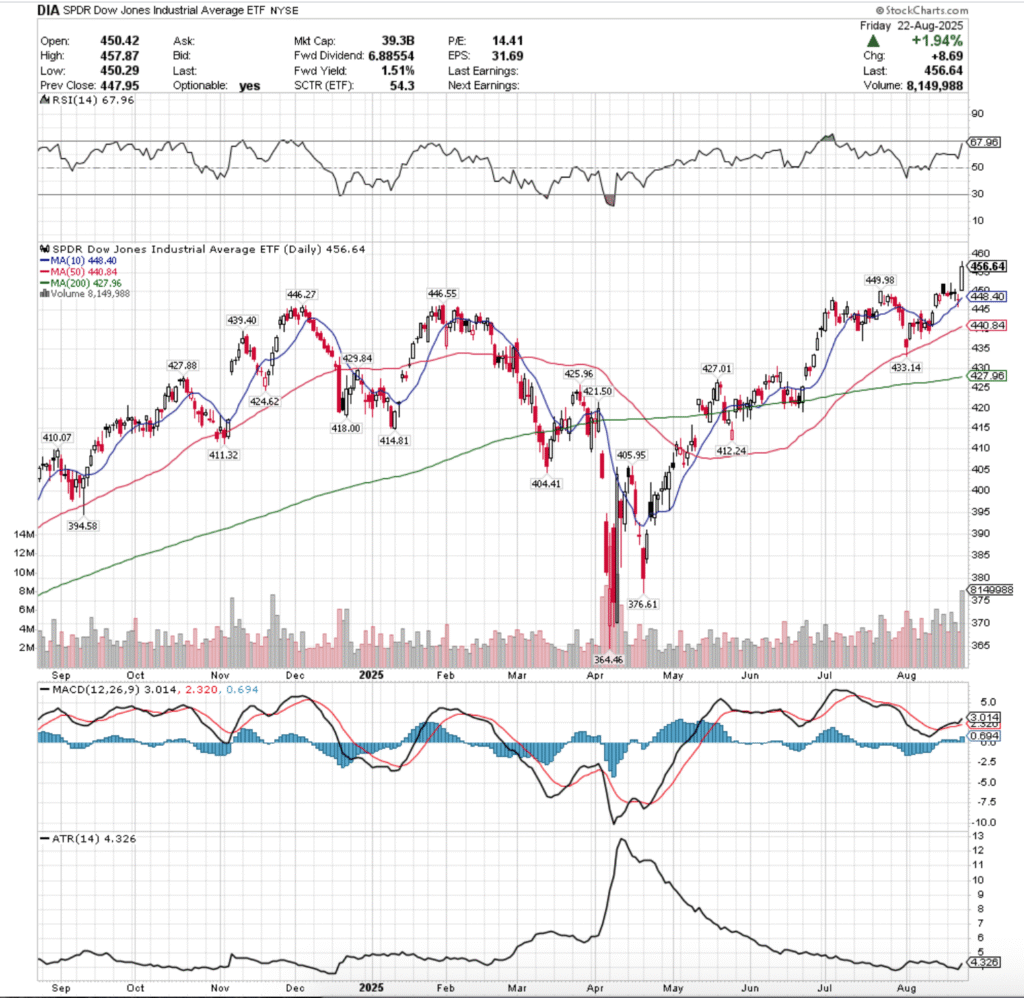
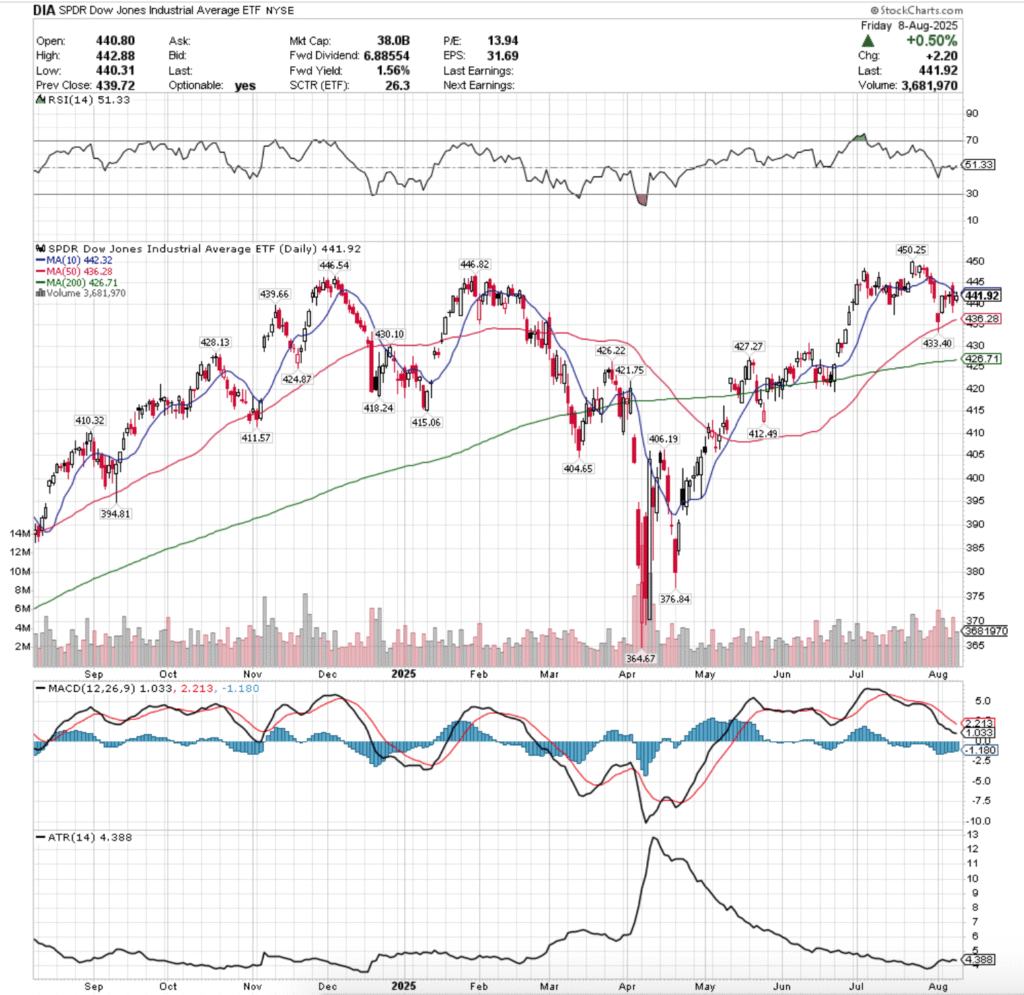
DIA, the SPDR Dow Jones Industrial Average ETF fared the worst of the majors, climbing only +0.79% for the week.

DIA ETF - SPDR Dow Jones Industrial Average ETF Over The Past Year
DIA ETF – SPDR Dow Jones Industrial Average ETF Over The Past Year

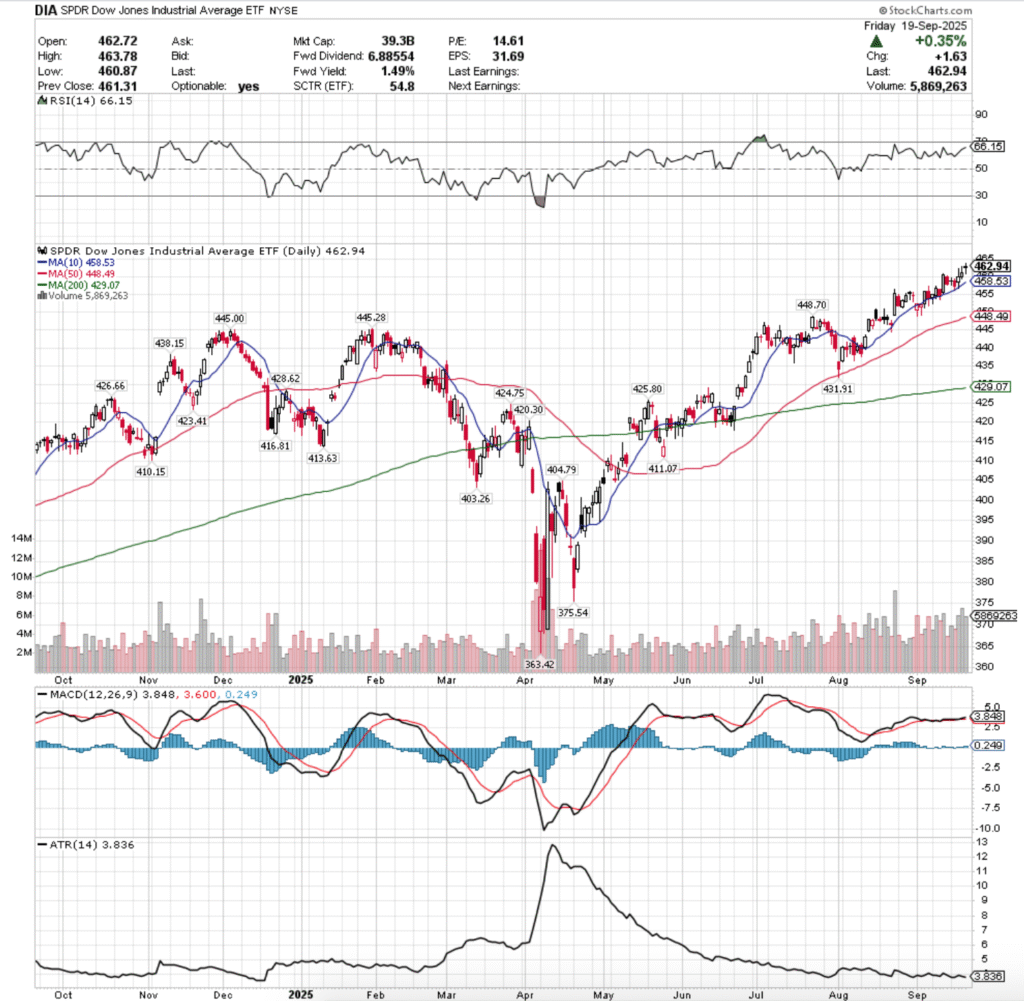
Their RSI is climbingtowards the overbought 70 mark & is currently at 66.15, while their MACD is bullish, but flat & its histpgram has been undulating for much of September, which indicates uncertainty.

Volumes were +63.38% higher than the prior year’s average (5,588,000 vs. 3,420,199), with much of it coming from the last three sessions of the week, which had the highest volumes.

Monday opened up DIA’s week with a bullish harami cross, but the day only resulted in +0.16% in returns, so hesitency was showing.

Tuesday’s candle resulted in a bearish engulfing candle, as profits taking took place the day before the FOMC announcement, and the 10 day moving average’s support was tested but prevailed.

Wednesday also saw a test of the 10 DMA, which held up & the day resulted in a high wave spinning top, showing that markets could move in any direction to a fair degree, but that folks were still buying after Powell’s Press Conference.

Thursday the highest volume session of the week opened higher, retraded in Wednesday’s range, before springing higher to $463.05/share, before profit takers stepped in forcing the price down to close at $461.31, +0.3% on the day.

The highest volume session having such a high upper shadow but the body concentration being towards the bottom of the candle showed that the bears have begun to step in more aggressively.

Friday the week wound down with a gap up open that retraced all the way down to into Thursday’s real body, but managed to close as a thin hanging man, indicating that the end of the line is likely near for DIA or at least a short-term breather as the bulls barely squeeked by with much beyond the gap in terms of day-over-day gains.

Heading into the new week, the upside case remains the same, more all-time highs will need sustained higher levels of advancing volume before markets lose steam.

The consolidation case focuses around DIA oscillating around its 10 day moving average until there’s an upside or downside catalyst.

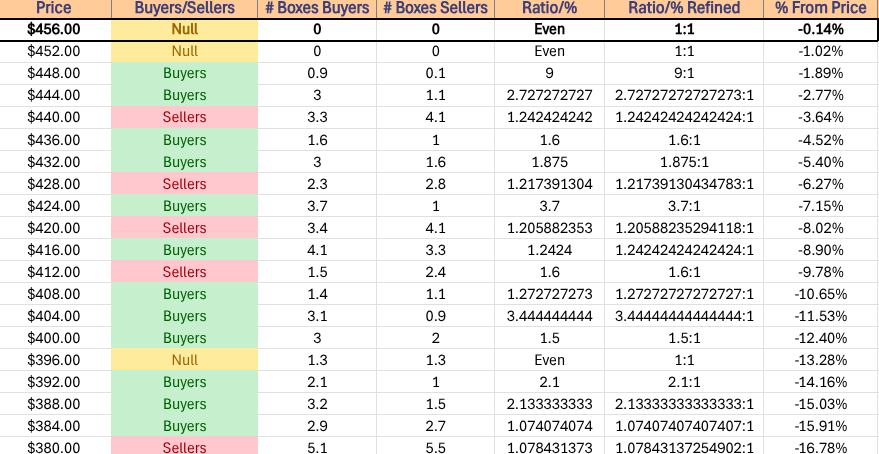
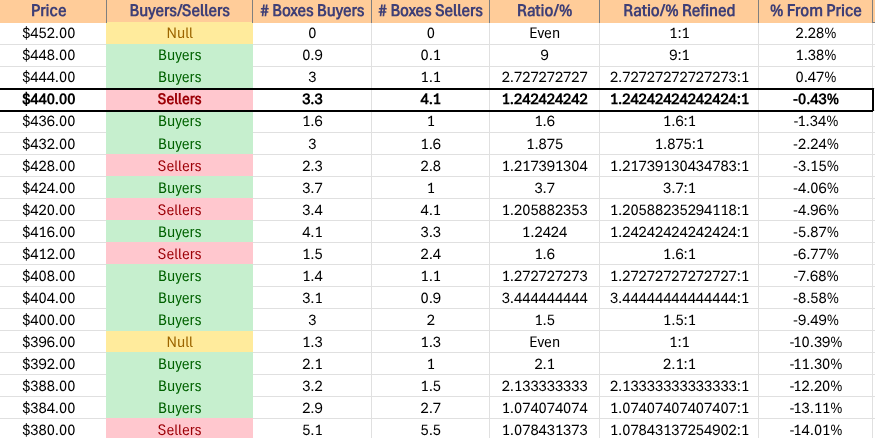
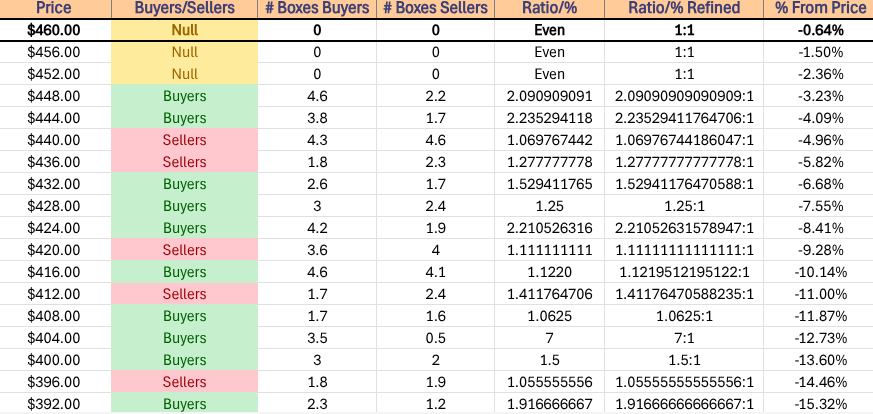
To the downside, once the 10 DMA breaks down, $448.49(50 DMA)-448.70 & $445-445.28 are key areas of support to watch, especially given that they are the gatekeepers to $443.99/share, which is when DIA enters back-to-back Seller dominated zones, as shown on the chart below.

Given that DIA tends to be more Buy & Hold type of names, a decline may be more forceful than anticipated if folks are liquidating long-held positions in favor of cash & safer assets than the blue chip index components.

DIA has support at the $458.53 (10 Day Moving Average, Volume Sentiment: NULL, 0:0*), $448.70 (Volume Sentiment: Buyers, 2.09:1), $448.49 (50 Day Moving Average, Volume Sentiment: Buyers, 2.09:1) & $445.28/share (Volume Sentiment: Buyers, 2.24:1) price levels, with resistance at the $463.78/share (All-Time High, Volume Sentiment: NULL, 0:0*) price levels.

DIA ETF's Price Level:Volume Sentiment Over The Past ~3 Years
DIA ETF’s Price Level:Volume Sentiment Over The Past ~3 Years

The Week Ahead

Monday the week begins with Fed President Williams speaking at 9:45 am, Fed President Musalem speaking at 10 am & Fed Governors Miran, Hammack & Barkin speaking at 12 pm, and there are no major earnings reports.

More Fed speakers are on deck for Tuesday, including a speach from Vice Chair of Supervision Bowman at 9 am, S&P Flash U.S. Services PMI & S&P Flash U.S. Manufacturing PMI data at 9:45 am & Fed Chair Powell speaking at 12:35 pm.

Tuesday morning begins with earnings from AutoZone, followed by AAR, Micron, MillerKnoll & Worthington Enterprises after the closing bell.

Wednesday brings us New Home Sales data at 10 am, followed by Fed President Daly speaking at 4:10 pm.

Cintas & Thor Industries report earnings before Wednesday’s opening bell, before H.B.Fuller, KB Home, Steel case, Stitch Fix & Worthington Steel.

Fed President Goolsbee speaks at 8:20 am Thursday, before Initial Jobless Claims, GDP (third estimate), Advanced U.S. Trade Balance In Goods, Advanced Retail Inventories, Advanced Wholesale Inventories, Durable-Goods Orders & Durable-Goods minus Transportation data at 8:30 am; Fed President Williams speaks at 9 am, followed by Fed Vice Chair of Supervision Bowman speaking & Existing Home Sales data at 10 am, Fed Govrnor Barr speaking at 1 pm, Fed President Logan speaking at 1:40 pm & Fed President Daly speaking at 3:30 pm.

Thursday morning kicks off with earnings from Accenture, CarMax, Jabil & TD Synnex, before Costco Wholesale, BlackBerry & Concentrix report following the closing bell.

Friday the week rounds out with Person Income, Personal Spending, PCE Index, PCE (Year-over-Year), Core PCE Index & Core PCE (Year-over-Year) data at 8:30 am, followed by Fed President Barkin speaking at 9 am, Consumer Sentiment (final) data at 10 am & Fed Vice Chair for Supervision Bowman speaking at 1 pm & all is quiet on the earnings front heading into the weekend.

See you back here next week!

*** I DO NOT OWN SHARES OR OPTIONS CONTRACT POSITIONS IN SPY, QQQ, IWM OR DIA AT THE TIME OF PUBLISHING THIS ARTICLE ***

Daily VolTech Stock & ETF Volume & Technical Ratings 9/2/2025

The VIX closed at 17.17, indicating an implied one day move of +/-1.08% & an implied one month move of +/-4.96% for the S&P 500.   

Highest Technical Rated S&P 500 Components Per 9/2/2025’s Close:   

1 – WDC

2 – STX  

3 – NEM 

4 – WYNN  

5 – GLW 

6 – PLTR  

7 – ANET

8 – RCL 

9 – CHRW

10 – IDXX

Lowest Technical Rated S&P 500 Components Per 9/2/2025’s Close:   

1 – IT 

2 – TTD 

3 – CNC

4 – ALGN

5 – CHTR

6 – LULU

7 – MOH

8 – MRNA

9 – FI

10 – FTNT

Highest Volume Rated S&P 500 Components Per 9/2/2025’s Close:   

1 – KHC

2 – STZ

3 – ULTA

4 – BAX

5 – KDP

6 – PEP

7 – BG

8 – GEV

9 – HRL

10 – SPG

Lowest Volume Rated S&P 500 Components Per 9/2/2025’s Close:   

1 – PSKY

2 – HOLX

3 – CSX

4 – FSLR

5 – INTC

6 – TMO

7 – UNH

8 – CRL 

9 – HSIC  

10 – OTIS  

Highest Technical Rated ETFs Per 9/2/2025’s Close:   

1 – JNUG

2 – NUGT

3 – MSOX

4 – MSOS

5 – WEED

6 – YOLO

7 – MJ

8 – CNBS

9 – GDMN

10 – WGMI

Lowest Technical Rated ETFs Per 9/2/2025’s Close:   

1 – ETHD

2 – ETQ

3 – JDST

4 – DUST

5 – UVIX

6 – AIYY

7 – MSTX

8 – SETH

9 – SMCX

10 – MRNY

Highest Volume Rated ETFs Per 9/2/2025’s Close:   

1 – LIAK

2 – TAXM

3 – PUI

4 – PEZ

5 – PBSE

6 – CPST

7 – ABOT

8 – SHRT

9 – IBIL

10 – FINE

Lowest Volume Rated ETFs Per 9/2/2025’s Close:   

1 – BHYB

2 – GSID 

3 – CPRJ

4 – LPRE

5 – HYDW

6 – MMCA

7 – OCTM

8 – SPIN

9 – MBNE

10 – CCNR

Highest Technical Rated General Stocks Per 9/2/2025’s Close:   

1 – MVLA

2 – SOGP

3 – ZEPP

4 – ANTE

5 – ISKTF

6 – SUPX

7 – ABVX

8 – QMMM

9 – NBY

10 – HGRAF

Lowest Technical Rated General Stocks Per 9/2/2025’s Close:   

1 – BINI

2 – STFS

3 – SMX

4 – OP

5 – EPIX

6 – NXTT

7 – QH

8 – ELPW

9 – OST

10 – GIBO

Highest Volume Rated General Stocks Per 9/2/2025’s Close:   

1 – UUU

2 –  SHFS

3 – SMTK

4 – ZTEK

5 – ASNS

6 – SSKN

7 – HWH

8 – OUT

9 – CJET

10 – HOTH

Lowest Volume Rated General Stocks Per 9/2/2025’s Close:   

1 – EMMA

2 – OLNCF

3 – AVHHL

4 – LUXH

5 – NBYCF

6 – INBP

7 – SISI  

8 – EMYB

9 – CULL

10 – AURX

*** THE LIST ABOVE IS STRICTLY FOR INFORMATIONAL PURPOSES – I MAY OR MAY NOT HAVE OR INITIATE A LONG, SHORT, OR LONG/SHORT POSITION IN ANY NAME ABOVE AT ANY TIME *** 

Weekly Stock & ETF Review 8/24/2025

SPY, the SPDR S&P 500 ETF gained +0.29% last week, while the VIX closed at 14.22, indicating an implied one day move of +/-0.9% & an implied one month move of +/-4.11%.

SPY ETF - SPDR S&P 500 ETF's Technical Performance Over The Past Year
SPY ETF – SPDR S&P 500 ETF’s Technical Performance Over The Past Year

Their RSI is trending higher & currently at 63.3, while their MACD is still bearish, but has flattened & could cross the signal line bullishly by mid-week in the event of no declining sessions.

Volumes were +9.85% above the prior year’s average (67,362,000 vs. 61,323,412.7), which is something to keep in mind giving that the highest volume session of the week was declining volume & four of the five sessions resulted in declines.

The week kicked off hinting at uncertainty on Monday, as a weak volume session resulted in a decline that’s real body was slightly larger than a doji, but not quite a spinning top, indicating that there was a wait & see feeling among market participants.

Tuesday it became more evident that there was a mix of uncertainty & fear in SPY, as the session resulted in the third highest volume of the week while forming a bearish engulfing pattern & resting atop the support of the 10 day moving average.

Wednesday opened in-line with the 10 DMA, but selling pressure came in to force the heaviest volume session of the week that say SPY fall -0.27%, but the support of the 20 day moving average broke down temporarily & the lower shadow of the day’s candle indicated that there was urgency to take profits down at these high valuation levels.

Thursday opened on a gap down & left a taste of uncertainty among market participants at the close, as Fed Chair Powell’s remarks from Jackson Hole on Friday were eagerly anticipated.

The session ended as a spinning top candle, indicating the uncertainty of the marketplace, which stayed within the lower shadow of Wednesday’s candle.

Friday opened on a gap higher, and after Powell’s remarks were interpreted as dovish the 10 day moving average’s resistance was broken through, but the volume should be noted for it was only the second highest volume of the session.

This raises questions of sustainability coming in a week with many interesting names reporting earnings, including NVDA, and PCE data coming in on Friday.

It should come as no surprise to anyone that this week will have all eyes on NVDA’s earnings call Wednesday afternoon, as well as PCE data on Friday in hopes of finding a catalyst to move the markets.

The upside case remains the same as its been for some time now, these new all-time highs need more advancing volume behind them in order to be sustainable & continue SPY marching higher at these already heightened valuations.

Without more volume, this is like watching the waning turns of a game of Jenga.

The consolidation case also looks the same as it has, with oscillations around the 10 day moving average likely to be the norm as we await an upside or downside catalyst.

The short-term trendline has acted as a safe haven of sorts in recent weeks/months, and will likely continue to do so in times of uncertainty.

The downside case requires a breakdown of the support of the 10 day moving average.

After this, the next two support levels reside in Seller oriented zones (1.5:1, each), making the $619.29/share an interesting level to watch, as should it break down support doesn’t appear for another ~2% at the $609.59/share level.

While there is heavy Buyer historic sentiment in that support zone , if $599.99/share is broken into then all attention shifts to the 200 day moving average’s support.

The table below can be used to reference the strength & weakness of support/resistance levels in the event of re-tests.

SPY has support at the $641.40 (10 Day Moving Average, Volume Sentiment: NULL, 0:0*), $639.85 (Volume Sentiment: Sellers, 1.5:1), $624.93 (50 Day Moving Average, Volume Sentiment: Sellers, 1.5:1) & $619.29/share (Volume Sentiment: Buyers, 1.8:1) price levels, with resistance at the $646.50/share (All Time High, Volume Sentiment: NULL,0:0*) price levels.

SPY ETF's Price Level:Volume Sentiment Over The Past ~3 Years
SPY ETF’s Price Level:Volume Sentiment Over The Past ~3 Years

QQQ, the Invesco QQQ Trust ETF dipped -0.93% last week, as the tech heavy index fared the worst of the four majors.

QQQ ETF - Invesco QQQ Trust ETF's Technical Performance Over The Past Year
QQQ ETF – Invesco QQQ Trust ETF’s Technical Performance Over The Past Year

Their RSI is trending higher & currently sits at 55.78, just above the neutral 50 mark, while their MACD is bearish, but may flatten out by midweek towards the signal line in the event of a couple of advancing sessions.

Volumes were +28.55% higher than the prior year’s average (51,126,000 vs. 39,772,222.22), which like SPY is not a telling sign of strength as it was mostly declining volume.

There will need to be more advancing volume that remains consistently higher before any meaningful upside enthusiasm can be felt.

Monday the week opened up in a similarly eerie fashion to SPY, declining & closing as midway between a spinning top & a doji, and also on extremely low volume.

Tuesday the trend continued, with QQQ dropped on the open & managed to decline through the support of the 10 day moving average, with volume indicating that there was a lot of profit taking & uncertainty/fear had crept into the market.

Wednesday the trend continued lower, except with the highest volume of the past week, and the gap down open saw a lot of bleeding, down almost to the 50 day moving average’s support, but was able to recover into the close from the day’s lows, but still had a day-ver-day decline of -0.59%.

Thursday opened with another gap down, but this time on weaker volume, indicating that there was subdued selling pressure, but that uncertainty still ran high.

Friday opened on a slight gap up, tested lower temporarily but was able to rally, but only temporarily broke out above the 10 day moving average’s resistance, indicating that the short-term trendline was strong & that market participants were respecting it.

Much like SPY, the upside case for QQQ will require heavy lifting in the advancing volume department & will need to show sustainability & confirm longevity before being bought into.

The consolidation case looks like QQQ will be oscillating between & around the 10 & 50 day moving averages awaiting an upside or downside catalyst.

One area of interest that differs between QQQ & SPY’s charts is beginning to show & it is an area of concern given that in the past we’ve noted that any decline in the near-term is likely to be led by QQQ.

QQQ spent much of last week treading water below the 10 day moving average’s resistance, indicating that there is a bit of uncertainty about their near-term.

In the process, a bearish head & shoulders pattern has begun to emerge since late July, with the $574.63/share mark making the left shoulder & the $583.32/share forming the head.

While it’s certainly too soon to tell, that is going to be something to keep an eye on in the coming week, as will be the support of the 50 day moving average.

Currently that level is heavily Buyer influenced in recent history, but if it breaks down the $539.40/share level is the next support levels, which if reached signals that there will be a window filled in from late June.

In the event that this occurs there are other windows that may also fill in such as the large one in May of 2025, and the 200 day moving average’s support is also going to be called into question.

QQQ has support at the $558.84 (Volume Sentiment: Buyers, 6.25:1), $557.38 (50 Day Moving Average, Volume Sentiment: Buyers, 6.25:1), $551.68 (Volume Sentiment: Sellers, 1.28:1), & $539.40/share (Volume Sentiment: Buyers, 5.5:1) price levels, with resistance at the $573.80 (10 Day Moving Average, Volume Sentiment: NULL, 0:0*), $574.63 (Volume Sentiment: NULL, 0:0*) & $583.32/share (Volume Sentiment: NULL, 0:0*) price levels.

QQQ ETF's Price Level:Volume Sentiment Over The Past ~1 Year
QQQ ETF’s Price Level:Volume Sentiment Over The Past ~1 Year

IWM, the iShares Russell 2000 ETF advanced +3.39% last week, as the small cap index was the favorite among market participants after having spent some time in consolidation.

IWM ETF - iShares Russell 2000 ETF's Technical Performance Over The Past Year
IWM ETF – iShares Russell 2000 ETF’s Technical Performance Over The Past Year

Their RSI is approaching the overbought level of 70 & sits currently at 67.47, while their MACD is still bullish, having recently bounced off of the signal line in the wake of Friday’s advances, which will be something to keep an eye on in the coming week.

Volumes were +1.39% higher than the prior year’s average (30,996,000 vs. 30,570,714), which mostly came from Friday’s outsized advancing volume that eclipsed almost every session we’ve had since April of 2025 & even most of the 2024 portion of the last one year chart.

Monday kicked IWM’s week off in a unique fashion, with a bullish harami spinning top on extraordinarily low volume; more or less the equivalent of a shrug & an “I don’t know” from a chart’s perspective.

The next day opened higher, was able to gain a little momentum, but ultimately faded out & declined into a bearish engulfing pattern.

Wednesday opened on a gap down, temporarily broke through the support of the ten day moving average, but managed to recover enough to close down -0.35% on the day, closing in-line with the 10 day moving average.

Thursday opened lower, but gave a shimmer of optimism after rising up to close in-line with the 10 day moving average’s resistance, but higher than Wednesday’s open leading to the formation of a bullish engulfing pattern.

Thursday too lacked sufficient volume in terms of the increased levels that we would like to see for a more meaningful rally.

Friday opened on a gap higher that pulled the 10 day moving average much higher (up to about its opening level) & the week’s strongest volume produced a session that advanced +3.92% heading into the weekend.

Moving into the new week any upside movements is likely to be predicated on the performance of the other larger indexes, as at these heights small caps are not favorable to larger names.

The consolidation case looks similar to QQQ’s, where the price will oscillated back & forth between the 10 & 50 day moving averages.

The declining case here will also be impacted by the larger names, and it will be interesting to see whether or not there are outright declines or if there is appetite for a rotation play into the smaller cap names.

IWM has traveled in a much more compact fashion, which provides it with more support levels relative to its price vs. the other indexes, but that does not imply that IWM will be immune to declines in larger indexes.

The 200 day moving average will be an area to keep an eye on, as that would be a decline of ~10% & should the long-term trend line break down it resides ina Seller oriented zone, which may cause more selling after the support levels gives out.

IWM has support at the $229.55 (Volume Sentiment: Buyers, 1.56:1), $227.40 (10 Day Moving Average, Volume Sentiment: Buyers, 1.06:1), $226.71 (Volume Sentiment: Buyers, 1.06:1) & $226.04/share (Volume Sentiment: Buyers, 1.06:1) price levels, with resistance at the $240.47 (Volume Sentiment: Buyers, 0.4:0*) & $243.04/share (All-Time High, Volume Sentiment: Buyers, 0.4:0*) price levels.

IWM ETF - iShares Russell 2000 ETF's Price Level:Volume Sentiment For The Past ~2-3 Years
IWM ETF – iShares Russell 2000 ETF’s Price Level:Volume Sentiment For The Past ~2-3 Years

DIA, the SPDR Dow Jones Industrial Average ETF climbed +1.58% last week, having the second best week of the major four index ETFs.

DIA ETF - SPDR Dow Jones Industrial Average ETF's Technical Performance Over The Past Year
DIA ETF – SPDR Dow Jones Industrial Average ETF’s Technical Performance Over The Past Year

Their RSI is advancing higher & currently sits near overbought territory at 67.96, while their MACD is bullish & creeping higher following Friday’s session.

Volumes were +59.2% higher than the prior year’s average levels (5,222,000 vs. 3,280,119), which seems to be a bit of optimism & FOMO based on the week’s candles & volume patterns.

Monday the week opened up on a similar note of uncertainty, as the declining session saw late week profits taken from DIA & the spinning top candle signaled that there was a bit of uncertainty in the blue chip index.

Tuesday showed that there was really quite more uncertainty in the air than originally anticipaned, as the session opened higher & ran above the $452/share level, before falling lower & ultimately closing below its opening price as a doji candle.

This indicated that there was a bit of uncertainty in the air, and the elevated volume throughout the day points to short-term profit taking while awaiting to see where major indexes move next.

Wednesday opened slightly higher, but the story remained the same, minus slightly less volume & the testing was more to the downside vs. Tuesday’s upside tests & the day resulted in a doji candle.

Thursday opened on a gap lower to be in-line with the 10 day moving average’s support & ended as a high wave doji, indicating that there was some profits taking & some folks creating new positions, but at the end of the day there was uncertainty in the air.

The short-term trendline was a place of refuge & appeared to be the safe haven of choice by market participants.

Friday opened on a major gap up on the week’s highest volume (which was also some of the highest volume of the 2025), and a new all-time high was reached.

The upside case for DIA is the same as the ones for SPY & QQQ, new all-time highs aren’t sustainable without increased advancing volume.

The consolidation case looks similar too, oscillations around the 10 & 50 day moving averages while we wait & see what the next upside or downside catalyst will be.

To the downside the $446.27-446.55/share zone is going to be an important support level, as should it decline through there teh 50 day moving average is opened up for a retest, which should it fail opens up DIA to a retest of the 200 Day moving average based on gaps that need to be filled.

While DIA has enjoyed a lot of Buyer-focused sentiment, that type of breakdown would force prices down into price zones where Sellers are more prominent, which could further declines.

DIA has support at the $449.98 (Volume Sentiment: Buyers, 9:1), $448.40 (10 Day Moving Averge, Volume Sentiment: Buyers, 9:1), $446.55 (Volume Sentiment: Buyers, 2.73:1) & $446.27/share (Volume Sentiment: Buyers, 2.73:1) price levels, with resistance at the $457.87/share (All-Time High, Volume Sentiment: NULL, 0:0*) price levels.

DIA ETF's Price Level:Volume Sentiment Over The Past ~2-3 Years
DIA ETF’s Price Level:Volume Sentiment Over The Past ~2-3 Years

The Week Ahead

The week kicks off with New Home Sales data at 10 am, Fed President Logan speaking at 3:15 pm & Fed President Williams speaking at 7:15pm on Monday.

Monday morning also features earnings from PDD Holdings, before HEICO & Semtech report after the session’s close.

Tuesday begins with Durable-Goods Orders & Durable-Goods minus Transportation data at 8:30 am, before S&P Case-Shiller Home Price Index (20 Cities) data at 9:30 am & Consumer Confidence data at 10 am.

Bank of Nova Scotia & KE Holdings report earnings before Monday’s opening bell, with Box, MongoDB, nCino, Okta & PVH scheduled to report after the session’s closing bell.

There are no major economic data points scheduled for release on Wednesday.

Wednesday morning begins with Royal Bank of Canada’s earnings call, as well as Abercrombie & Fitch, Bank of Montreal, Donaldson, J.M. Smucker, Kohl’s, MasterCraft & Phototronics, before the highly anticipated NVIDIA earnings call & Agilent, Bill.com, Cooper, CrowdStrike, Five Below, Greif, HP, NetApp, Nutanix, Pure Storage, Snowflake, Trip.com, Urban Outfitters & Veeva Systems after the closing bell.

Thursday brings us Initial Jobless Claims & GDP (First Revision) data at 8:30 am, followed by Pending Home Sales at 10 am.

Bath & Body Works, Best Buy, Brown-Foreman, Burlington Stores, CIBC, Dick’s Sporting Goods, Dollar General, Hormel Foods, Li Auto, Malibu Boats, Ollie’s Bargain Outlet, Toronto-Dominion Bank & Victoria’s Secret report earnings before the opening bell on Thursday, before Affirm, Ambarella, Autodesk, Dell, Domo, Elastic, Gap, Marvell, Petco Health & Wellness, SentinelOne & Ulta Beauty report after the session closes.

Personal Income, Personal Spending, PCE Index, PCE (Year-over-Year), Core PCE Index, Core PCE (Year-over-Year), Advanced U.S. Trade Balance in Goods, Advanced Retail Inventories & Advanced Wholesale Inventories data is scheduled for release at 8:30 am on Friday, before Chicago Business Barometer (PMI) data at 9:45 am & Consumer Sentiment (Final) data at 10 am.

Alibab reports earnings Friday morning before the opening bell.

See you back here next week!

*** I DO NOT OWN SHARES OR OPTIONS CONTRACT POSITIONS IN SPY, QQQ, IWM OR DIA AT THE TIME OF PUBLISHING THIS ARTICLE ***

Daily VolTech Stock & ETF Volume & Technical Ratings 8/19/2025

The VIX closed at 15.57, indicating an implied one day move of +/-0.98% & an implied one month move of +/-4.5% for the S&P 500.   

Highest Technical Rated S&P 500 Components Per 8/19/2025’s Close:   

1 –  EBAY

2 –  WDC

3 –  STX

4 –  GNRC

5 –  GEV

6 –  PLTR

7 –  FSLR

8 –  ANET

9 –  APH

10 –  IDXX

Lowest Technical Rated S&P 500 Components Per 8/19/2025’s Close:   

1 – IT

2 – TTD  

3 – CNC  

4 – MOH  

5 – LULU 

6 –  CHTR

7 –  DOW

8 –  ALGN

9 –  FTNT

10 –  ENPH

Highest Volume Rated S&P 500 Components Per 8/19/2025’s Close:   

1 – PANW

2 – INTC

3 – MDT

4 – CB

5 – CSX

6 – HD

7 – FTNT

8 – DAY

9 – PLTR

10 – OTIS

Lowest Volume Rated S&P 500 Components Per 8/19/2025’s Close:   

1 – PNW

2 – XYZ

3 – BRO

4 – LUV

5 – DECK

6 – DTE

7 –  K

8 –  EVRG

9 –  CNP

10 – ES

Highest Technical Rated ETFs Per 8/19/2025’s Close:   

1 – DTSRF

2 –  ETU

3 –  WEED

4 – ETHT

5 – ETHU

6 – PTIR

7 – YOLO

8 – CETH

9 – ETHW

10 – ETHV

Lowest Technical Rated ETFs Per 8/19/2025’s Close:   

1 – ETHD

2 – ETQ

3 – UVIX

4 – HZEN

5 – BOIL

6 – MSTX

7 – AIYY

8 – MSTU

9 – CONI

10 – NVDQ

Highest Volume Rated ETFs Per 8/19/2025’s Close:   

1 – NXTI

2 – NRES

3 – FEUS

4 – HYSD

5 – RSDE

6 – GGUS

7 – FEDM

8 – SAUG

9 – SPC

10 – ASMF

Lowest Volume Rated ETFs Per 8/19/2025’s Close:   

1 – TBFG

2 – NUGO

3 – ZTRE

4 – KJUN

5 – ZTWO

6 – BHYB

7 – SIXH

8 – QTOC

9 – IQSU

10 – USCA

Highest Technical Rated General Stocks Per 8/19/2025’s Close:   

1 – ZEPP

2 – ISTKF

3 – NEGG

4 – HGRAF

5 – ABVX

6 – ANTE

7 – CGTX

8 – IPA

9 – CELC

10 – YYAI

Lowest Technical Rated General Stocks Per 8/19/2025’s Close:   

1 – ORGS

2 – ADD

3 – FLYE

4 – WAI

5 – MYNAY

6 –  PTHL

7 –  GVH

8 – RAYA

9 – HWNID

10 – OST

Highest Volume Rated General Stocks Per 8/19/2025’s Close:   

1 – GXAI

2 – PRFX

3 – DEA

4 – LASE

5 – TLPH

6 – OUT

7 – BINI

8 – CISS

9 – FLNT

10 –  PWM

Lowest Volume Rated General Stocks Per 8/19/2025’s Close:   

1 – RGXTF

2 –  INIS

3 –  PTALF

4 – OMTK

5 – KDOZF

6 – NSFDF

7 – CIAFF

8 – BRWXF

9 – IPDN

10 – SHCAY

*** THE LIST ABOVE IS STRICTLY FOR INFORMATIONAL PURPOSES – I MAY OR MAY NOT HAVE OR INITIATE A LONG, SHORT, OR LONG/SHORT POSITION IN ANY NAME ABOVE AT ANY TIME *** 

Weekly Stock & ETF Market Review 8/10/2025

SPY, the SPDR S&P 500 ETF climbed +2.49% last week, while the VIX closed the week at 15.15, indicating an implied one day move of +/-0.95% & an implied one month move of +/-4.38%.

SPY ETF - SPDR S&P 500 EtF's Technical Performance Over The Past Year
SPY ETF – SPDR S&P 500 ETF’s Technical Performance Over The Past Year

Their RSI is climbing towards the overbought 70 level & is currently at 62.7, while their MACD is bearish, but moving towards the signal line.

Volumes were +13.26% higher than the prior year’s average (68,778,000 vs. 60,725,181), which will be something to look more closely at in the coming weeks as the highest volume session of the week was a decline.

Monday gave us the second highest volume of the week on an advancing day that sparked the brief recovery we’ve seen since Friday’s gap down of the previous week.

SPY was unable to approach the 10 day moving average’s resistance, which is also disappoitng given the volume situation outline before.

Tuesday opened higher & flirted with the 10 DMA’s resistance, but was unable to break out above it & as a result declined on the day.

Wednesday opened slightly higher & made another attempt at the 10 DMA, but again failed to break out above it.

Thursday opened on a gap up above the 10 DMA’s support, but profit takers stepped in, forcing the day temporarily below the 10 DMA, but the highest volume session of the week managed to close in-line with the near-term trend line.

Friday was an interesting way to enter the weekend, as a higher open managed to continue higher throughout the day, resulting in an advance of +0.78% for the day.

Moving into the new week where a lot of emphasis will be placed on the CPI data Tuesday & PPI data set for release on Wednesday, the upside case for SPY remains the same as it has in weeks past.

We’re sitting right below their all-time high, market participants have shown they’re cautiously optimistic here, it’s going to require a great deal of advancing volume to ensure that there is staying power behind the move & that it doesn’t crumble into a giant profit-taking event.

The consolidation case is also similar to what we’ve said & what we’ve been seeing, as SPY has osciallated around the 10 day moving average for the past two weeks.

In the downside case there is Buyer pressure historically from Friday’s closing price down to $624.99/share, where SPY then enters a Sellers zone.

The bottom of that zone brings us to the $619.29/share support level, which has historically been Buyer oriented, but given that the 50 day moving average’s support is also in that zone, if there is souring medium-term outlooks expect to see that break down, leading to $609.59/share as the next support level.

SPY has support at the $632.18 (10 Day Moving Average, Volume Sentiment: Buyers, 1.33:1), $619.29 (Volume Sentiment: Buyers, 1.8:1), $615.51 (50 Day Moving Average, Volume Sentiment: Buyers, 1.5:0*) & $609.59/share (Volume Sentiment: Buyers, 4.8:1) price levels, with resistance at the $639.85/share (ALl-Time High, Volume Sentiment: Sellers, 1.5:1) price levels.

SPY ETF's Price Level:Volume Sentiment For The Past ~3 Years
SPY ETF’s Price Level:Volume Sentiment For The Past ~3 Years

QQQ, the Invesco QQQ Trust ETF advanced +3.73%, as the tech-heavy index had the strongest performance of the major index ETFs.

QQQ ETF - Invesco QQQ Trust ETF's Technical Performance Over The Past Year
QQQ ETF – Invesco QQQ Trust ETF’s Technical Performance Over The Past Year

Their RSI is approaching the overbought 70 level & currently sits at 65.79, while their MACD is bearish but approaching the signal line, with its fate likely going to be determined by Tuesday’s CPI data.

Volumes were +10.86% higher than the prior year’s average levels (43,576,000 vs. 39,307,992), which like SPY’s week featured the highest volume session on a declining day, which shows that there’s cautious optimism in the air.

Monday the week began on a note of recovery, opening in-line with Friday’s open, but climbing throughout the day to be just below the resistance of the 10 day moving average.

Tuesday opened on a gap higher to above the 10 DMA, but profit taking & jitters kicked in, forcing the week’s highest volume & a decline that closed back below the 10 DMA’s resistance, near Monday’s opening level.

Wednesday opened at a similar level to Tuesday’s close, but was able to power higher & break out above the 10 DMA’s resistance, but it should be noted that this occured on the second lowest volume of the week, which may mean that there is a bit of hesitency creeping in here.

Thursday opened on a gap higher, proceeded to test a little higher, before ultimately collapsing to close lower than it opened & the day’s low was supported by the 10 day moving average.

This shows that there is still some faith in the short-term trend, but that there is a less engaged market in terms of participation, if not on account of vacations being taken etc… will expose cracks in the near-term.

Friday confirmed this, as despite setting a new all-time high intraday, QQQ had its lowest volume of the week, showing that there is indeed uncertainty out there.

The upside case is the same as its been for the past few weeks, there will need to be more high volume advancing sessions to force any major sustainable breakout higher in the near-term.

The consolidation case looks much like a continuation of what we saw last week, oscillations around the 10 day moving average as we await an upside or downside catalyst.

To the downside, the historic volume data skewes towards the Buyers for the next ~3.5%, before the $550-554.99/share price zone is entered which has been Seller dominated historically.

Should that break down, the 50 day moving average will be the area to keep an eye on, as if QQQ can’t even force consolidation around it then the next support levels is $539.40.

QQQ has support at the $565.78 (10 Day Moving Average, Volume Sentiment: Buyers, 1.39:1), $551.68 (Volume Sentiment: Sellers, 1.28:1), $547.90 (50 Day Moving Average, Volume Sentiment: Buyers, 1.92:1) & $539.40/share (Volume Sentiment: Buyers, 5.5:1) price levels, with resistance at the $574.63/share (Previous All-Time High, Volume Sentiment: NULL, 0:0*) price levels.

QQQ ETF's Price Level:Volume Sentiment Over The Past ~1 Year
QQQ ETF’s Price Level:Volume Sentiment Over The Past ~1 Year

IWM, the iShares Russell 2000 ETF gained +2.51% for the week, as small cap names outperformed the blue chip members of the Dow.

IWM ETF - iShares Russell 2000 ETF's Technical Performance Over The Past Year
IWM ETF – iShares Russell 2000 ETF’s Technical Performance Over The Past Year

Their RSI is flat in line with the neutral 50 level & sits at 51.06, while their MACD is bearish.

Volumes were +2.41% higher than the prior year’s average (30,976,000 vs. 30,247,068), which signals that folks aren’t jumping at the opportunity to be in the small cap names at these high valuations & that there is some fear in the market.

Monday featured a similar recovery theme for IWM, opening on a gap up to above the 50 & 200 day moving averages, who had just completed a golden cross the day before.

Tuesday featured another gap up open, which retraced lower as profits were taken from the recent price run up which forced IWM to retrace midway through Monday’s candle’s real body, but the small cap index roard back to close for an advance, but it came with a catch.

The first thing of note is that it was unable to break above the resistance of the 10 day moving average & the second was that it resulted in a spinning top & a hanging man candle, the former expressing confusion among market participants & the latter being bearish.

Wednesday also had a troubling aura to the day, as another spinning top candle was produced signaling confusion in the market, and the candle formed a bearish engulfing pattern with Tuesday’s candle, all the while, the 10 day moving average’s resistance did not break down.

Thursday came along with even more bad news, as the gap up open that broke out above the 10 DMA quickly broke down with profit taking, a bearish engulfing pattern emerged day-over-day(-over-day), and the week’s highest volume session showed that market participants think that IWM belongs lower, as noted by the lower shadow on the day’s candle.

Friday also flashed warning lights, as the session opened above the 10 day moving average, but broke down to close lower than the day’s open & below the 10 DMA’s resistance, effectively forming a bearish harami pattern & indicating that there is an extreme lack of confidence in IWM & small caps at the moment.

The upside case here will likely hinge upon what the other major indexes do, as with valuations where they are on many companies & markets at these high levels, there is unlikely to be much demand for small caps in the near-term.

The $225.37 & $226-226.99 resistance zone will be the primary places to watch in the event of any upside movement, as they are the gatekeepers.

The consolidation case looks a lot like what we’ve been seing since mid-July where IWM oscillates around the 10 day moving average awaiting the upside or downside catalyst that causes it to break in a direction.

To the downside, assuming that the strength of support from the 200 & 50 day moving averages breaks down the $212.90/share level is going to be the top area of interest, as it is in a historically Seller-oriented price zone, and if it is unable to hold up will cause further declines as death crosses emerge from the moving averages above.

IWM has support at the $219.93 (Volume Sentiment: Buyers, 1.07:1), $219.57 (Volume Sentiment: Buyers, 1.07:1), $216.91 (Volume Sentiment: Buyers, 1.07:1) & $216.80/share (50 Day Moving Average, Volume Sentiment: Buyers, 1.07:1) price levels, with resistance at the $220.40 (10 Day Moving Average, Volume Sentiment: Buyers, 1.87:1), $222,40 (Volume Sentiment: Buyers, 1.87:1), $222.84 (Volume Sentiment: Buyers, 1.87:1) & $224.60/share (Volume Sentiment: Buyers, 1.06:1) price levels.

IWM ETF's Price Level:Volume Sentiment Over The Past ~2 Years
IWM ETF’s Price Level:Volume Sentiment Over The Past ~2 Years

DIA, the SPDR Dow Jones Industrial Average ETF added +1.42%, faring the worst off the major index ETFs for the week.

DIA ETF - SPDR Dow Jones Industrial Average ETF's Technical Performance Over The Past Year
DIA ETF – SPDR Dow Jones Industrial Average ETF’s Technical Performance Over The Past Year

Their RSI has been straddling the neutral 50 level, currently sitting at 51.33, while their MACD is still bearish & declining.

Volumes were +31.38% higher than the prior year’s average (4,204,000 vs. 3,199,960), but like the others above, the highest volume came on a declining day.

Monday featured a recovering advancing session following the Friday before’s gap down on the week’s highest volume.

Profits were taken Tuesday & uncertainty filled the air when the declining session resulted in a spinning top candle.

Wednesday added to the confusion with a doji candle that closed +0.19% higher for the day.

Thursday opened optistically on a gap up to above the 10 day moving average, but profits were promptly taken, forcing DIA back below the 10 DMA & indicating that there was further downside appetite on the week’s highest volume session & a bearish engulfing pattern was formed.

Friday indecision remained, as DIA opened higher, tested higher but was unable to break above the 10 day moving average, and a spinning top candle was formed.

While a bullish harami was also formed, the resistance of the 10 day moving average adds skepticism about the power of the sentiment behind it.

Heading into the new week, the upside case will rely upon the 10 day moving average breaking as a resistance level, which it did briefly last week, but has been unable to for weeks.

Once that happens, the $446.554-446.82 level will be interesting, as that little resistance zone is the gatekeeper to the all-time high price level.

The consolidation case remains unchanged & looks like the 10 day moving average being oscillated about while we await news to the upside or downside.

To the downside, the $439.66 level will be important to watch, for if it breaks down it looks likely that the 50 day moving average’s support also will too.

If the $433.40/share level doesn’t hold up, then the retest of the $430.10/share level will be interesting as it resides in a Seller dominated zone & is only 1% above another Seller dominated zone, which could lead to further declines.

DIA has support at the $439.66 (Volume Sentiment: Buyers, 1.6:1), $436.28 (50 Day Moving Average, Volume Sentiment: Buyers, 1.6:1), $433.40 (Volume Sentiment: Buyers, 1.88:1) & $430.10/share (Volume Sentiment: Sellers, 1.22:1) price levels, with resistance at the $442.32 (10 Day Moving Average, Volume Sentiment: Buyers, 2.73:1), $446.54 (Volume Sentiment: Buyers, 2.73:1), $446.82 (Volume Sentiment: Buyers, 2.73:1) & $450.25/share (All-Time High, Volume Sentiment: Buyers, 9:1) price levels.

DIA ETF's Price Level:Volume Sentiment Over The Past ~3 Years
DIA ETF’s Price Level:Volume Sentiment Over The Past ~3 Years

The Week Ahead

Monday is quiet on the economic news front.

AAON, Barrick Mining, Ceva, Dole PLC, Excelerate Energy, Franco-Nevada, Green Plains, Kymera Therapuetics, Legend BioTech, Owens & Minor, Roivant Sciences, Rumble & Telephone & Data all report earnings before Monday’s opening bell, before AMC Entertainment, ACV Auctions, BigBear.ai, Cannae Holdings, Celanese, Compass Minerals, Fluence, Forward Air, Getty Images, Green Dot, HighPeak Energy, Hillenbrand, Macerich, Mercury, MeridianLink, Oklo Inc., PubMatic, Repay Holdings, Xenon Pharmaceuticals & ZipRecruiter report after the closing bell.

NFIB Optimism Index data is released Tuesday at 6 am, followed by Consumer Price Index, CPI Year-over-Year, Core CPI & Core CPI Year-Over-Year data at 8:30 am, Fed President Schmid speaking at 10 am & Monthly US Federal Budget data at 2pm.

Tuesday morning opens with Cardinal Health, Circle Internet Group, eToro Group, HUYA, MSG Sports, On Holding, Paysafe, Sea Ltd., Smithfield Foods, Tech target & Tencent Music’s earnings calls before the session’s open, with Alcon, CAE, CAVA Group, CoreWeave, Everus, H&R Block, Intapp, KinderCare Learning Companies, Lumentum, Luminar Technologies & WEBTOON Entertainment report after the closing bell.

Wednesday features Fed President Bostic speaking at 12:30 pm.

Arcos Dorados, Brinker International, Global-E Online, Hudbay Minerals, Loar Holdings, Marex Group, Performance Food Group, Sapiens International & Stratasys report earnings before Wednesday’s open, with Cisco Systems, Coherent, dLocal Limited, Equinox Gold, Ibotta & Standard Aero reporting after the session’s close.

Initial Jobless Claims, Producer Price Index, Core PPI, PPI Year-over-Year & Core PPI Year-over-Year data are all released Thursday at 8:30 am, before Fefd President Barkin speaks at 2 pm.

Thursday morning features earnings from Advance Auto Parts, Amcor, Applied Industrial, Birkenstock Holding, Cellebrite DI, Deere, First Majestic Silver, JD.com, NICE, Tapestry, VIPShop & Weibo, followed by Applied Materials, Gambling.com Group, Globant, Sandisk & Starz Entertainment after the session’s close.

Friday opens with U.S. Retail Sales, Retail Sales Minus Autos, Empire State Manufacturing Survey, Import Price Index & Import Price Index Minus Fuel at 8:30 am, before Industrial Production & Capacity Utilization data at 9:15 am & Business Inventories & Consumer Sentiment (prelim) data at 10 am.

Flower Foods reports earnings before Friday’s opening bell.

See you back here next week!

*** I DO NOT OWN SHARES OR OPTIONS CONTRACT POSITIONS IN SPY, QQQ, IWM OR DIA AT THE TIME OF PUBLISHING THIS ARTICLE ***

Daily VolTech Stock & ETF Volume & Technical Ratings 7/15/2025

The VIX closed at 17.38, indicating an implied one day move of +/-1.1% & an implied one month move of +/-5.02% for the S&P 500.  

Highest Technical Rated S&P 500 Components Per 7/15/2025’s Close:  

1 –  COIN

2 –  PLTR

3 –  GEV

4 –  TPR

5 –  RCL

6 –  STX

7 –  SMCI

8 –  JBL

9 –  ORCL

10 –  WDC

Lowest Technical Rated S&P 500 Components Per 7/15/2025’s Close:  

1 –  CNC

2 –  MOH

3 –  DECK

4 –  UNH

5 –  LULU

6 –  ENPH

7 –  FICO

8 –  PCG

9 –  CAG

10 –  WAT

Highest Volume Rated S&P 500 Components Per 7/15/2025’s Close:  

1 –  PPL

2 –  WAT

3 –  ANSS

4 –  BLK

5 –  WFC

6 –  STT

7 –  CPRT

8 –  C

9 –  HSIC

10 –  OXY

Lowest Volume Rated S&P 500 Components Per 7/15/2025’s Close:  

1 –  WBA

2 –  VTRS

3 –  LVS

4 –  COP

5 –  AKAM

6 –  AZO

7 –  NTAP

8 –  NKE

9 –  XYL

10 –  TRGP

Highest Technical Rated ETFs Per 7/15/2025’s Close:  

1 –  PTIR

2 –  CONL

3 –  GXLM

4 –  KORU

5 –  RKLX

6 –  DFEN

7 –  AMDL

8 –  NVDL

9 –  AVGX

10 –  TARK

Lowest Technical Rated ETFs Per 7/15/2025’s Close:  

1 –  CONI

2 –  MSTZ

3 –  SMST

4 –  ETHD

5 –  HZEN

6 –  FIAT

7 –  NVDQ

8 –  NVD

9 –  SOXS

10 –  SSG

Highest Volume Rated ETFs Per 7/15/2025’s Close:  

1 –  VLLU

2 –  SHUS

3 –  GEND

4 –  BHYB

5 –  XVOL

6 –  LLDR

7 –  PSMD

8 –  CCNR

9 –  GDMA

10 –  TXUG

Lowest Volume Rated ETFs Per 7/15/2025’s Close:  

1 –  FCSH

2 –  SIXD

3 –  FHDG

4 –  IGPT

5 –  OGSP

6 –  TAFL

7 –  AFSC

8 –  TBJL

9 –  SIXZ

10 –  UJB

Highest Technical Rated General Stocks Per 7/15/2025’s Close:  

1 –  BIOCQ

2 –  ZEPP

3 –  SONN

4 –  SRM

5 –  SY

6 –  INKT

7 –  ONXGF

8 –  SDCH

9 –  ABVC

10 –  IPA

Lowest Technical Rated General Stocks Per 7/15/2025’s Close:  

1 – MULN

2 – GIBO 

3 –  LIANY

4 –  WAI

5 –  SMX

6 –  BCTX

7 –  OST

8 –  NIVF

9 –  VCIG

10 – XXII 

Highest Volume Rated General Stocks Per 7/15/2025’s Close:  

1 –  XAGE

2 –  KAPA

3 –  DEA

4 –  CYCC

5 –  SMX

6 –  PLRZ

7 –  CELU

8 –  NTZ

9 –  VRAR

10 –  GRO

Lowest Volume Rated General Stocks Per 7/15/2025’s Close:  

1 –  CAPC

2 –  AHOTF

3 –  SEOVF

4 –  CIAFF

5 –  LITOF

6 –  KPEA

7 –  ELWS

8 –  TOFB

9 –  ENZB

10 –  ORAAF

*** THE LIST ABOVE IS STRICTLY FOR INFORMATIONAL PURPOSES – I MAY OR MAY NOT HAVE OR INITIATE A LONG, SHORT, OR LONG/SHORT POSITION IN ANY NAME ABOVE AT ANY TIME *** 

Daily VolTech Stock & ETF Volume & Technical Ratings 2/12/2025

The VIX closed at 15.89, indicating an implied one day move of +/-1.00% & an implied one month move of +/-4.59% for the S&P 500.

Highest Technical Rated S&P 500 Components Per 2/12/2025’s Close:

1 – PLTR

2 – TPR

3 – AXON

4 – FFIV

5 – UAL

6 – RL

7 – GEV

8 – VST

9 – EXPE

10 – FTNT

Lowest Technical Rated S&P 500 Components Per 2/12/2025’s Close:

1 – MRNA

2 – FMC

3 – SWKS

4 – AES

5 – STZ

6 – EIX

7 – CE

8 – ENPH

9 – HII

10 – BIIB

Highest Volume Rated S&P 500 Components Per 2/12/2025’s Close:

1 – SCHW

2 – WAB

3 – GNRC

4 – MLM

5 – FOX

6 – FIS

7 – ZBRA

8 – CVS

9 – CF

10 – DFS

Lowest Volume Rated S&P 500 Components Per 2/12/2025’s Close:

1 – KLAC

2 – CEG

3 – MNST

4 – MMM

5 – MPWR

6 – SOLV

7 – AZO

8 – STT

9 – GEV

10 – AVGO

Highest Technical Rated ETFs Per 2/12/2025’s Close:

1 – BABX

2 – FBL

3 – PTIR

4 – WEBL

5 – YINN

6 – PSIL

7 – SKYU

8 – XPP

9 – TARK

10 – NUKZ

Lowest Technical Rated ETFs Per 2/12/2025’s Close:

1 – MSOX

2 – MRNY

3 – YANG

4 – BCHG

5 – KOLD

6 – CNBS

7 – AMDL

8 – SARK

9 – SBIT

10 – ZCSH

Highest Volume Rated ETFs Per 2/12/2025’s Close:

1 – TOAK

2 – CCNR

3 – HIDV

4 – JEMB

5 – FDNI

6 – INRO

7 – PP

8 – EZM

9 – AUGP

10 – TSEP

Lowest Volume Rated ETFs Per 2/12/2025’s Close:

1 – USCA

2 – BBEM

3 – TALF

4 – TSEC

5 – SIXP

6 – DYNI

7 – UJB

8 – MINV

9 – AGRH

10 – JMID

Highest Technical Rated General Stocks Per 2/12/2025’s Close:

1 – BBAI

2 – SOPA

3 – DOMH

4 – AIFF

5 – YOSH

6 – WLGS

7 – MNPR

8 – GRRR

9 – RPID

10 – LTBR

Lowest Technical Rated General Stocks Per 2/12/2025’s Close:

1 – CLEU

2 – FTEL

3 – GCTK

4 – CYN

5 – UPC

6 – VLCN

7 – ACON

8 – MBRX

9 – CRKN

10 – PLRX

Highest Volume Rated General Stocks Per 2/12/2025’s Close:

1 – KDLY

2 – TIVC

3 – XLO

4 – NKGN

5 – IMBBF

6 – APTO

7 – MAMA

8 – MYNA

9 – WISA

10 – TCBC

Lowest Volume Rated General Stocks Per 2/12/2025’s Close:

1 – RGXTF

2 – SBIG

3 – CYTOF

4 – OIIF

5 – EUBG

6 – GLBXF

7 – GECSF

8 – IFNNF

9 – NFUNF

10 – VHIBF

*** THE LIST ABOVE IS STRICTLY FOR INFORMATIONAL PURPOSES – I MAY OR MAY NOT HAVE OR INITIATE A LONG, SHORT, OR LONG/SHORT POSITION IN ANY NAME ABOVE AT ANY TIME ***

Daily VolTech – Stock & ETF Volume & Technical Ratings 7/1/2024

Highest Technical Rating S&P 500 Components As Of 6/28/2024’s Close:

1 – NVDA

2 – VST

3 – ANET

4 – CRWD

5 – TER

6 – NTAP

7 – AVGO

8 – LLY

9 – CCL

10 – MPWR

Lowest Technical Rating S&P 500 Components As Of 6/28/2024’s Close:

1 – FRCB

2 – WBA

3 – NKE

4 – ALB

5 – PAYC

6 – EL

7 – LULU

8 – DAY

9 – EPAM

10 – POOL

Highest Volume Rating S&P 500 Components As Of 6/28/2024’s Close:

1 – NKE

2 – CTAS

3 – MRK

4 – VLTO

5 – CPRT

6 – CHD

7 – TDG

8 – UNH

9 – TT

10 – MTD

Lowest Volume Rating S&P 500 Components As Of 6/28/2024’s Close:

1 – STX

2 – NVDA

3 – UAL

4 – FCX

5 – HPE

6 – AON

7 – PARA

8 – AAL

9 – BA

10 – PFE

Highest Technical Rating ETFs As Of 6/28/2024’s Close:

1 – NVDL

2 – USD

3 – SOXL

4 – WGMI

5 – FNGG

6 – TECL

7 – BCHG

8 – TQQQ

9 – DAPP

10 – CRPT

Lowest Technical Rating ETFs As Of 6/28/2024’s Close:

1 – NVD

2 – SSG

3 – NVDS

4 – UVIX

5 – SOXS

6 – MSOX

7 – EVAV

8 – MEXX

9 – BOIL

10 – UVXY

Highest Volume Rating ETFs As Of 6/28/2024’s Close:

1 – USCL

2 – JULW

3 – JULT

4 – JULQ

5 – FEBT

6 – NUGO

7 – MKOR

8 – XTAP

9 – MARZ

10 – SIXJ

Lowest Volume Rating ETFs As Of 6/28/2024’s Close:

1 – EIDO

2 – TMSL

3 – SHOC

4 – RFEU

5 – UCYB

6 – VRAI

7 – CGGO

8 – VMBS

9 – PFM

10 – LEXI

Highest Technical Rating Stocks As Of 6/28/2024’s Close:

1 – FCCN

2 – FTEL

3 – RGS

4 – MDIA

5 – LSF

6 – TSSI

7 – ASTS

8 – MLGO

9 – INSG

10 – AGRX

Lowest Technical Rating Stocks As Of 6/28/2024’s Close:

1 – AVTE

2 – TRNR

3 – NAAS

4 – CNSP

5 – VLCN

6 – GWAV

7 – BNED

8 – GRI

9 – DSY

10 – CRKN

Highest Volume Stocks As Of 6/28/2024’s Close:

1 – COSM

2 – WHLR

3 – CARM

4 – CMND

5 – STRW

6 – LNKB

7 – PEBK

8 – CDT

9 – CTV

10 – LZM

Lowest Volume Rating Stocks As Of 6/28/2024’s Close:

1 – PRI

2 – EVH

3 – RSVR

4 – MMSI

5 – RXRX

6 – SQSP

7 – LTH

8 – BOKF

9 – PCVX

10 – ANSS

*** THE LIST ABOVE IS STRICTLY FOR INFORMATIONAL PURPOSES – I MAY OR MAY NOT HAVE OR INITIATE A LONG, SHORT, OR LONG/SHORT POSITION IN ANY NAME ABOVE AT ANY TIME ***