The VIX closed at 17.82, indicating an implied one day move of +/-1.12% & an implied one month move of +/-5.15% for the S&P 500.
Highest Technical Rated S&P 500 Components Per 1/7/2025’s Close:
1 – PLTR
2 – UAL
3 – VST
4 – TSLA
5 – TPR
6 – AVGO
7 – TPL
8 – ANET
9 – RL
10 – AXON
Lowest Technical Rated S&P 500 Components Per 1/7/2025’s Close:
1 – CE
2 – SMCI
3 – MCHP
4 – DG
5 – MRNA
6 – INTC
7 – LW
8 – LEN
9 – DOW
10 – CVS
Highest Volume Rated S&P 500 Components Per 1/7/2025’s Close:
1 – MRNA
2 – MU
3 – CPT
4 – IR
5 – CTAS
6 – ULTA
7 – SCHW
8 – TRMB
9 – FMC
10 – VZ
Lowest Volume Rated S&P 500 Components Per 1/7/2025’s Close:
1 – AME
2 – SMCI
3 – MOH
4 – BG
5 – HUM
6 – DLTR
7 – GPN
8 – WAT
9 – CI
10 – EW
Highest Technical Rated ETFs Per 1/7/2025’s Close:
1 – TSLR
2 – TSLT
3 – TSLL
4 – EVAV
5 – TSL
6 – BITW
7 – GXLM
8 – BTFX
9 – ARGT
10 – QTUM
Lowest Technical Rated ETFs Per 1/7/2025’s Close:
1 – MSOX
2 – TSLZ
3 – TSDD
4 – TSLQ
5 – CNBS
6 – SARK
7 – NVD
8 – TSLS
9 – NVDQ
10 – BTOP
Highest Volume Rated ETFs Per 1/7/2025’s Close:
1 – STAX
2 – PBFB
3 – CATH
4 – OVL
5 – OVLH
6 – JULM
7 – IQDE
8 – LCLG
9 – EFU
10 – JDVI
Lowest Volume Rated ETFs Per 1/7/2025’s Close:
1 – USCA
2 – SEPT
3 – AUGT
4 – MDCP
5 – PABU
6 – QMAG
7 – WBND
8 – ZTWO
9 – SEPW
10 – XJAN
Highest Technical Rated General Stocks Per 1/7/2025’s Close:
1 – QNCCF
2 – RGTI
3 – DATS
4 – LAES
5 – OPTT
6 – QUBT
7 – KULR
8 – FUBO
9 – QBTS
10 – CTM
Lowest Technical Rated General Stocks Per 1/7/2025’s Close:
1 – AILEQ
2 – RNWEY
3 – RAASY
4 – GCTK
5 – AEON
6 – GOEV
7 – EFSH
8 – NMRA
9 – ADD
10 – MULN
Highest Volume Rated General Stocks Per 1/7/2025’s Close:
1 – MSAI
2 – DATS
3 – HOTH
4 – SYRA
5 – MSN
6 – TYGO
7 – SPI
8 – GETY
9 – IMRX
10 – MDIA
Lowest Volume Rated General Stocks Per 1/7/2025’s Close:
1 – XTIA
2 – BNPQF
3 – ORRCF
4 – QTRHF
5 – STLRF
6 – CNTGF
7 – MSCLF
8 – ISCO
9 – INBP
10 – DMXCF
*** THE LIST ABOVE IS STRICTLY FOR INFORMATIONAL PURPOSES – I MAY OR MAY NOT HAVE OR INITIATE A LONG, SHORT, OR LONG/SHORT POSITION IN ANY NAME ABOVE AT ANY TIME ***
The VIX closed at 16.04, indicating an implied one day move of +/-1.01% & an implied one month move of +/-4.64% for the S&P 500.
Highest Technical Rated S&P 500 Components Per 1/6/2025’s Close:
1 – PLTR
2 – TSLA
3 – VST
4 – UAL
5 – AVGO
6 – TPR
7 – ANET
8 – AXON
9 – RL
10 – FTNT
Lowest Technical Rated S&P 500 Components Per 1/6/2025’s Close:
1 – CE
2 – MRNA
3 – MCHP
4 – INTC
5 – DG
6 – REGN
7 – CVS
8 – ENPH
9 – NUE
10 – DOW
Highest Volume Rated S&P 500 Components Per 1/6/2025’s Close:
1 – VICI
2 – NVR
3 – KIM
4 – ALL
5 – VRSN
6 – AXON
7 – MU
8 – TER
9 – FCX
10 – DECK
Lowest Volume Rated S&P 500 Components Per 1/6/2025’s Close:
1 – WDAY
2 – CMS
3 – APO
4 – BG
5 – TPL
6 – MOH
7 – ERIE
8 – SYY
9 – DOV
10 – KEYS
Highest Technical Rated ETFs Per 1/6/2025’s Close:
1 – TSLR
2 – TSLT
3 – TSLL
4 – EVAV
5 – GXLM
6 – TSL
7 – BTFX
8 – BITW
9 – BITX
10 – DTSRF
Lowest Technical Rated ETFs Per 1/6/2025’s Close:
1 – TSLZ
2 – TSDD
3 – TSLQ
4 – MSOX
5 – NVD
6 – CNBS
7 – NVDQ
8 – SARK
9 – TSLS
10 – NVDS
Highest Volume Rated ETFs Per 1/6/2025’s Close:
1 – XHYC
2 – HAPR
3 – LAPR
4 – MART
5 – USNZ
6 – PSCX
7 – OAEM
8 – XPND
9 – PWER
10 – MAYP
Lowest Volume Rated ETFs Per 1/6/2025’s Close:
1 – PSCQ
2 – USCA
3 – ZTWO
4 – AUGM
5 -AUGW
6 – GVUS
7 – ZTEN
8 – PSMO
9 – ABHY
10 – EEMO
Highest Technical Rated General Stocks Per 1/6/2025’s Close:
1 – SEVCF
2 – IDAI
3 – BBIG
4 – QNCCF
5 – RGTI
6 – OPTT
7 – LAES
8 – QUBT
9 – NITO
10 – CTM
Lowest Technical Rated General Stocks Per 1/6/2025’s Close:
1 – AILEQ
2 – EFSH
3 – AEON
4 – GOEV
5 – GCTK
6 – NMRA
7 – SOBR
8 – CRKN
9 – LICN
10 – ADD
Highest Volume Rated General Stocks Per 1/6/2025’s Close:
1 – BOXL
2 – RHE
3 – JOB
4 – GDTC
5 – AEON
6 – ARBE
7 – POAI
8 – NAOV
9 – MEGL
10 – MAMA
Lowest Volume Rated General Stocks Per 1/6/2025’s Close:
1 – RDEXF
2 – CTXXF
3 – NROM
4 – MTLFF
5 – GENMF
6 – PLSDF
7 – DXYN
8 – SABK
9 – CCWOF
10 – ARBV
*** THE LIST ABOVE IS STRICTLY FOR INFORMATIONAL PURPOSES – I MAY OR MAY NOT HAVE OR INITIATE A LONG, SHORT, OR LONG/SHORT POSITION IN ANY NAME ABOVE AT ANY TIME ***
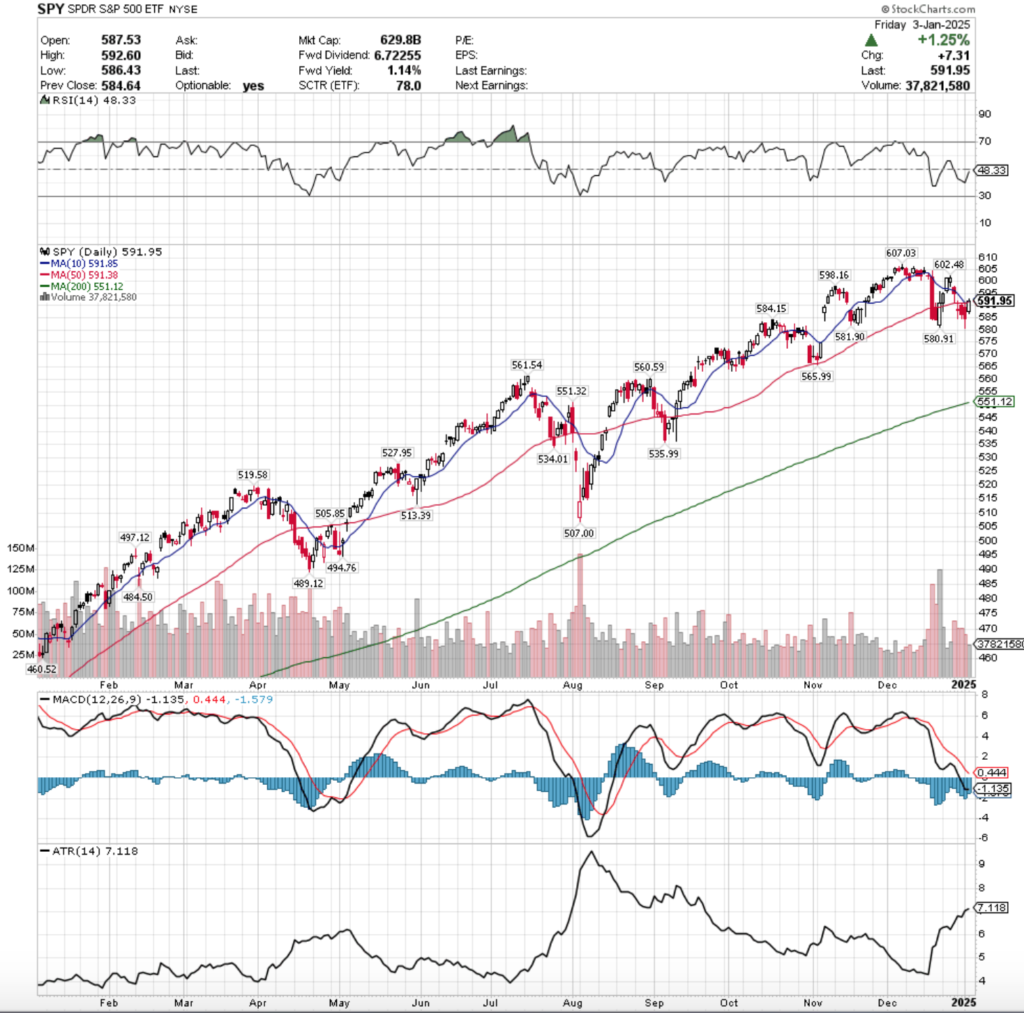
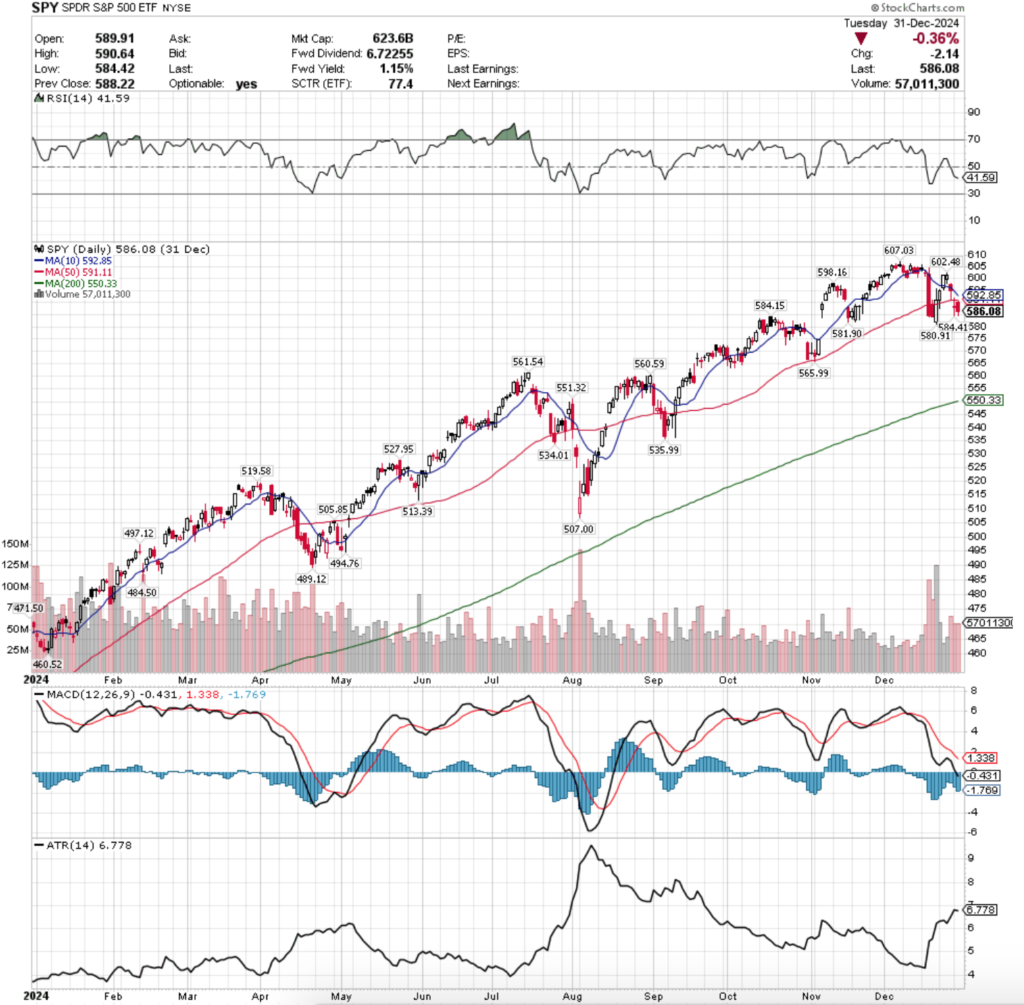
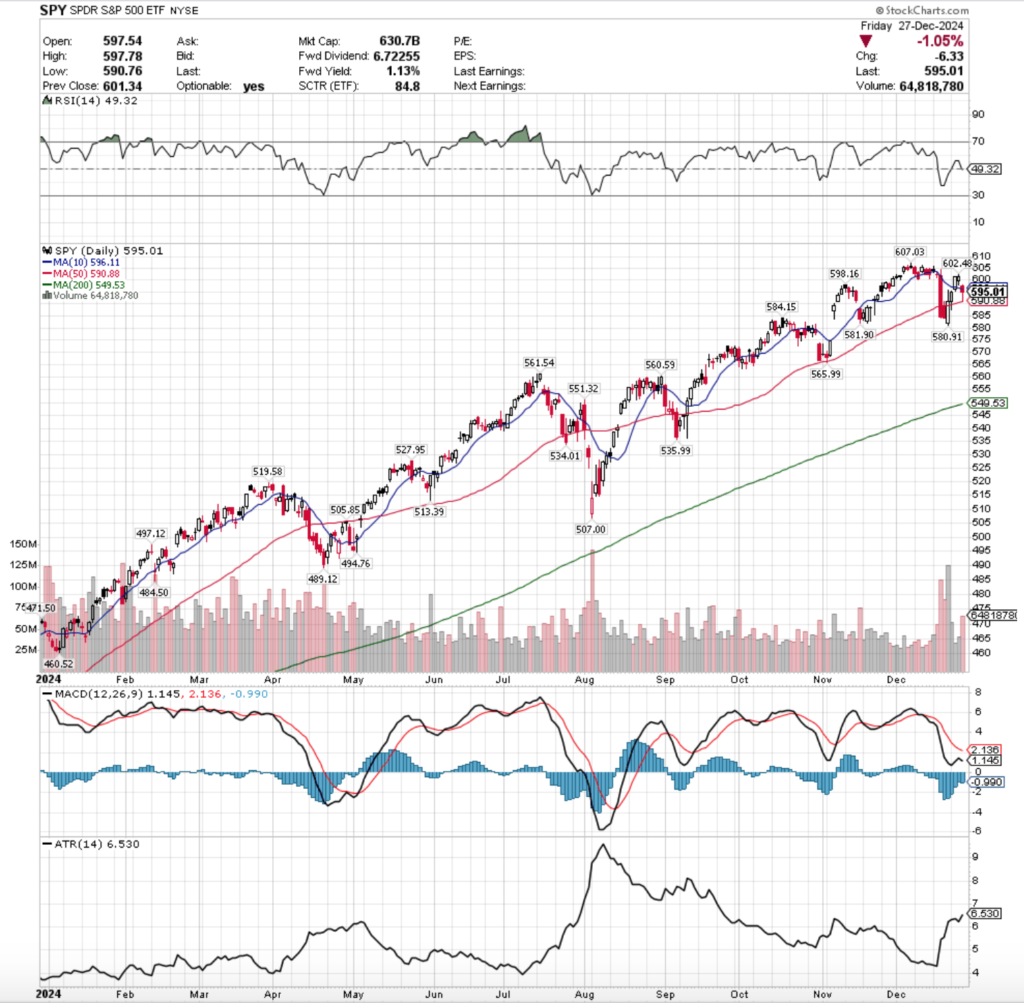
SPY, the SPDR S&P 500 ETF dipped -0.51% on a short holiday week last week, while the VIX closed the week at 16.13, indicating an implied one day move of +/-1.02% & a one month implied move of +/-4.66%.
SPY ETF – SPDR S&P 500 ETF’s Technical Performance Over The Past Year
Their RSI is trending up back towards the neutral 50 mark & sits currently at 48.33 after Friday’s bullish session, while their MACD remains bearish.
Volumes were -11.6% below the prior year’s average (50.430.000 vs. 57,050,198), which should be cause for concern given how low they’ve been in the previous months when prices were advancing & this week was short & a declining week.
This becomes even more concerning when you factor in that Friday’s session was +1.25% & was the only advancing session of the week.
Monday started the week off on a sour note, as an opening gap down led to a high wave candle on high declining volume for the week.
While the session managed to temporarily break out above the 50 day moving average’s resistance, it was unable to close near it & resulted in a doji candle, setting the stage for a week of further declines.
Tuesday managed to open higher than Monday’s close, but again market participants were in a selling mood & the day resulted in a bearish engulfing candle pattern that was unable to break above the 50 DMA’s resistance.
Wednesday the market was closed for New Years day, but the selling continued on Friday, as the third highest volume session of the week brought on further declines.
Thursday’s session also tried to test the 50 DMA unsuccessfully, and the lower shadow on the candlestick indicates that there is still downside appetite from where the week closed up.
Friday was the only advancing session of the week & the only reason that the weekly losses were pared to the level that they were, as prices closed just above the 10 & 50 day moving averages.
Monday will be important to watch to see if SPY dips back below their 10 & 50 DMAs, which will be crossing over bearishly either on Monday or Tuesday.
Based on last week’s outflows it seems unlikely that they will remain above these levels, particularly given how Friday’s advancing session had the week’s lowest volume.
It’s also worth noting that volumes were much stronger than they’ve been since April 19,2024, which is not a good thing given that the week resulted in a decline & should’ve been worse had Friday not staged the recovery that it did.
Another thing to note is that the window created by the post-election gap up still has not been completely filled, which adds another bit of negativity to the mix when thinking about where SPY is headed next.
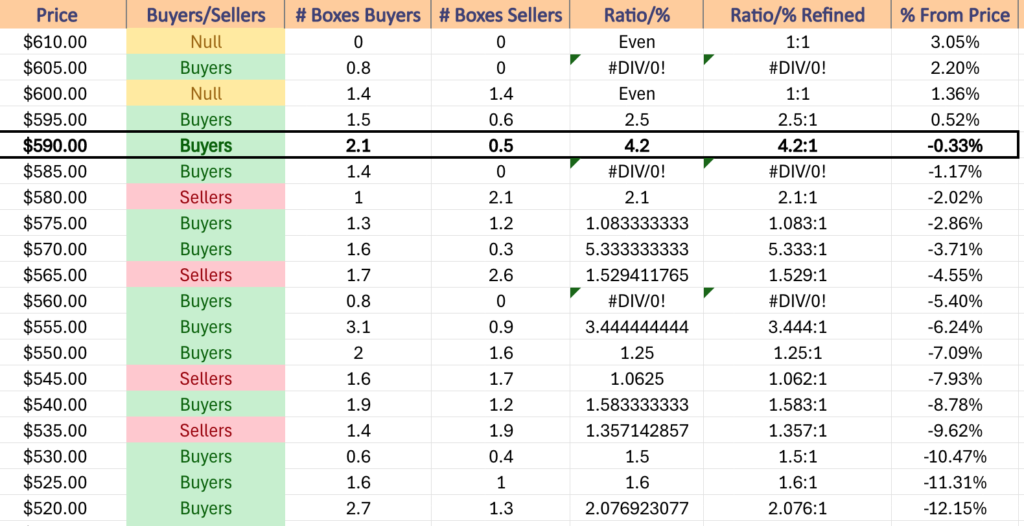
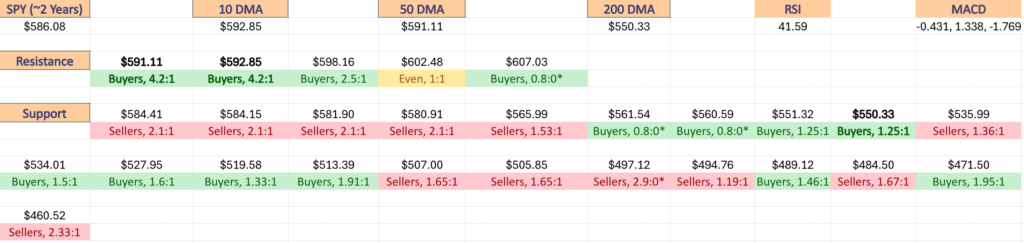
The beginning of this week will focus on whether or not the 10 & 50 DMAs can hold up as support levels, as SPY is barely above them from a price perspective, but they have a history of being Buyer dominated 4.2:1 over the past ~2 years.
In the event of a breakdown, the next three support levels fall in a zone that has been dominated by the Sellers 2:1 over that time period, which indicates that there is selling pressure all the way down to $579.99/share.
Should this breakdown occur there’s no support until $565.99, which is in a Seller dominated zone 1.53:1, before entering a relatively untested Buyer dominated zone in the $560-564.99/share range.
That would be a -5.4% decline from Friday’s closing price, which in a shortened four day week in observance of President Carter’s death is likely a stretch.
There isn’t much data or earnings this week that would inspire much of an upwards move, unless the December FOMC minutes come in with a massively dovish tone & the recent volumes do not indicate that market participants will be overly eager to jump back into the pool.
SPY has support at the $591.85 (10 Day Moving Average, Volume Sentiment: Buyers, 4.2:1), $591.38 (50 Day Moving Average, Volume Sentiment: Buyers, 4.2:1), $584.15 (Volume Sentiment: Sellers, 2:1) & $581.90/share (Volume Sentiment: Sellers, 2:1) price levels, with resistance at the $598.16 (Volume Sentiment: Buyers, 2.5:1), $602.48 (Volume Sentiment: Even, 1:1) & $607.03/share (All-Time High, Volume Sentiment: Buyers, 0.8:0*) price levels.
SPY ETF’s Price Level:Volume Sentiment Over The Past ~2 Years
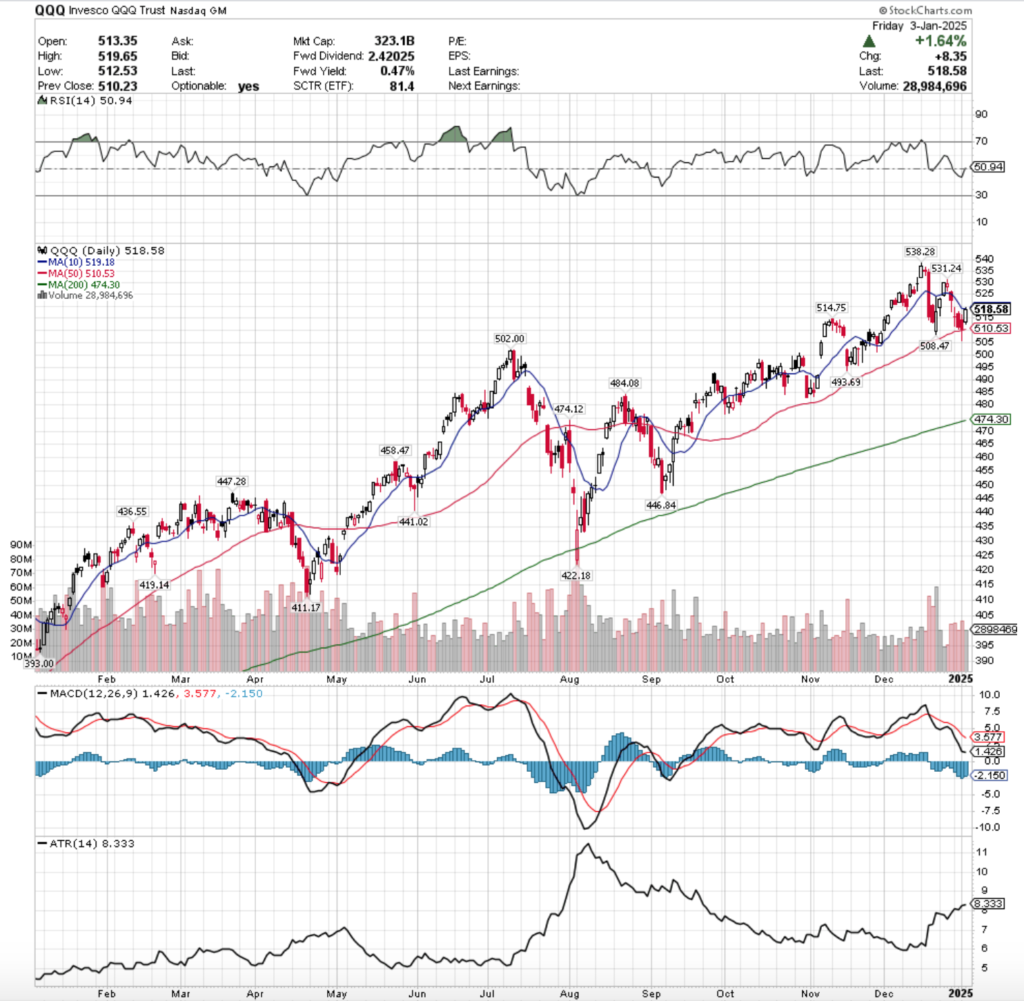
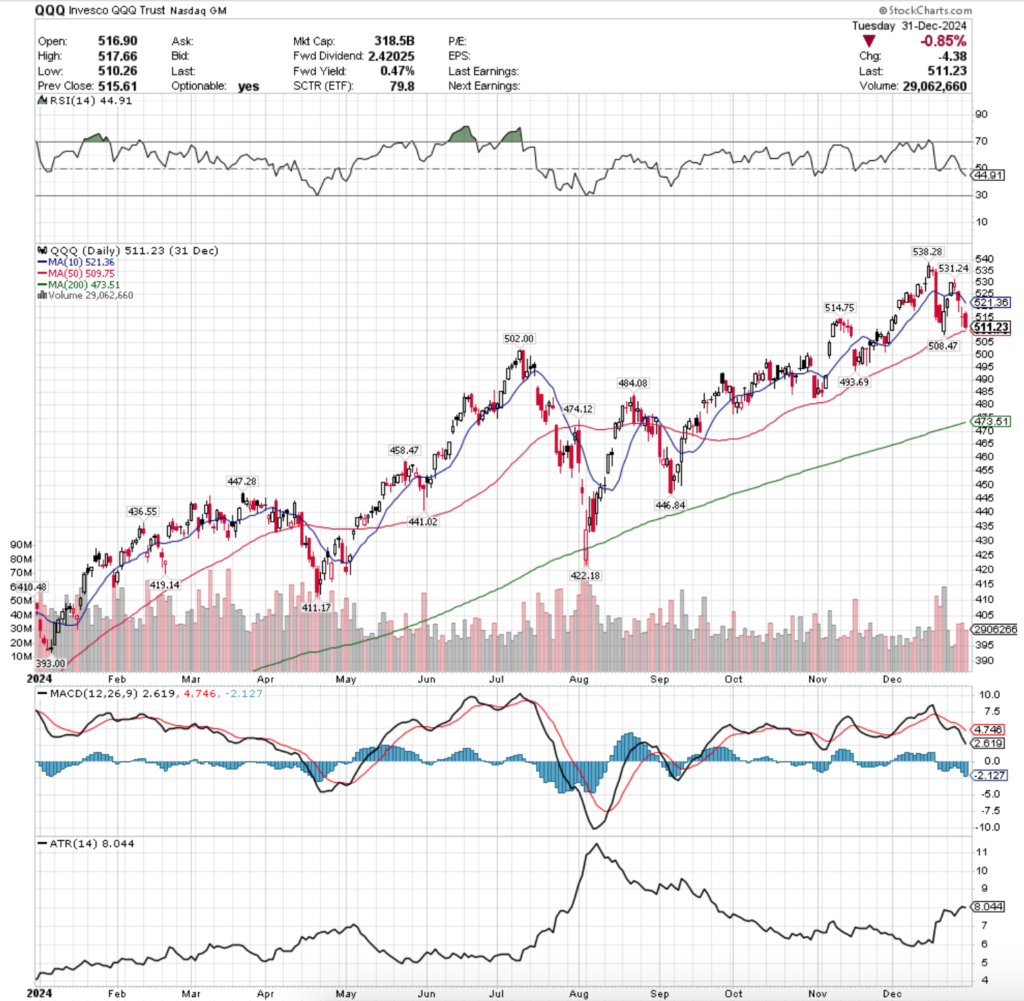
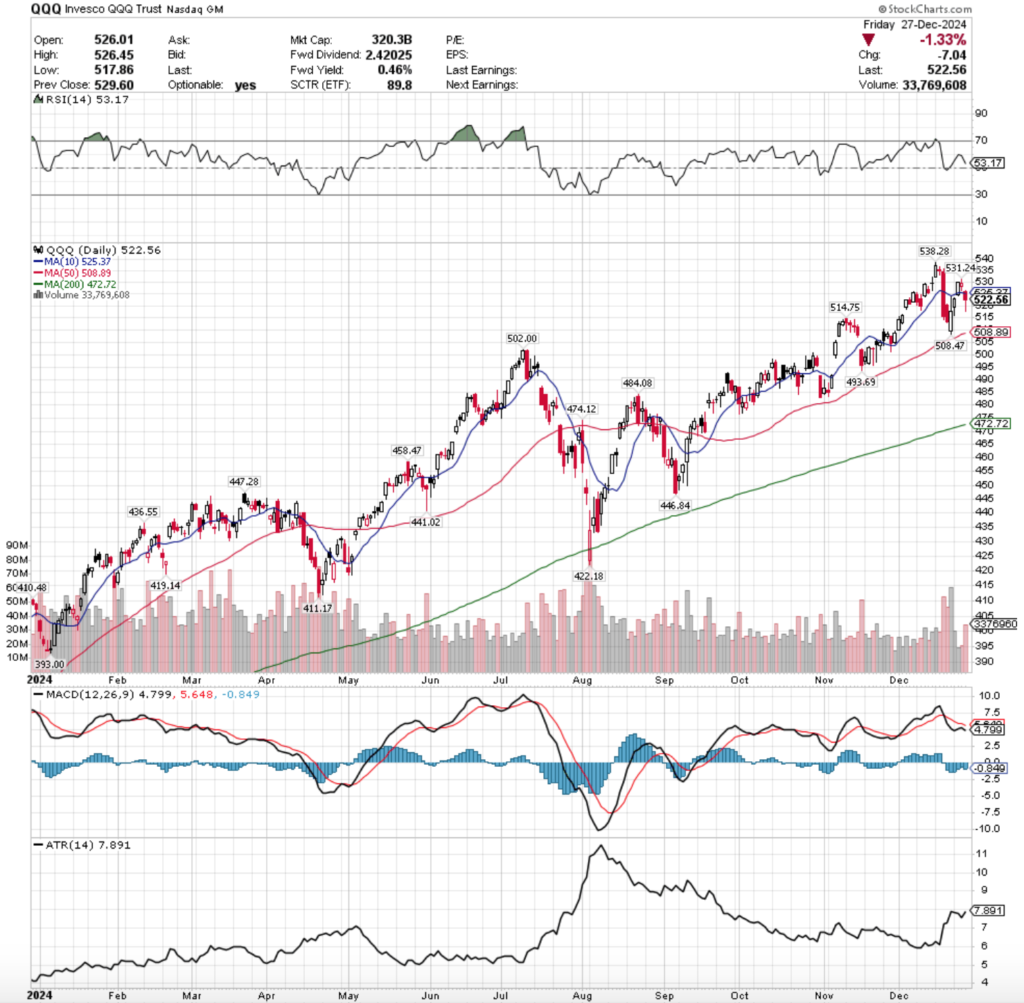
QQQ ETF – Invesco QQQ Trust ETF’s Technical Performance Over The Past Year
Their RSI just broke north through the neutral level & sits at 50.94 after Friday’s session, while their MACD remains bearish.
Volumes were -12.73% lower than the previous year’s average (32,287,500 vs. 36,996,008), which like SPY’s is troubling considering how much lower than average they’d been for the prior 8-9 months while QQQ was advancing.
QQQ opened the week up on a similar foot as SPY, gapping down & resulting in a high wave candle that closed in line with its open, indicating that there was quite a bit of uncertainty among market participants.
Volumes were solid Monday & that participation rolled into Tuesday, when QQQ opened higher, but slid lower throughout the day to close out for a loss just above the 50 day moving average’s support.
Thursday continued the trend of weakness, as the day opened midway through Tuesday’s range, before declining & temporarily breaking down through the 50 DMA’s support, but managed to close in-line with it.
Friday the bulls came out to play, although in low numbers as the volume wasn’t spectacular in the wake of the declines of the prior six sessions, and QQQ ended the week just below its 10 day moving average’s resistance.
This coming week will focus on whether or not QQQ can find enough buyers to come out & continue to push prices higher.
Friday’s price action showed that market participants want to respect by the medium-term trend given that Thursday managed to close above the 50 DMA & Friday went higher, but the volumes around it were not convincing.
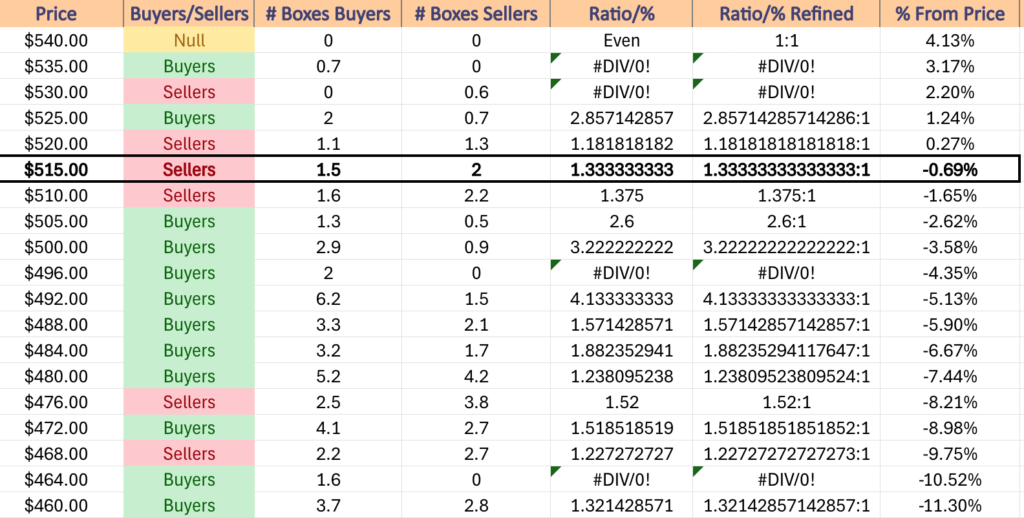
Even if the 10 DMA is broken above temporarily, QQQ’s current price level & the one above it & one below it are all historically dominated by Sellers, so there will need to be a big push in order to break back above these zones.
To the upside, QQQ is still ~3% from their All-Time High, which was aided greatly by Friday’s +1.64% advancing session to offset some of the other declines of the prior six days.
With this in mind & recalling that this too is a short week those & the relationship of price to the 10 & 50 day moving averages will be in focus.
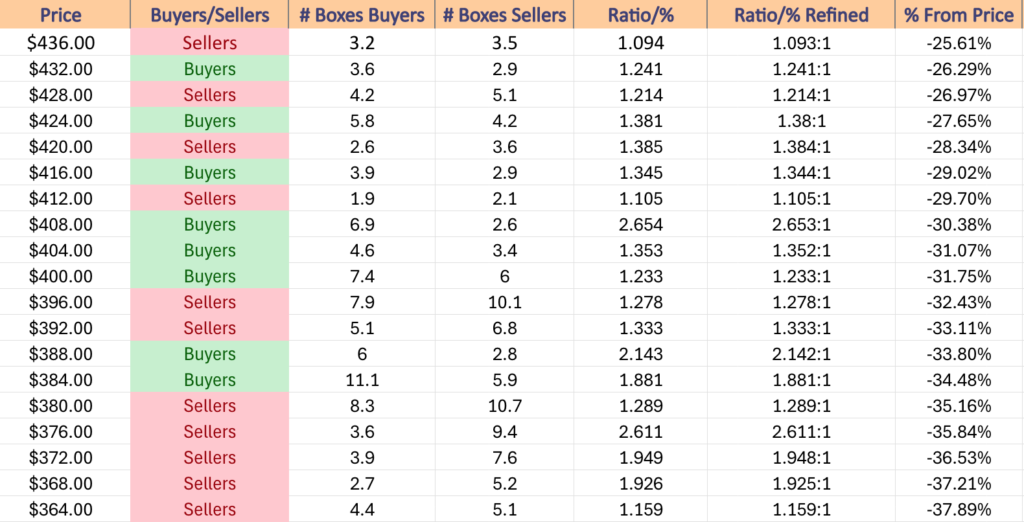
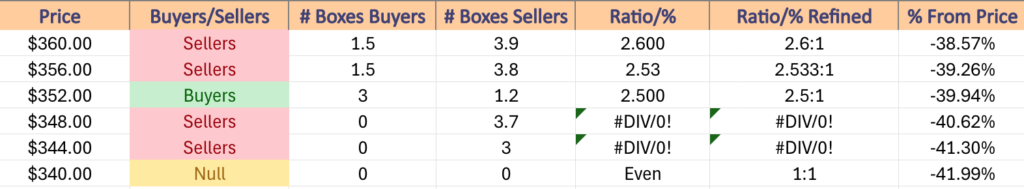
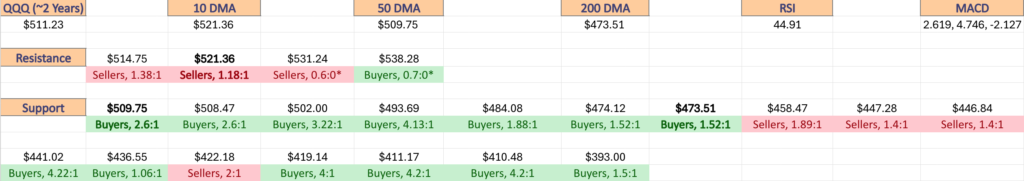
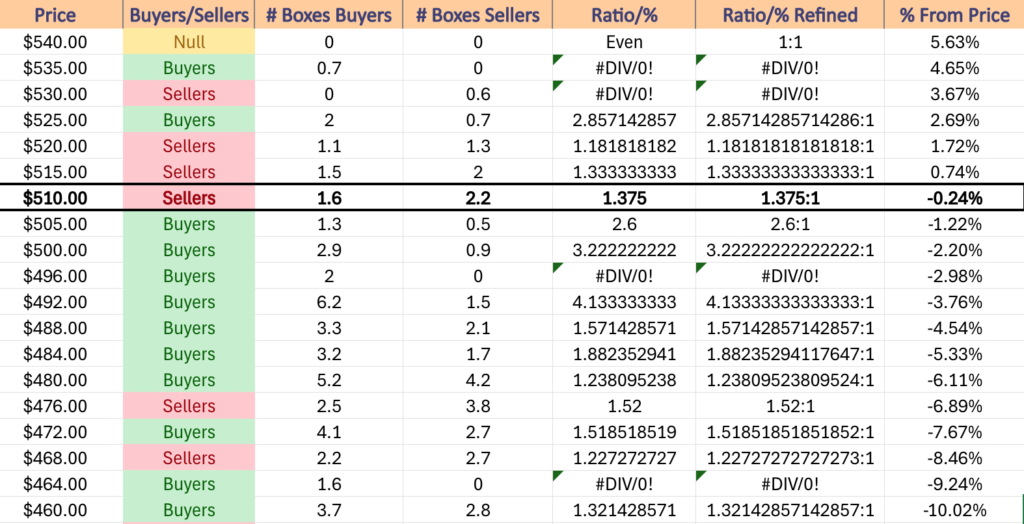
QQQ has support at the $514.75 (Volume Sentiment: Sellers, 1.38:1), $510.53 (50 Day Moving Average, Volume Sentiment: Sellers, 1.38:1), $508.47 (Volume Sentiment: Buyers, 2.6:1) & $502/share (Volume Sentiment: Buyers, 3.22:1) price levels, with resistance at the $519.18 (10 Day Moving Average, Volume Sentiment: Sellers, 1.33:1), $531.24 (Volume Sentiment: Sellers, 0.6:0*) & $538.28/share (All-Time High, Volume Sentiment: Buyers, 0.7:0*) price levels.
QQQ ETF’s Price Level:Volume Sentiment Over The Past ~2 Years
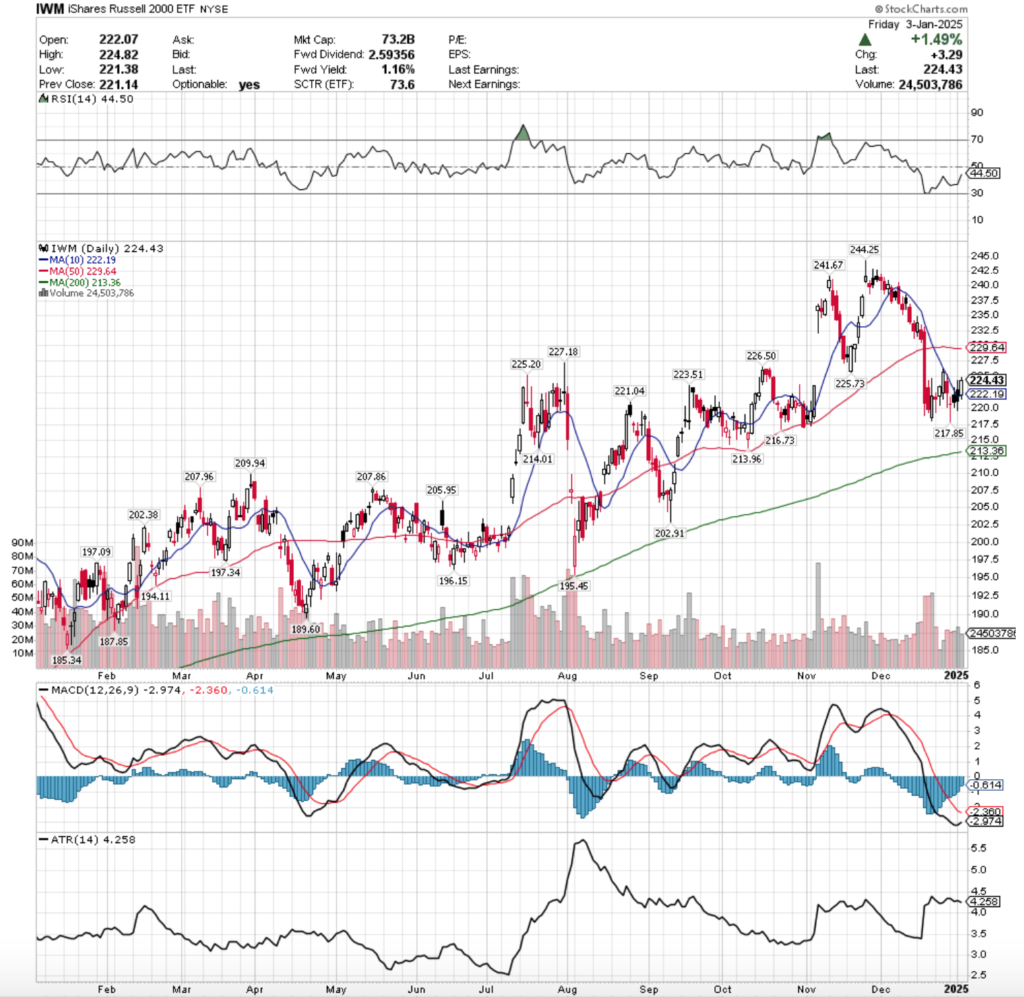
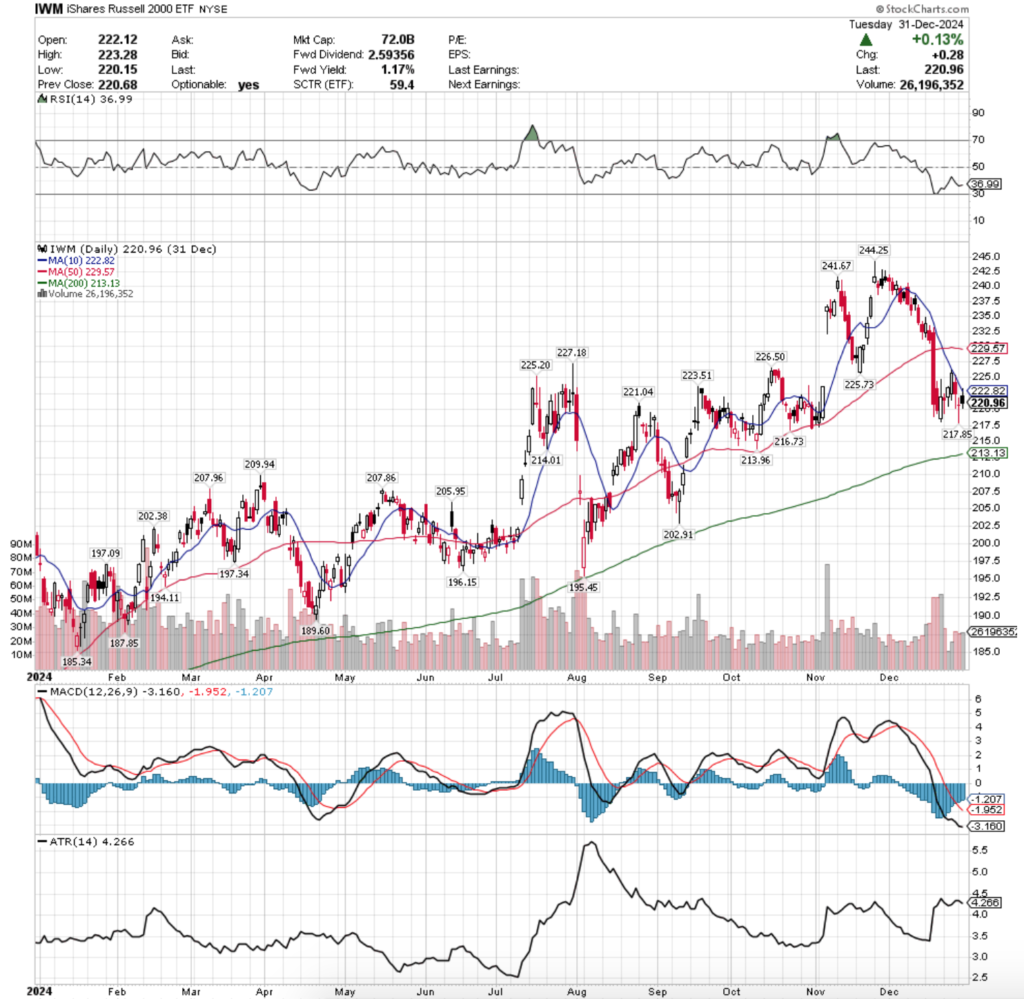
IWM, the iShares Russell 2000 ETF advanced +0.92% for the week, as the small cap index staged a bit of a recovery in its consolidation range after a rocky end to 2024.
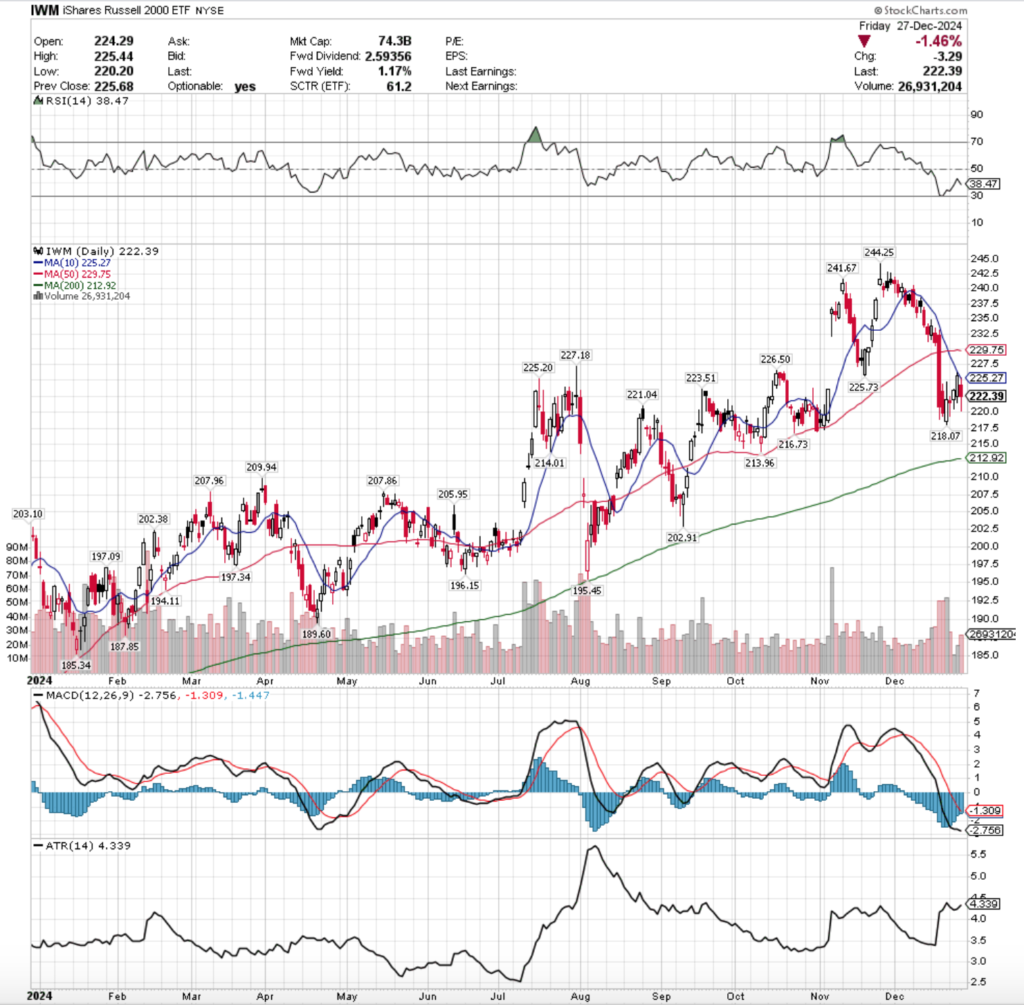
IWM ETF – iShares Russell 2000 ETF’s Technical Performance Over The Past Year
Their RSI is trending up towards the neutral mark & sits currently at 44.5, while their MACD is still bearish, but its histogram is signaling that there may be a further consolidation in the near-term.
Volumes were -15.72% below the previous year’s average level (26,452,500 vs. 31,387,826), which is not a major indicator of strength & confidence, despite the brief recovery from the losses of the previous month.
Like SPY & QQQ, IWM opened on a gap down on Monday & the session closed as a high wave candle on decent volume for the week, further distancing itself from the resistance of the 10 & 50 day moving averages.
The next day gapped up on the open & tested higher to briefly break through the 10 DMA’s resistance, but was unable to stay elevated & would up dropping lower to test against the $220/share price level, before closing above it but below the opening price, indicating that there was still lots of negative sentiment in the air.
Thursday managed to open above the 10 DMA & move higher, but gave back all of the gains by the end of the session & closed lower than it opened with a lower shadow that indicated that there was appetite for IWM below $220, which will be something to keep an eye on in the coming week(s).
Thursday’s moves came on the highest volume of the week as well, which helped gather investor momentum for Friday’s +1.49% advance which brought the week into the black.
It should be noted that Friday’s session was the lowest volume session of the week, which makes the staying power of the move higher come into question.
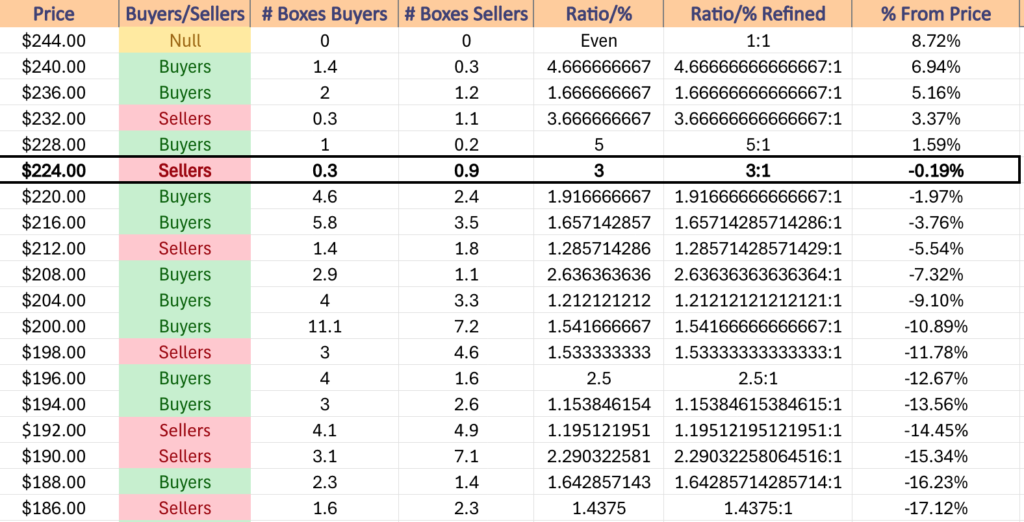
IWM faces a difficult week(s) ahead, as they have a number of resistance levels just overhead, all of which belong to a price zone that s historically Seller dominated 3:1.
It should be noted that the last time prices broke above the $227.18/share resistance level was the gap up after the U.S. Presidential election, so pending another catalyst that inspires optimism among market participants, it is difficult to see much strength to the upside without a large increase in volume.
IWM has managed to consolidate since the end of December & stayed in a relatively tight range near the 10 day moving average, which is likely to continue into this week.
Another thing to keep an eye on is that in the event of a decline, the long-term trend (200 day moving average) is just -4.93% below Friday’s closing price & is currently in a seller dominated price zone ($212-215.99), which will make for an interesting retest after IWM managed to stay above their 200 DMA in August, the last time they met.
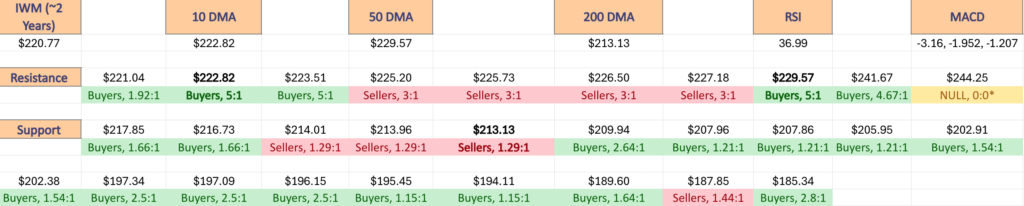
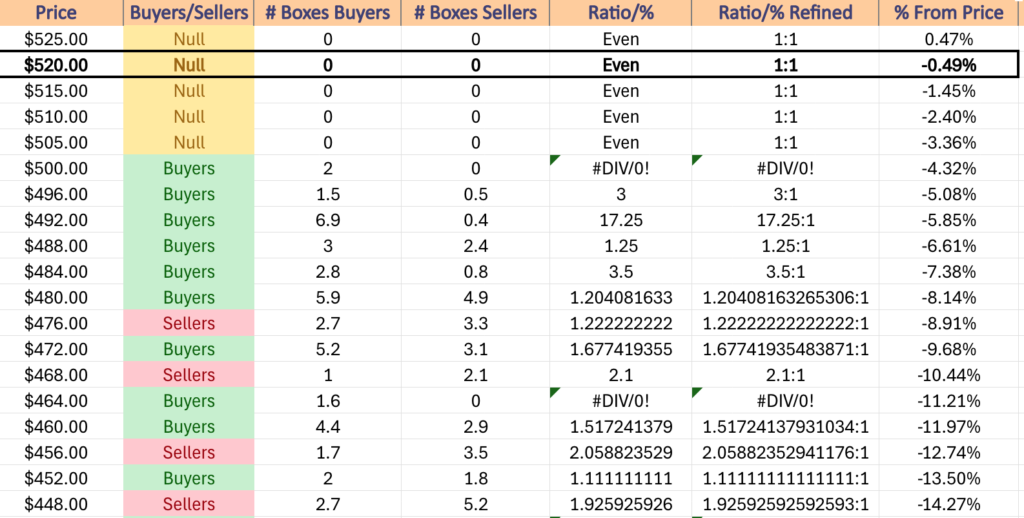
IWM has support at the $223.51 (Volume Sentiment: Buyers, 1.92:1), $222.19 (10 Day Moving Average, Volume Sentiment: Buyers, 1.92:1), $221.04 (Volume Sentiment: Buyers, 1.92:1) & $217.85/share (Volume Sentiment: Buyers, 1.66:1) price levels, with resistance at the $225.20 (Volume Sentiment: Sellers, 3:1), $225.73 (Volume Sentiment: Sellers, 3:1), $226.50 (Volume Sentiment: Sellers, 3:1) & $227.18/share (Volume Sentiment: Sellers, 3:1) price levels.
IWM ETF’s Price Level:Volume Sentiment Over The Past ~2 Years
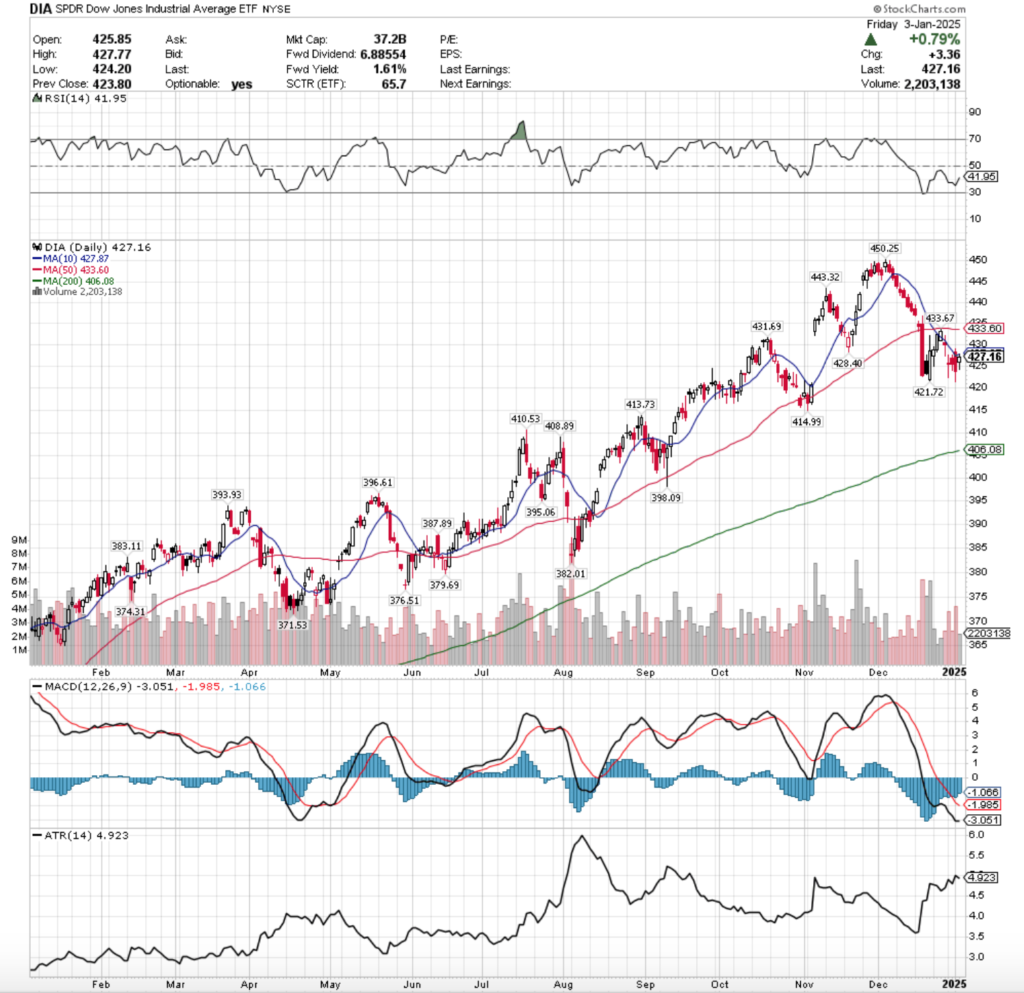
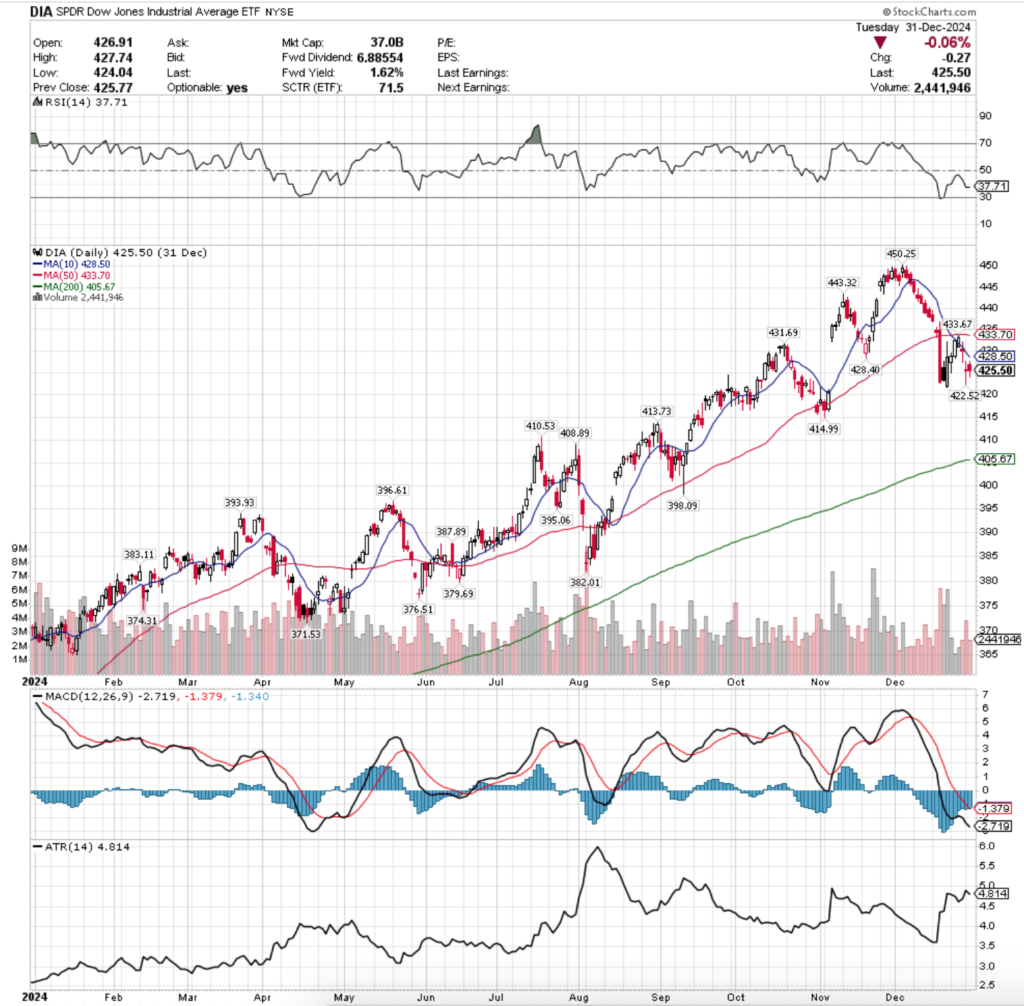
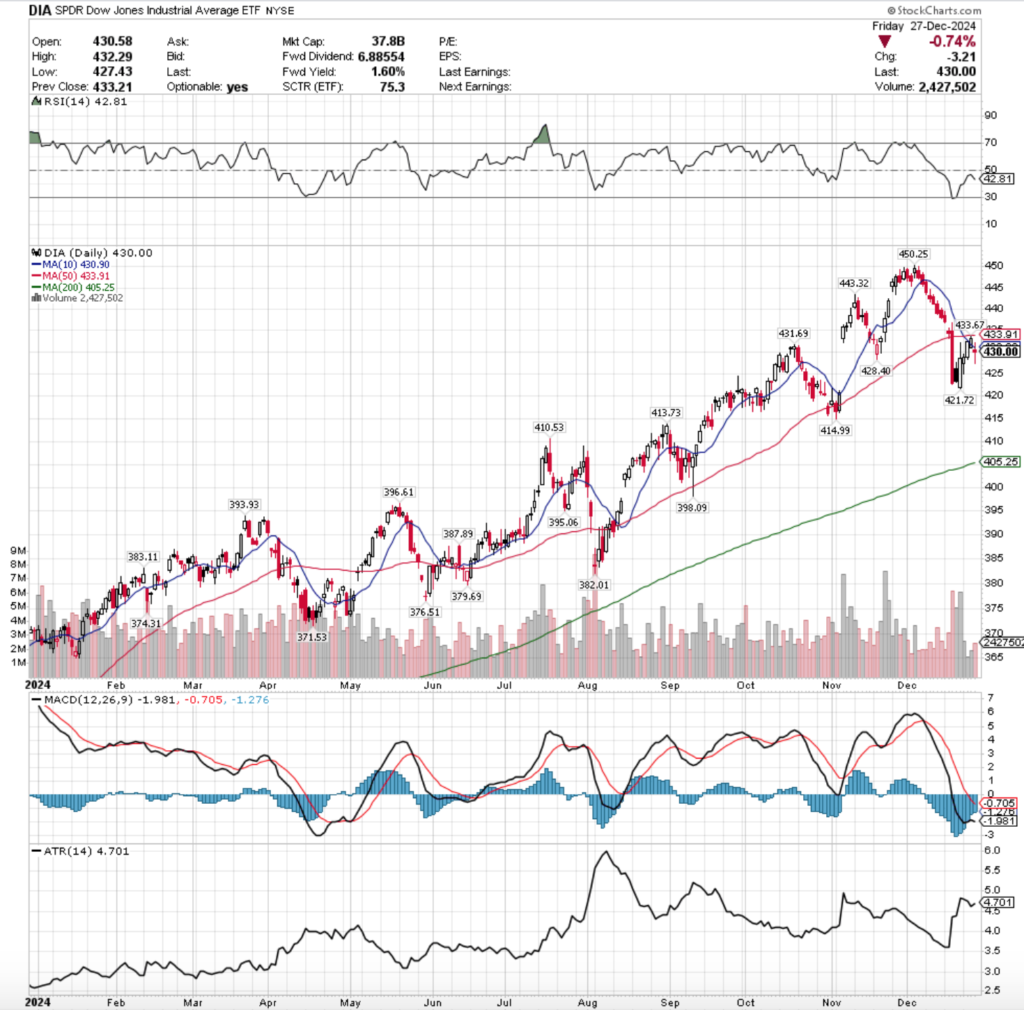
DIA ETF – SPDR Dow Jones Industrial Average ETF’s Technical Performance Over The Past Year
Their RSI is trending back towards neutral & currently at 41.95 after Friday’s session, while their MACD is still trending bearishly.
Volumes were -6.4% lower than the prior year’s average (3,182,500 vs. 3,400,040), which indicates that even the blue chip names have begun to lose their luster in the eyes of market participants.
Monday began the week with the second strongest volume of the week & resulted in a gap down high wave candle, indicating that there was a wide range of prices that the market deemed fair for DIA, both above & below it.
Tuesday opened on a gap higher but proceeded to go lower throughout the day & resulted in a decline on the week’s second lowest volume, leading to Thursday which is where things become interesting.
Thursday opened on a gap higher above the 10 DMA’s resistance, tested a little bit higher, before galling back down through the 10 DMA, testing lower than any day of the week & settled for a loss & forming a bearish engulfing pattern with Tuesday’s candle on the week’s highest volume.
Friday saw an advance of +0.79% which helped trim the losses of the rest of the week, but it came with an interesting twist as the candle formed a bullish harami pattern with Thursday’s candle.
What makes this interesting is that the session had the lowest volume of the week, indicating a lack of conviction among market participants, and it also resulted in a spinning top candle, which shows indecision.
Moving into this week it will be interesting to see if DIA is able to break above the 10 DMA’s resistance, and if it can if it remains there or if it is a short term stay.
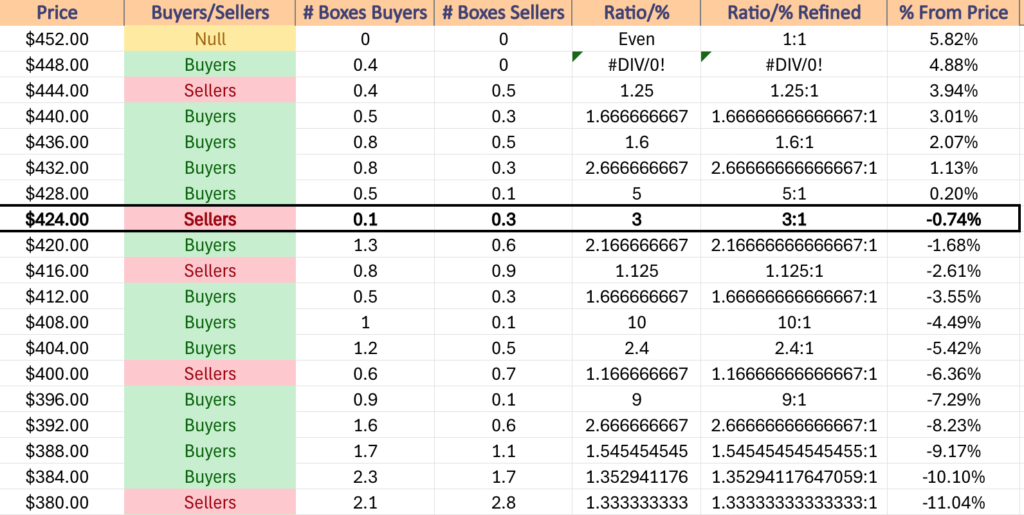
The window caused by the election has still not been fully filled, which should be on people’s radar as there is only one support level separating Friday’s closing price and the bottom of the window.
It should be noted that the support of the 200 Dya moving average is -4.9% below Friday’s closing price, so if the window does close there may well be a test of the long-term trend.
While the price zone above the 200 DMA has historically been Buyer dominated 10:1 ($408-411.99), this may not be able to save DIA from a downside test of it.
To the upside, should DIA break above its 10 DMA, it still has the resistance of the 50 DMA & would likely find itself consolidating into a range between the two for the rest of the coming short week.
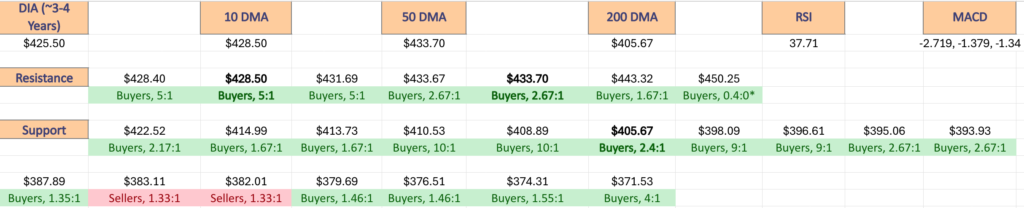
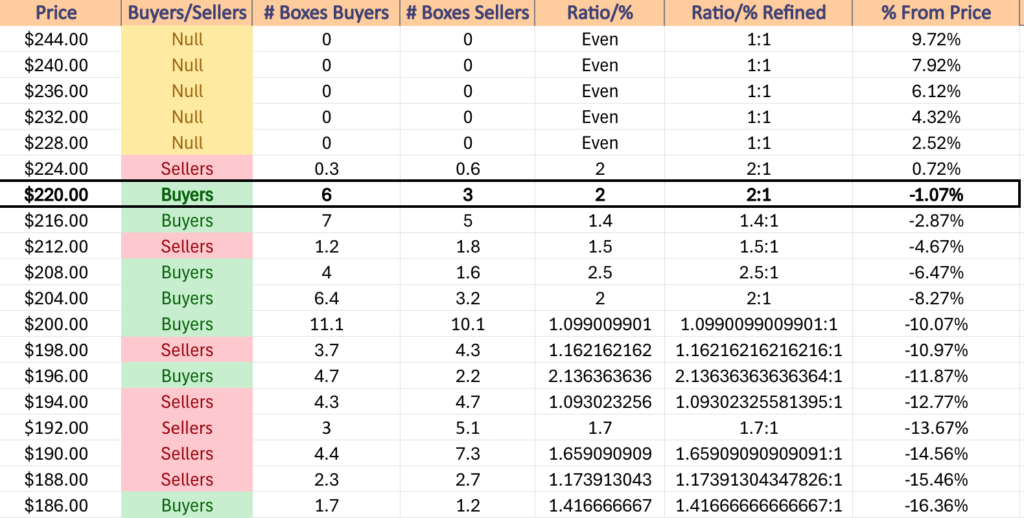
DIA has support at the $421.72 (Volume Sentiment: Buyers, 2.17:1), $414.99 (Volume Sentiment: Buyers, 1.67:1), $413.73 (Volume Sentiment: Buyers, 1.67:1) & $410.53/share (Volume Sentiment: Buyers, 10:1) price levels, with resistance at the $427.87 (10 Day Moving Average, Volume Sentiment: Sellers, 3:1), $431.69 (Volume Sentiment: Buyers, 5:1), $433.60 (50 Day Moving Average, Volume Sentiment: Buyers, 2.67:1) & $433.67/share (Volume Sentiment: Buyers, 2.67:1) price levels.
DIA ETF’s Price Level:Volume Sentiment Over The Past 3-4 Years
The Week Ahead
Monday kicks the week off with Fed Governor Cook speaking at 9:15 am, followed by Factory Orders at 10 am.
Commercial Metals reports earnings before Monday’s opening bell.
Fed President Barkin speaks Tuesday at 8 am, followed by Governor Waller speaking & U.S. Trade Deficit data coming out at 8:30 am & ISM Services data & Job Openings data at 10 am.
Tuesday morning’s earnings reports include Apogee Enterprises, Lindsay Corp. & RPM Inc., followed by AAR Corp., AZZ, Cal-Maine Foods & Simulations Plus after the closing bell.
Wednesday leads off with ADP Employment data at 8:15 am, Minutes from December’s FOMC meeting at 2pm & Consumer Credit data at 3pm.
Acuity Brands, Albertsons, AngioDynamics, Helen Of Troy, MSC Industrial, Radius Recycling & UniFirst report earnings before Wednesday’s opening bell, followed by Greenbrier, Jefferies & Penguin Solutions.
Initial Jobless Claims data is released Thursday at 8:30 am, followed by Fed President Harker speaking at 9 am, Wholesale Inventories data at 10 am & Fed Governor Bowman speaking at 1:35 pm.
Simply Good Foods will report earnings on Thursday morning, followed by Accolade, KB Home & PriceSmart, but the market will not be open in observance of President Carter’s recent passing.
Friday the week winds down with the U.S. Employment Report, U.S. Unemployment Rate, U.S. Hourly Wages & U.S. Hourly Wages Year-over-Year data at 8:30 am before Consumer Sentiment (prelim) data at 10 am.
Delta Airlines, Walgreens Boots Alliance, Constellation Brands, Neogen, TD Synnex & Tilray all report earnings before Friday’s opening bell, with WD-40 reporting after the session’s close.
See you back here next week!
*** I DO NOT OWN SHARES OR OPTIONS CONTRACT POSITIONS IN SPY, QQQ, IWM OR DIA AT THE TIME OF WRITING THIS ARTICLE ***
The VIX closed at 16.13, indicating an implied one day move of +/-1.02% & an implied one month move of +/-4.66% for the S&P 500.
Highest Technical Rated S&P 500 Components Per 1/3/2024’s Close:
1 – PLTR
2 – TSLA
3 – VST
4 – UAL
5 – AVGO
6 – TPR
7 – AXON
8 – ANET
9 – FTNT
10 – FOX
Lowest Technical Rated S&P 500 Components Per 1/3/2024’s Close:
1 – CE
2 – MRNA
3 – SMCI
4 – NUE
5 – MCHP
6 – DG
7 – EL
8 – DOW
9 – CVS
10 – REGN
Highest Volume Rated S&P 500 Components Per 1/3/2024’s Close:
1 – AJG
2 – KR
3 – TAP
4 – CHTR
5 – CEG
6 – MOS
7 – STLD
8 – VST
9 – ADBE
10 – AKAM
Lowest Volume Rated S&P 500 Components Per 1/3/2024’s Close:
1 – WDAY
2 – APO
3 – ANSS
4 – ICE
5 – BX
6 – DOV
7 – ERIE
8 – KVUE
9 – AXON
10 – SMCI
Highest Technical Rated ETFs Per 1/3/2024’s Close:
1 – TSLR
2 – TSLT
3 – TSLL
4 – EVAV
5 – TSL
6 – GXLM
7 – BITW
8 – BTFX
9 – DTSRF
10 – BITX
Lowest Technical Rated ETFs Per 1/3/2024’s Close:
1 – TSLZ
2 – TSDD
3 – TSLQ
4 – MSOX
5 – CNBS
6 – NVD
7 – SARK
8 – NVDQ
9 – TSLS
10 – MRNY
Highest Volume Rated ETFs Per 1/3/2024’s Close:
1 – LQDI
2 – JNEU
3 – SBND
4 – SPAM
5 – MDCP
6 – GCLN
7 – BTRN
8 – FFSM
9 – SSXU
10 – XHYI
Lowest Volume Rated ETFs Per 1/3/2024’s Close:
1 – BBEM
2 – USCA
3 – AUGW
4 – USCL
5 – AUGT
6 – SEPW
7 – QMAG
8 – XFLX
9 – DRAI
10 – ESMV
Highest Technical Rated General Stocks Per 1/3/2024’s Close:
1 – AMPE
2 – ALUR
3 – BBIG
4 – NITO
5 – RGTI
6 – UPHL
7 – QNCCF
8 – LAES
9 – CTM
10 – QUBT
Lowest Technical Rated General Stocks Per 1/3/2024’s Close:
1 – NMRA
2 – DNMR
3 – GOEV
4 – AZREF
5 – CRKN
6 – EQC
7 – UPC
8 – SOBR
9 – LICN
10 – ADD
Highest Volume Rated General Stocks Per 1/3/2024’s Close:
1 – OUT
2 – ACON
3 – MFI
4 – SCPX
5 – CYCC
6 – TGL
7 – FCUV
8 – MAMA
9 – SYPR
10 – PSNYW
Lowest Volume Rated General Stocks Per 1/3/2024’s Close:
1 – UPHL
2 – FLMMF
3 – PSYTF
4 – CYAN
5 – CRSXF
6 – GPTRF
7 – CNNEF
8 – DTEGF
9 – PGTK
10 – HINKF
*** THE LIST ABOVE IS STRICTLY FOR INFORMATIONAL PURPOSES – I MAY OR MAY NOT HAVE OR INITIATE A LONG, SHORT, OR LONG/SHORT POSITION IN ANY NAME ABOVE AT ANY TIME ***
The VIX closed at 17.93, indicating an implied one day move of +/-1.13% & an implied one month move of +/-5.18% for the S&P 500.
Highest Technical Rated S&P 500 Components Per 1/2/2025’s Close:
1 – PLTR
2 – UAL
3 – TSLA
4 – AVGO
5 – VST
6 – TPR
7 – AXON
8 – CCL
9 – EQT
10 – FOX
Lowest Technical Rated S&P 500 Components Per 1/2/2025’s Close:
1 – SMCI
2 – CE
3 – MRNA
4 – NUE
5 – MCHP
6 – CVS
7 – DG
8 – REGN
9 – INTC
10 – DOW
Highest Volume Rated S&P 500 Components Per 1/2/2025’s Close:
1 – TT
2 – CEG
3 – NI
4 – PPG
5 – IRM
6 – URI
7 – AJG
8 – EQT
9 – YUM
10 – VRSN
Lowest Volume Rated S&P 500 Components Per 1/2/2025’s Close:
1 – SMCI
2 – HUM
3 – ERIE
4 – MCK
5 – UHS
6 – HSY
7 – RJF
8 – J
9 – IQV
10 – BG
Highest Technical Rated ETFs Per 1/2/2025’s Close:
1 – KLIP
2 – TSLR
3 – TSLT
4 – TESL
5 – TSLL
6 – BITW
7 – TSL
8 – BTFX
9 – BITX
10 – BZQ
Lowest Technical Rated ETFs Per 1/2/2025’s Close:
1 – MSOX
2 – TSLZ
3 – TSDD
4 – TSLQ
5 – CNBS
6 – KORU
7 – NVD
8 – SARK
9 – MRNY
10 – NAIL
Highest Volume Rated ETFs Per 1/2/2025’s Close:
1 – JANP
2 – LJAN
3 – JDVI
4 – XBJA
5 – JANH
6 – LFEQ
7 – NDVG
8 – OVB
9 – UEVM
10 – ARCM
Lowest Volume Rated ETFs Per 1/2/2025’s Close:
1 – WTV
2 – USCL
3 – ZTRE
4 – CVRD
5 – SEPW
6 – GSID
7 – OPTZ
8 – MCSE
9 – NDOW
10 – SIXL
Highest Technical Rated General Stocks Per 1/2/2025’s Close:
1 – QNCCF
2 – RGTI
3 – LAES
4 – CTM
5 – QUBT
6 – LEEEF
7 – QMCO
8 – PDYN
9 – GRRR
10 – KULR
Lowest Technical Rated General Stocks Per 1/2/2025’s Close:
1 – LTRPB
2 – NMRA
3 – GOEV
4 – EFSH
5 – CRKN
6 – RNWEY
7 – CYN
8 – EQC
9 – UPC
10 – LICN
Highest Volume Rated General Stocks Per 1/2/2025’s Close:
1 – TWO
2 – AEI
3 – MBIO
4 – BGLC
5 – TXMD
6 – NITO
7 – SPCB
8 – REVB
9 – CTCX
10 – XPON
Lowest Volume Rated General Stocks Per 1/2/2025’s Close:
1 – BARUF
2 – IDWM
3 -BONXF
4 – CNNEF
5 – SROYF
6 – LIANY
7 – MTLFF
8 – DMXCF
9 – RNGE
10 – BGM
*** THE LIST ABOVE IS STRICTLY FOR INFORMATIONAL PURPOSES – I MAY OR MAY NOT HAVE OR INITIATE A LONG, SHORT, OR LONG/SHORT POSITION IN ANY NAME ABOVE AT ANY TIME ***
It’s been a volatile month & a half since our last volume sentiment check in, which has provided some retests of the new higher price levels that the major index ETFs have traded at.
Yesterday, the VIX closed at 17.35, indicating an implied one day move of +/-1.09% & an implied one month move of +/-5.01% for the S&P 500, as expectations for near-term volatility have been amped up.
This makes it a great time to check in & see how the major four index ETFs have traded at from a volume sentiment perspective at each price level they’ve covered in recent history.
This will provide an understanding of how prices may behave when certain support & resistance levels are reached & tested again in the future.
Each section below contains a view of each index ETF’s chart (for a technical breakdown of each ETF’s chart please see this past weekend’s market review note), as well as a list of their current one year support & resistance levels with the volume sentiment noted beneath it on the table.
There is an additional table beneath this table with each price level’s sentiment, as well as a typed text version below that is able to be copied & pasted.
Note that “NULL, 0:0*” values denote areas that each name has traded at but with limited volume data to work with from a comparison standpoint in terms of creating a ratio of buyers:sellers (or vice versa).
Also, prices that do have a ratio of Buyers:Sellers (Sellers:Buyers) where the denominator is 0 are denoted with an asterisk “*” as well.
In the written lists of the price levels & volume sentiments the price levels that contain support & resistance levels are marked in BOLD.
Recall that at price extremes such as the highs that we have recently hit there will tend to be skewed data due to the small sample size & factor that into how you interpret each price level’s reported sentiment.
This is intended to serve as an additional tool, similar to a barometer to use during your due diligence process & is not meant to replace doing your own research & is not financial advice.
Price Level:Volume Sentiment Analysis For SPY, The SPDR S&P 500 ETF
SPY ETF – SPDR S&P 500 ETF’s Technical Performance Over The Past Year
SPY, the SPDR S&P 500 ETF has been giving back its post U.S. Election gains for much of the last 6 weeks.
The middle & end of December saw some elevated volume, but for the most part market participation has still be dramatically muted since April of 2024 vs. previous years.
With their 10 day moving average bearish down on the 50 DMA, there look to be more near-term declines on the horizon, with sparse support levels near their current price.
With this in mind, it is worth looking at how investors have behaved over the past few years at each price level to see if it lends clues into how they may choose to behave again in the near-future.
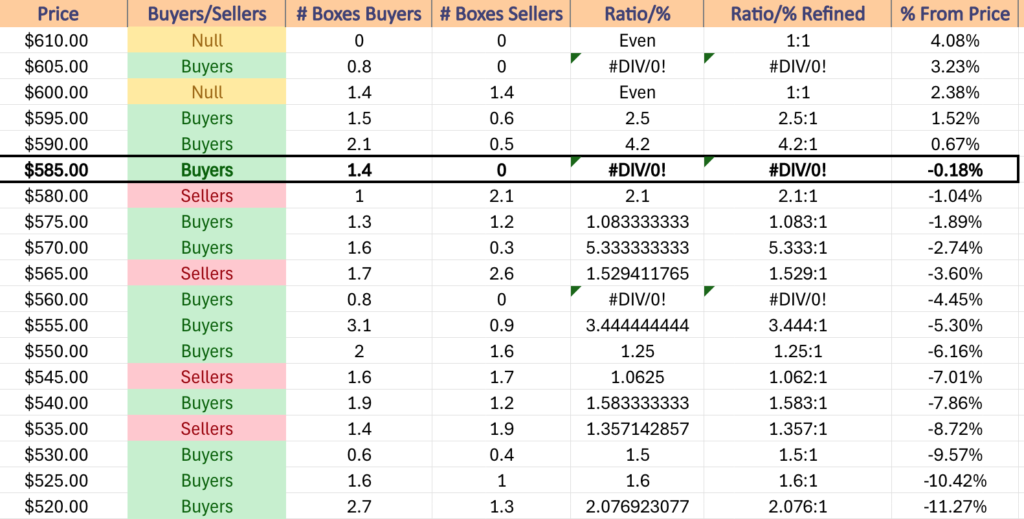
Below is a list of the volume sentiments at each price level SPY has traded at over the past 2-3 years.
SPY ETF’s Price Level:Volume Sentiment Over The Past ~2 Years At Their Past Year’s Support/Resistance Levels
SPY ETF’s Price Level:Volume Sentiment Over The Past ~2 Years
Price Level:Volume Sentiment For SPY ETF Over The Past ~2 Years
SPY ETF’s Price Level:Volume Sentiment Over The Past ~2 Years
SPY ETF’s Price Level:Volume Sentiment Over The Past ~2 Years
$610 – NULL – 0:0*, +4.08% From Current Price Level
$605 – Buyers – 0.8:0*, +3.23% From Current Price Level
$600 – Even – 1:1, +2.38% From Current Price Level
$595 – Buyers – 2.5:1, +1.52% From Current Price Level
$590 – Buyers – 4.2:1, +0.67% From Current Price Level – 10 & 50 Day Moving Averages**
$585 – Buyers – 1.4:0*, -0.18% From Current Price Level – Current Price Level*
$580 – Sellers – 2.1:1, -1.04% From Current Price Level
$575 – Buyers – 1.08:1, -1.89% From Current Price Level
$570 – Buyers – 5.33:1. -2.74% From Current Price Level
$565 – Sellers – 1.53:1, -3.6% From Current Price Level
$560 – Buyers – 0.8:0*, -4.45% From Current Price Level
$555 – Buyers – 3.44:1, -5.3% From Current Price Level
$550 – Buyers – 1.25:1, -6.16% From Current Price Level – 200 Day Moving Average*
$545 – Sellers – 1.06:1, -7.01% From Current Price Level
$540 – Buyers – 1.58:1, -7.86% From Current Price Level
$535 – Sellers – 1.36:1, -8.72% From Current Price Level
$530 – Buyers – 1.5:1, -9.57% From Current Price Level
$525 – Buyers – 1.6:1, -10.42% From Current Price Level
$520 – Buyers – 2.08:1, -11.27% From Current Price Level
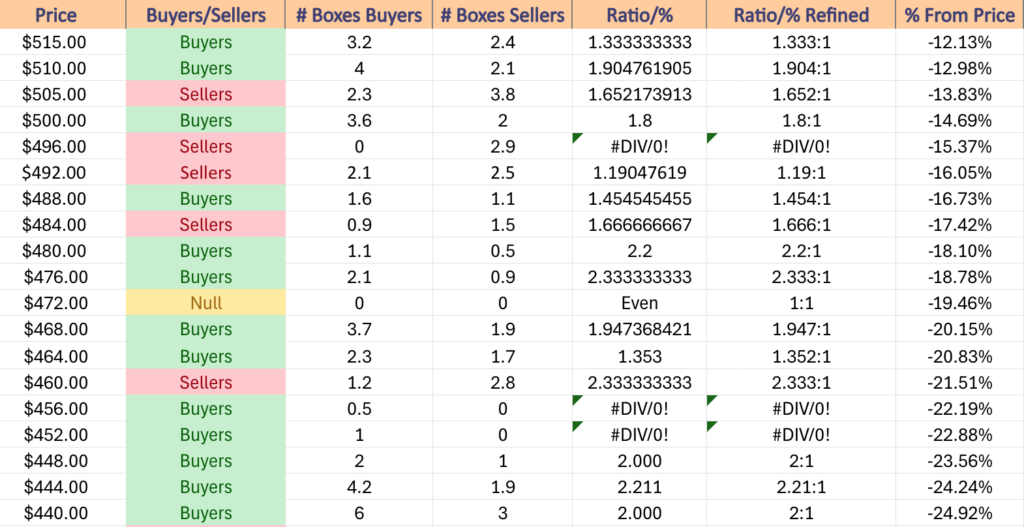
$515 – Buyers – 1.33:1, -12.13% From Current Price Level
$510 – Buyers – 1.9:1, -12.98% From Current Price Level
$505 – Sellers – 1.65:1, -13.83% From Current Price Level
$500 – Buyers – 1.8:1, -14.69% From Current Price Level
$496 – Sellers – 2.9:0*, -15.37% From Current Price Level
$492 – Sellers – 1.19:1, -16.05% From Current Price Level
$488 – Buyers – 1.45:1, -16.73% From Current Price Level
$484 – Sellers – 1.67:1, -17.42% From Current Price Level
$480 – Buyers – 2.2:1, -18.1% From Current Price Level
$476 – Buyers – 2.33:1, -18.78% From Current Price Level
$472 – NULL – 0:0*, -19.46% From Current Price Level
$468 – Buyers – 1.95:1, -20.15% From Current Price Level
$464 – Buyers – 1.35:1, -20.83% From Current Price Level
$460 – Sellers – 2.33:1, -21.51% From Current Price Level
$456 – Buyers – 0.5:0*, -22.19% From Current Price Level
$452 – Buyers – 1:0*, -22.88% From Current Price Level
$448 – Buyers – 2:1, -23.56% From Current Price Level
$444 – Buyers – 2.21:1, -24.24% From Current Price Level
$440 – Buyers – 2:1, -24.92% From Current Price Level
$436 – Sellers – 1.09:1, -25.61% From Current Price Level
$432 – Buyers – 1.24:1, -26.29% From Current Price Level
$428 – Sellers – 1.21:1, -26.97% From Current Price Level
$424 – Buyers – 1.38:1, -27.65% From Current Price Level
$420 – Sellers – 1.38:1, -28.34% From Current Price Level
$416 – Buyers – 1.34:1, -29.02% From Current Price Level
$412 – Sellers – 1.11:1, -29.7% From Current Price Level
$408 – Buyers – 2.65:1, -30.38% From Current Price Level
$404 – Buyers – 1.35:1, -31.07% From Current Price Level
$400 – Buyers – 1.23:1, -31.75% From Current Price Level
$396 – Sellers – 1.28:1, -32.43% From Current Price Level
$392 – Sellers – 1.33:1, -33.11% From Current Price Level
$388 – Buyers – 2.14:1, -33.8% From Current Price Level
$384 – Buyers – 1.88:1, -34.48% From Current Price Level
$380 – Sellers – 1.29:1, -35.16% From Current Price Level
$376 – Sellers – 2.61:1, -35.84% From Current Price Level
$372 – Sellers – 1.95:1, -36.53% From Current Price Level
$368 – Sellers – 1.93:1, -37.21% From Current Price Level
$364 – Sellers – 1.16:1, -37.89% From Current Price Level
$360 – Sellers – 2.6:1, -38.57% From Current Price Level
$356 – Sellers – 2.53:1, -39.26% From Current Price Level
$352 – Buyers – 2.5:1, -39.94% From Current Price Level
$348 – Sellers – 3.7:0*, -40.62% From Current Price Level
$344 – Sellers – 3:0*, -41.3% From Current Price Level
$340 – NULL – 0:0*, -41.99% From Current Price Level
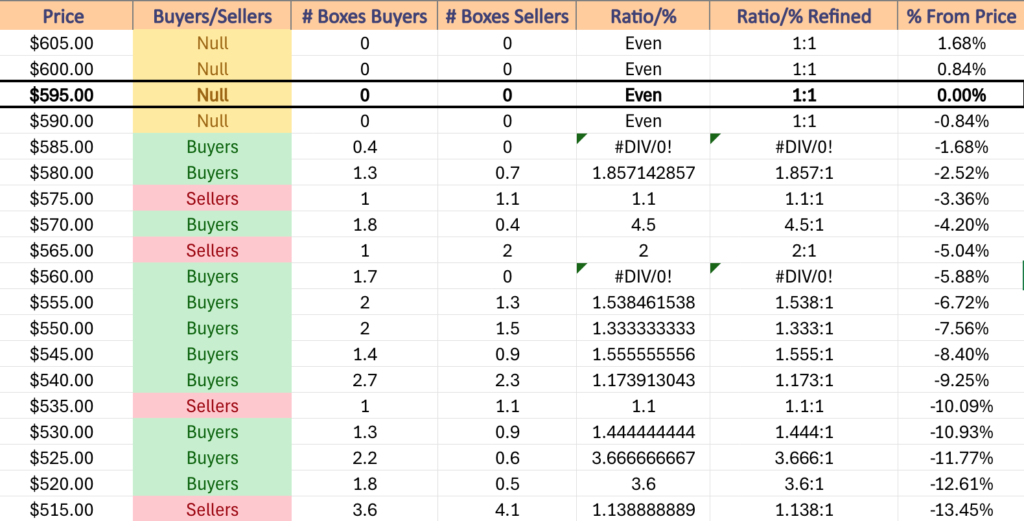
Price Level:Volume Sentiment Analysis For QQQ, The Invesco QQQ Trust ETF
QQQ ETF – Invesco QQQ Trust ETF’s Technical Performance Over The Past Year
QQQ, the Invesco QQQ Trust ETF has continued to trade in a similar manner as SPY, although their recent volumes have been lower as there is a bit of caution in the air around the tech-heavy index.
Their recent declines have caused there to be less one year support levels than at our last check in, which will make it all the more important to have an understanding of how they’ve behaved at each price level previously.
Below is a list of their support & resistance levels from a one year chart, and their volume sentiment at each price level they’ve traded at over the past ~2 years.
QQQ ETF’s Price Level:Volume Sentiment Over The Past ~2 Years At Their One Year Support & Resistance Levels
QQQ ETF’s Price Level:Volume Sentiment Over The Past ~2 Years
Price Level:Volume Sentiment For QQQ ETF Over The Past ~2 Years
QQQ ETF’s Price Level:Volume Sentiment Over The Past ~2 Years
QQQ ETF’s Price Level:Volume Sentiment Over The Past ~2 Years
$540 – NULL – 0:0*, +5.63% From Current Price Level
$535 – Buyers – 0.7:0*, +4.65% From Current Price Level
$530 – Sellers – 0.6:0*, +3.67% From Current Price Level
$525 – Buyers – 2.86:1, +2.69% From Current Price Level
$520 – Sellers – 1.18:1, +1.72% From Current Price Level – 10 Day Moving Average*
$515 – Sellers – 1.33:1, +0.74% From Current Price Level
$510 – Sellers – 1.38:1, -0.24% From Current Price Level – Current Price Level*
$505 – Buyers – 2.6:1, -1.22% From Current Price Level – 50 Day Moving Average*
$500 – Buyers – 3.22:1, -2.2% From Current Price Level
$496 – Buyers – 2:0*, -2.98% From Current Price Level
$492 – Buyers – 4.13:1, -3.76% From Current Price Level
$488 – Buyers – 1.57:1, -4.54% From Current Price Level
$484 – Buyers – 1.88:1, -5.33% From Current Price Level
$480 – Buyers – 1.24:1, -6.11% From Current Price Level
$476 – Sellers – 1.52:1, -6.89% From Current Price Level
$472 – Buyers – 1.52:1, -7.67% From Current Price Level – 200 Day Moving Average*
$468 – Sellers – 1.23:1, -8.46% From Current Price Level
$464 – Buyers – 1.6:0*, -9.24% From Current Price Level
$460 – Buyers – 1.32:1, -10.02% From Current Price Level
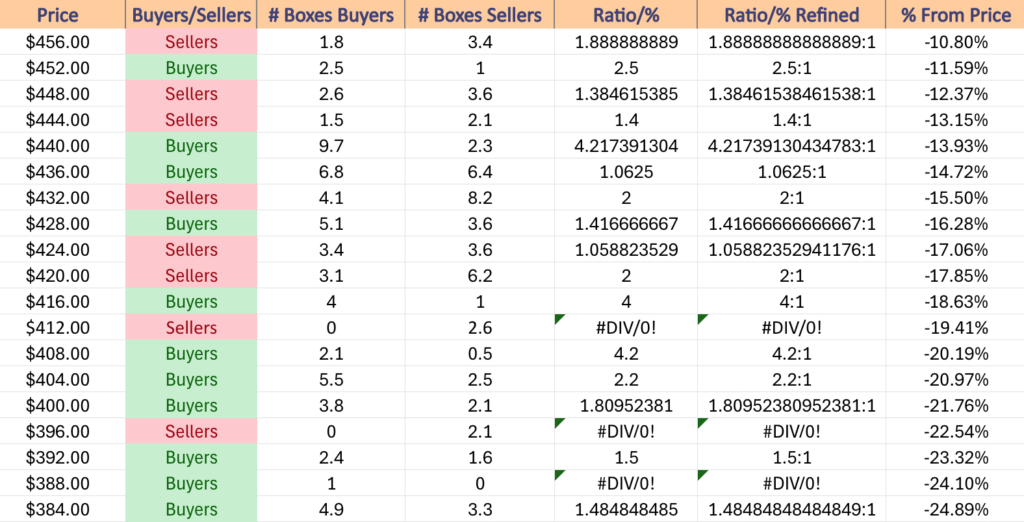
$456 – Sellers – 1.89:1, -10.8% From Current Price Level
$452 – Buyers – 2.5:1, -11.59% From Current Price Level
$448 – Sellers – 1.39:1, -12.37% From Current Price Level
$444 – Sellers – 1.4:1, -13.15% From Current Price Level
$440 – Buyers – 4.22:1, -13.93% From Current Price Level
$436 – Buyers – 1.06:1, -14.72% From Current Price Level
$432 – Sellers – 2:1, -15.5% From Current Price Level
$428 – Buyers – 1.42:1, -16.28% From Current Price Level
$424 – Sellers – 1.06:1, -17.06% From Current Price Level
$420 – Sellers – 2:1, -17.85% From Current Price Level
$416 – Buyers – 4:1, -18.63% From Current Price Level
$412 – Sellers – 2.6:0*, -19.41% From Current Price Level
$408 – Buyers – 4.2:1, -20.19% From Current Price Level
$404 – Buyers – 2.2:1, -20.97% From Current Price Level
$400 – Buyers – 1.81:1, -21.76% From Current Price Level
$396 – Sellers – 2.1:0*, -22.54% From Current Price Level
$392 – Buyers – 1.5:1, -23.32% From Current Price Level
$388 – Buyers – 1:0*, -24.1% From Current Price Level
$384 – Buyers – 1.49:1, -24.89% From Current Price Level
$380 – Buyers – 1.89:1, -25.67% From Current Price Level
$376 – Buyers – 3.86:1, -26.45% From Current Price Level
$372 – Buyers – 1.2:1, -27.23% From Current Price Level
$368 – Sellers – 1.3:1, -28.02% From Current Price Level
$364 – Buyers – 1.66:1, -28.8% From Current Price Level
$360 – Buyer s- 1.17:1, -29.58% From Current Price Level
$356 – Sellers – 1.13:1, -30.36% From Current Price Level
$352 – Buyers – 1.22:1, -31.15% From Current Price Level
$348 – Buyers – 1.14:1, -31.93% From Current Price Level
$344 – Buyers – 1.24:1, -32.71% From Current Price Level
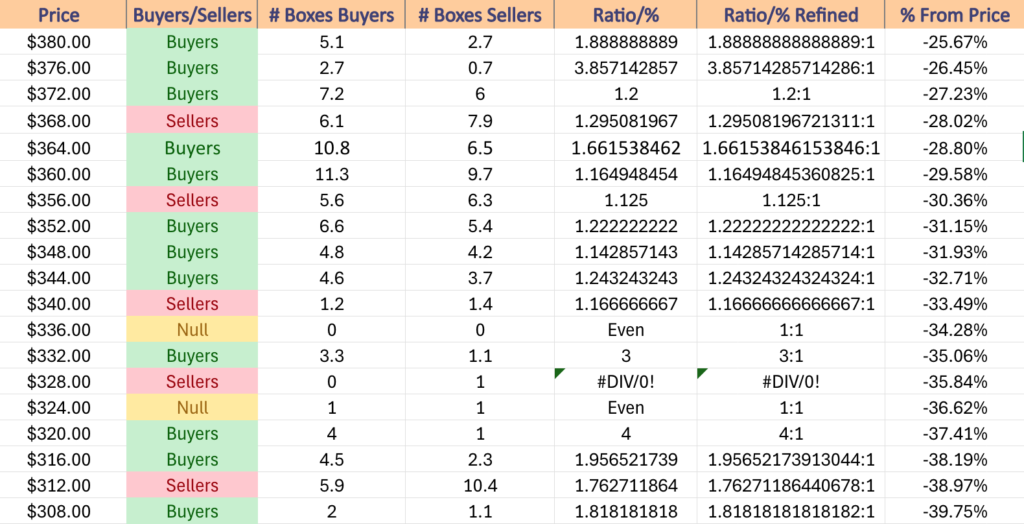
$340 – Sellers – 1.17:1, -33.49% From Current Price Level
$336 – NULL – 0:0*, -34.28% From Current Price Level
$332 – Buyers – 3:1, -35.06% From Current Price Level
$328 – Sellers – 1:0*, -35.84% From Current Price Level
$324 – Even – 1:1, -36.62% From Current Price Level
$320 – Buyers – 4:1, -37.41% From Current Price Level
$316 – Buyers – 1.96:1, -38.19% From Current Price Level
$312 – Sellers – 1.76:1, -38.97% From Current Price Level
$308 – Buyers – 1.82:1, -39.75% From Current Price Level
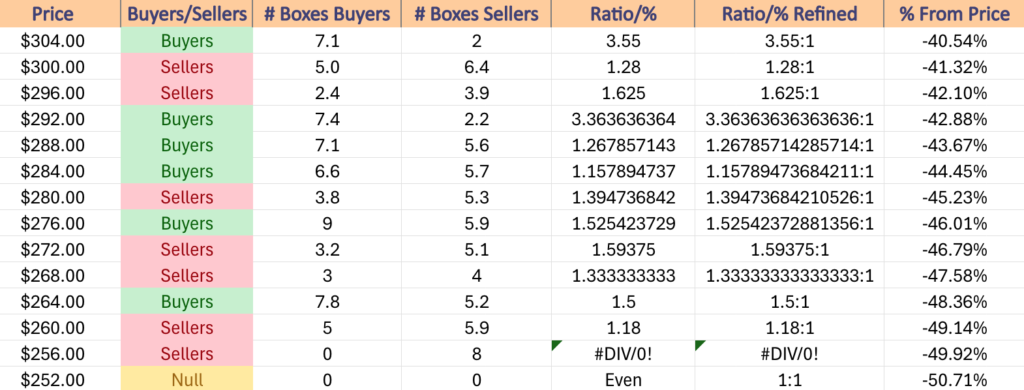
$304 – Buyers – 3.55:1, -40.54% From Current Price Level
$300 – Sellers – 1.28:1, -41.32% From Current Price Level
$296 – Sellers – 1.63:1, -42.1% From Current Price Level
$292 – Buyers – 3.36:1, -42.88% From Current Price Level
$288 – Buyers – 1.27:1, -43.67% From Current Price Level
$284 – Buyers – 1.16:1, -44.45% From Current Price Level
$280 – Sellers – 1.4:1, -45.23% From Current Price Level
$276 – Buyers – 1.53:1, -46.01% From Current Price Level
$272 – Sellers – 1.59:1, -46.79% From Current Price Level
$268 – Sellers – 1.33:1, -47.58% From Current Price Level
$264 – Buyers – 1.5:1, -48.36% From Current Price Level
$260 – Sellers – 1.18:1, -49.14% From Current Price Level
$256 – Sellers – 8:0*, -49.92% From Current Price Level
$252 – NULL – 0:0*, -50.71% From Current Price Level
Price Level:Volume Sentiment Analysis For IWM, The iShares Russell 2000 ETF
IWM ETF – iShares Russell 2000 ETF’s Technical Performance Over The Past Year
IWM, the iShares Russell 2000 ETF has seen steeper declines than SPY or QQQ since November, but has traded at more consistent volumes compared to a year ago than the former two index ETFs.
The small cap index’s 10 day moving average recently crossed bearishly through their 50 day moving average & prices have consolidated 3.67% above their 200 DMA’s support level.
Given their price’s proximity to the long-term trend line, the information below is important to know in the event of a retest of their support levels.
IWM ETF’s Price Level:Volume Sentiment Over The Past ~2 Years At Their One Year Support/Resistance Levels
IWM ETF’s Price Level:Volume Sentiment Over The Past ~2 Years
Price Level:Volume Sentiment Over The Past ~2 Years For IWM ETF
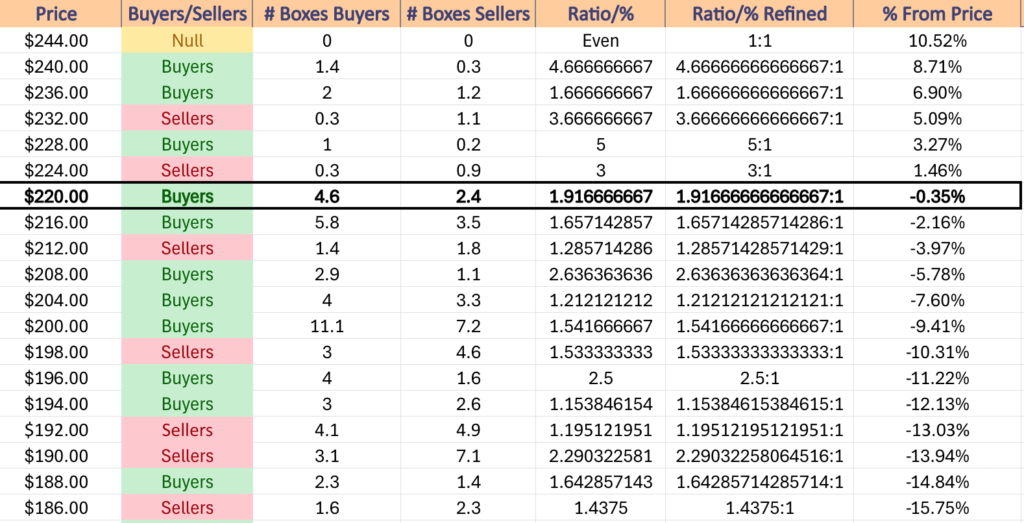
$244 – NULL – 0:0*, +10.52% From Current Price Level
$240 – Buyers – 4.67:1, +8.71% From Current Price Level
$236 – Buyers – 1.67:1, +6.9% From Current Price Level
$232 – Sellers – 3.67:1, +5.09% From Current Price Level
$228 – Buyers – 5:1, +3.27% From Current Price Level – 50 Day Moving Average*
$224 – Sellers – 3:1, +1.46% From Current Price Level
$220 – Buyers – 1.92:1, -0.35% From Current Price Level – Current Price Level, 10 Day Moving Average**
$216 – Buyers – 1.66:1, -2.16% From Current Price Level
$212 – Sellers – 1.29:1, -3.97% From Current Price Level – 200 Day Moving Average *
$208 – Buyers – 2.64:1, -5.78% From Current Price Level
$204 – Buyers – 1.21:1, -7.6% From Current Price Level
$200 – Buyers – 1.54:1, -9.41% From Current Price Level
$198 – Sellers – 1.53:1, -10.31% From Current Price Level
$196 – Buyers – 2.5:1, -11.22% From Current Price Level
$194 – Buyers – 1.15:1, -12.13% From Current Price Level
$192 – Sellers – 1.2:1, -13.03% From Current Price Level
$190 – Sellers – 2.29:1, -13.94% From Current Price Level
$188 – Buyers – 1.64:1, -14.84% From Current Price Level
$186 – Sellers – 1.44:1, -15.75% From Current Price Level
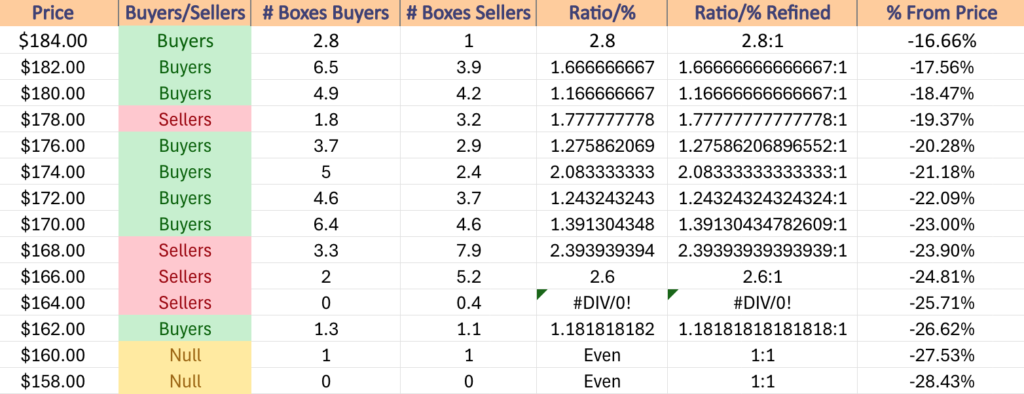
$184 – Buyers – 2.8:1, -16.66% From Current Price Level
$182 – Buyers – 1.67:1, -17.56% From Current Price Level
$180 – Buyers – 1.17:1, -18.47% From Current Price Level
$178 – Sellers – 1.78:1, -19.37% From Current Price Level
$176 – Buyers – 1.28:1, -20.28% From Current Price Level
$174 – Buyers – 2.08:1, -21.18% From Current Price Level
$172 – Buyers – 1.24:1, -22.09% From Current Price Level
$170 – Buyers – 1.39:1, -23% From Current Price Level
$168 – Sellers – 2.39:1, -23.9% From Current Price Level
$166 – Sellers – 2.6:1, -24.81% From Current Price Level
$164 – Sellers – 0.4:0*, -25.71% From Current Price Level
$162 – Buyers – 1.18:1, -26.62% From Current Price Level
$160 – Even – 1:1, -27.53% From Current Price Level
$158 – NULL – 0:0*, -28.43% From Current Price Level
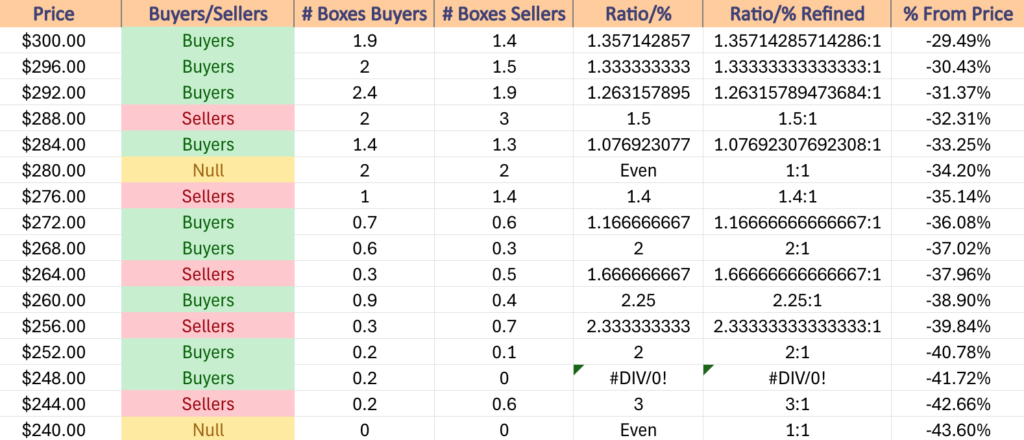
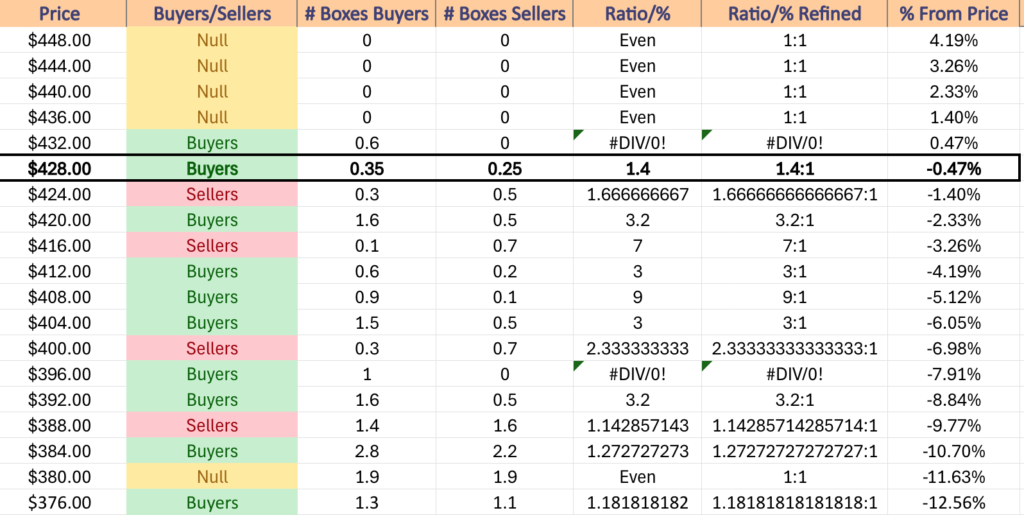
Price Level:Volume Sentiment Analysis For DIA, The SPDR Dow Jones Industrial Average ETF
DIA ETF – SPDR Dow Jones Industrial Average ETF’s Technical Performance Over The Past Year
DIA, the SPDR Dow Jones Industrial Average ETF has continued to trade like IWM, as the blue chip index & small cap index have shared similar trading characteristics over the past year.
This may not continue as volatility heats up due to the differences between the components of each index, making the tables below important for assessing the strength of support levels in the near-term.
DIA ETF’s Price Level:Volume Sentiment Over The Past 3-4 Years At Their Past Year’s Support & Resistance Levels
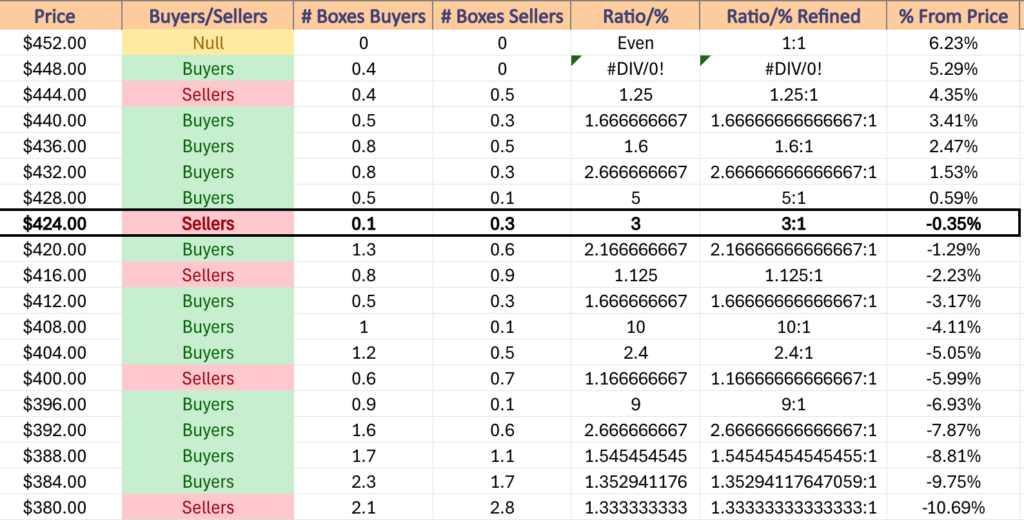
Price Level:Volume Sentiment For DIA ETF Over The Past 3-4 Years
DIA ETF’s Price Level:Volume Sentiment Over The Past 3-4 Years
DIA ETF’s Price Level:Volume Sentiment Over The Past 3-4 Years
$452 – NULL – 0:0*, +6.23% From Current Price Level
$448 – Buyers – 0.4:0*, +5.29% From Current Price Level
$444 – Sellers – 1.25:1, +4.35% From Current Price Level
$440 – Buyers – 1.67:1, +3.41% From Current Price Level
$436 – Buyers – 1.6:1, +2.47% From Current Price Level
$432 – Buyers – 2.67:1, +1.53% From Current Price Level – 50 Day Moving Average*
$428 – Buyers – 5:1, +0.59% From Current Price Level – 10 Day Moving Average*
$424 – Sellers – 3:1, -0.35% From Current Price Level – Current Price Level*
$420 – Buyers – 2.17:1, -1.29% From Current Price Level
$416 – Sellers – 1.13:1, -2.23% From Current Price Level
$412 – Buyers – 1.67:1, -3.17% From Current Price Level
$408 – Buyers – 10:1, -4.11% From Current Price Level
$404 – Buyers – 2.4:1, -5.05% From Current Price Level – 200 Day Moving Average*
$400 – Seller s- 1.17:1, -5.99% From Current Price Level
$396 – Buyers – 9:1, -6.93% From Current Price Level
$392 – Buyers – 2.67:1, -7.87% From Current Price Level
$388 – Buyers – 1.55:1, -8.81% From Current Price Level
$384 – Buyers – 1.36:1, -9.75% From Current Price Level
$380 – Sellers – 1.33:1, -10.69% From Current Price Level
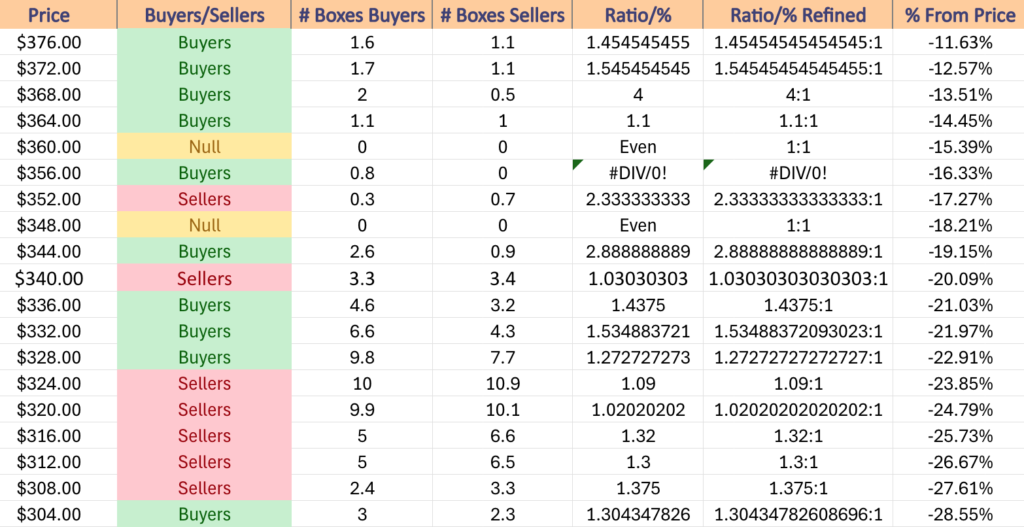
$376 – Buyers – 1.46:1, -11.63% From Current Price Level
$372 – Buyers – 1.55:1, -12.57% From Current Price Level
$368 – Buyers – 4:1, -13.51% From Current Price Level
$364 – Buyers – 1.1:1, -14.45% From Current Price Level
$360 – NULL – 0:0*, -15.39% From Current Price Level
$356 – Buyers – 0.8:0*, -16.33% From Current Price Level
$352 – Sellers – 2.33:1, -17.27% From Current Price Level
$348 – NULL – 0:0*, -18.21% From Current Price Level
$344 – Buyers – 2.89:1, -19.15% From Current Price Level
$340 – Sellers – 1.03:1, -20.09% From Current Price Level
$336 – Buyers – 1.44:1, -21.03% From Current Price Level
$332 – Buyers – 1.54:1, -21.97% From Current Price Level
$328 – Buyers – 1.27:1, -22.91% From Current Price Level
$324 – Sellers – 1.09:1, -23.85% From Current Price Level
$320 – Sellers – 1.02:1, -24.79% From Current Price Level
$316 – Sellers – 1.32:1, -25.73% From Current Price Level
$312 – Sellers – 1.3:1, -26.67% From Current Price Level
$308 – Sellers – 1.38:1, -27.61% From Current Price Level
$304 – Buyers – 1.3:1, -28.55% From Current Price Level
$300 – Buyers – 1.36:1, -29.49% From Current Price Level
$296 – Buyers – 1.33:1, -30.43% From Current Price Level
$292 – Buyers – 1.26:1. -31.37% From Current Price Level
$288 – Sellers – 1.5:1, -32.31% From Current Price Level
$284 – Buyers – 1.08:1, -33.25% From Current Price Level
$280 – Even – 1:1, -34.2% From Current Price Level
$276 – Sellers – 1.4:1, -35.14% From Current Price Level
$272 – Buyers – 1.17:1, -36.08% From Current Price Level
$268 – Buyers – 2:1, -37.02% From Current Price Level
$264 – Sellers – 1.67:1, -37.96% From Current Price Level
$260 – Buyers – 2.25:1, -38.9% From Current Price Level
$256 – Sellers – 2.33:1, -39.84% From Current Price Level
$252 – Buyers – 2:1, -40.78% From Current Price Level
$248 – Buyers – 0.2:0*, -41.72% From Current Price Level
$244 – Sellers – 3:1, -42.66% From Current Price Level
$240 – NULL – 0:0*, -43.6% From Current Price Level
*** I DO NOT OWN SHARES OR OPTIONS CONTRACT POSITIONS IN SPY, QQQ, IWM OR DIA AT THE TIME OF PUBLISHING THIS ARTICLE ***
The VIX closed at 17.35, indicating an implied one day move of +/-1.09% & an implied one month move of +/-5.01% for the S&P 500.
Highest Technical Rated S&P 500 Components Per 12/31/2024’s Close:
1 – PLTR
2 – TSLA
3 – UAL
4 – AVGO
5 – TPR
6 – AXON
7 – CCL
8 – VST
9 – EXPE
10 – RCL
Lowest Technical Rated S&P 500 Components Per 12/31/2024’s Close:
1 – SMCI
2 – CE
3 – MRNA
4 – ENPH
5 – MCHP
6 – MU
7 – NUE
8 – CVS
9 – INTC
10 – REGN
Highest Volume Rated S&P 500 Components Per 12/31/2024’s Close:
1 – TSN
2 – VRSN
3 – PKG
4 – NRG
5 – DOV
6 – EQR
7 – VICI
8 – PLD
9 – FICO
10 – O
Lowest Volume Rated S&P 500 Components Per 12/31/2024’s Close:
1 – HSIC
2 – SMCI
3 – JNPR
4 – WAT
5 – SYY
6 – SYF
7 – LVS
8 – GM
9 – KEYS
10 – FOXA
Highest Technical Rated ETFs Per 12/31/2024’s Close:
1 – TSLR
2 – TSLT
3 – TSLL
4 – VCAR
5 – TSL
6 – BITW
7 – BZQ
8 – BTFX
9 – WANT
10 – WEBL
Lowest Technical Rated ETFs Per 12/31/2024’s Close:
1 – MSOX
2 – TSLZ
3 – TSDD
4 – TSLQ
5 – CNBS
6 – KORU
7 – MEXX
8 – BCHG
9 – TSLS
10 – MRNY
Highest Volume Rated ETFs Per 12/31/2024’s Close:
1 – JANT
2 – JANW
3 – AUGT
4 – OOSP
5 – SHUS
6 – SEPW
7 – SRHR
8 – AUGW
9 – FELV
10 – FBCG
Lowest Volume Rated ETFs Per 12/31/2024’s Close:
1 – USCA
2 – GSID
3 – XAUG
4 – PCRB
5 – FDGR
6 – QMAG
7 – RAYE
8 – GAUG
9 – ASIA
10 – FDCE
Highest Technical Rated General Stocks Per 12/31/2024’s Close:
1 – COEP
2 – OST
3 – QNCCF
4 – CTM
5 – RGTI
6 – NUKK
7 – QUBT
8 – LAES
9 – KULR
10 – PDYN
Lowest Technical Rated General Stocks Per 12/31/2024’s Close:
1 – EFSH
2 – GOEV
3 – CYN
4 – UPC
5 – CRKN
6 – AILE
7 – EQC
8 – LICN
9 – MGOL
10 – QTTB
Highest Volume Rated General Stocks Per 12/31/2024’s Close:
1 – APM
2 – VRME
3 – ONCO
4 – OUT
5 – ITP
6 – FLYE
7 – NCI
8 – NEXA
9 – ABTS
10 – BHAT
Lowest Volume Rated General Stocks Per 12/31/2024’s Close:
1 – BNPQF
2 – SMREF
3 – SAGGF
4 – IGOT
5 – MTLFF
6 – DBIN
7 – OMTK
8 – GRCMF
9 – PFHO
10 – CNNEF
*** THE LIST ABOVE IS STRICTLY FOR INFORMATIONAL PURPOSES – I MAY OR MAY NOT HAVE OR INITIATE A LONG, SHORT, OR LONG/SHORT POSITION IN ANY NAME ABOVE AT ANY TIME ***
SPY, the SPDR S&P 500 ETF added +0.65% last week, while the VIX closed at 15.95, indicating an implied one day move of +/-1.01% & a one month implied move of +/-4.61%.
SPY ETF – SPDR S&P 500 ETF’s Technical Performance Over The Past Year
Their RSI just broke bearishly through the neutral 50 level & sits currently at 49.32, while their MACD has resumed its bearish descent.
Volumes were -14.68% lower than the prior year’s average (49,277,500 vs. 57,755,675), which is notable as Friday’s declining session had the highest volume of the shortened holiday week.
Monday continued the short-term reversal that was set into motion with the prior Friday’s breakout above the 50 day moving average’s resistance.
It should be noted though that the fragility noted in last week’s note was still in play on Monday, as the session opened above the 50 DMA’s support, but temporarily dipped below it, indicating that there was still downside appetite among investors, despite SPY powering higher to close close to the 10 DMA’s resistance.
Tuesday opened on a gap up to just below the 10 DMA, before powering higher to close above it, however the volume was weak, which can be attributed to the shortened trading session.
Christmas was Wednesday so there was no trading, but Thursday signaled that weakness was setting in.
Thursday SPY opened slightly lower, tested down to midway down Tuesday’s candle’s real body, before testing slightly above its close & settling marginally up for the day.
This set up Friday’s opening gap down to complete an evening star bearish pattern, as Friday opened just above the 10 DMA’s support, before breaking all the way down to the 50 DMA & settling down for the day on the week’s highest volume.
As noted in last week’s market note, the relationship between price & the 10 & 50 day moving averages will still be an area to focus on heading into the new year.
While volumes last week were higher relative to the weekly volumes of the past few months, they still were not high enough to drive a meaningful upward movement that would gather any traction.
Without seeing a meaningful increase in upside volume the evening star pattern will be in main focus moving into this week & next, particularly given how much profit taking took place on Friday.
As of writing this the 50 DMA’s support broke down already, leaving less support levels between SPY’s price & the long term trend (200 DMA).
Should prices test the $580-584.99 price level they should have strong support given that there are three touch-points in that zone & that it has historically been dominated by Buyers at a rate of 1.86:1.
Should that break down the $570-579.99 price zones will be interesting to watch, as there are no formal support levels in that range, but there is Buyer dominated support at $570-574.99/share at a rate of 4.5:1.
If that window breaks down there is no support until $565.99/share, which occurs in a Seller dominated zone at a rate of 2:1 historically over the past ~2 years.
Declining to that support level would be a ~-5% decline from Friday’s close, and would open up SPY to further near-term declines based on support levels, which will be examined in more detail in next week’s note.
SPY has support at the $590.88 (50 Day Moving Average, Volume Sentiment: NULL, 0:0*), $584.15 (Volume Sentiment: Buyers, 1.86:1), $581.90 (Volume Sentiment: Buyers, 1.86:1) & $580.91/share (Volume Sentiment: Buyers, 1.86:1) price levels & resistance at the $596.11 (10 Day Moving Average, Volume Sentiment: NULL, 0:0*), $598.16 (Volume Sentiment: NULL, 0:0*), $602.48 (Volume Sentiment: NULL, 0:0*) & $607.03/share (All-Time High, Volume Sentiment: NULL, 0:0*) price levels.
SPY ETF’s Price Level:Volume Sentiment Over The Past ~2 Years
QQQ, the Invesco QQQ Trust ETF advanced +0.75% last week, as the tech heavy index was the most favored of the major four index ETFs.
QQQ ETF – Invesco QQQ Trust ETF’s Technical Performance Over The Past Year
Their RSI is bearishly approaching the neutral 50 mark & sits currently at 53.17, while their MACD is continuing bearishly lower.
Volumes were -32.54% lower than the prior year’s average level (25,052,500 vs. 37,137,143), as market participants were very cautious to approach the tech heavy index.
Much like last week, QQQ’s chart is quite similar this week to SPY’s, as Monday kicked off continuing the ascent of Friday’s session on an opening gap up that temporarily retraced into Friday’s range, before climbing to close the day higher.
Tuesday opened on a gap up that opened near the 10 day moving average’s resistance & managed to break out above it to close higher on the day, but on the lowest volume of the week, indicating that there was waning sentiment among market participants.
Thursday was also a low volume session that opened lower, tested midway through Tuesday’s trading range, before testing slightly higher & closing above its open, but still as a declining session.
The indecision shown by the spinning top candle & low volume set up QQQ for Friday’s gap down session to complete the evening star pattern, as Friday opened just above the 10 day moving average’s support before breaking down through it & testing lower than Monday’s opening price for QQQ.
While it managed to close above Monday’s closing price, there was a big warning sign flashed last week, which will bring all attention to QQQ’s price & the relationship between it & the 10 & 50 day moving averages.
Should the support of the 50 DMA break down for QQQ, as per Friday’s closing price levels there was only a -7.11% spread between the two support levels, which should the top one break down may indicate trouble on the horizon.
This is especially true if the $493.69/share support level breaks down, as it lies in the $492-495.99/share price zone which is the strongest Buyer:Seller zone for QQQ, where Buyers have historically exceeded Sellers 17.25:1.
If this breaks down then there is a severe reversal in sentiment, as most price action around this area has tended to result in gaps up or down around the zone, with limited trading activity within it (most of which is clearly advancing).
QQQ has support at the $514.75 (Volume Sentiment: NULL, 0:0*), $508.89 (50 Day Moving Average, Volume Sentiment: NULL, 0:0*), $508.47 (Volume Sentiment: NULL, 0:0*) & $502.00/share (Volume Sentiment: Buyers, 2:0*) price levels & resistance at the $525.37 (10 Day Moving Average, Volume Sentiment: NULL, 0:0*), $531.24 (Volume Sentiment: NULL, 0:0*) & $538.28/share (All-Time High, Volume Sentiment: NULL, 0:0*) price levels.
QQQ ETF’s Price Level:Volume Sentiment Over The Past ~2 Years
IWM ETF – iShares Russell 2000 ETF’s Technical Performance Over The Past Year
Their RSI is trending bearishly & currently sits at 38.47 & their MACD is still bearish, but the histogram is tapering off & it has begun to flatten out; next week will tell whether it continues lower or not.
Volumes were -28.63% lower than the previous year’s average level (22,515,000 vs. 31,547,937), as the hesitancy to buy stocks on the shortened holiday week also impacted the small cap index.
Monday opened slightly lower on the strongest volume of the week, but the upper & lower shadow signaled that there was a lot of appetite to both the upside & downside, but the real body being concentrated at the top of the candle indicates that there was short-term upside potential.
Tuesday opened on a gap up, tested to the downside, but managed to continue higher & closed for an advancing day, however this happened on the lowest volume of the year for IWM, signaling that there was not much strength & conviction behind the move.
Thursday confirmed that the weakness was setting in, as the session opened lower & tested lower, before rallying up to the 10 DMA’s resistance & closing just below it.
While the volume on Thursday was the second highest of the week, it was still not much to write home about & the uncertainty remained in the air.
Friday opened midway between Thursday’s range, made a run at the 10 DMA’s resistance, got rejected & the floodgates opened with IWM briefly dipping below Monday’s opening price, but recovering to still end the session lower on the day.
Small caps look to be in a bit of trouble, as Friday’s closing price would hit the 200 DMA if it declined -4.3%.
In the near-term IWM looks like an area to tread carefully around, given that their medium term trend is above the short-term trend (50 & 10 DMAs), which are both above their current price level.
While there are many support levels near their current price, they’ve also dipped below a resistance zone, which will require an uptick in volume to break through.
For the rest of the week it would be wise to watch to gain clues & insight into market participant sentiment towards IWM & the small cap names to see how things may kick off in the first month of the new year.
IWM has support at the $221.04 (Volume Sentiment: Buyers, 2:1), $218.07 (Volume Sentiment: Buyers, 1.4:1), $216.73 (Volume Sentiment: Buyers, 1.4:1) & $214.01/share (Volume Sentiment: Sellers, 1.5:1) price levels & resistance at the $223.51 (Volume Sentiment: Buyers, 2:1), $225.20 (Volume Sentiment: Sellers, 2:1), $225.27 (10 Day Moving Average, Volume Sentiment: Sellers, 2:1) & $225.73/share (Volume Sentiment: Sellers, 2:1) price levels.
IWM ETF’s Price Level:Volume Sentiment Over The Past ~2 Years
DIA ETF – SPDR Dow Jones Industrial Average ETF’s Technical Performance Over The Past Year
Their RSI is trending bearishly further, sitting currently at 42.81, while their MACD remains bearish, but has flattened out over the past week <FINISH THIS LATER>
Volumes were -38.92% lower than the prior year’s average level (2,082,500 vs. 3,409,683), as there was a very low participation rate during the holiday week.
Monday the week kicked off on a bullish note, advancing for the day on the week’s highest volume.
Tuesday also saw gains for DIA, but on very low volume that was unable to break above the 10 DMA & the session closed in-line with it.
Thursday opened lower, before powering through the 10 DMA to test & get rejected by the 50 DMA’s resistance, but prices managed to close just beneath it.
Friday showed a rush to the exits & profits were taken after the gains of the short week, as the session opened on a gap down, tested higher to briefly break above the resistance of the 10 DMA, but ultimately closed lower on the day as a high wave spinning top candle.
Friday featured the second highest volume of the week as well, indicating that there was a great deal of bearish sentiment out there for DIA.
Heading into this week keep an eye out for any volume shifts, as that will provide clues into whether or not there will be pains or gains heading into the new year.
The chart below outlines DIA’s support & resistance levels with their volume sentiments over the past 3-4 years.
DIA has support at the $428.40 (Volume Sentiment: Buyers, 1.4:1), $421.72 (Volume Sentiment: Buyers, 3.2:1), $414.99 (Volume Sentiment: Buyers, 3:1) & $413.73/share (Volume Sentiment: Buyers, 3:1) price levels & resistance at the $430.90 (10 Day Moving Average, Volume Sentiment: Buyers, 1.4:1), $431.69 (Volume Sentiment: Buyers, 1.4:1), $433.67 (Volume Sentiment: Buyers, 0.6:0*) & $433.91/share (50 Day Moving Average, Volume Sentiment: Buyers, 0.6:0*) price levels.
DIA ETF’s Price Level:Volume Sentiment Over The Past 3-4 Years
The Week Ahead
The week kicks off Monday with Chicago Business Barometer (PMI) data at 9:45 am, followed by Pending Home Sales data at 10 am & there are no major earnings announcements scheduled.
Tuesday the year winds down with S&P Case-Shiller Home Price Index (20 Cities) data at 9 am & there are no earnings reports scheduled for release.
Wednesday is New Year’s Day & there is no economic data or earning’s announcements.
Thursday the year kicks off with Initial Jobless Claims Data at 8:30 am, followed by Construction Spending data at 10 am & Resources Connection reports earnings to kick the new year off after the session’s close.
Friday the week winds down with ISM Manufacturing data at 10 am & there are no earnings reports scheduled for the day.
See you back here next week!
*** I DO NOT OWN SHARES OR OPTIONS CONTRACT POSITIONS IN SPY, QQQ, IWM OR DIA AT THE TIME OF PUBLISHING THIS ARTICLE ***
The VIX closed at 15.95, indicating an implied one day move of +/-1.01% & an implied one month move of +/-4.61% for the S&P 500.
Highest Technical Rated S&P 500 Components Per 12/27/2024’s Close:
1 – PLTR
2 – TSLA
3 – UAL
4 – AVGO
5 – TPR
6 – VST
7 – GDDY
8 – FOX
9 – CCL
10 – ANET
Lowest Technical Rated S&P 500 Components Per 12/27/2024’s Close:
1 – MRNA
2 – CE
3 – SMCI
4 – DVN
5 – CVS
6 – NUE
7 – MCHP
8 – REGN
9 – DG
10 – AES
Highest Volume Rated S&P 500 Components Per 12/27/2024’s Close:
1 – AJG
2 – NRG
3 – PKG
4 – LW
5 – MCHP
6 – VTR
7 – O
8 – NFLX
9 – AVY
10 – EW
Lowest Volume Rated S&P 500 Components Per 12/27/2024’s Close:
1 – IEX
2 – HSIC
3 – ERIE
4 – IQV
5 – FOXA
6 – A
7 – LVS
8 – LYV
9 – SYF
10 – CMI
Highest Technical Rated ETFs Per 12/27/2024’s Close:
1 – HYBI
2 – TSLT
3 – TSLR
4 – TSLL
5 – VCAR
6 – TSL
7 – BITW
8 – WANT
9 – BZQ
10 – DEFG
Lowest Technical Rated ETFs Per 12/27/2024’s Close:
1 – MSOX
2 – TSLZ
3 – TSDD
4 – TSLQ
5 – TSLS
6 – SARK
7 – MSOS
8 – KORU
9 – WEED
10 – MRNY
Highest Volume Rated ETFs Per 12/27/2024’s Close:
1 – GENM
2 – FLHK
3 – FLAX
4 – JANQ
5 – TAFL
6 – JANP
7 – PBL
8 – PBOC
9 – HYXU
10 – BCUS
Lowest Volume Rated ETFs Per 12/27/2024’s Close:
1 – USCA
2 – USCL
3 – FDVL
4 – ZTRE
5 – FDTB
6 – ZTWO
7 – UJUN
8 – WBND
9 – JULW
10 – FDGR
Highest Technical Rated General Stocks Per 12/27/2024’s Close:
1 – LAES
2 – RGTI
3 – KULR
4 – QNCCF
5 – QUBT
6 – QMCO
7 – CTM
8 – NUKK
9 – PDYN
10 – UMAC
Lowest Technical Rated General Stocks Per 12/27/2024’s Close:
1 – CYTOF
2 – CYN
3 – MGOL
4 – GOEV
5 – QTTB
6 – EQC
7 – SONX
8 – SYRS
9 – APLT
10 – ADTX
Highest Volume Rated General Stocks Per 12/27/2024’s Close:
1 – INTZ
2 – ETRXF
3 – AILE
4 – MAMA
5 – CCTG
6 – ATRX
7 – GTI
8 – WIMI
9 – LIDR
10 – FCUV
Lowest Volume Rated General Stocks Per 12/27/2024’s Close:
1 – GRCMF
2 – BNPQF
3 – EMMA
4 – OIBZQ
5 – TIMCF
6 – PNBK
7 – FWEDF
8 – GRAF
9 – BTTC
10 – ARTH
*** THE LIST ABOVE IS STRICTLY FOR INFORMATIONAL PURPOSES – I MAY OR MAY NOT HAVE OR INITIATE A LONG, SHORT, OR LONG/SHORT POSITION IN ANY NAME ABOVE AT ANY TIME ***
The VIX closed at 14.73, indicating an implied one day move of +/-0.93% & an implied one month move of +/-4.26% for the S&P 500.
Highest Technical Rated S&P 500 Components Per 12/26/2024’s Close:
1 – PLTR
2 – TSLA
3 – UAL
4 – AVGO
5 – AXON
6 – TPR
7 – VST
8 – CCL
9 – GDDY
10 – APO
Lowest Technical Rated S&P 500 Components Per 12/26/2024’s Close:
1 – MRNA
2 – CE
3 – SMCI
4 – DVN
5 – CVS
6 – NUE
7 – MCHP
8 – DG
9 – REGN
10 – AES
Highest Volume Rated S&P 500 Components Per 12/26/2024’s Close:
1 – NDSN
2 – LW
3 – PAYX
4 – POOL
5 – AFL
6 – MLM
7 – PLD
8 – MKC
9 – LEN
10 – TFX
Lowest Volume Rated S&P 500 Components Per 12/26/2024’s Close:
1 – APO
2 – AON
3 – SPG
4 – ERIE
5 – PCG
6 – JNPR
7 – BKNG
8 – PFG
9 – CRWD
10 – RVTY
Highest Technical Rated ETFs Per 12/26/2024’s Close:
1 – TSLT
2 – TSLR
3 – TSLL
4 – TSL
5 – VCAR
6 – WANT
7 – BITW
8 – QQQU
9 – MAGX
10 – WEBL
Lowest Technical Rated ETFs Per 12/26/2024’s Close:
1 – TSLZ
2 – TSDD
3 – TSLQ
4 – MSOX
5 – TSLS
6 – SARK
7 – UVIX
8 – MRNY
9 – MSOS
10 – WEED
Highest Volume Rated ETFs Per 12/26/2024’s Close:
1 – DWCR
2 – JANQ
3 – EBIZ
4 – XMAY
5 – NSCR
6 – KDRN
7 – XFEB
8 – HEAT
9 – ONLN
10 – HF
Lowest Volume Rated ETFs Per 12/26/2024’s Close:
1 – USCA
2 – GSID
3 – KAUG
4 – XNOV
5 – FDTB
6 – CPLB
7 – FDVL
8 – FDGR
9 – SMCO
10 – DRAI
Highest Technical Rated General Stocks Per 12/26/2024’s Close:
1 – LAES
2 – KULR
3 – RGTI
4 – QUBT
5 – NUKK
6 – CTM
7 – QMCO
8 – QNCCF
9 – UMAC
10 – WKEY
Lowest Technical Rated General Stocks Per 12/26/2024’s Close:
1 – AILE
2 – LTRPB
3 – CYTOF
4 – EFSH
5 – GTI
6 – SOBR
7 – UPC
8 – ADTX
9 – QTTB
10 – LICN
Highest Volume Rated General Stocks Per 12/26/2024’s Close:
1 – MGIH
2 – AIRE
3 – SSY
4 – TWO
5 – COEP
6 – SPRC
7 – WAFU
8 – LKCO
9 – XELB
10 – BCG
Lowest Volume Rated General Stocks Per 12/26/2024’s Close:
1 – QMCI
2 – TPTW
3 – CYCA
4 – BNPQF
5 – AAUCF
6 – PSYTF
7 – VPRB
8 – JPOTF
9 – WEXPF
10 – RHHBF
*** THE LIST ABOVE IS STRICTLY FOR INFORMATIONAL PURPOSES – I MAY OR MAY NOT HAVE OR INITIATE A LONG, SHORT, OR LONG/SHORT POSITION IN ANY NAME ABOVE AT ANY TIME ***