The VIX closed at 13.54, indicating an implied one day move of +/-0.85% & an implied one month move of +/-3.91% for the S&P 500.
Highest Technical Rated S&P 500 Components Per 12/5/2024’s Close:
1 – PLTR
2 – AXON
3 – UAL
4 – TSLA
5 – VST
6 – TPL
7 – RCL
8 – CCL
9 – TPR
10 – GDDY
Lowest Technical Rated S&P 500 Components Per 12/5/2024’s Close:
1 – CE
2 – MRNA
3 – MCHP
4 – QRVO
5 – ENPH
6 – MPWR
7 – WBA
8 – INTC
9 – HII
10 – AES
Highest Volume Rated S&P 500 Components Per 12/5/2024’s Close:
1 – SNPS
2 – UBER
3 – BALL
4 – FI
5 – CE
6 – DG
7 – PPG
8 – ANSS
9 – MKTX
10 – LULU
Lowest Volume Rated S&P 500 Components Per 12/5/2024’s Close:
1 – WYNN
2 – WST
3 – LVS
4 – AVB
5 – YUM
6 – EBAY
7 – WDC
8 – VST
9 – PPL
10 – DVA
Highest Technical Rated ETFs Per 12/5/2024’s Close:
1 – TSLR
2 – TSLL
3 – TSLT
4 – GXLM
5 – BITW
6 – DEFG
7 – TSL
8 – VCAR
9 – BITX
10 – ZCSH
Lowest Technical Rated ETFs Per 12/5/2024’s Close:
1 – MSOX
2 – TSLZ
3 – TSDD
4 – TSLQ
5 – MRNY
6 – TSLS
7 – UVIX
8 – NVDQ
9 – NVD
10 – SARK
Highest Volume Rated ETFs Per 12/5/2024’s Close:
1 – AGIH
2 – FDGR
3 – LYLD
4 – FDCE
5 – FDVL
6 – BLDG
7 – NANR
8 – WLTG
9 – FDTB
10 – QSWN
Lowest Volume Rated ETFs Per 12/5/2024’s Close:
1 – SEPT
2 – ZTWO
3 – OVT
4 – ZTRE
5 – USCA
6 – BHYB
7 – XSMO
8 – RAYD
9 – CCNR
10 – SPTB
Highest Technical Rated General Stocks Per 12/5/2024’s Close:
1 – XCUR
2 – QUBT
3 – LEEED
4 – UMAC
5 – BTCT
6 – CBDS
7 – AGFY
8 – KULR
9 – MFG
10 – MFH
Lowest Technical Rated General Stocks Per 12/5/2024’s Close:
1 – JL
2 – MOND
3 – RLMD
4 – EFSH
5 – SAVA
6 – ELPW
7 – APLT
8 – UPC
9 – RIME
10 – ABP
Highest Volume Rated General Stocks Per 12/5/2024’s Close:
1 – RKDA
2 – TARA
3 – OUT
4 – PBM
5 – FOXX
6 – BJDX
7 – MIGI
8 – STSS
9 – STRW
10 – BRTX
Lowest Volume Rated General Stocks Per 12/5/2024’s Close:
1 – FLMMF
2 – ASRE
3 – STPGF
4 – KSSRF
5 – ADMT
6 – AAUCF
7 – FBAK
8 – BNPQF
9 – DBIN
10 – CTXXF
*** THE LIST ABOVE IS STRICTLY FOR INFORMATIONAL PURPOSES – I MAY OR MAY NOT HAVE OR INITIATE A LONG, SHORT, OR LONG/SHORT POSITION IN ANY NAME ABOVE AT ANY TIME ***
XLK, the Technology Select Sector SPDR Fund ETF has gained +31.54% over the past year, advancing +32.99% from their 52-week low in December of 2023 & sitting just -0.04% below their 52-week high (all figures exclude distributions).
This has been an interesting year for technology related stocks, as the AI craze has caused a lot of the market’s upward movement, causing investors & speculators to dive into the market in hopes of not missing the boat.
With high flying names such as Apple Inc. (AAPL), NVIDIA Corp. (NVDA), Microsoft Corp. (MSFT), Broadcom Inc. (AVGO), Salesforce Inc. (CRM), Oracle Corp. (ORCL), Cisco Systems Inc. (CSCO), Adobe Inc. (ADBE), Advanced Micro Devices (AMD) & ServiceNow Inc. (NOW) it is easy to see how they’ve enjoyed such a strong year, given that these names have dominated financial media & headlines for 2024.
Given how close XLK is to its all time high it is worth checking in to see how market participants have behaved at their recent price levels in order to assess the strength or weakness of their current support levels in the event of a downside retest on the horizon.
Below is a brief technical analysis of XLK, as well as a price level:volume sentiment analysis of the price levels XLK has traded at over the ~2 years.
Included in this data is also their recent support & resistance levels so that readers can gain insight into how strong/weak these support/resistance levels may be in the future, based on past investor behavior.
It is not intended to serve as financial advice, but rather as an additional tool to reference while performing your own due diligence on XLK.
XLK, The Technology Select Sector SPDR Fund ETF’s Technical Performance Broken Down
XLK ETF – Technology Select Sector SPDR Fund ETF’s Technical Performance Over The Past Year
Their RSI is currently trending back down towards the neutral mark & sits at 63.9 after approaching the overbought level & their MACD is bullish but beginning to curl over bearishly today after yesterday’s gap up session.
Volumes were -33.52% below the previous year’s average over the past week & a half (3,758,571.43 vs. 5,654,110.67), as investors have become very skittish near their all-time high which was set on yesterday following a +1.83% gap up.
Last Monday kicked the shortened holiday week off on a bearish note when prices opened higher than Friday’s close, but throughout the day trended lower, eventually testing the support of the 10 day moving average before closing above it.
Tuesday’s session produced a harami cross, indicating that there was uncertainty around XLK’s price on a light volume session.
Wednesday opened on a gap lower, broke down through the 10 DMA’s support & approached the 50 DMA’s support but did not test it, instead rallying to close just below the 10 day moving average the day before Thanksgiving.
Friday naturally produced the lowest volume session of the past week & a half as it was a half day after a holiday, but XLK was able to open at the 10 DMA, test lower briefly, before powering through it & closing in the window created the day prior.
Monday continued the rally for XLK, as did Tuesday as the day’s lows were all ascending & above the 10 day moving average’s support.
Yesterday’s gap up session will be worth keeping an eye on in the coming days, particularly given that today’s session seems ready to close in a bearish harami formation, which would signal that there will likely be a closing of the window on the near-term horizon.
It will also be worth watching volume in the near term, as there will need to be some extra participation to continue marching XLK higher, and watching volume trends will make it easier to gauge when profits will be taken if prices are unable to continue higher.
The section below lays out how the buyers & sellers have met at each price level XLK has traded at over the past ~2 years.
While it is not indicative of future performance, history repeats itself & or rhymes & this can be used as a barometer to anticipate how market participants may behave when faced with these price levels again.
Price Level:Volume Sentiment Analysis For XLK, The Technology Select Sector SPDR Fund ETF
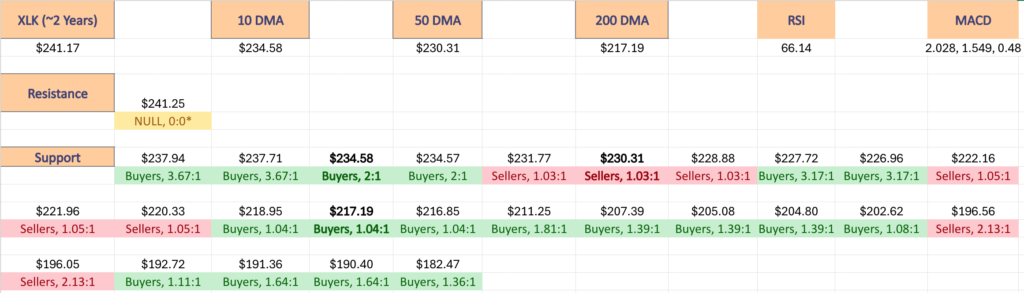
The top table below shows the support & resistance levels of XLK from the past year’s chart, as well as their price level:volume sentiment at each from data covering the past ~2 years, using Wednesday 11/20/24’s mid-session price for their price & moving averages/other technicals.
The moving averages are denoted with bold.
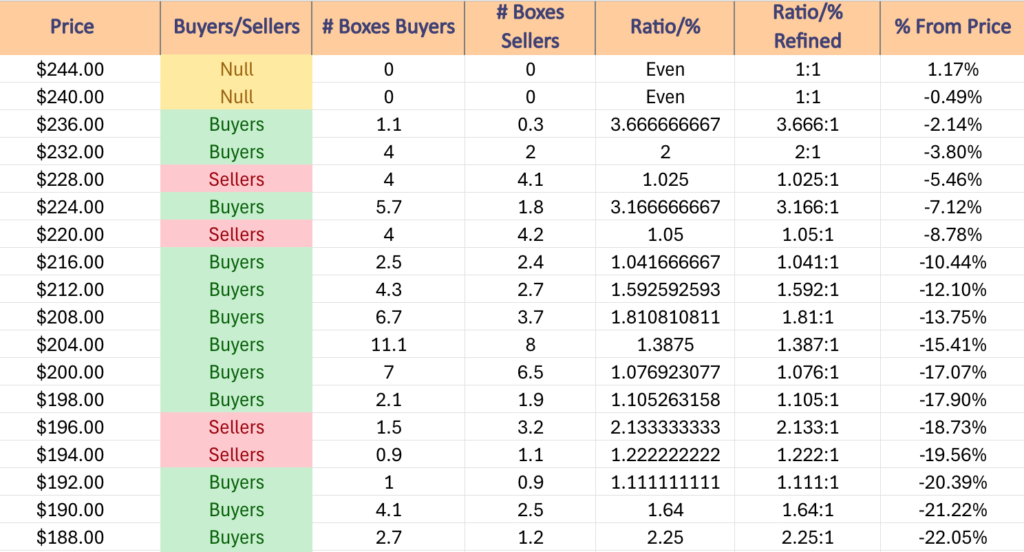
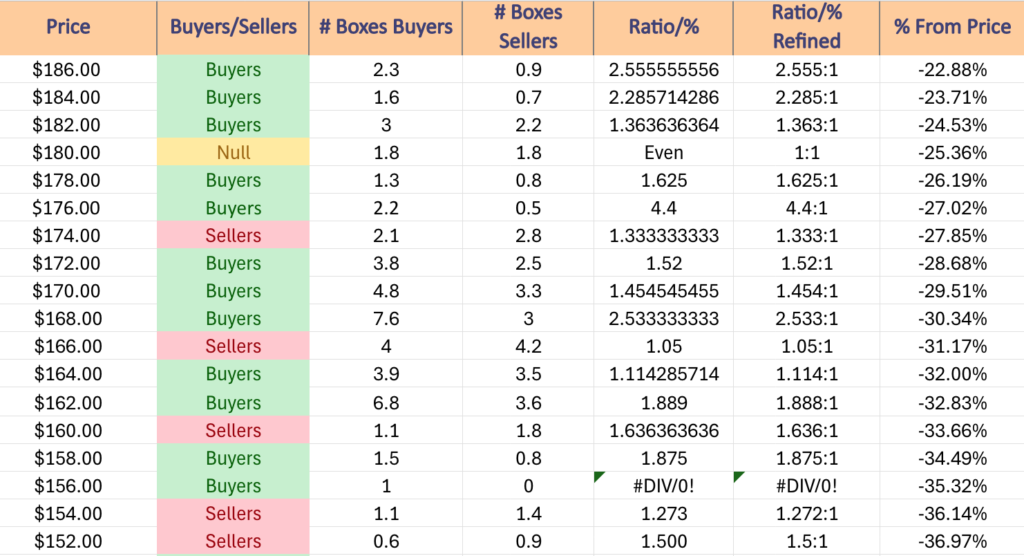
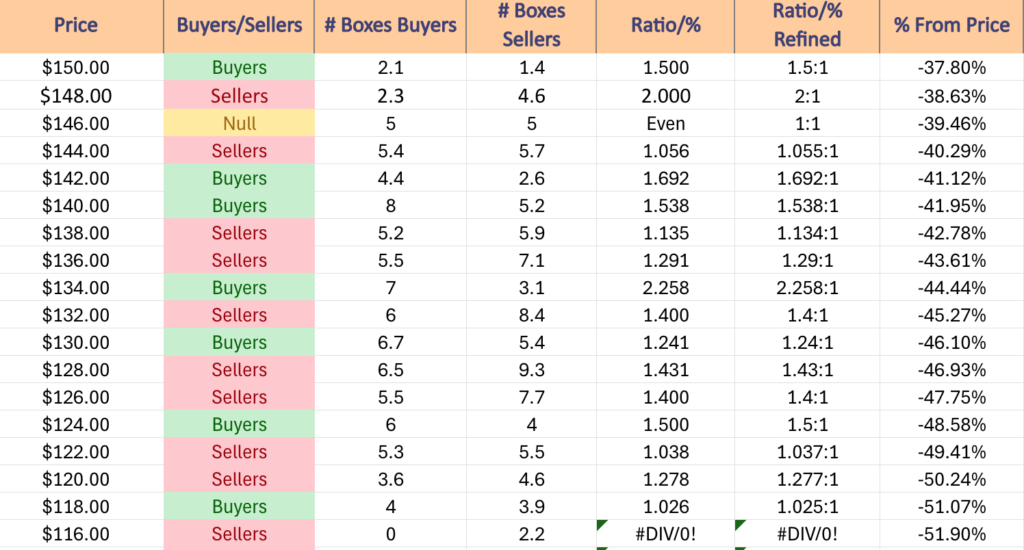
The next charts show the volume sentiment at each individual price level XLK has traded at over the past ~2 years.
Beneath them is a copy & pasteable list of the same data, where the support/resistance levels are denoted in bold.
All ratios with “0” in the denominator are denoted with a “*”.
NULL values are price levels that had limited trading volume, whether it be due to gaps, quick advances or they are at price extremes; in the event that they are retested & there is more data they would have a distinct “Buyers”, “Sellers” or “Even” title.
This is not intended as financial advice, but rather another tool to consider when performing your own research & due diligence on XLK.
XLK ETF’s Price Level:Volume Sentiment Over The Past ~2 Years At Past Year’s Support & Resistance Levels
XLK ETF’s Price Level:Volume Sentiment Over The Past ~2 Years
Price Level:Volume Sentiment For XLK ETF Over The Past ~2 Years
Price Level:Volume Sentiment For XLK ETF Over The Past ~2 Years
XLK ETF’s Price Level:Volume Sentiment Over The Past ~2 Years
$244 – NULL – 0:0*, +1.17% From Current Price Level
$240 – NULL – 0:0*, -0.49% From Current Price Level – Current Price Level*
$236 – Buyers – 3.67:1, -2.14% From Current Price Level
$232 – Buyers – 2:1, -3.8% From Current Price Level – 10 Day Moving Average*
$228 – Sellers – 1.03:1, -5.46% From Current Price Level – 50 Day Moving Average*
$224 – Buyers – 3.17:1, -7.12% From Current Price Level
$220 – Sellers – 1.05:1, -8.78% From Current Price Level
$216 – Buyers – 1.04:1, -10.44% From Current Price Level – 200 Day Moving Average*
$212 – Buyers – 1.59:1, -12.1% From Current Price Level
$208 – Buyers – 1.81:1, -13.75% From Current Price Level
$204 – Buyers – 1.39:1, -15.41% From Current Price Level
$200 – Buyers – 1.08:1, -17.07% From Current Price Level
$198 – Buyers – 1.11:1, -17.9% From Current Price Level
$196 – Sellers – 2.13:1, -18.73% From Current Price Level
$194 – Sellers – 1.22:1, -19.56% From Current Price Level
$192 – Buyers – 1.11:1, -20.39% From Current Price Level
$190 – Buyers – 1.64:1, -21.22% From Current Price Level
$188 – Buyers – 2.25:1, -22.05% From Current Price Level
$186 – Buyers – 2.56:1, -22.88% From Current Price Level
$184 – Buyers – 2.29:1, -23.71% From Current Price Level
$182 – Buyers – 1.36:1, -24.53% From Current Price Level
$180 – Even – 1:1, -25.36% From Current Price Level
$178 – Buyers, 1.63:1, -26.19% From Current Price Level
$176 – Buyers – 4.4:1, -27.02% From Current Price Level
$174 – Sellers – 1.33:1, -27.85% From Current Price Level
$172 – Buyers – 1.52:1, -28.68% From Current Price Level
$170 – Buyers – 1.45:1, -29.51% From Current Price Level
$168 – Buyers – 2.53:1, -30.34% From Current Price Level
$166 – Sellers – 1.05:1, -31.17% From Current Price Level
$164 – Buyers – 1.11:1, -32% From Current Price Level
$162 – Buyers – 1.89:1, -32.83% From Current Price Level
$160 – Sellers – 1.64:1, -33.66% From Current Price Level
$158 – Buyers – 1.88:1, -34.49% From Current Price Level
$156 – Buyers – 1:0*, -35.32% From Current Price Level
$154 – Sellers – 1.27:1, -36.14% From Current Price Level
$152 – Sellers – 1.5:1, -36.97% From Current Price Level
$150 – Buyers – 1.5:1, -37.8% From Current Price Level
$148 – Sellers – 1.2:1, -38.63% From Current Price Level
$146 – Even – 1:1, -39.46% From Current Price Level
$144 – Sellers – 1.06:1, -40.29% From Current Price Level
$142 – Buyers – 1.69:1, -41.12% From Current Price Level
$140 – Buyers – 1.54:1, -41.95% From Current Price Level
$138 – Sellers – 1.13:1, -42.78% From Current Price Level
$136 – Sellers – 1.29:1, -43.61% From Current Price Level
$134 – Buyers – 2.26:1, -44.44% From Current Price Level
$132 – Sellers – 1.4:1, -45.27% From Current Price Level
$130 – Buyers – 1.24:1, -46.1% From Current Price Level
$128 – Sellers – 1.43:1, -46.93% From Current Price Level
$126 – Sellers – 1.4:1, -47.75% From Current Price Level
$124 – Buyers – 1.5:1, -48.58% From Current Price Level
$122 – Sellers – 1.04:1, -49.41% From Current Price Level
$120 – Sellers – 1.28:1, -50.24% From Current Price Level
$118 – Buyers – 1.03:1, -51.07% From Current Price Level
$116 – Sellers – 2.2:0*, -51.9% From Current Price Level
$114 – Sellers – 2.5:0*, -52.73% From Current Price Level
$112 – NULL – 0:0*, -53.56% From Current Price Level
*** I DO NOT OWN SHARES OR OPTIONS CONTRACT POSITIONS IN XLK AT THE TIME OF PUBLISHING THIS ARTICLE ***
The VIX closed at 13.45, indicating an implied one day move of +/-0.85% & an implied one month move of +/-3.89% for the S&P 500.
Highest Technical Rated S&P 500 Components Per 12/4/2024’s Close:
1 – PLTR
2 – AXON
3 – UAL
4 – VST
5 – TSLA
6 – TPL
7 – CCL
8 – RCL
9 – TPR
10 – GDDY
Lowest Technical Rated S&P 500 Components Per 12/4/2024’s Close:
1 – ANET
2 – CE
3 – MRNA
4 – QRVO
5 – MPWR
6 – MCHP
7 – ENPH
8 – WBA
9 – HII
10 – REGN
Highest Volume Rated S&P 500 Components Per 12/4/2024’s Close:
1 – CRM
2 – GL
3 – HSY
4 – CPB
5 – MKTX
6 – ED
7 – LYV
8 – PCG
9 – LYB
10 – JKHY
Lowest Volume Rated S&P 500 Components Per 12/4/2024’s Close:
1 – ERIE
2 – FTV
3 – ENPH
4 – GLW
5 – DVA
6 – HSIC
7 – CTSH
8 – CAT
9 – WRB
10 – WST
Highest Technical Rated ETFs Per 12/4/2024’s Close:
1 – TSLR
2 – TSLL
3 – TSLT
4 – HZEN
5 – GXLM
6 – BITW
7 – DEFG
8 – ZCSH
9 – TSL
10 – BITX
Lowest Technical Rated ETFs Per 12/4/2024’s Close:
1 – MSOX
2 – TSLZ
3 – TSDD
4 – TSLQ
5 – UVIX
6 – SARK
7 – NVDQ
8 – MRNY
9 – NVD
10 – TSLS
Highest Volume Rated ETFs Per 12/4/2024’s Close:
1 – XHYT
2 – MOTI
3 – KCCA
4 – RHRX
5 – HIYS
6 – MDCP
7 – HIBL
8 – RFDA
9 – BEEZ
10 – GGM
Lowest Volume Rated ETFs Per 12/4/2024’s Close:
1 – EMCS
2 – ZTRE
3 – PSMD
4 – BHYB
5 – SEPT
6 – AAPR
7 – TSEC
8 – MINN
9 – BCIL
10 – GGUS
Highest Technical Rated General Stocks Per 12/4/2024’s Close:
1 – QUBT
2 – XCUR
3 – LEEED
4 – AGFY
5 – BTCT
6 – UMAC
7 – DRUG
8 – CBDS
9 – MNPR
10 – MVST
Lowest Technical Rated General Stocks Per 12/4/2024’s Close:
1 – CETX
2 – SAVA
3 – MOND
4 – EFSH
5 – ELAB
6 – ELPW
7 – RLMD
8 – ADD
9 – APLT
10 – LUXH
Highest Volume Rated General Stocks Per 12/4/2024’s Close:
1 – SLG
2 – HTOO
3 – SMX
4 – ERNA
5 – CANF
6 – CNEY
7 – CYCN
8 – RLMD
9 – CHR
10 – BNRG
Lowest Volume Rated General Stocks Per 12/4/2024’s Close:
1 – SMAGF
2 – DBIN
3 – IEGCF
4 – PSHIF
5 – CIAFF
6 – ORZCF
7 – BNPQF
8 – VXTRF
9 – FLMMF
10 – ARBV
*** THE LIST ABOVE IS STRICTLY FOR INFORMATIONAL PURPOSES – I MAY OR MAY NOT HAVE OR INITIATE A LONG, SHORT, OR LONG/SHORT POSITION IN ANY NAME ABOVE AT ANY TIME ***
The VIX closed at 13.3, indicating an implied one day move of +/-0.84% & an implied one month move of +/-3.84% for the S&P 500.
Highest Technical Rated S&P 500 Components Per 12/3/2024’s Close:
1 – PLTR
2 – TPL
3 – AXON
4 – UAL
5 – TSLA
6 – VST
7 – TPR
8 – RCL
9 – CCL
10 – FICO
Lowest Technical Rated S&P 500 Components Per 12/3/2024’s Close:
1 – CE
2 – MRNA
3 – QRVO
4 – MPWR
5 – ENPH
6 – AES
7 – HII
8 – REGN
9 – WBA
10 – DG
Highest Volume Rated S&P 500 Components Per 12/3/2024’s Close:
1 – PCG
2 – HSY
3 – CTLT
4 – SMCI
5 – LYV
6 – WTW
7 – AON
8 – CRM
9 – CZR
10 – TPR
Lowest Volume Rated S&P 500 Components Per 12/3/2024’s Close:
1 – EXPE
2 – K
3 -PHM
4 – GRMN
5 – BLDR
6 – BA
7 – MCO
8 – SHW
9 – JCI
10 – BSX
Highest Technical Rated ETFs Per 12/3/2024’s Close:
1 – GXLM
2 – TSLR
3 – TSLL
4 – TSLT
5 – BITW
6 – TSL
7 – DEFG
8 – BITX
9 – VCAR
10 – ZCSH
Lowest Technical Rated ETFs Per 12/3/2024’s Close:
1 – MSOX
2 – TSLZ
3 – TSDD
4 – TSLQ
5 – UVIX
6 – MRNY
7 – TSLS
8 – SARK
9 – NVDQ
10 – NVD
Highest Volume Rated ETFs Per 12/3/2024’s Close:
1 – PBJA
2 – PBMY
3 – PBFR
4 – KORU
5 – ULVM
6 – NZAC
7 – LCF
8 – EYEG
9 – DRAI
10 – PBFB
Lowest Volume Rated ETFs Per 12/3/2024’s Close:
1 – UNIY
2 – BBEM
3 – SIXJ
4 – GSID
5 – SIXP
6 – ZTRE
7 – SDFI
8 – CRVT
9 – FDVL
10 – SIXZ
Highest Technical Rated General Stocks Per 12/3/2024’s Close:
1 – CBDS
2 – LEEED
3 – QUBT
4 – KULR
5 – DRUG
6 – AGFY
7 – BARUF
8 – BTCT
9 – MVST
10 – RCAT
Lowest Technical Rated General Stocks Per 12/3/2024’s Close:
1 – SAVA
2 – ELAB
3 – EFSH
4 – ELPW
5 – ADD
6 – SMX
7 – CRKN
8 – YYAI
9 – LUXH
10 – SYRS
Highest Volume Rated General Stocks Per 12/3/2024’s Close:
1 – CTNT
2 – PSQH
3 – GWAV
4 – SHIM
5 – JYD
6 – CHR
7 – CNUCF
8 – ATIP
9 – CHRS
10 – LITM
Lowest Volume Rated General Stocks Per 12/3/2024’s Close:
1 – CIAFF
2 – CNND
3 – AIJTY
4 – AVCNF
5 – JPPYY
6 – DGLY
7 – AONC
8 – THAR
9 – FLMMF
10 – FMCXF
*** THE LIST ABOVE IS STRICTLY FOR INFORMATIONAL PURPOSES – I MAY OR MAY NOT HAVE OR INITIATE A LONG, SHORT, OR LONG/SHORT POSITION IN ANY NAME ABOVE AT ANY TIME ***
The VIX closed at 13.34, indicating an implied one day move of +/-0.84% & an implied one month move of +/-3.86% for the S&P 500.
Highest Technical Rated S&P 500 Components Per 12/2/2024’s Close:
1 – PLTR
2 – TPL
3 – UAL
4 – AXON
5 – TSLA
6 – VST
7 – TPR
8 – RCL
9 – CCL
10 – NCLH
Lowest Technical Rated S&P 500 Components Per 12/2/2024’s Close:
1 – CE
2 – MRNA
3 – QRVO
4 – MPWR
5 – AES
6 – HII
7 – DG
8 – ENPH
9 – WBA
10 – REGN
Highest Volume Rated S&P 500 Components Per 12/2/2024’s Close:
1 – PCG
2 – SMCI
3 – GPC
4 – AMCR
5 – TGT
6 – INTC
7 – TPR
8 – AKAM
9 – LRCX
10 – VRSN
Lowest Volume Rated S&P 500 Components Per 12/2/2024’s Close:
1 – APD
2 – EFX
3 – LW
4 – BLDR
5 – UAL
6 – ETN
7 – JBHT
8 – CSGP
9 – GNRC
10 – BSX
Highest Technical Rated ETFs Per 12/2/2024’s Close:
1 – GXLM
2 – TSLR
3 – TSLL
4 – TSLT
5 – BITW
6 – ZCSH
7 – DEFG
8 – TSL
9 – VCAR
10 – DPST
Lowest Technical Rated ETFs Per 12/2/2024’s Close:
1 – TSLZ
2 – TSDD
3 – MSOX
4 – TSLQ
5 – UVIX
6 – TSLS
7 – SARK
8 – MRNY
9 – BDRY
10 – NVDQ
Highest Volume Rated ETFs Per 12/2/2024’s Close:
1 – MAYZ
2 – DECT
3 – DECW
4 – OCTZ
5 – MDCP
6 – CVRD
7 – IDEC
8 – SEPT
9 – SIXD
10 – HYKE
Lowest Volume Rated ETFs Per 12/2/2024’s Close:
1 – ZTWO
2 – ZTRE
3 – GSID
4 – EMCS
5 – EQLS
6 – CCNR
7 – FDTB
8 – FCA
9 – ZTEN
10 – GVUS
Highest Technical Rated General Stocks Per 12/2/2024’s Close:
1 – CBDS
2 – UMAC
3 – AGFY
4 – LEEED
5 – XCUR
6 – QUBT
7 – SNTI
8 – KULR
9 – DRUG
10 – RCAT
Lowest Technical Rated General Stocks Per 12/2/2024’s Close:
1 – CETX
2 – SAVA
3 – ELAB
4 – EFSH
5 – ELPW
6 – ADD
7 – YYAI
8 – LUXH
9 – JTAI
10 – APLT
Highest Volume Rated General Stocks Per 12/2/2024’s Close:
1 – SNTI
2 – PPBT
3 – OUT
4 – LEV
5 – EHGO
6 – JCSE
7 – BGLC
8 – MAMA
9 – MOB
10 -FOSL
Lowest Volume Rated General Stocks Per 12/2/2024’s Close:
1 – BBSRF
2 – CIAFF
3 – ALPIB
4 – GASXF
5 – SPPL
6 – AZMTF
7 – AXAHF
8 – OILSF
9 – DTEGF
10 – FLYLF
*** THE LIST ABOVE IS STRICTLY FOR INFORMATIONAL PURPOSES – I MAY OR MAY NOT HAVE OR INITIATE A LONG, SHORT, OR LONG/SHORT POSITION IN ANY NAME ABOVE AT ANY TIME ***
The VIX closed at 14.1, indicating an implied one day move of +/-0.89% & an implied one month move of +/-4.08% for the S&P 500.
Highest Technical Rated S&P 500 Components Per 11/26/2024’s Close:
1 – PLTR
2 – TPL
3 – UAL
4 – AXON
5 – VST
6 – TSLA
7 – RCL
8 – TRGP
9 – FICO
10 – CCL
Lowest Technical Rated S&P 500 Components Per 11/26/2024’s Close:
1 – CE
2 – MRNA
3 – QRVO
4 – MPWR
5 – AES
6 – ENPH
7 – SMCI
8 – DG
9 – WBA
10 – EL
Highest Volume Rated S&P 500 Components Per 11/26/2024’s Close:
1 – AMGN
2 – SJM
3 – BBY
4 – DAY
5 – TPR
6 – STZ
7 – WAT
8 – WDC
9 – ADI
10 – A
Lowest Volume Rated S&P 500 Components Per 11/26/2024’s Close:
1 – K
2 – WST
3 – NI
4 – DFS
5 – PYPL
6 – JNPR
7 – AEE
8 – NWSA
9 – CRL
10 – OTIS
Highest Technical Rated ETFs Per 11/26/2024’s Close:
1 – TSLR
2 – TSLL
3 – TSLT
4 – DPST
5 – BITW
6 – DEFG
7 – TSL
8 – GXLM
9 – VCAR
10 – CLDL
Lowest Technical Rated ETFs Per 11/26/2024’s Close:
1 – TSLZ
2 – TSDD
3 – TSLQ
4 – MRNY
5 – UVIX
6 – MEXX
7 – TSLS
8 – SKRE
9 – NVDQ
10 – NVD
Highest Volume Rated ETFs Per 11/26/2024’s Close:
1 -PBJA
2 – TAFL
3 – UFIV
4 – BPAY
5 – STAX
6 – TMET
7 – OAEM
8 – PBDE
9 – GSID
10 – HFGO
Lowest Volume Rated ETFs Per 11/26/2024’s Close:
1 – HQGO
2 – FDTB
3 – PSCQ
4 – SIXJ
5 – FDCE
6 – UJUN
7 – ESGB
8 – USCA
9 – OBND
10 – PABU
Highest Technical Rated General Stocks Per 11/26/2024’s Close:
1 – AGFY
2 – XCUR
3 – QUBT
4 – PGHL
5 – BTCT
6 – PDYN
7 – MFH
8 – WLGS
9 – PSTX
10 – DRUG
Lowest Technical Rated General Stocks Per 11/26/2024’s Close:
1 – EFSH
2 – SYRS
3 – SAVA
4 – TFFP
5 – CRKN
6 – ADD
7 – ONCO
8 – TRNR
9 – ADTX
10 – SMX
Highest Volume Rated General Stocks Per 11/26/2024’s Close:
1 – TWO
2 – IDAI
3 – VSEE
4 – IMG
5 – MDAI
6 – SMTK
7 – HSAI
8 – IFBD
9 – PSTX
10 – OPTT
Lowest Volume Rated General Stocks Per 11/26/2024’s Close:
1 – BNPQF
2 – BONXF
3 – FHSEY
4 – BBSRF
5 – PRMNF
6 – MBXBF
7 – TIRX
8 – ARBV
9 – ADCOF
10 – SCZC
*** THE LIST ABOVE IS STRICTLY FOR INFORMATIONAL PURPOSES – I MAY OR MAY NOT HAVE OR INITIATE A LONG, SHORT, OR LONG/SHORT POSITION IN ANY NAME ABOVE AT ANY TIME ***
The VIX closed at 14.6, indicating an implied one day move of +/-0.92% & an implied one month move of +/-4.22% for the S&P 500.
Highest Technical Rated S&P 500 Components Per 11/25/2024’s Close:
1 – PLTR
2 – UAL
3 – AXON
4 – VST
5 – TSLA
6 – RCL
7 – TRGP
8 – TPR
9 – FICO
10 – CCL
Lowest Technical Rated S&P 500 Components Per 11/25/2024’s Close:
1 – CE
2 – MRNA
3 – QRVO
4 – ENPH
5 – MPWR
6 – AES
7 – REGN
8 – DG
9 – EL
10 – WBA
Highest Volume Rated S&P 500 Components Per 11/25/2024’s Close:
1 – PARA
2 – TYL
3 – KEYS
4 – EG
5 – AWK
6 – MSI
7 – COP
8 – EQIX
9 – WELL
10 – OKE
Lowest Volume Rated S&P 500 Components Per 11/25/2024’s Close:
1 – UAL
2 – NCLH
3 – CRL
4 – PN
5 – GL
6 – ALB
7 – CHTR
8 – GNRC
9 – AMD
10 – XEL
Highest Technical Rated ETFs Per 11/25/2024’s Close:
1 – GXLM
2 – TSLR
3 – TSLL
4 – TSLT
5 – DPST
6 – BITW
7 – DEFG
8 – BITX
9 – TSL
10 – VCAR
Lowest Technical Rated ETFs Per 11/25/2024’s Close:
1 – MSOX
2 – TSLZ
3 – TSDD
4 – TSLQ
5 – MRNY
6 – SKRE
7 – UVIX
8 – TSLS
9 – SMST
10 – WEED
Highest Volume Rated ETFs Per 11/25/2024’s Close:
1 – PBMY
2 – PBSE
3 – UNIY
4 – BCIL
5 – EYEG
6 – MAPP
7 – GVUS
8 – JHDV
9 – WBND
10 – GGUS
Lowest Volume Rated ETFs Per 11/25/2024’s Close:
1 – EMCS
2 – FDVL
3 – ESGB
4 – GSID
5 – SIXJ
6 – EQLS
7 – IWLG
8 – PABU
9 – RAFE
10 – IBMS
Highest Technical Rated General Stocks Per 11/25/2024’s Close:
1 – XCUR
2 – AGFY
3 – QUBT
4 – LEEED
5 – QMCO
6 – BTCT
7 – RCAT
8 – WLGS
9 – DRUG
10 – ATGL
Lowest Technical Rated General Stocks Per 11/25/2024’s Close:
1 – EFSH
2 – CETX
3 – SYRS
4 – DEVS
5 – TFFP
6 – SAVA
7 – EYEN
8 – YELLQ
9 – GCTK
10 – TRNR
Highest Volume Rated General Stocks Per 11/25/2024’s Close:
1 – WLDS
2 – SMTK
3 – KULR
4 – CLRO
5 – CGTX
6 – QMMM
7 – NTRP
8 – CTXR
9 – NSA
10 – BCOV
Lowest Volume Rated General Stocks Per 11/25/2024’s Close:
1 – AUXXF
2 – SROYF
3 – PDPTF
4 – PAVS
5 – CYSNF
6 – BTSGU
7 – PFBX
8 – TIVC
9 – BBSRF
10 – ROKRF
*** THE LIST ABOVE IS STRICTLY FOR INFORMATIONAL PURPOSES – I MAY OR MAY NOT HAVE OR INITIATE A LONG, SHORT, OR LONG/SHORT POSITION IN ANY NAME ABOVE AT ANY TIME ***
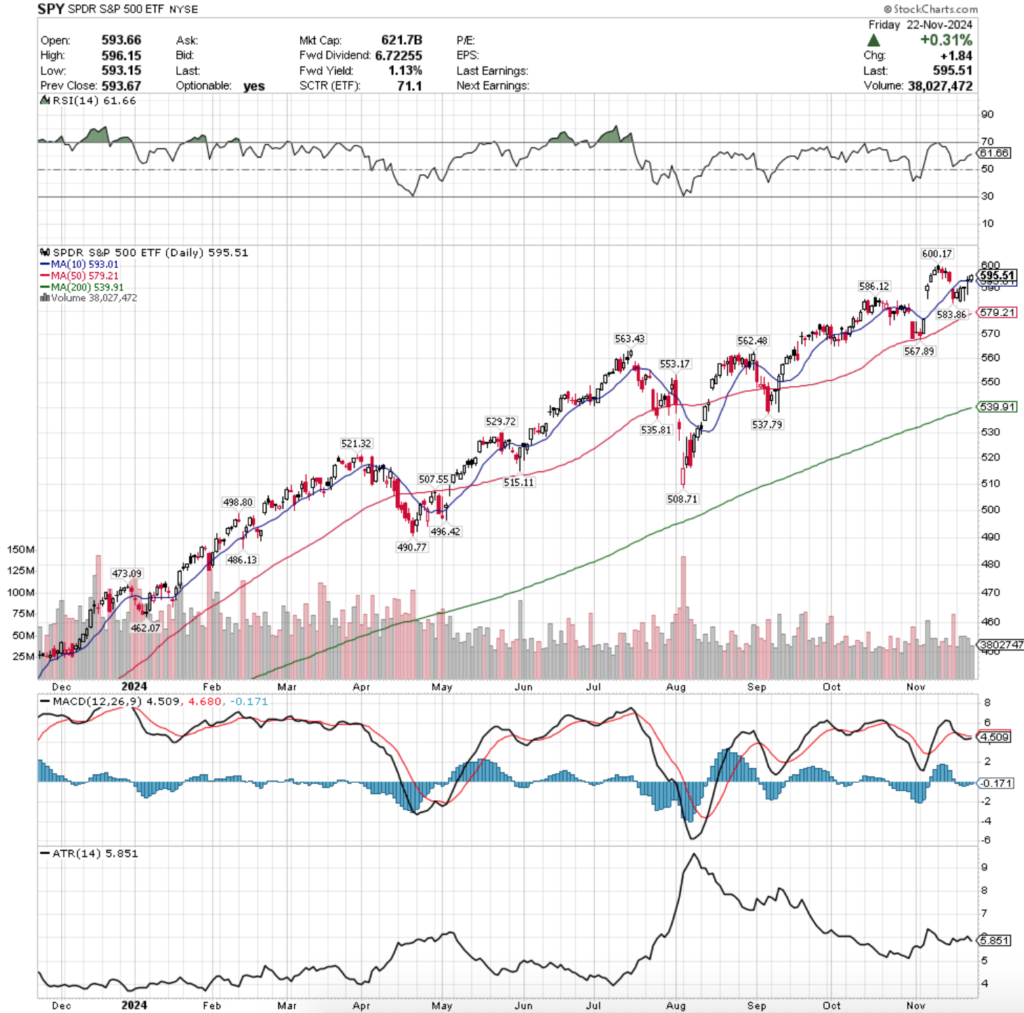
SPY, the SPDR S&P 500 ETF added +1.67% this past week, while the VIX closed at 15.24 indicating an implied one day move of +/-0.96% & an implied one month move of +/-4.41%.
SPY ETF – SPDR S&P 500 ETF’s Technical Performance Over The Past Year
Their RSI is trending upward towards the overbought level again, currently sitting at 61.66, while their MACD is signaling that it’s poised for an early week bullish crossover before the Thanksgiving holiday.
Volumes were still weak, coming in -26.49% below the prior year’s average level (44,300,000 vs. 60,260,437), as market participants are still feeling a bit uneasy near these all-time high price levels.
The week started off on a optimistic, but uncertain note, as Monday’s session resulted in a spinning top that formed a bullish harami pattern with Friday’s candle on very light volume.
Tuesday opened lower but powered higher to form a bullish engulfing pattern with Monday’s candle & the volume was a bit higher, but still not the level of enthusiasm that is needed to continue to a new all-time high.
Wednesday’s session resulted in a dragonfly doji, indicating uncertainty given that it retraced the entire range of the prior day’s candle, but ultimately the day was able to close higher at the top of the session’s candle by the open.
Thursday opened on a gap up in line with the 10 day moving average’s resistance, tried higher but ultimately retraced below the close of Wednesday’s session before rallying back to close as a doji candle by the 10 DMA.
Friday opened in line with Thursday’s close but was able to close slightly higher, although indicating hesitancy & uncertainty as the low volume session closed as a spinning top candle.
This week it should be kept in mind that there are only 3.5 trading days, as Thursday is Thanksgiving & the market is closed & Friday is a half day.
Wednesday has a lot of data announcements & there are some earnings calls scheduled for early in the week that may impact SPY’s performance.
With that in mind, SPY looks primed to straddle the 10 DMA & trade around it on light, holiday week volume.
It is unlikely to get the volume needed to force a retest of the all-time high that sits ~1% above Friday’s close & if it was unable to be reached last week it seems less likely to happen on a short week when folks are traveling.
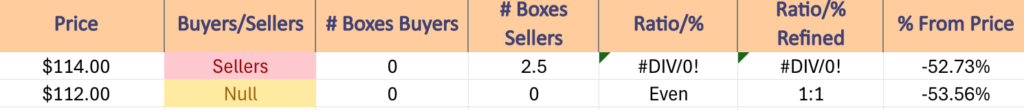
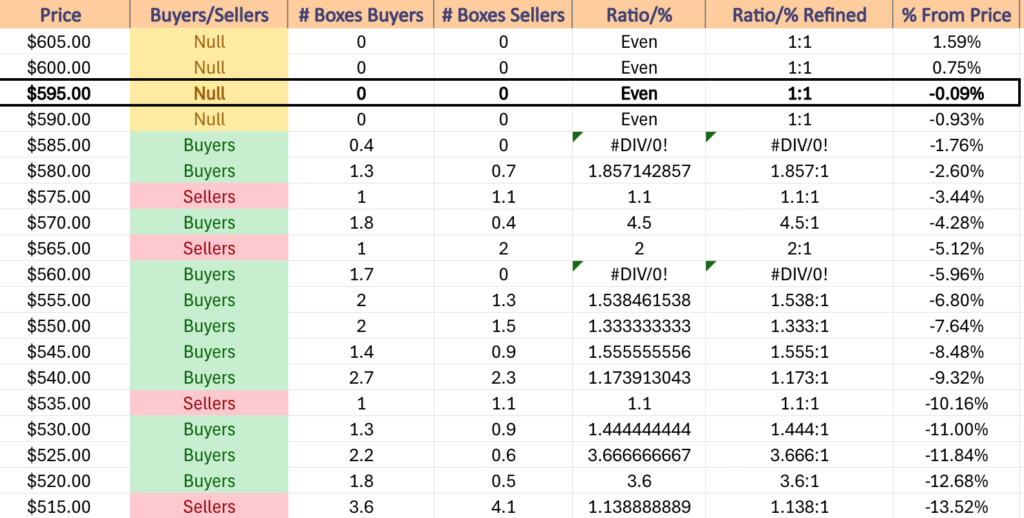
To the downside it will be interesting to see how the $590/share level holds up, given Tuesday’s close there & Wednesday’s doji candle resting right above it, but should it test any lower the chart below lists SPYs price level:volume sentiment over the past ~2 years.
SPY has support at the $593.01 (10 Day Moving Average, Volume Sentiment: NULL, 0:0*), $586.12 (Volume Sentiment: Buyers, 0.4:0*), $583.86 (Volume Sentiment: Buyers, 1.86:1) & $579.21/share (50 Day Moving Average, Volume Sentiment: Sellers, 1.1:1) price levels, with resistance at the $600.17/share (All-Time High, Volume Sentiment: NULL, 0:0*) price level.
SPY ETF’s Price Level:Volume Sentiment Over The Past ~2 Years
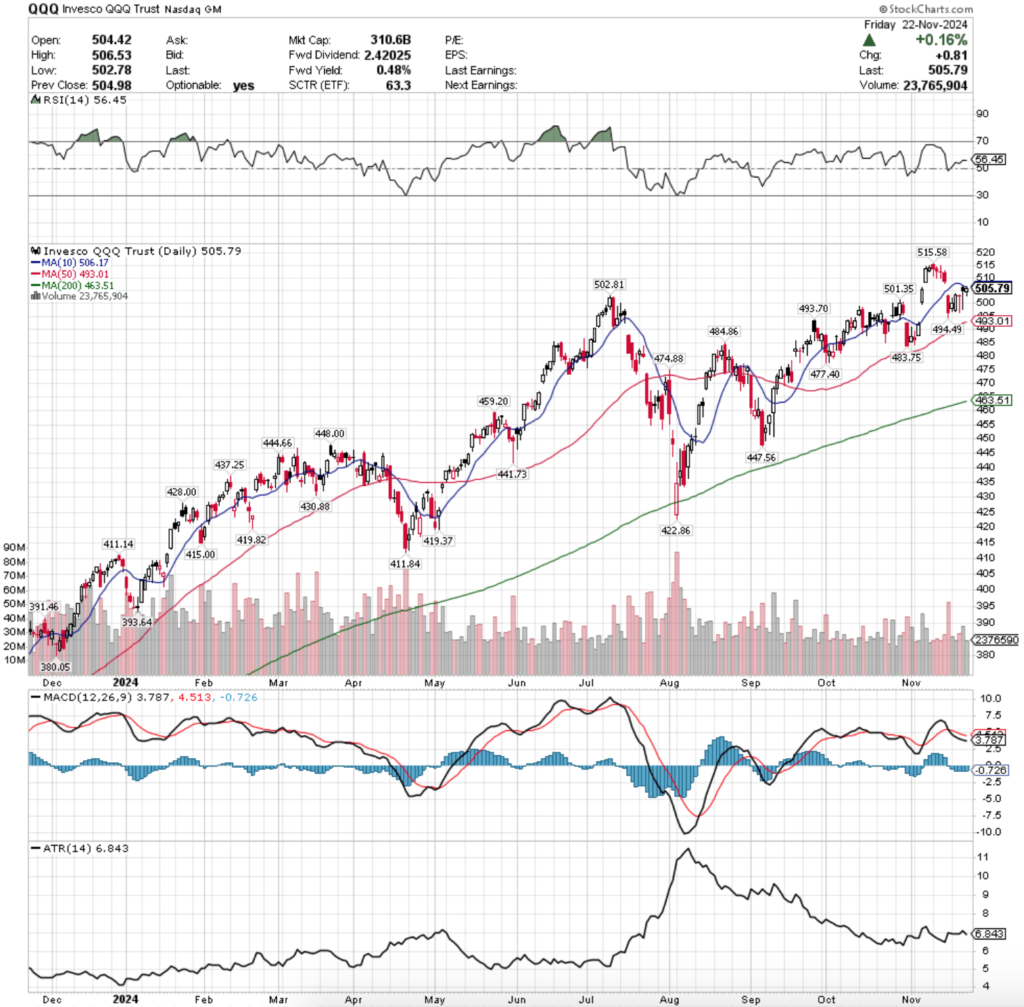
QQQ, the Invesco QQQ Trust ETF that tracks the NASDAQ 100 gained +1.86% last week, as investors were slightly more eager to pile into the tech heavy index than the S&P 500 components.
QQQ ETF – Invesco QQQ Trust ETF’s Technical Performance Over The Past Year
Their RSI is trending above the neutral level of 50 & sits at 56.45 but has flattened out recently, while their MACD is bearish but showing signs of a potential bullish crossover before the end of the week if the histogram shows weakness on Monday or Tuesday.
Volumes were the weakest of the major index ETFs, coming in -27.27% below the previous year’s average level (27.928,000 vs. 38,399,048), as investors are still not feeling confident about hopping back into the pool so close to all-time highs.
QQQ’s week began on a similar note to SPY’s with Monday’s candle forming a bullish harami with Friday’s & closing as a spinning top on low volume, indicating that there was a bit of uncertainty in the air.
Tuesday opened lower but was able to close higher, ending the day forming a bullish engulfing pattern with Monday’s candle, but again on weak volume.
Wednesday opened lower & tested lower than Tuesday’s lows, but was able to close in line with the open as a dragonfly doji, indicating that there was still a little upside appetite, but that people were taking profits throughout the day too.
Thursday opened on a gap higher to just beneath the resistance of the 10 day moving average, tested almost as low as Wednesday’s session’s low, but was able to rally higher to form a hanging man candle that closed lower than it opened on the highest volume session of the week.
It appears that a lot of market participants were taking profits those two days based on how low they tested, but bulls managed to push their closing prices back to the high end of the days’ ranges.
Friday left the week off on a note of bearish uncertainty for QQQ, as while the session advanced +0.16%, it resulted in a spinning top candle that was unable to break above the resistance of the 10 DMA, which has now curled over & is moving downward towards the price.
Much like SPY, QQQ is unlikely to make a run at their all-time high this week due to the short week & anticipated low volume that accompanies a holiday.
They’re likely to trade around the 10 DMA on light volume all week, pending no major news or bad data releases occur.
In the event of decline, QQQ has more local support levels than SPY which may control the rate of descent, but should that happen investors should begin watching for a bearish head & shoulders pattern, particularly given their 10 DMA is even looking like one.
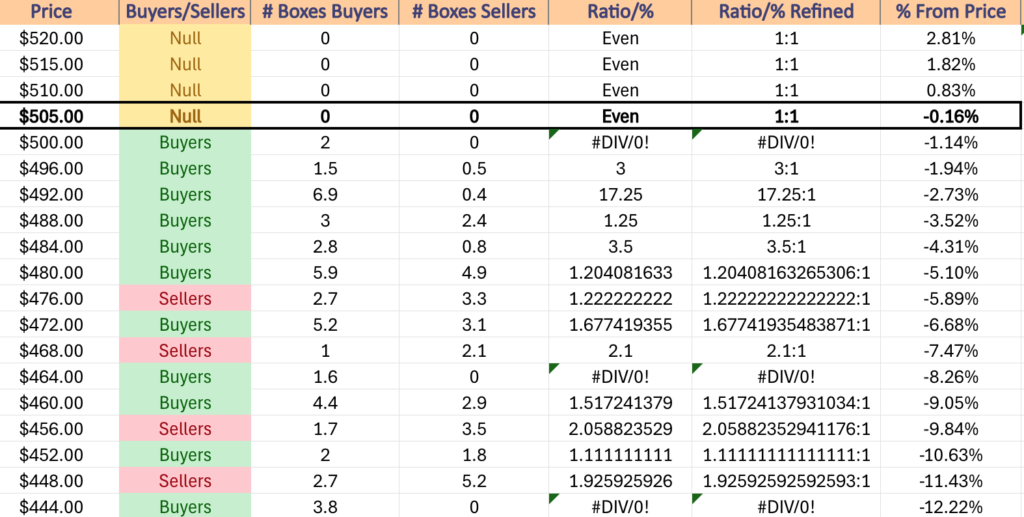
QQQ has support at the $502.81 (Volume Sentiment: Buyers, 2:0*), $501.35 (Volume Sentiment: Buyers, 2:0*), $494.49 (Volume Sentiment: Buyers, 17.25:1) & $493.70/share (Volume Sentiment: Buyers, 17.25:1) price levels, with resistance at the $506.17 (10 Day Moving Average, Volume Sentiment: NULL, 0:0*) $515.58/share (All-Time High, Volume Sentiment: NULL, 0:0*) price levels.
QQQ ETF’s Price Level:Volume Sentiment Over The Past ~2 Years
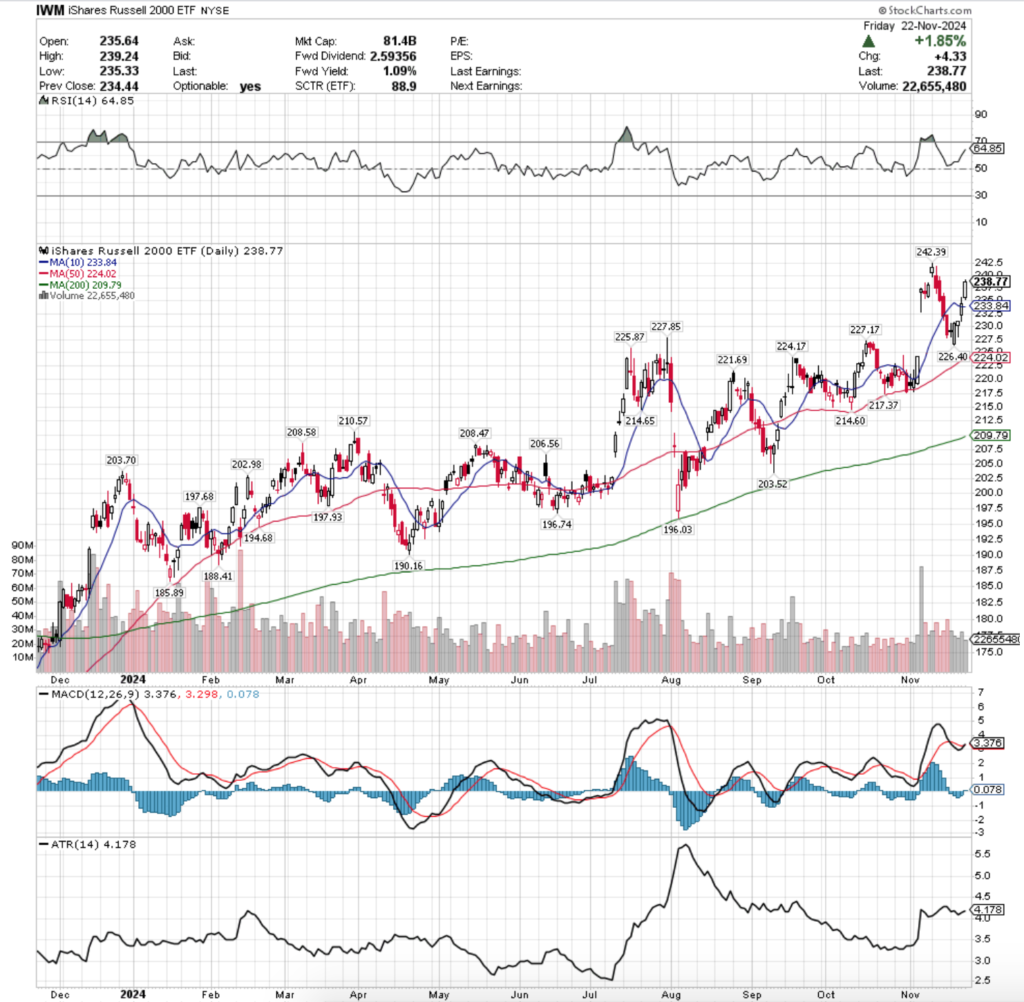
IWM, the iShares Russell 2000 ETF advanced +4.5% last week, as investors were eager to pile into the small cap index compared to the other three major index ETFs.
IWM ETF – iShares Russell 2000 ETF’s Technical Performance Over The Past Year
Their RSI is trending towards the overbought 70 level & currently sits at 64.85, while their MACD crossed over bullishly on Friday, but the histogram level is quite low which leaves room for skepticism on the strength of the crossover.
Volumes were also weak, coming in -20.59% below the prior year’s average level (26,200,000 vs. 32,994,484), as even small cap investors are feeling nervous near their all-time high.
Monday kicked the week off with bullish uncertainty, as the session created a bullish harami cross with Friday’s candle on some of the week’s highest volume.
Bullish engulfing Tuesday also hit IWM, as despite opening on a gap down the bulls came back & force the session to close above the high of Monday’s session.
Wednesday’s candle would be described as a hanging man if it occurred in an actual uptrend & not in the wake of a two day reversal, but market participants showed that there was still plenty of negative sentiment in the air, given the size of the lower shadow.
Thursday opened higher, signaled that there was some downside sentiment (or near-term profit taking) on the lower shadow, but was able to power through the 10 day moving average & close above it as there was a lot of advancing volume relative to every day that week but Monday.
Friday opened on a gap higher, briefly tested lower but the $235/share mark held strong & propelled IWM to close higher for a +1.85% gain on the day.
This week will be focused on whether or not the support of the 10 day moving avera
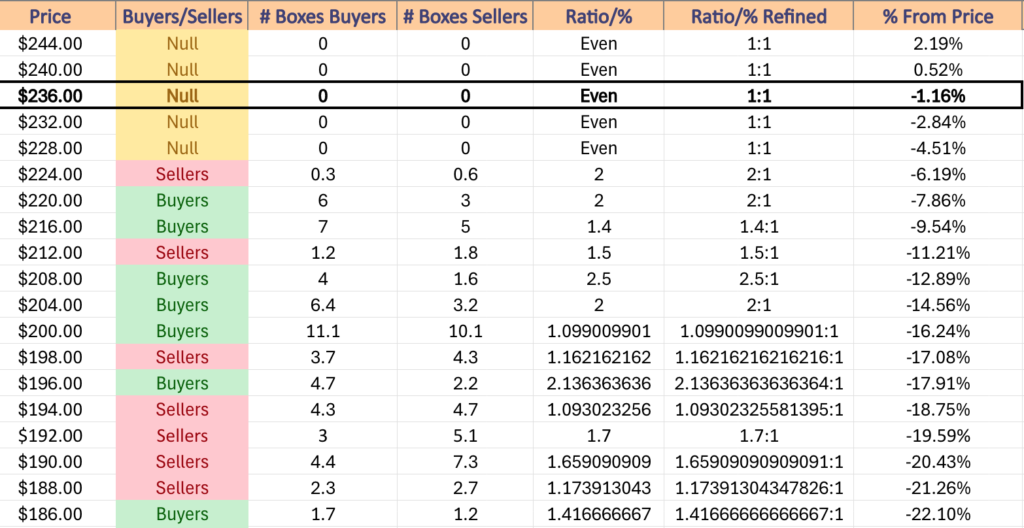
IWM has support at the $233.84 (10 Day Moving Average, Volume Sentiment: NULL, 0:0*), $227.85 (Volume Sentiment: Sellers, 2:1), $227.17 (Volume Sentiment: Sellers, 2:1) & $226.40/share (Volume Sentiment: Sellers, 2:1) price levels, with resistance at the $242.39/share (All-Time High, Volume Sentiment: NULL, 0:0*) price levels.
IWM ETF’s Price Level:Volume Sentiment Over The Past ~2 Years
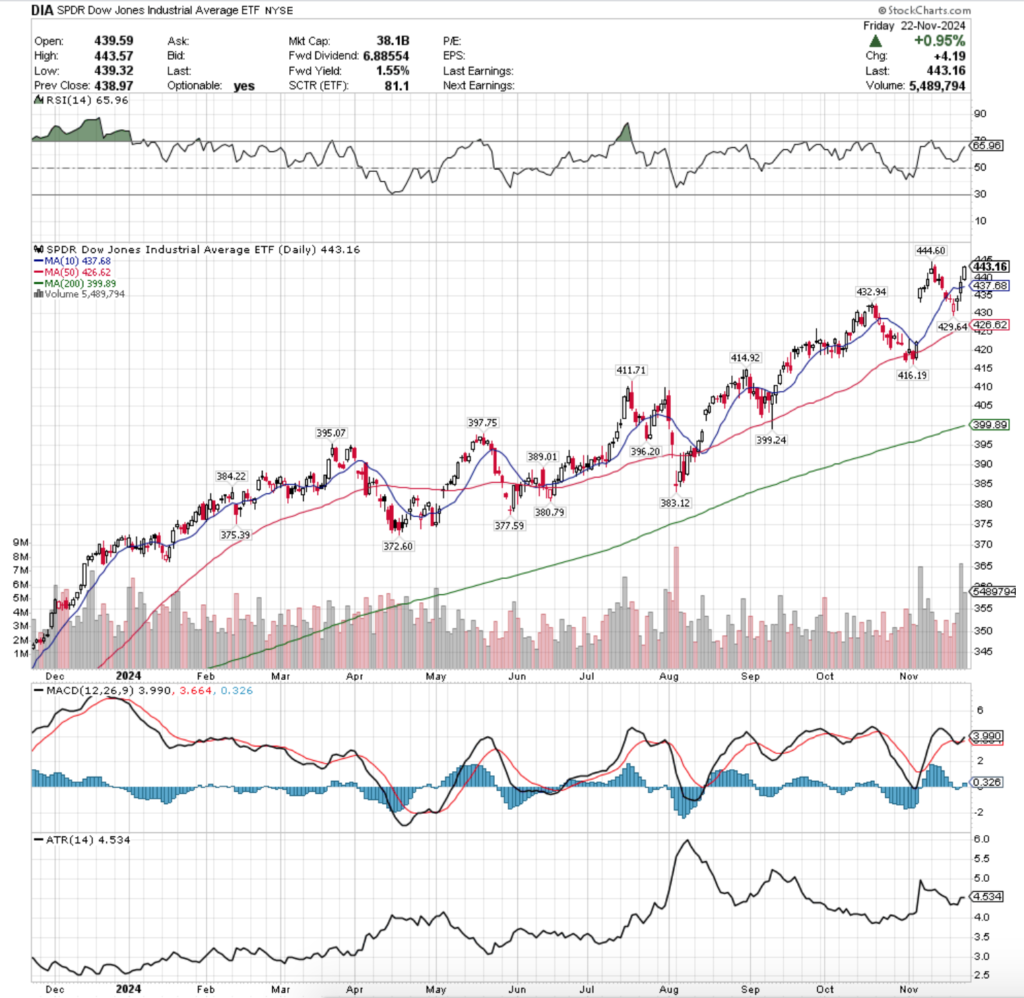
DIA ETF – SPDR Dow Jones Industrial Average ETF’s Technical Performance Over The Past Year
Their RSI is trending towards overbought & currently sits at 65.96, while their MACD crossed over bullishly on Friday, but the histogram level is rather muted, calling to question the strength of the signal.
Volumes were +28.8% above the previous year’s average (4,492,000 vs. 3,487,619), as investors were still feeling eager to get into the component names of the blue chip index.
Monday began the week on a note of muted uncertainty, as the day resulted in a doji candle for a slight decline on very weak volume.
Tuesday opened on a major gap down, but throughout the session bulls came in & were able to force the closing price above the open, but still for a declining session.
Wednesday was a tug of war between bulls & bears after opening on a gap up, as there was still plenty of bearish sentiment out there based on the size of the candle’s lower shadow, but the day managed to rally higher.
This set up the highest volume session of the week on Thursday, where the day opened on a gap up, there was some profit taking based on the lower shadow before powering through the 10 DMAs resistance to close above it.
The upper shadow on the day’s candle also indicated that there were market participants interested in seeing DIA continue its climb, which is what happened on Friday as another gap up session left DIA within $1.44 of its all-time high.
Based on the high volume heading into the weekend & the recent MACD bullish crossover it appears that DIA will at least break above its all-time high this week.
This brings with it a set of problems though, as once the oscillators overheat there will be profit taking from that batch of high volume we saw on Thursday & Friday & there are not that many nearby support levels for DIA.
In the event of a new ATH there would be support at $444.60 & at where ever the 10 day moving average winds up by then, as it will continue marching higher along with the price.
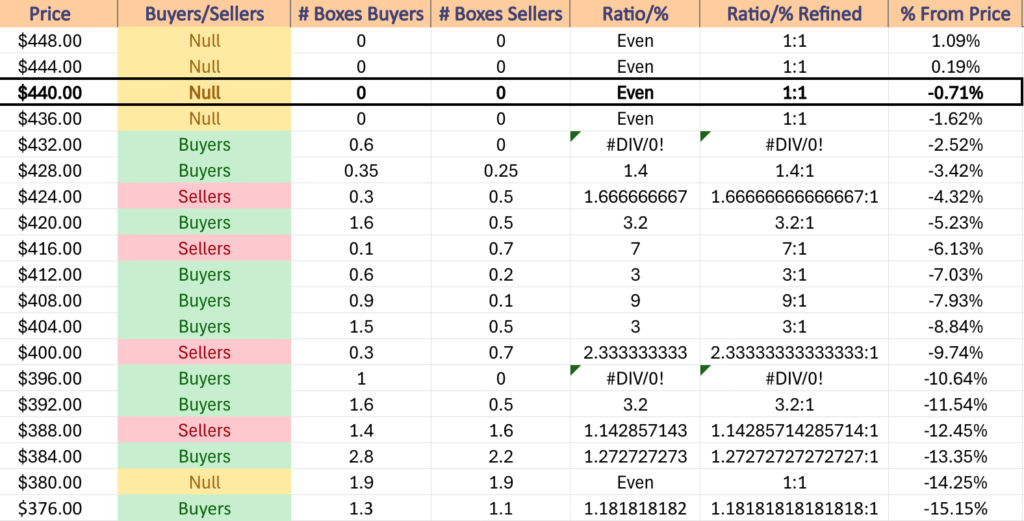
Another key area to keep an eye on in the event of a decline is that window that was created by the post-election gap up, as if the $429.64/share support level breaks down that will likely begin to fill, especially if prices enter the $424-427.99/share zone where Sellers have outpaced Buyers at a rate of 1.67:1 over the past 3-4 years.
DIA has support at the $437.68 (10 Day Moving Average, Volume Sentiment: NULL, 0:0*), $432.94 (Volume Sentiment: Buyers, 0.6:0*), $429.64 (Volume Sentiment: Buyers, 1.4:1) & $426.62/share (50 Day Moving Average, Volume Sentiment: Sellers, 1.67:1) price levels, with resistance at the $444.60/share (All-Time High, Volume Sentiment: NULL, 0:0*) price levels.
DIA ETF’s Price Level:Volume Sentiment Over The Past ~2 Years
The Week Ahead
Monday has no major economic announcements scheduled.
Bath & Body Works & Diana Shipping report earnings Monday morning before the opening bell, with Agilent Technologies, Central Garden, Enanta Pharmaceuticals, Fluence, Leslie’s, NJ Resources, Semtech, Woodward & Zoom Video Communications reporting after the closing bell.
S&P Case-Shiller Home Price Index (20 Cities) is released Tuesday at 9 am, Consumer Confidence & New Home Sales data comes out at 10 am & the Minutes of he Fed’s FOMC meeting are due out at 2pm.
Tuesday’ morning’s earnings kick off with Abercrombie & Fitch, American Woodmark, Analog Devices, Bank of Nova Scotia, Best Buy, Burlington Stores, Dick’s Sporting Goods, Embecta, J.M. Smucker, Kohl’s, Macy’s & Titan Machinery, followed by Dell Technologies, Ambarella, Arrowhead Pharmaceuticals, Autodesk, CrowdStrike, Guess?, HP Inc., Mitek Systems, Nordstrom, Nutanix, Urban Outfitters & Workday after the closing bell.
Wednesday is going to be a busy one on the data-front, starting with Initial Jobless Claims, Durable-Goods Orders, Durable-Goods minus Transportation, Advanced U.S. Trade Balance In Goods, Advanced Retail Inventories, Advanced Wholesale Inventories & GDP (first revision) are all due out at 8:30 am, followed by Personal Income (nominal), Personal Spending (nominal), PCE Index, PCE (year-over-year), Core PCE Index, Core PCE (year-over-year) & Pending Home Sales at 10 am.
Patterson Companies reports earnings before Wednesday’s opening bell, with Kroger & Zumiez set the report after the session’s close.
Thursday is Thanksgiving so there is no data to be released.
Friday brings us the Chicago Business Barometer (PMI) report at 9:45 am & there will be no earnings reports released.
*** I DO NOT OWN SHARES OR OPTIONS CONTRACT POSITIONS IN SPY, QQQ, IWM OR DIA AT THE TIME OF PUBLISHING THIS ARTICLE ***
The VIX closed at 16.87, indicating an implied one day move of +/-1.06% & an implied one month move of +/-4.88% for the S&P 500.
Highest Technical Rated S&P 500 Components Per 11/21/2024’s Close:
1 – PLTR
2 – VST
3 – AXON
4 – UAL
5 – TSLA
6 – TRGP
7 – RCL
8 – CCL
9 – FICO
10 – BX
Lowest Technical Rated S&P 500 Components Per 11/21/2024’s Close:
1 – MRNA
2 – CE
3 – SMCI
4 – ENPH
5 – QRVO
6 – EL
7 – MPWR
8 – WBA
9 – DG
10 – REGN
Highest Volume Rated S&P 500 Components Per 11/21/2024’s Close:
1 – MRO
2 – TGT
3 – DE
4 – PANW
5 – CE
6 – NTAP
7 – AMCR
8 – GOOGL
9 – TDG
10 – CARR
Lowest Volume Rated S&P 500 Components Per 11/21/2024’s Close:
1 – RMD
2 – LH
3 – UDR
4 – CPT
5 – LW
6 – MCK
7 – FFIV
8 – KVUE
9 – MHK
10 – WYNN
Highest Technical Rated ETFs Per 11/21/2024’s Close:
1 – TSLR
2 – TSLL
3 – TSLT
4 – BITX
5 – BITW
6 – MSTX
7 – TSL
8 – VCAR
9 – DPST
10 – GXLM
Lowest Technical Rated ETFs Per 11/21/2024’s Close:
1 – MSOX
2 – TSLZ
3 – TSDD
4 – TSLQ
5 – MRNY
6 – NVDQ
7 – NVD
8 – TSLS
9 – SMST
10 – BITI
Highest Volume Rated ETFs Per 11/21/2024’s Close:
1 – PSMD
2 – SMRI
3 – WEIX
4 – AVNM
5 – EEMO
6 – GBLD
7 – KPRO
8 – PSCW
9 – ARVR
10 – NBCM
Lowest Volume Rated ETFs Per 11/21/2024’s Close:
1 – EMCS
2 – BHYB
3 – OVT
4 – IQSM
5 – OVL
6 – TSEC
7 – NUGO
8 – PABU
9 – EMCR
10 – FDGR
Highest Technical Rated General Stocks Per 11/21/2024’s Close:
1 – LEEED
2 – AGFY
3 – BTCT
4 – QUBT
5 – XCUR
6 – RCAT
7 – DRUG
8 – SEZL
9 – MNPR
10 – ACRS
Lowest Technical Rated General Stocks Per 11/21/2024’s Close:
1 – EFSH
2 – VJTTY
3 – SYRS
4 – DEVS
5 – GCTK
6 – TFFP
7 – ADTX
8 – EYEN
9 – CETX
10 – YELLQ
Highest Volume Rated General Stocks Per 11/21/2024’s Close:
1 – WORX
2 – OUT
3 – CTV
4 – SURG
5 – CRNC
6 – BDRX
7 – PET
8 – CDT
9 – BLRX
10 – MGLD
Lowest Volume Rated General Stocks Per 11/21/2024’s Close:
1 – GTHP
2 – MOJO
3 – PDPTF
4 – ATCMF
5 – BTSGU
6 – CIAFF
7 – PLSDF
8 – VEEE
9 – LUCY
10 – JCSE
*** THE LIST ABOVE IS STRICTLY FOR INFORMATIONAL PURPOSES – I MAY OR MAY NOT HAVE OR INITIATE A LONG, SHORT, OR LONG/SHORT POSITION IN ANY NAME ABOVE AT ANY TIME ***
The VIX closed at 17.16, indicating an implied one day move of +/-1.08% & an implied one month move of +/-4.96% for the S&P 500.
Highest Technical Rated S&P 500 Components Per 11/20/2024’s Close:
1 – PLTR
2 – UAL
3 – AXON
4 – VST
5 – TSLA
6 – TRGP
7 – RCL
8 – CCL
9 – FICO
10 – HWM
Lowest Technical Rated S&P 500 Components Per 11/20/2024’s Close:
1 – MRNA
2 – SMCI
3 – CE
4 – ENPH
5 – QRVO
6 – EL
7 – MPWR
8 – WBA
9 – DG
10 – DLTR
Highest Volume Rated S&P 500 Components Per 11/20/2024’s Close:
1 – TGT
2 – AMCR
3 – KEYS
4 – CCI
5 – FOX
6 – EQT
7 – NWS
8 – PANW
9 – CE
10 – CPRT
Lowest Volume Rated S&P 500 Components Per 11/20/2024’s Close:
1 – KEY
2 – MTCH
3 – LW
4 – IRM
5 – MMM
6 – ODFL
7 – CFG
8 – KVUE
9 – UNP
10 – MCK
Highest Technical Rated ETFs Per 11/20/2024’s Close:
1 – ETH
2 – BTC
3 – MSTX
4 – TSLR
5 – TSLL
6 – BITW
7 – CONL
8 – BITX
9 – VCAR
10 – TSL
Lowest Technical Rated ETFs Per 11/20/2024’s Close:
1 – TSLZ
2 – TSDD
3 – MSOX
4 – TSLQ
5 – MRNY
6 – NVDQ
7 – NVD
8 – SMST
9 – TSLS
10 – MEXX
Highest Volume Rated ETFs Per 11/20/2024’s Close:
1 – GSEE
2 – PSCQ
3 – PSMO
4 – PQDI
5 – LEGR
6 – CARK
7 – WTBN
8 – EUDG
9 – JUST
10 – VLU
Lowest Volume Rated ETFs Per 11/20/2024’s Close:
1 – EMCS
2 – BHYB
3 – FDGR
4 – SBB
5 – OVLH
6 – PBNV
7 – BUYZ
8 – PST
9 – MINN
10 – LCR
Highest Technical Rated General Stocks Per 11/20/2024’s Close:
1 – AGFY
2 – BTCT
3 – XCUR
4 – QUBT
5 – DRUG
6 – MNPR
7 – WLGS
8 – RCAT
9 – CNVS
10 – SEZL
Lowest Technical Rated General Stocks Per 11/20/2024’s Close:
1 – EFSH
2 – SYRS
3 – DEVS
4 – GCTK
5 – TFFP
6 – ADTX
7 – TRNR
8 – TCBP
9 – ADD
10 – SMX
Highest Volume Rated General Stocks Per 11/20/2024’s Close:
1 – LEEED
2 – DRUG
3 – CSDX
4 – CANB
5 – FKMCF
6 – GDLC
7 – FXLV
8 – KRKNF
9 – ADBRF
10 – CVHSY
Lowest Volume Rated General Stocks Per 11/20/2024’s Close:
1 – CANSF
2 – BNPQF
3 – HEWA
4 – FLWBF
5 – PAVS
6 – LIMX
7 – INBP
8 – ARBB
9 – ARBV
10 – FETM
*** THE LIST ABOVE IS STRICTLY FOR INFORMATIONAL PURPOSES – I MAY OR MAY NOT HAVE OR INITIATE A LONG, SHORT, OR LONG/SHORT POSITION IN ANY NAME ABOVE AT ANY TIME ***