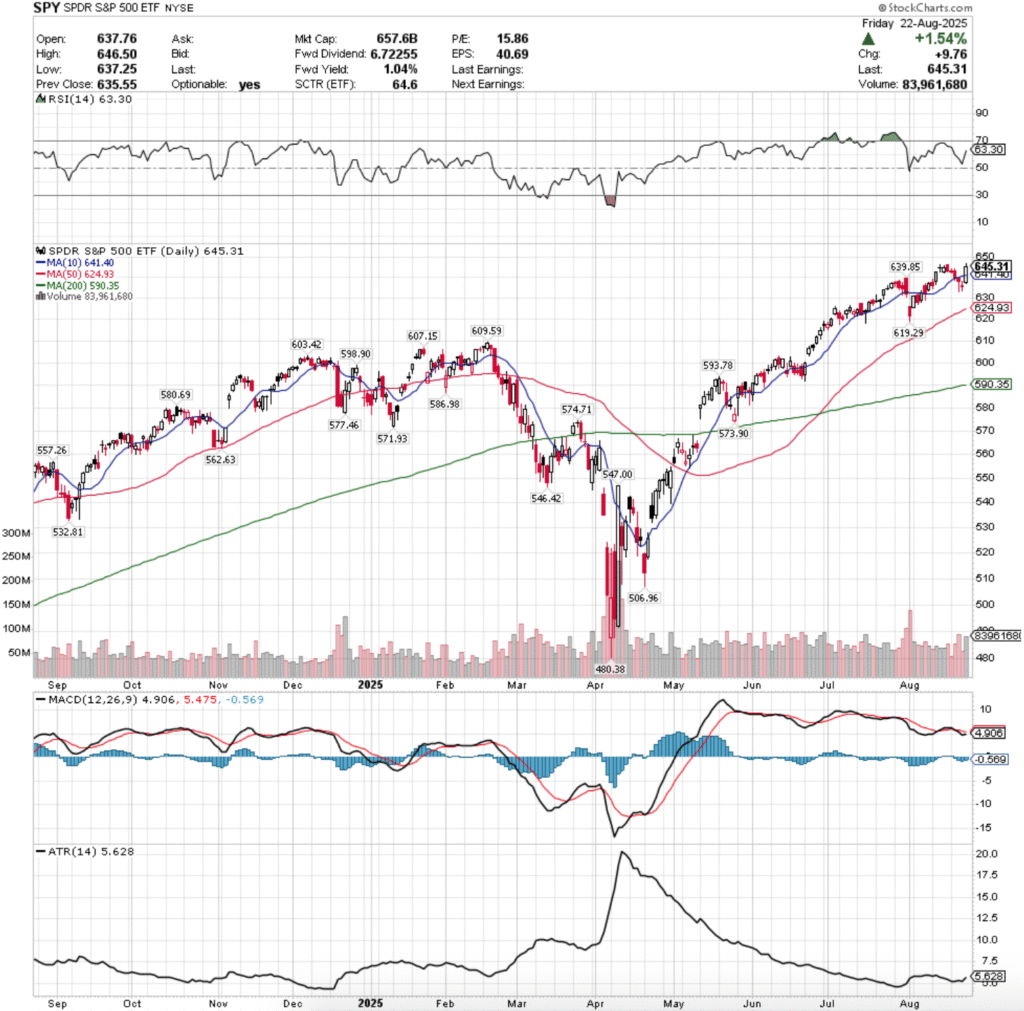
SPY, the SPDR S&P 500 ETF gained +0.56% last week, while the VIX closed the week at 15.18, indicating a range of one day implied movement of +/- 0.96% & an implied one month range of movement of +/-4.39%.

Their RSI is trending back down towards the neutral 50 level, sitting currently at 58.95, while their MACD is still bearish, but could dolphin up above the signal line briefly this week.
Volumes were -13.63% lower than the prior year’s average (53,177,500 vs. 61,569,641), with both of the highest sessions of the week being declining volume, which paints a rather grim picture for the near-term.
Tuesday opened the week up on a gap down that tested lower, but was able to power higher & close above its open, but still for an intraday loss of -0.74%
Wednesday opened on a gap up to be in-line with the 1 day moving average, indicating that the short-term trendline was where market participants valued SPY, but tested lower & closed as a small bodied spinning top, indicating that there was confusion among market participants, particularly given that the day closed lower than it opened.
The low volume, but larger lower shadow than upper shadow also signal that there was a little bit of profit taking given the small size of the candle’s real body.
Thursday opened in-line with the 10 day moving average, but was able to advance; however it was on the weaknest volume for the week, which is not a sign of strength behind the move.
Friday opened on a gap higher temporarilyget a new all-time high, before tumbling down through the 10 DMA’s support while investors took profits, and it closed for a day-over-day loss of -0.29%.
Looking into the new week the upside case is the same as it has been for months now, in order to continue paving the road for higher all-time highs that have consistency and staying power we need a to form a base that is anchored by stronger advancing volume.
The consolidation case involved oscillations around the 10 day moving average & between the 10 & 50 DMAs once the 50 DMA draws nearer.
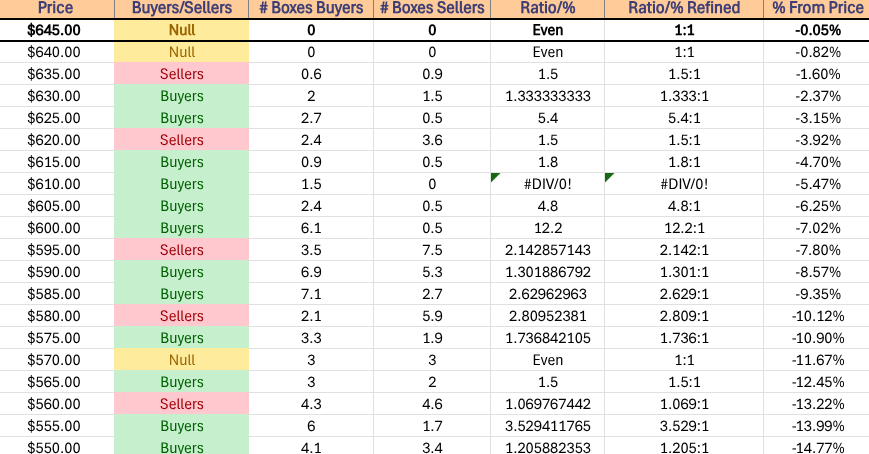
The downside case get’s interesting near the 50 day moving average, as it resides in a historic Sellers zone, and will be retested after some windows are closed from previous gaps, which will provide momentum behind the move.
Should the 50 DMA break down the next support levels is $619.29/share, which is the gatekeeper to the late 2024 to early 2025 consolidation zone.
SPY has support at the $645.39 (10 Day Moving Average, Volume Sentiment: NULL, 0:0*), $639.85 (Volume Sentiment: Sellers, 1.5:1), $633.14 (50 Day Moving Average, Volume Sentiment: Buyers, 1.33:1) & $619.29/share (Volume Sentiment: Buyers, 1.8:1) price levels, with resistance at the $562.21/share (All-Time High, Volume Sentiment: NULL, 0:0*) price levels.

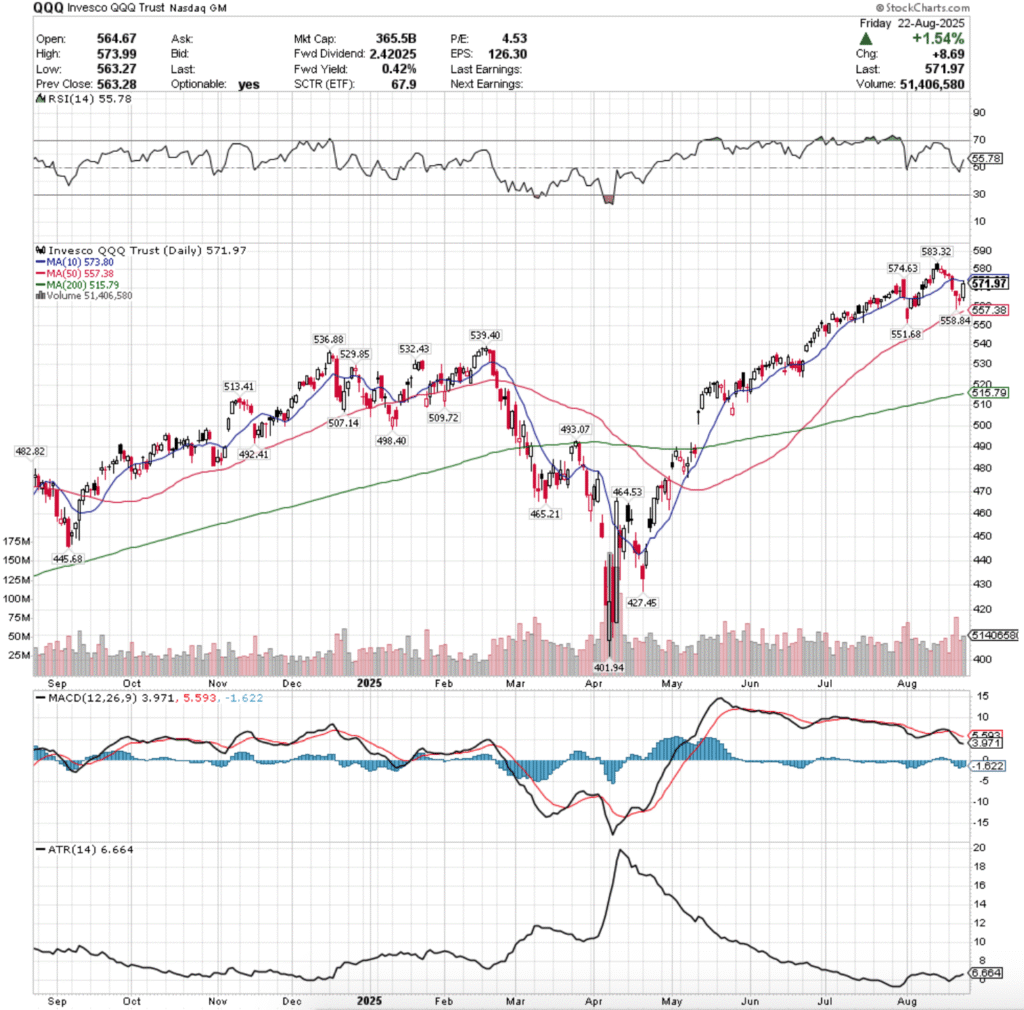
QQQ, the Invesco QQQ Trust ETF advanced +0.89% on the shortened holiday week, as the tech-heavy index was the top performer of the four majors.

Their RSI has flattened at the 57.2 mark, while their MACD is bearish & approaching the signal line & may briefly dolphin above it in the coming week.
Volumes were -4.92% lower than the prior year’s average (37,965,000 vs. 39,931,115), which is not a particularly strong sign given 3/4 of the sessions last week were on advancing volume.
Tuesday the week kicked off on a note of weakness, with QQQ opening on a gap down in-line with the 50 day moving average, temporarily breaking below it, but rallying to close higher than it opened, but still down -0.84% on the day.
Wednesday opened on a gap higher in-line with the 10 day moving average, tested both above it & below it, but closed as a doji in-line with the open & 10 DMA, indicating that there was fair valuto for QQQ names seen in line with the short-term trendline.
Thursday opened in a similar spot, tested below the 10 DMA temporarily, but recovered to rally higher for a gain of +0.91% on the day.
Friday was the week’s highest volume session & warning lights were flashing, as a gap up open at $580.49 tested slightly higher, before crumbling down to the 10 DMA’s support as profits were taken off the board & closed higher than Thursday’s session, but below it’s opening price.
The session’s high volumes can be attributed to profit taking throughout the day, as indicated by the gap up falling apart.
Moving into a new week, ORCL earnings & CPI/PPI data willl be the primary catalysts up or dows for QQQ.
Again, there will need to be sustainable, higher levels of advancing volume for any moves higher beyond their current all-time high that have staying power.
The consolidation case currently looks like QQQ oscillated between the 10 & 50 DMAs while playing wait & see with the data points listed above.
To the downside all eyes should focus on the 10 DMA & awaiting its breakdown, as once thatoccurred it’s -1.34% until price tests the 50 DMA’s support.
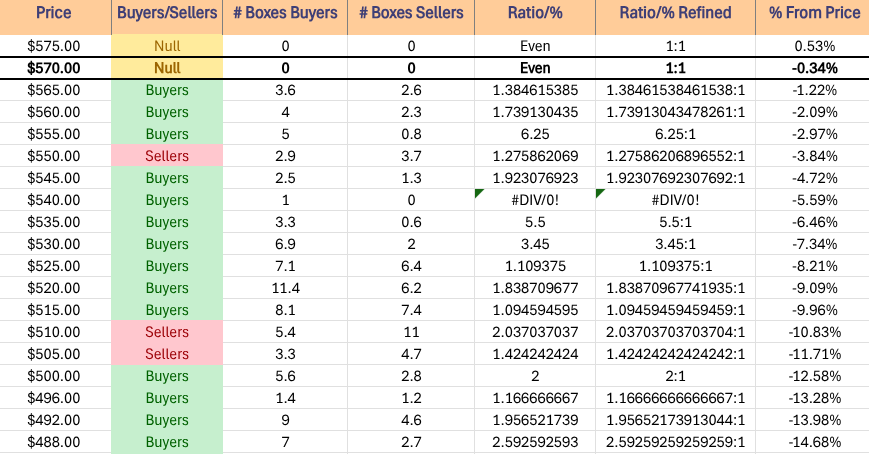
In the event of that breakdown, the $558.84/share level becomes important, as it’s the gatekeeper to the $550-554.99/share level which is historically dominated by Sellers (1.28:1) & has no support levels beneath it for ~2%+, which creates a different landscape for QQQ’s fourth quarter.
QQQ has support at the $574.63 (Volume Sentiment: NULL, 0:0*), $572.29 (10 Day Moving Average, Volume Sentiment: NULL, 0:0*), $564.62 (50 Day Moving Average, Volume Sentiment: Buyers, 1.74:1) & $558.84/share (Volume Sentiment: Buyers, 6.25:1) price levels, with resistance at the $583.32/share (Volume Sentiment: NULL, 0:0*) price levels.

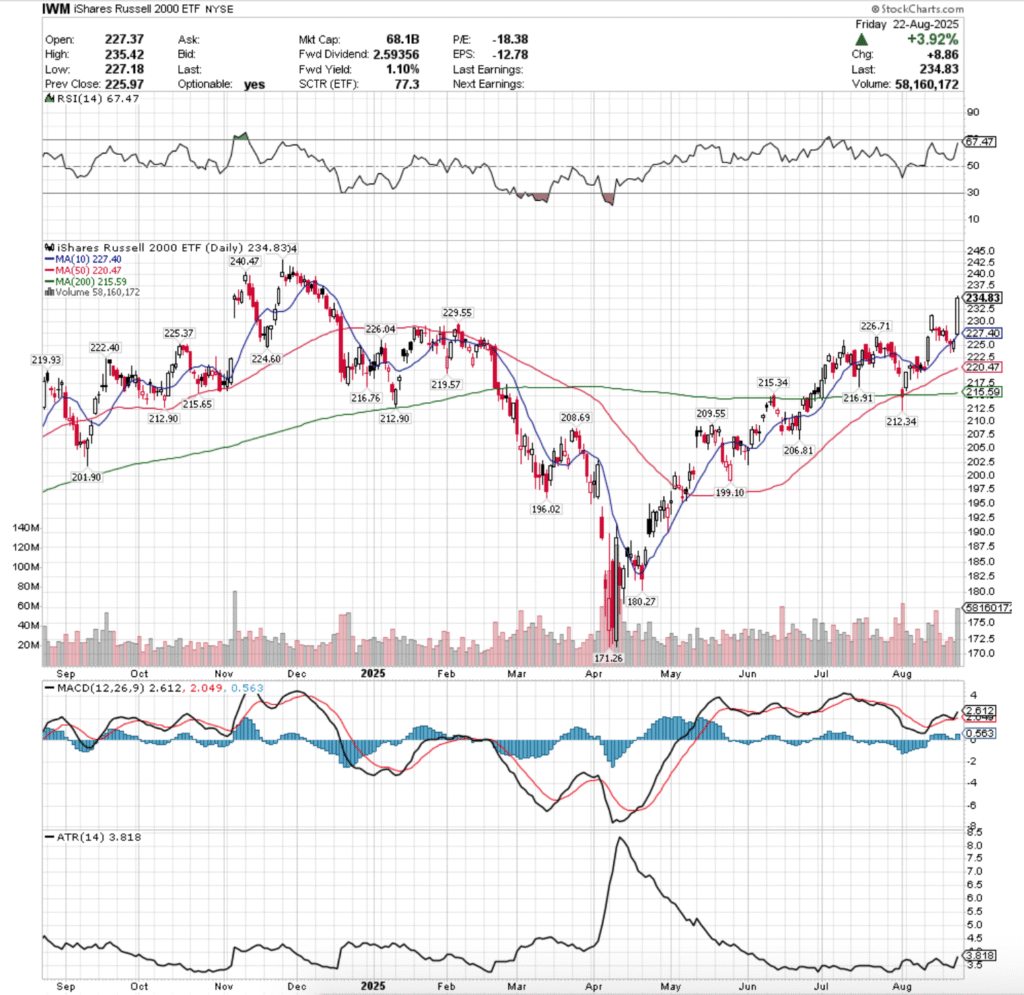
IWM, the iShares Russell 2000 ETF added +0.59% for the week, the second strongest showing among the four major index ETFs.

Their RSI is trending towards the overbought 70 level & currently sits at 66.65, while their MACD is bullish still, but its histogram is beginning to signal weakness on the horizon.
Volumes were -15.13% lower than the prior year’s average (25,995,000 vs. 30,628,645), which does not paint a rosy picture given that the week’s highest volume was one of the two advancing sessions; sentiment seems to be wavering.
Tuesday the week kicked off with a low volume session that opened on a gap lower, temporarily broke down the support of the 10 day moving average, before advancing to close higher than it opened, but down -0.54% on the day.
Wednesday opened lower, again tested the 10 DMA’s support, and again passed the test.
However, the size of the upper shadow show that the bulls were not in control, and that short term profit taking was occurring.
Thursday opened higher, in-line with he 10 day moving average, gained +1.25% on the day, but the story behind the move was weak, given that it occurred on the lowest volume session of an already low volume week.
Frdiday confirmed this, as the week’s highest volume session opened on a gap up, tested as high as $239.68 & as low as the 10 DMA, but support held up & the session closed as a doji.
The volumes account for a lot of profit taking in the near-term, and while the 10 DMA held up, market participants should view this as uneasiness moving into a new week.
The upside case for IWM remains the same as the weeks prior, with the other major indexes of large cap stocks so close to all-time highs, without the others moving on to new all-time highs, expect IWM to oscillate higher at the more steady pace than the others.
The consolidation case sees IWM oscillating around the 10 day moving average, as it awaits an upside or downside catalyst.
The 50 DMA is ~4% away, so that likely will not come into play this week, but perhaps next.
The downside here focuses on the 10 DMA’s support breaking down, which has remained resilient since mid-August.
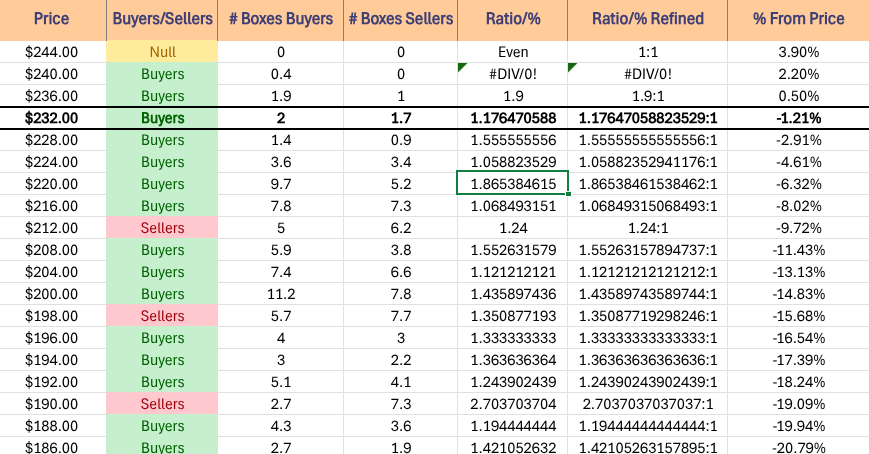
Once thatbreaks down, the $229.55 & $226.04-226.71/share zone become the gatekeepers to the 50 day moving average retest & will be key areas to watch in the coming week.
It is also worth noting that the closer we get to the 50 DMA, the weaker Buyer sentiment has been historically, as shown in the table below.
IWM has support at the $235.07 (10 Day Moving Average, Volume Sentiment: Buyers, 1.18:1), $229.55 (Volume Sentiment: Buyers, 1.56:1), $226.71 (Volume Sentiment: Buyers, 1.06:1) & $226.04/share (Volume Sentiment: Buyers, 1.06:1) price levels, with resistance at the $240.47 (Volume Sentiment: Buyers, 0.4:0*) & $243.04/share (All-Time High, Volume Sentiment: Buyers, 0.4:0*) price levels.

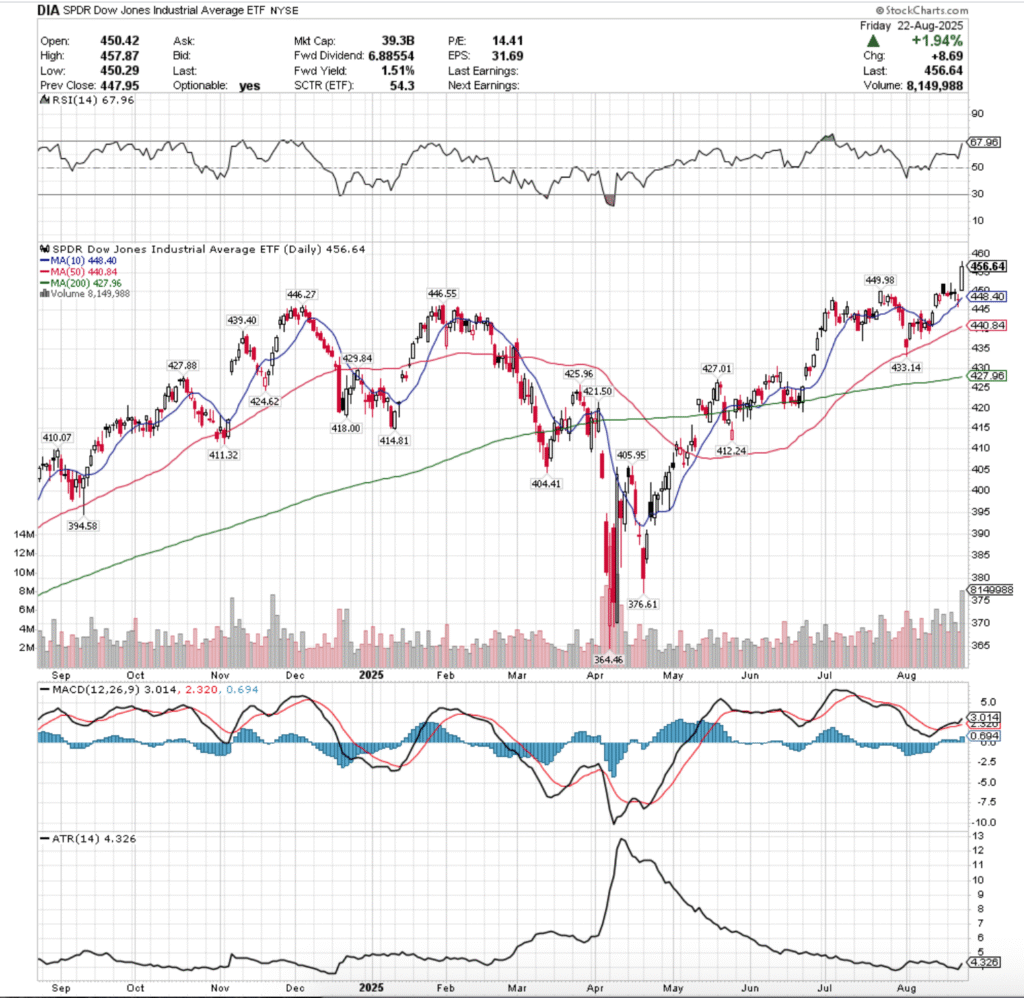
DIA, the SPDR Dow Jones Industrial Average ETF inched forward +0.03% for the week, as the blue chip index was the least favored among market participants.

Their RSI is currently trending down towards the neutral 50 level & sits at 58.88, while their MACD is flat & likely to cross bearishly in the coming week.
Volumes were +3.11% higher than the prior year’s average (3,402,500 vs. 3,299,880), which shows that there was complacency in the market, especially given that the week was only four sessions.
Tuesday DIA opened on a gap down to below the 10 day moving average, tested lower & was able to recover to close just below the 10 DMA’s resistance on the week’s highest volume, indicating that the market valued DIA lower, but some optimists remained.
Wednesday this trend continued, as DIA again opened lower, tested almost as low as Tuesday, before closing -0.08% on the day on the lowest volume of the week.
Thursday opened higher & managed to break above the 10 DMA’s resistance intraday & close above it, but the volume paled in comparison to the three sessions of declining volume that made up the rest of the week.
Friday the week wound down on a session that opened slightly higher, tested up to the new all-time high, before collapsing down to $$452.98/share level & settling just below the 10 day moving average.
The volume story here shows that there was still significant hesitency & downside appetite, particularly when you look at the declining volume vs. advancing volume of the week & profits were certainly being taken after a stronger August than anticipated.
Moving into a new week, the upside case for DIA remains the same as it has been for months now, new all-time highs will only continue in a choppy manner like last week, and or with continued higher levels of advancing volume in order to prove sustainable.
The 10 day moving average will also need to show considerable strength compared to that of last week in order to support any upside moves.
The consolidation case remains similar, expect to see DIA oscillate around the 10 DMA & between it and the 50 DMA as it draws nearer & we await an upside or downside catalyst.
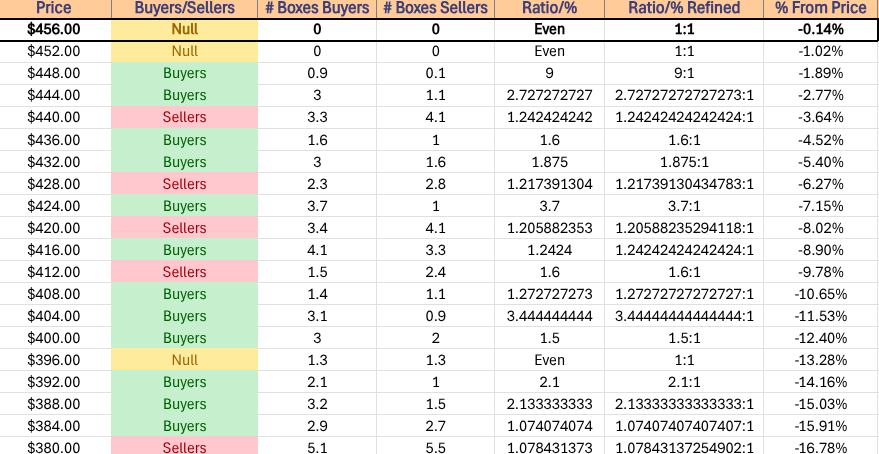
To the downside things have changed a bit, with the 50 day moving average drawing nearer to price by the day, a gap down of <2% suddenly has that support levels being tested, which hasn’t happened since early August.
The $450.29/share level is also going to be of interest, as if it gives out DIA will begin to close windows from August that are still open, which leads to said 50 DMA test & will have some level of steam built up behind it, particularly after the declining volume of the past week.
DIA has support at the $449.98 (Volume Sentiment: Buyers, 9:1), $446.55 (Volume Sentiment: Buyers, 2.73:1), $446.27 (Volume Sentiment: Buyers, 2.73:1) & $446.27/share (50 Day Moving Average, Volume Sentiment: Buyers, 2.73:1) price levels, with resistance at the $455.20 (10 Day Moving Average, Volume Sentiment: NULL, 0:0*) & $458.67/share (All-Time High, Volume Sentiment:NULL, 0:0*) price levels.

The Week Ahead
Monday brings us Consumer Credit data at 3pm.
Planet Labs reports earnings before Monday’s closing bell, before Casey’s General & Mission Produce report after the session’s close.
NFIB Optimism Index data comes out Tuesday at 6 am.
Tuesday morning kicks off with earnings from Core & Main, Hello Group, Korn/Ferry & Sail point, before AeroVironment, Calavo Growers, GameStop, Oracle, Rubrik & Synopsys report following the closing bell.
Wednesday morning features Producer Price Index, Core PPI, PPI Year-over-Year & Core PPI Year-over-Year at 8:30 am & Wholesale Inventories data at 10 am.
Chewy reports before Wednesday’s open, before Oxford Industries reports earnings after the day’s close.
Consumer Price Index, CPI Year-over-Year, Core CPI, Core CPI Year-over-Year & Initial Jobless Claims data all comes out Thursday at 8:30 am, followed by Monthly U.S. Budget data at 2pm.
Thursday morning brings earnings from Kroger & Lovesac, before Adobe reports after the closing bell.
Friday morning features Consumer Sentiment (prelim) data at 10 am & there are no noteworthy earnings scheduled for release.
See you back here next week!
*** I DO NOT OWN SHARES OR OPTIONS CONTRACT POSITIONS IN SPY, QQQ, IWM OR DIA AT THE TIME OF PUBLISHING THIS ARTICLE ***