YINN, the Direxion Daily FTSE China Bull 3x Shares ETF has gained +10.57% over the past year, advancing +145.15% from their 52-week low in January of 2024 & sits just -2.49% below their 52-week high (all figures ex-distributions).
Yesterday YINN had a strong performance, gapping up & closing +29.13% after the PBOC announced new stimulus measures.
YINN tracks the FTSE China 50 Index, which are fifty of the largest companies that trade on the Hong Kong Stock Exchange.
Some of these names include Tencent Holdings Shares, Alibaba Group, Meituan, China Construction Bank Class H, Industrial Commerce Bank China Class H, Bank of China H, Netease Inc., JD.com, Xiaomi Corporations & BYD.
Investors who are bullish on Chinese companies can use YINN to get portfolio exposure to their names & for those who are bearish on Chinese companies there is also a YANG ETF, as well as put options against YINN.
Below is a brief technical analysis of YINN’s past week & a half, as well as a price level:volume sentiment analysis of the price levels YINN has traded at over the past 1-2 years.
Included in this data is also their recent support & resistance levels so that readers can gain insight into how strong/weak these support/resistance levels may be in the future, based on past investor behavior.
It is not intended to serve as financial advice, but rather as an additional tool to reference while performing your own due diligence on YINN.
Technical Analysis Of YINN, The Direxion Daily FTSE China Bull 3x Shares ETF
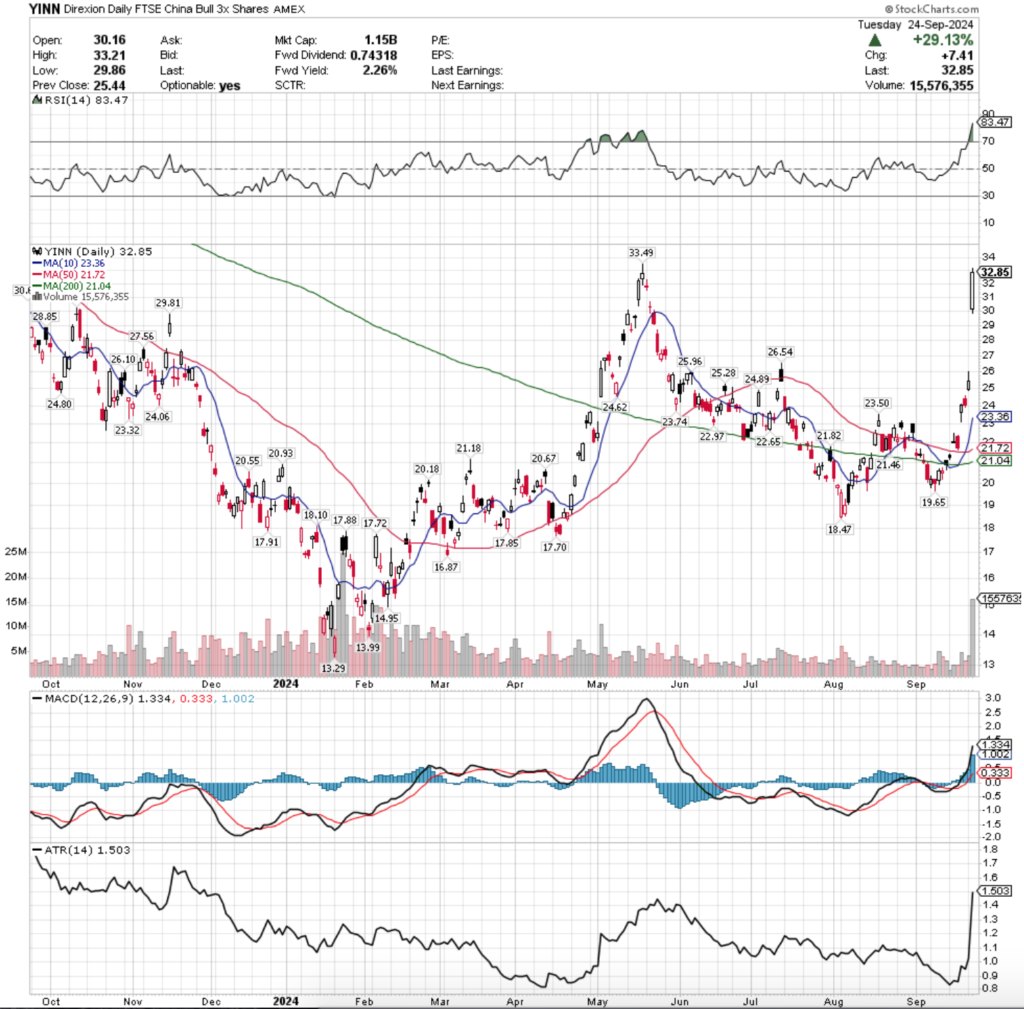
YINN ETF – Direxion Daily FTSE China Bull 3x Shares ETF’s Technical Performance Over The Past Year
Their RSI is currently overbought following yesterday’s +29.13% gap up session, while their MACD is bullish.
Volumes were +17.09% above the past year’s average over the past week (5,966,000 vs. 5,090,158.73), mostly driven by the high volumes of yesterday’s session, as the session’s of the days before it all have relatively muted volume.
Last Monday saw YINN gap up to above the support of their 10 & 200 day moving averages, while remaining below the 50 DMA’s resistance.
The gap ups continued on Tuesday, as YINN jumped again to pass beyond the 50 day moving average’s resistance.
Tuesday’s session did come with a hint of bearishness though, as the day’s candle resulted in a gravestone doji, which led into Wednesday’s profit taking decline.
While Wednesday formed a bearish engulfing pattern with Tuesday’s candle, it was supported by the 50 day moving average.
YINN began moving rather erratically after Wednesday, as Thursday resulted in a gap up to just below the $24/share level, tested lower to almost reach $23/share but ultimately rallied higher to close above $24/share.
The week closed out with market participants taking profits, but not until after Friday morning opened with a gap up, only to settle one penny lower than Thursday’s close at $24.03/share heading into the weekend.
While Friday’s volume was higher than Wednesday’s, both were still quite below average compared to the previous year.
This week opened on another gap up (quite the theme here), while prices ran up to the $26/share mark intraday, only to settle at $25.44/share for the day on lackluster volumes again.
Following the news out of the PBOC regarding stimulus yesterday’s session saw a massive +29.13% gap up, the sixth gap up of the past seven opens.
This jumpy behavior should be viewed with a skeptical brow raised, particularly given how low recent volumes have been with the exception of yesterday’s.
Yesterday’s session has created a large window in YINN’s price, which will be an area to keep an eye on in the coming weeks as it is likely to be filled.
While that occurs, it is important to have an understanding of how investors have behaved at YINN’s previously traded at price levels in order to understand how they may behave at these levels again.
This will help navigate how market participants may behave again at the same levels in the event of support level re-tests.
Price Level:Volume Sentiment Analysis Of YINN, The Direxion Daily FTSE China Bull 3x Shares ETF
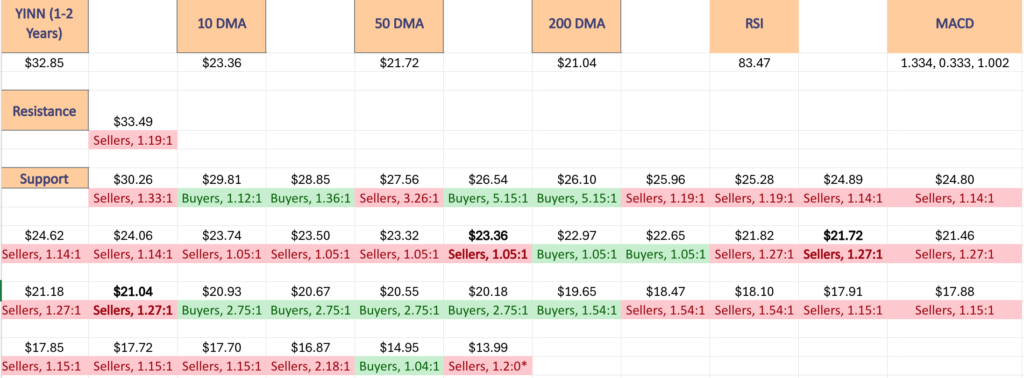
The top table below shows the support & resistance levels of YINN from the past year’s chart, as well as their price level:volume sentiment at each, using Tuesday 9/24/24’s closing price.
The moving averages are denoted with bold.
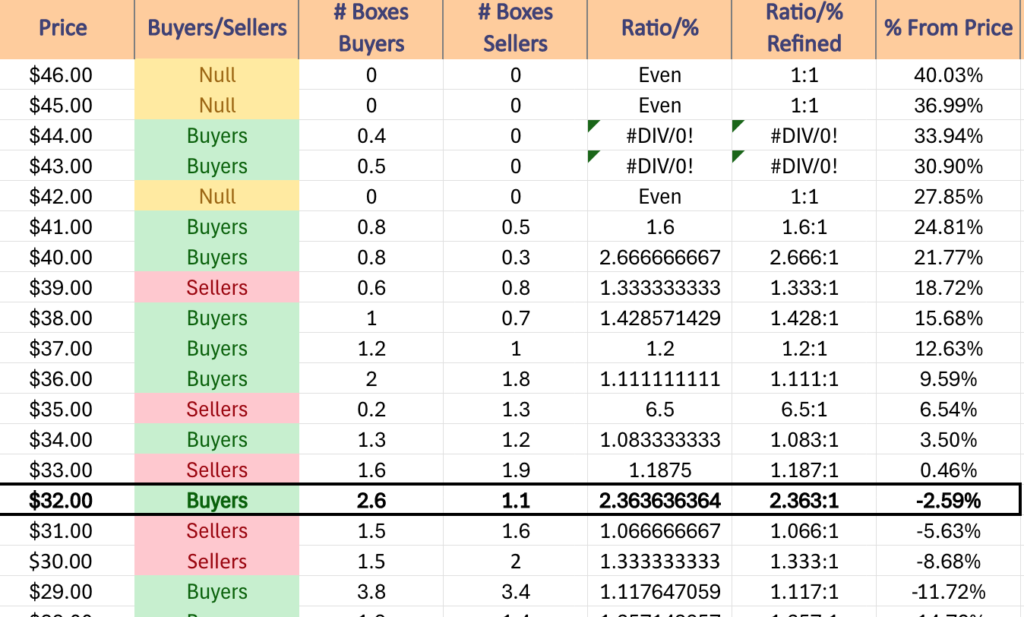
The next charts show the volume sentiment at each individual price level YINN has traded at over the past 1-2 years.
Beneath them is a copy & pasteable list of the same data, where the support/resistance levels are denoted in bold.
All ratios with “0” in the denominator are denoted with a “*”.
NULL values are price levels that had limited trading volume, whether it be due to gaps, quick advances or they are at price extremes; in the event that they are retested & there is more data they would have a distinct “Buyers”, “Sellers” or “Even” title.
This is not intended as financial advice, but rather another tool to consider when performing your own research & due diligence on YINN ETF.
YINN ETF’s Price Level:Volume Sentiment Over The Past 1-2 Years At Their One Year Support & Resistance Levels
Price Level:Volume Sentiment For YINN ETF Over The Past 1-2 Years
Price Level:Volume Sentiment For YINN ETF Over The Past 1-2 Years
YINN ETF’s Price Level:Volume Sentiment Over The Past 1-2 Years
$46 – NULL – 0:0*, +40.03% From Current Price Level
$45 – NULL – 0:0*, +36.99% From Current Price Level
$44 – Buyers – 0.4:0*, +33.94% From Current Price Level
$43 – Buyers – 0.5:0*, +30.9% From Current Price Level
$42 – NULL – 0:0*, +27.85% From Current Price Level
$41 – Buyers – 1.6:1, +24.81% From Current Price Level
$40 – Buyers – 2.67:1, +21.77% From Current Price Level
$39 – Sellers – 1.33:1, +18.72% From Current Price Level
$38 – Buyers – 1.43:1, +15.68% From Current Price Level
$37 – Buyers – 1.2:1, +12.63% From Current Price Level
$36 – Buyers – 1.11:1, +9.59% From Current Price Level
$35 – Sellers – 6.5:1, +6.54% From Current Price Level
$34 – Buyers – 1.08:1, +3.5% From Current Price Level
$33 – Sellers – 1.19:1, +0.46% From Current Price Level
$32 – Buyers – 2.36:1, -2.59% From Current Price Level – Current Price Level*
$31 – Sellers – 1.07:1, -5.63% From Current Price Level
$30 – Sellers – 1.33:1, -8.68% From Current Price Level
$29 – Buyers – 1.12:1, -11.72% From Current Price Level
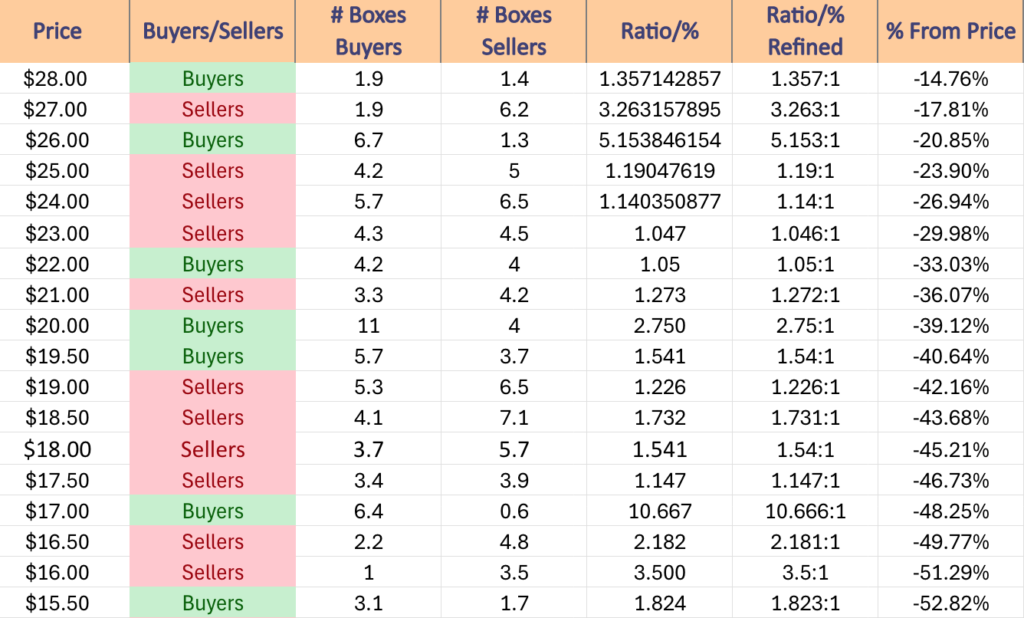
$28 – Buyers – 1.36:1, -14.76% From Current Price Level
$27 – Sellers – 3.26:1, -17.81% From Current Price Level
$26 – Buyers – 5.13:1, -20.85% From Current Price Level
$25 – Sellers – 1.19:1, -23.9% From Current Price Level
$24 – Sellers – 1.14:1, -26.94% From Current Price Level
$23 – Sellers – 1.05:1, -29.98% From Current Price Level – 10 Day Moving Average*
$22 – Buyers – 1.05:1, -33.03% From Current Price Level
$21 – Sellers – 1.27:1, -36.07% From Current Price Level – 50 & 200 Day Moving Averages**
$20 – Buyers – 2.75:1, -39.12% From Current Price Level
$19.50 – Buyers – 1.54:1, -40.64% From Current Price Level
$19 – Sellers – 1.23:1, -42.16% From Current Price Level
$18.50 – Sellers – 1.73:1, -43.68% From Current Price Level
$18 – Sellers – 1.54:1, -45.21% From Current Price Level
$17.50 – Sellers – 1.15:1, -46.73% From Current Price Level
$17 – Buyers – 10.67:1, -48.25% From Current Price Level
$16.50 – Sellers – 2.18:1, -49.77% From Current Price Level
$16 – Sellers – 3.5:1, -51.29% From Current Price Level
$15.50 -Buyers – 1.82:1, -52.82% From Current Price Level
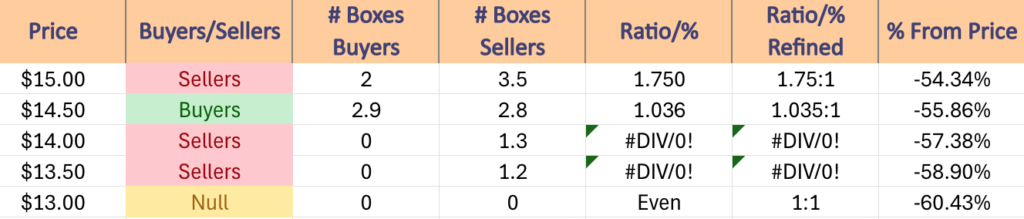
$15 – Sellers – 1.75:1, -54.34% From Current Price Level
$14.50 – Buyers – 1.04:1, -55.86% From Current Price Level
$14 – Sellers – 1.3:0*, -57.38% From Current Price Level
$13.50 – Sellers – 1.2:0*, -58.9% From Current Price Level
$13 – NULL – 0:0*, -60.43% From Current Price Level
*** I DO NOT OWN SHARES OR OPTIONS CONTRACT POSITIONS IN YINN ETF AT THE TIME OF PUBLISHING THIS ARTICLE ***
The VIX closed at 15.39, indicating an implied one day move of +/-0.97% & an implied one month move of +/-4.45% for the S&P 500.
Highest Technical Rated S&P 500 Components Per 9/24/2024’s Close:
1 – VST
2 – CEG
3 – PLTR
4 – ERIE
5 – IRM
6 – FICO
7 – MMM
8 – TRGP
9 – NEM
10 – ORCL
Lowest Technical Rated S&P 500 Components Per 9/24/2024’s Close:
1 – WBA
2 – MRNA
3 – DLTR
4 – DG
5 – DXCM
6 – SMCI
7 – INTC
8 – BBWI
9 – LULU
10 – BA
Highest Volume Rated S&P 500 Components Per 9/24/2024’s Close:
1 – GPN
2 – CHTR
3 – REGN
4 – MCK
5 – BRO
6 – AZO
7 – WYNN
8 – FCX
9 – FDX
10 – INVH
Lowest Volume Rated S&P 500 Components Per 9/24/2024’s Close:
1 – K
2 – PARA
3 – HSIC
4 – BAX
5 – DELL
6 – POOL
7 – GS
8 – MPWR
9 – TER
10 – HPE
Highest Technical Rated ETFs Per 9/24/2024’s Close:
1 – YINN
2 – BABX
3 – XPP
4 – UTSL
5 – JNUG
6 – TSLL
7 – DRN
8 – TSLR
9 – AGQ
10 – GDMN
Lowest Technical Rated ETFs Per 9/24/2024’s Close:
1 – YANG
2 – TSLZ
3 – TSDD
4 – JDST
5 – TSLQ
6 – UVIX
7 – FXP
8 – SSG
9 – CONL
10 – DUST
Highest Volume Rated ETFs Per 9/24/2024’s Close:
1 – XFEB
2 – XAPR
3 – BNE
4 – XJAN
5 – XNOV
6 – FSEP
7 – INKM
8 – HF
9 – FAPR
10 – UFIV
Lowest Volume Rated ETFs Per 9/24/2024’s Close:
1 – SEPZ
2 – EHLS
3 – TAFL
4 – XHYC
5 – TOGA
6 – ESGB
7 – SHUS
8 – VNSE
9 – PSTR
10 – CVRT
Highest Technical Rated General Stocks Per 9/24/2024’s Close:
1 – LASE
2 – TIL
3 – NEON
4 – ADD
5 – TSSI
6 – EJH
7 – ENCC
8 – SMMT
9 – COMM
10 – VST
Lowest Technical Rated General Stocks Per 9/24/2024’s Close:
1 – MULN
2 – UPC
3 – YELLQ
4 – WTO
5 – VMAR
6 – SLXN
7 – NDRA
8 – ADTX
9 – IVP
10 – PEGY
Highest Volume Rated General Stocks Per 9/24/2024’s Close:
1 – TWO
2 – OUT
3 – XHG
4 – MSS
5 -SEEL
6 – FPH
7 – HSCS
8 – CAPR
9 – BNZI
10 – TRNR
Lowest Volume Rated General Stocks Per 9/24/2024’s Close:
1 – EGIOQ
2 – ASAPF
3 – TAOIF
4 – BSGM
5 – GOLLQ
6 – DBLVF
7 – BRVMF
8 – ATPC
9 – PSYTF
10 – LSANF
*** THE LIST ABOVE IS STRICTLY FOR INFORMATIONAL PURPOSES – I MAY OR MAY NOT HAVE OR INITIATE A LONG, SHORT, OR LONG/SHORT POSITION IN ANY NAME ABOVE AT ANY TIME ***
The VIX closed at 15.89, indicating an implied one day move of +/-1.00% & a one month implied move of +/-4.59% for the S&P 500.
Highest Technical Rated S&P 500 Components Per 9/23/2024’s Close:
1 – VST
2 – CEG
3 – PLTR
4 – FICO
5 – ERIE
6 – IRM
7 – TRGP
8 – CARR
9 – ORCL
10 – MMM
Lowest Technical Rated S&P 500 Components Per 9/23/2024’s Close:
1 – WBA
2 – MRNA
3 – DLTR
4 – DG
5 – DXCM
6 – SMCI
7 – INTC
8 – EL
9 – LULU
10 – BBWI
Highest Volume Rated S&P 500 Components Per 9/23/2024’s Close:
1 – CEG
2 – REGN
3 – MPC
4 – VST
5 – INTC
6 – CTSH
7 – FDX
8 – FANG
9 – AJG
10 – BG
Lowest Volume Rated S&P 500 Components Per 9/23/2024’s Close:
1 – ADI
2 – TFX
3 – SWKS
4 – K
5 – GS
6 – HOLX
7 – POOL
8 – KLAC
9 – RVTY
10 – TXN
Highest Technical Rated ETFs Per 9/23/2024’s Close:
1 – UTSL
2 – NAIL
3 – DRN
4 – UPW
5 – BABX
6 – DFEN
7 – FBL
8 – TSLL
9 – NUGT
10 – JNUG
Lowest Technical Rated ETFs Per 9/23/2024’s Close:
1 – TSLZ
2 – TSDD
3 – NVDQ
4 – NVD
5 – MRNY
6 – UVIX
7 – TSLQ
8 – CONL
9 – JDST
10 – SSG
Highest Volume Rated ETFs Per 9/23/2024’s Close:
1 – AVXC
2 – FLRG
3 – OCTZ
4 – UFO
5 – BLLD
6 – GCLN
7 – GSEP
8 – HAWX
9 – KBWP
10 – FSEP
Lowest Volume Rated ETFs Per 9/23/2024’s Close:
1 – XHYI
2 – VNSE
3 – BHYB
4 – AUGZ
5 – XHYC
6 – SHUS
7 – IQHI
8 – NRES
9 – ISDB
10 – AGRH
Highest Technical Rated General Stocks Per 9/23/2024’s Close:
1 – LASE
2 – TIL
3 – ADD
4 – NEON
5 – TSSI
6 – LUMN
7 – COMM
8 – SMMT
9 – BASA
10 – ZIVO
Lowest Technical Rated General Stocks Per 9/23/2024’s Close:
1 – HPCO
2 – MULN
3 – WTO
4 – SIRI
5 – VMAR
6 – NDRA
7 – SLXN
8 – MLGO
9 – PEGY
10 – IVP
Highest Volume Rated General Stocks Per 9/23/2024’s Close:
1 – KAVL
2 – TWO
3 – UXIN
4 – OUT
5 – EDUC
6 – LGCB
7 – TGL
8 – NUKK
9 – NVVE
10 – SUUN
Lowest Volume Rated General Stocks Per 9/23/2024’s Close:
1 – VTDRF
2 – SCRYY
3 – GCEH
4 – OMQS
5 – GASXF
6 – GENGF
7 – SVBL
8 – ATCMF
9 – VHIBF
10 – EIGRQ
*** THE LIST ABOVE IS STRICTLY FOR INFORMATIONAL PURPOSES – I MAY OR MAY NOT HAVE OR INITIATE A LONG, SHORT, OR LONG/SHORT POSITION IN ANY NAME ABOVE AT ANY TIME ***
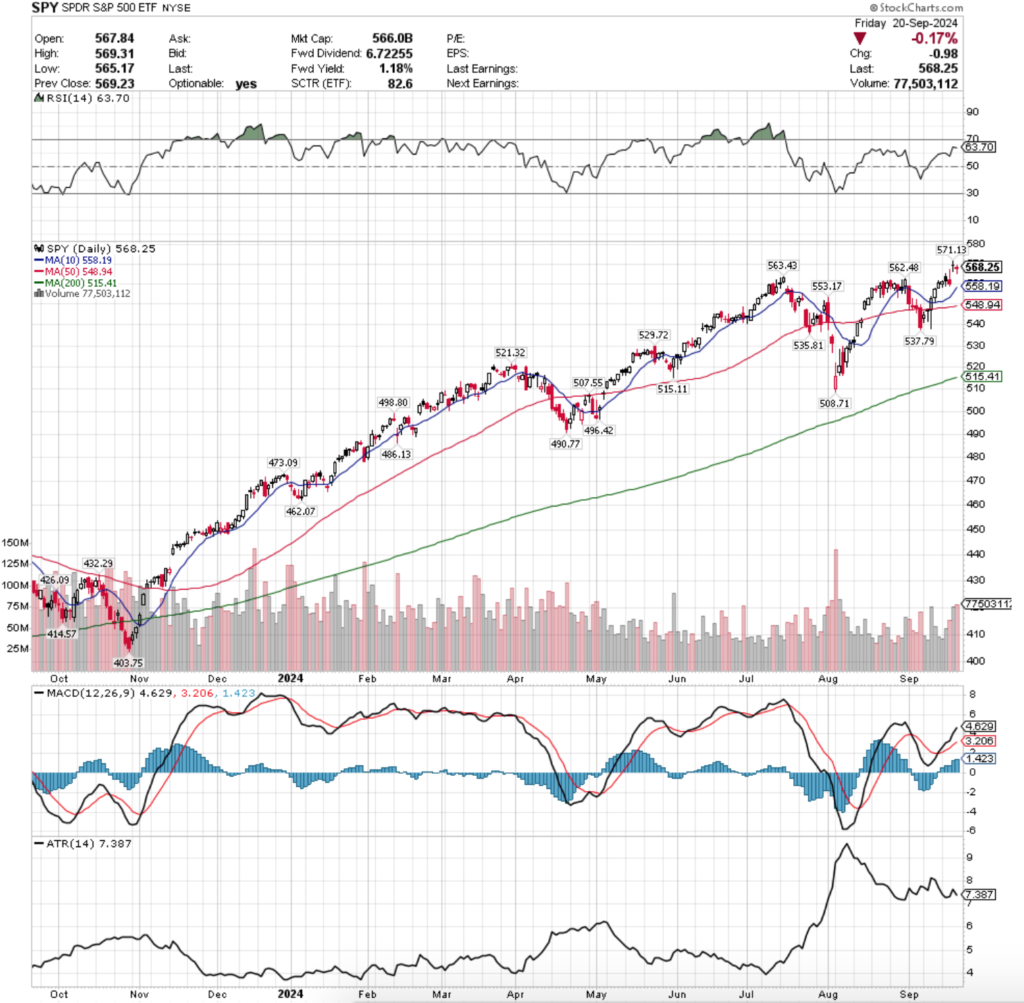
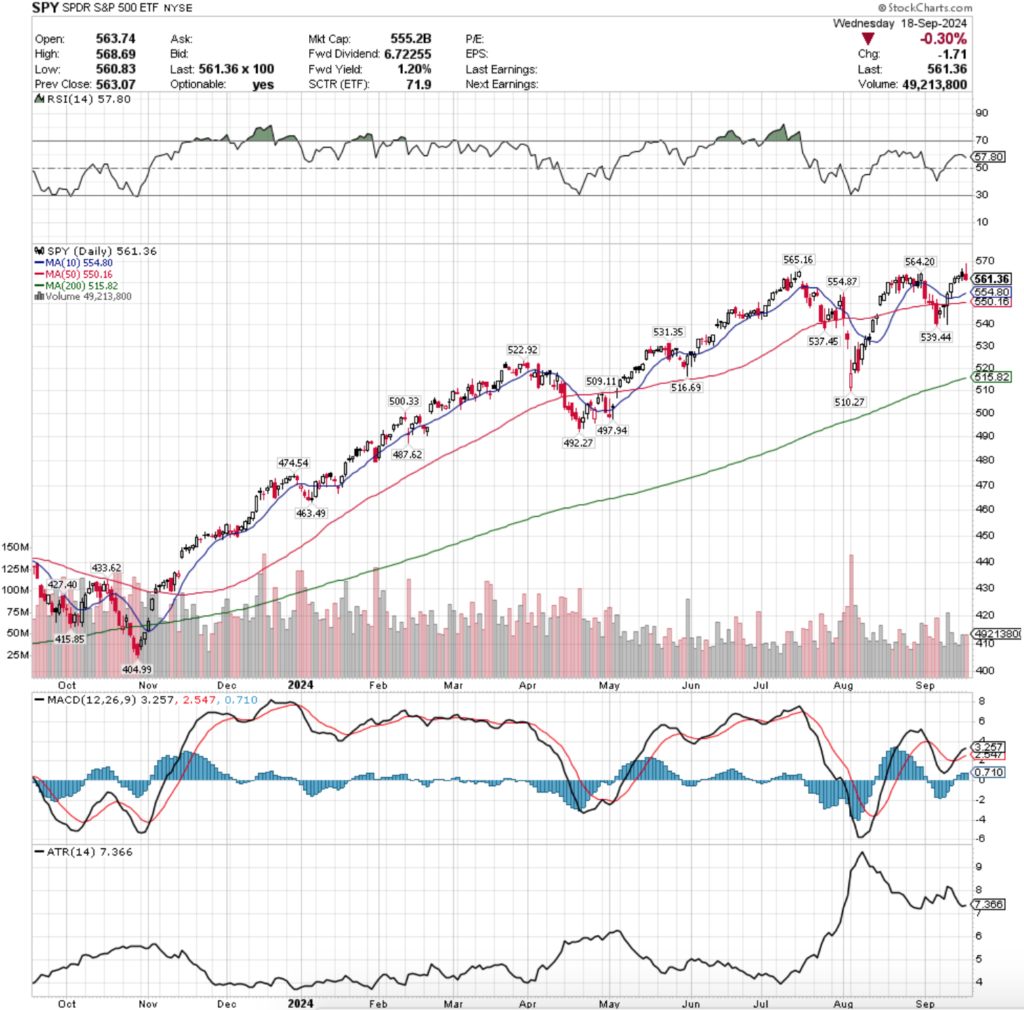
SPY, the SPDR S&P 500 ETF had the weakest week of the major four indexes, gaining only +1.11%, while the VIX finished the week at 16.15, indicating a one day implied move of +/-1.02% & an implied one month move of +/-4.67% for the S&P 500.
SPY ETF – SPDR S&P 500 ETF’s Technical Performance Over The Past Year
Their RSI is currently at 63.7 & has curled over bearishly after Friday’s session which will be something to keep an eye on moving into this week.
SPY’s MACD is still bullish following Thursday’s gap up session, however it should be noted that Thursday’s gains were only due to the gap up & their closing price was lower than their opening price.
Volumes were still weak, finishing the week -12.16% below the past year’s average (59,568,000 vs. 67,816,126), which is problematic given that two of the week’s three highest volume sessions were declining sessions.
The week began on a note of uncertainty, as Monday’s session was a tight range advance on the week’s lowest volume that barely closed above the previous Friday’s close.
Tuesday continued this theme, as despite a gap up on the open, the day closed lower, although still higher than Monday’s close & the candle’s lower shadow shows that there was a bit of appetite to the downside compared to the upside.
Wednesday is when weakness began to show itself as the session tested higher than Tuesday’s high before ultimately giving everything back & resulting in a decline on higher volume than the previous two days as market participants were eager to take some chips off of the table.
Thursday gapped higher on the second highest volume of the week, but resulted in a long-legged doji indicating uncertainty among market participants.
It should be noted that the session closed lower than it opened on Thursday, which indicates that the day’s open was deemed to be too high by investors.
Friday solidified this sentiment, as the day opened on a gap lower on the highest volume of the week as folks were eager to remove risk before heading into the weekend.
Friday tested more to the downside than upside based on the length of the day’s candle’s lower & upper shadows but the session only closed down -0.17%.
Heading into this week there are still a handful of earnings calls including Costco, as well as a plethora of economic data & Fed speakers which should make for an interesting week.
All eyes will be on the $562.48-563.43 support zone this week, as a ~1% downside move will test these support levels that have developed over the past two months when prices reached new peaks & began declining.
Prices have broken out but not progressed much higher & have declined since setting the new all-time high.
This looks possible given the lack of strength behind the mid-to-end of week performance of SPY last week.
Watch the MACD histogram for clues into this, as if the bars begin to get lower day-over-day it will signal that there is not much steam left & that there is an impending decline.
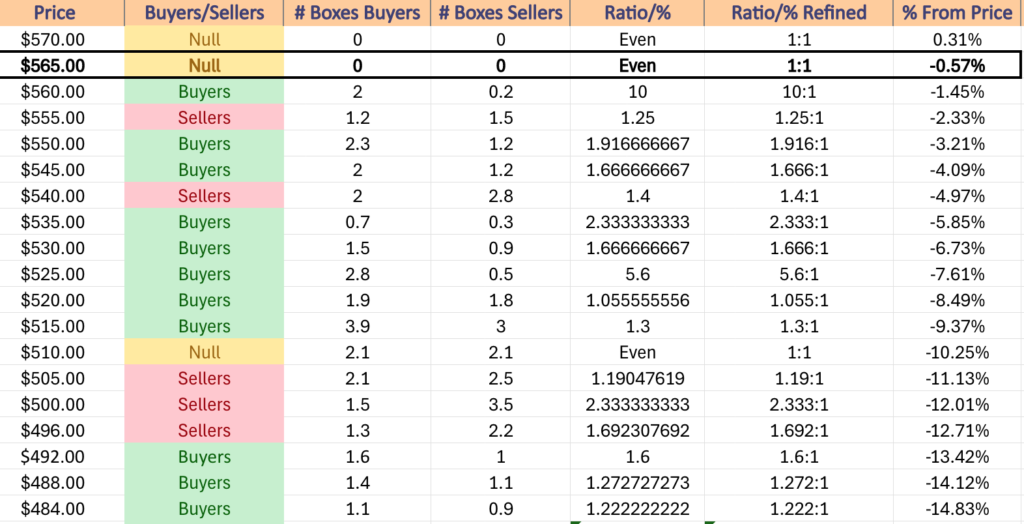
In the event that this happens, it will be interesting to see where support is found, as while the $560-565 price zone is 10:1 Buyers:Sellers historically, it is still relatively untested, given that it is home to the recent resistance level that was not broken through until Thursday of last week.
There is -1.77% difference between the current price of SPY & their 10 day moving average, with an additional -1.66% difference between the 10 & 50 DMAs for support, which if the support zone mentioned above breaks down will likely see a test given that the $555-559.99 price window is seller dominated 1.25:1.
Based on the weakness/uncertainty of the past two sessions it is uncertain as to how much higher SPY can climb in the event of positive news, as market participants look to be on edge at these current price levels & after the past few months.
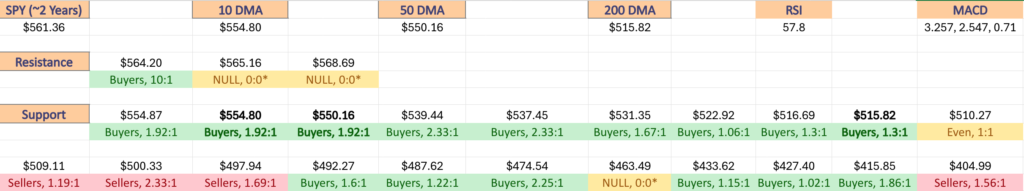
SPY has support at the $563.43 (Volume Sentiment: Buyers, 10:1), $562.48 (Volume Sentiment: Buyers, 10:1), $558.19 (10 Day Moving Average, Volume Sentiment: Sellers, 1.25:1) & $553.17/share (Volume Sentiment: Buyers, 1.92:1) price levels, with resistance at the $571.13/share (All-Time High, Volume Sentiment: NULL, 0:0*) price levels.
SPY ETF’s Price Level:Volume Sentiment Over The Past ~2 Years
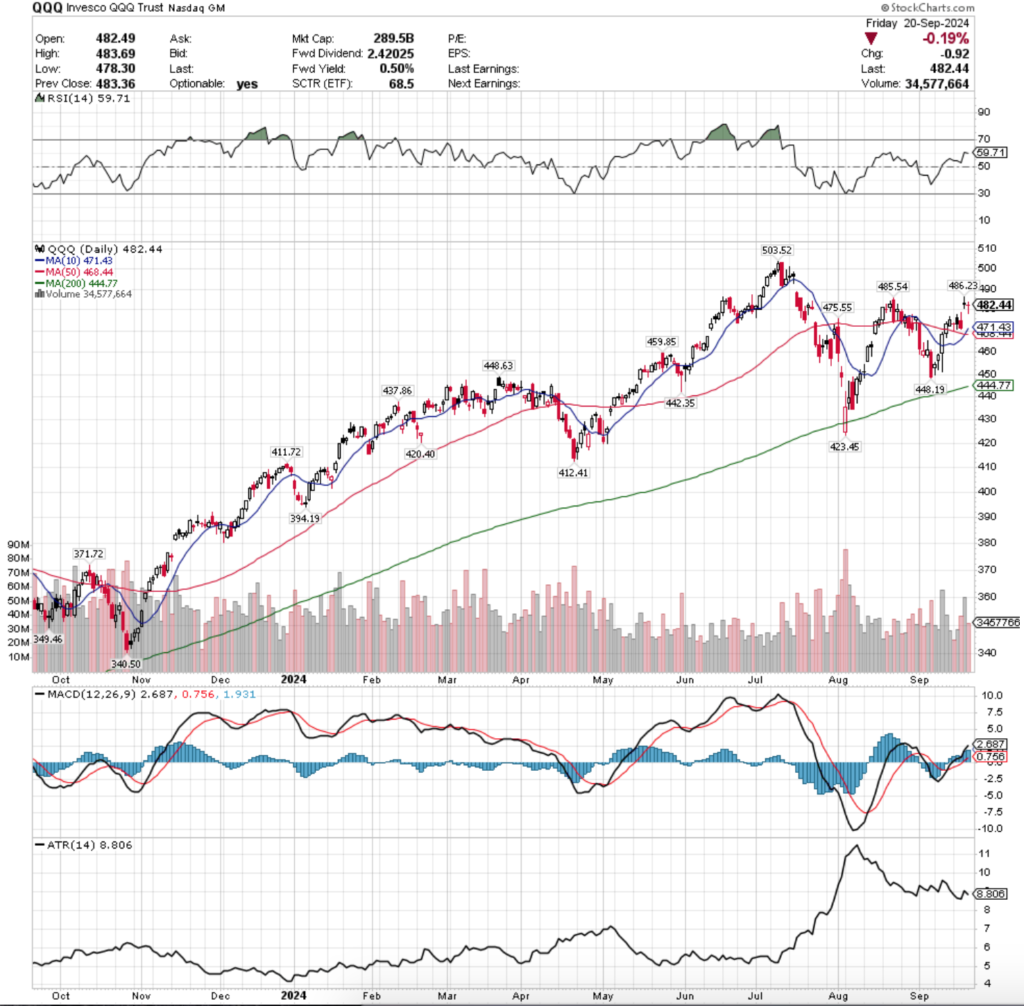
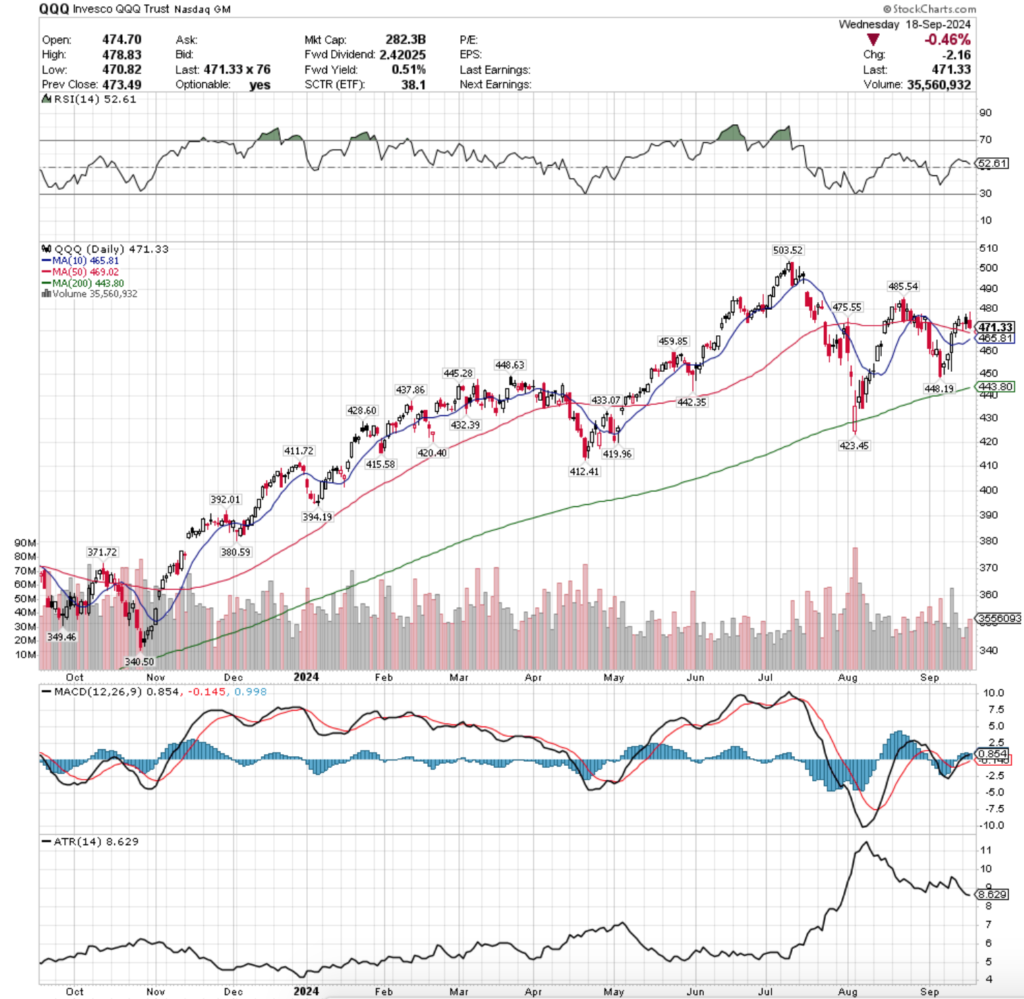
QQQ, the Invesco QQQ Trust ETF that tracks the NASDAQ 100 added +1.49% last week in a week that looked similar to SPY’s.
QQQ ETF – Invesco QQQ Trust ETF’s Technical Performance Over The Past Year
Their RSI is currently at 59.71 & is also curling over bearishly after Friday’s session, while their MACD is still bullish.
Volumes were very weak for QQQ, coming in -16.08% below the previous year’s average (35,988,000 vs. 42,884,111), which as has been noted in previous weeks’ posts is particularly low given that volumes as a whole have been lower than average compared to years prior since April 2024.
The support of the 50 day moving average held up for QQQ on Monday, as the session tested down towards it but was able to close as a dragonfly doji, indicating uncertainty among market participants, but the open & close were concentrated near the top of the day’s range on the lowest volume of the week.
Tuesday this theme continued, as the day opened on a gap up but ultimately closed lower than it opened on the second lowest volume of the week.
Tuesday’s lower shadow indicated that there was some downside appetite, but the bulls were able to push through & it did not go as low as Monday’s lower shadow.
Wednesday opened about midway through Tuesday’s candle’s real body & tested higher before ultimately nosediving to close near the bottom of Tuesday’s lower shadow, but still well above the support of the 50 DMA.
Much like SPY, QQQ enjoyed a gap up open on Thursday, except QQQ’s was on the week’s highest volume.
While the day’s high was able to break above the resistance level of $485.54, there is a lot of uncertainty & doubt in the air as the session ended as a spinning top candle that closed lower than it opened, indicating that there was some bearish sentiment brewing.
Friday this theme continued, as the day opened lower & wound up resulting in a doji candle, indicating uncertainty & risk-off sentiment heading into the weekend.
Something to keep an eye on this week is the 10 & 50 day moving averages which recently just had a bullish crossover, as last month when this happened it only lasted briefly & preceded a decline.
While that is not necessarily going to happen again, the uneasiness of market participants that QQQ’s candles are showing makes it a possibility that shouldn’t be ignored, particularly when you look at their RSI now vs. back in August at the time.
In the event that QQQ declines to begin filling in the window created by Thursday’s gap up session the next two price levels have been dominated by Sellers (1.05:1 & 1.08:1) which makes it likely that the next two support levels will not be able to hold up QQQ’s price, leading to a test of the support of the 50 day moving average.
Should that support level not hold up there isn’t another for another -1.83% at the $459.85, which also happens to be in a seller dominated price zone (1.63:1).
The upside price levels of $485.54 & $486.23 should be watched for in the event of an advance as they will be the nearest resistance levels for QQQ.
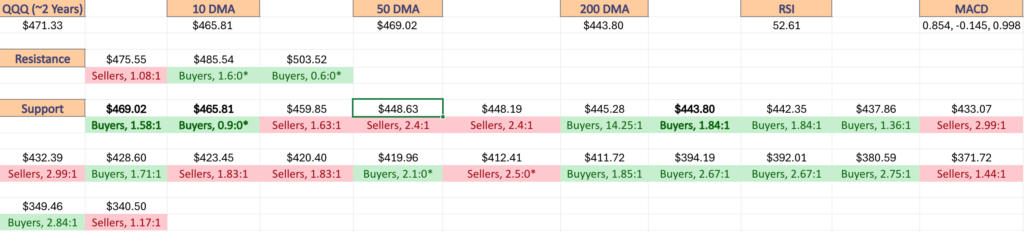
QQQ has support at the $475.55 (Volume Sentiment: Sellers, 1.08:1), $471.43 (10 Day Moving Average, Volume Sentiment: Buyers, 1.58:1), $468.44 (50 Day Moving Average, Volume Sentiment: Buyers, 1.58:1) & $459.85/share (Volume Sentiment: Sellers, 1.63:1) price levels, with resistance at the $485.54 (Volume Sentiment: Buyers, 1.6:0*), $486.23 (Volume Sentiment: Buyers, 1.6:0*) & $503.52/share (All-Time High, Volume Sentiment: Buyers, 0.6:0*) price levels.
QQQ ETF’s Price Level:Volume Sentiment Over The Past ~2 Years
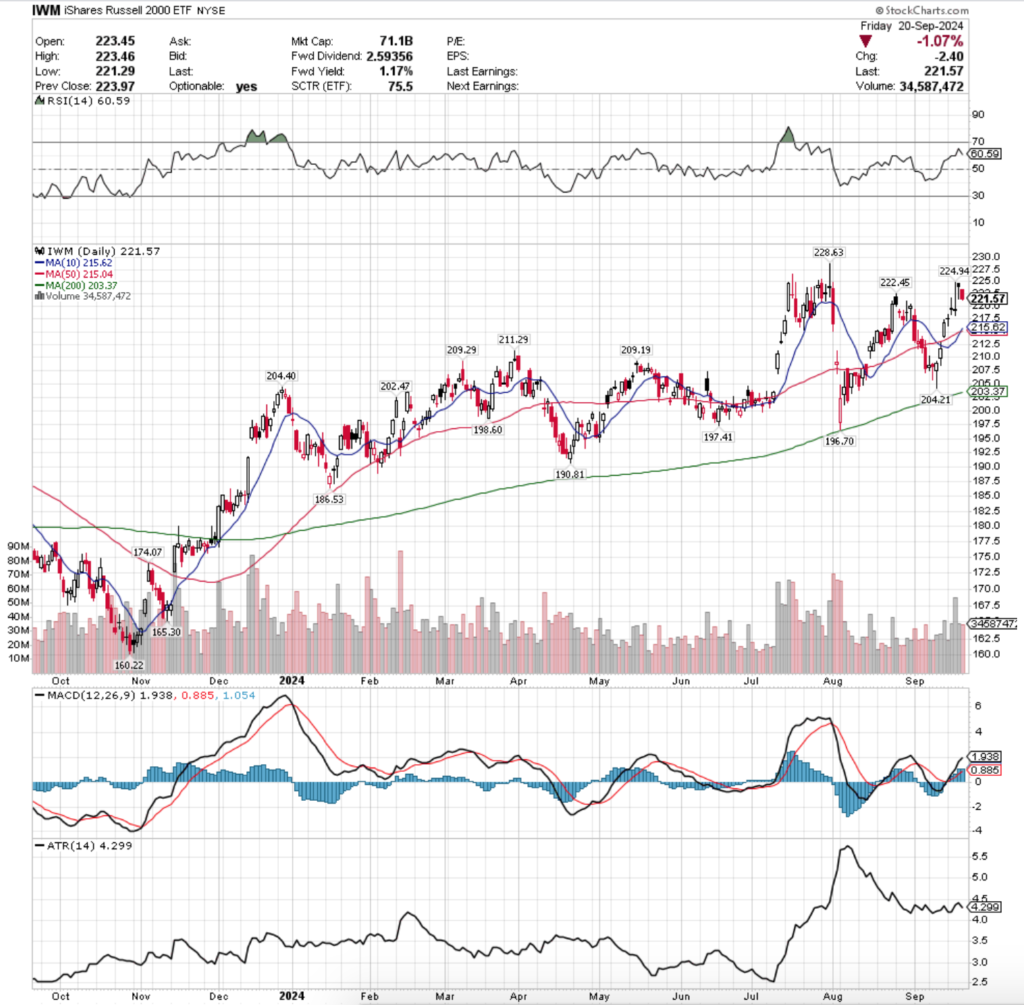
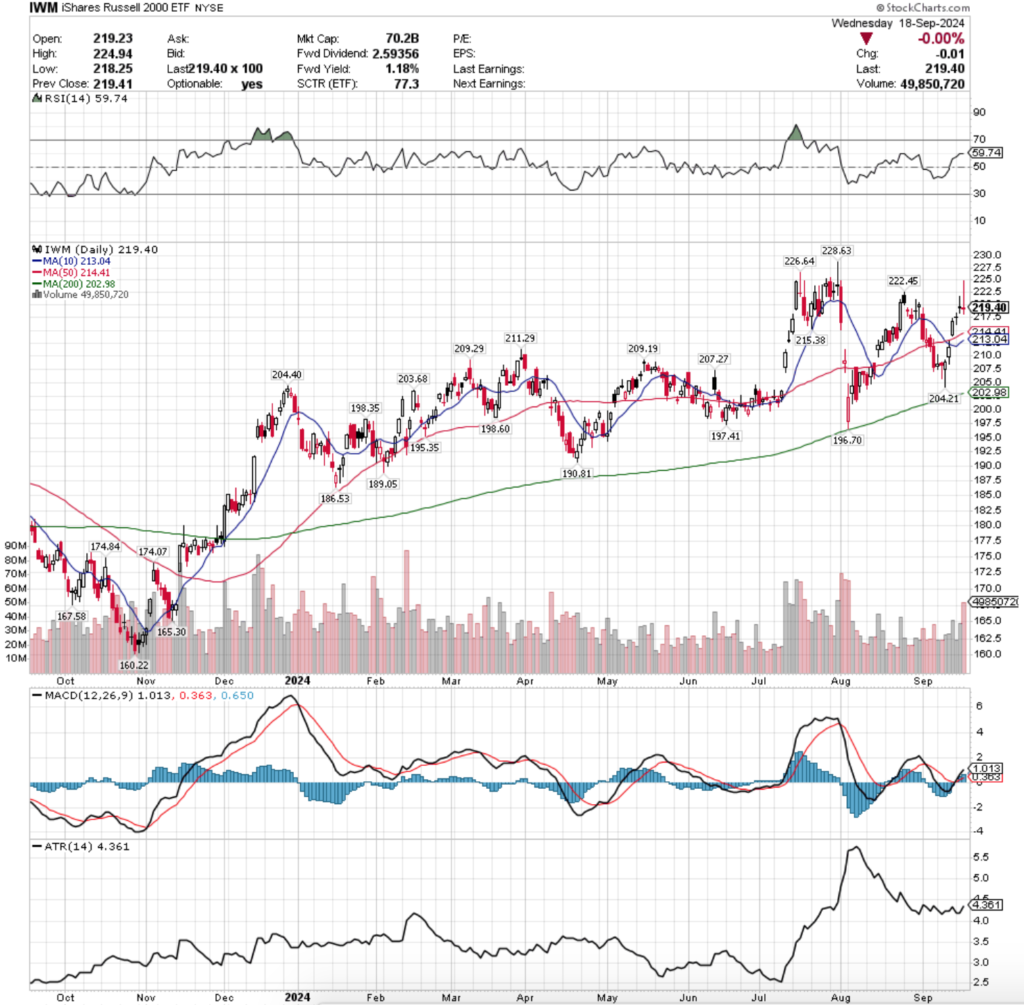
IWM ETF – iShares Russell 2000 ETF’s Technical Performance Over The Past Year
Their RSI is at 63.7 & has flattened out after Friday’s session, while their MACD is still bullish.
However, much like SPY, IWM’s Thursday session’s gap up contributed greatly to their MACD’s continued bullishness, but the session closed lower than it opened on that day, indicating bearishness & uncertainty/a lack of confidence given it resulted in a doji candle.
Volumes were +3.17% above the previous year’s average (36,580,000 vs. 35,454,783), bucking the continued below average volume trend of SPY, QQQ & DIA.
IWM’s week looks a lot different than that of SPY & QQQ, but still is riddled with uncertainty.
Monday kicked the week off with a gap up session that resulted in a doji candle on the week’s lowest volume, indicating that there was a great deal of uncertainty in the market.
Tuesday this theme continued, as IWM gapped up again, only to close as a doji, but this time closer to the lower end of the day’s range (but not as a gravestone doji).
Wednesday saw the highest volumes of the week, as well as the highest price level of the week, but the session closed as a doji near in line with Tuesday’s candle’s real body.
While IWM was able to test much higher based on the day’s upper shadow, the bulls were unable to hang on & or all bailed to take profits during the day forcing the close to be on the low end of the day’s candle.
Thursday managed to open higher near the high end of Wednesday’s upper shadow, but ultimately saw a lot of selling action that forced the day’s low end of the range to test almost halfway down the upper shadow of Wednesday’s candle before settling as a hanging man candle that closed lower than it opened.
Friday confirmed this bearish sentiment as the session opened on a gap down & continued lower throughout the day on volume that was average for the week, echoing the risk-off sentiment of SPY & QQQ & closing below the support level of $222.45.
Friday’s close sets IWM up to enter a Seller dominated price zone if they decline down to the $219.99 price level, where until $216 the Sellers have been the dominant force at a rate of 3.3:1.
This is important to note as the next support level is currently the 10 day moving average, which happens to be below $216 & sits just atop the 50 DMA’s support after recently crossing it bullishly.
Like noted above, watching the angle that those moving averages move at in the coming week(s) will lend clues to where price direction is headed, but the current sentiment remains cautious.
As has been noted in previous months’ posts, the consolidation ranges that IWM has spent much of December 2023 until July of 2024 in contain multiple support zones, but given that their 200 day moving average has advanced as high as it has to the midway point of this range it will be interesting to see what happens in the event of a decline.
Should we see a significant decline that breaks down through the 200 DMA it will undermine the strength of sentiment at the other local support levels, which could see the $190.81/share support level
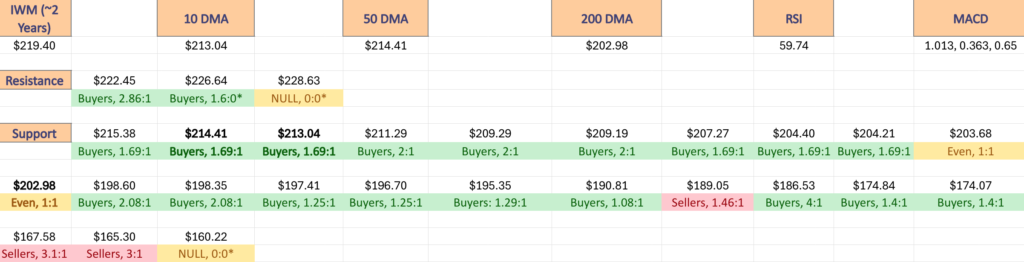
IWM has support at the $215.62 (10 Day Moving Average, Volume Sentiment: Buyers, 1.69:1), $215.04 (50 Day Moving Average, Volume Sentiment: Buyers, 1.69:1), $211.29 (Volume Sentiment: Buyers, 2:1) & $209.29/share (Volume Sentiment: Buyers 2:1) price levels, with resistance at the $222.45 (Volume Sentiment: Buyers, 2.86:1), $224.94 (Volume Sentiment: Buyers, 1.6:0*) & $228.63/share (52-Week High, Volume Sentiment: NULL, 0:0*) price levels.
IWM ETF’s Price Level:Volume Sentiment Over The Past ~2 Years
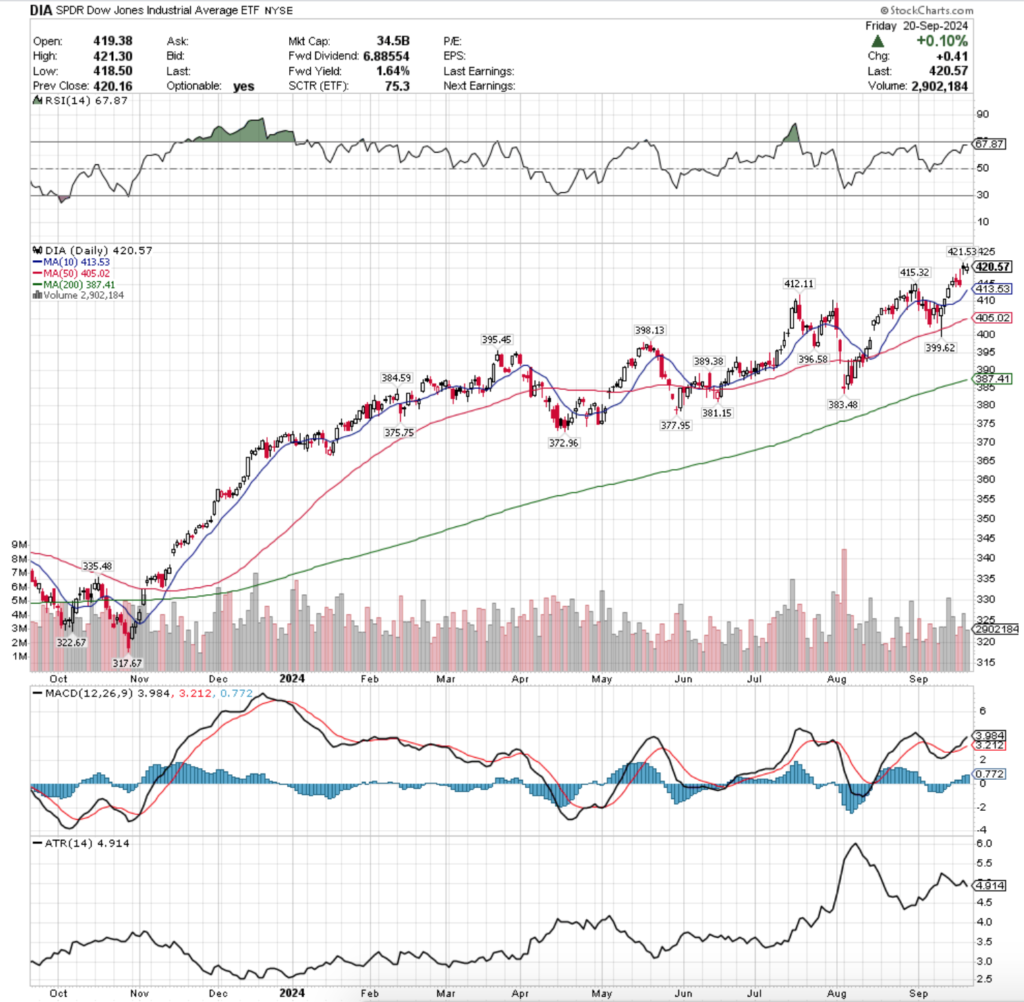
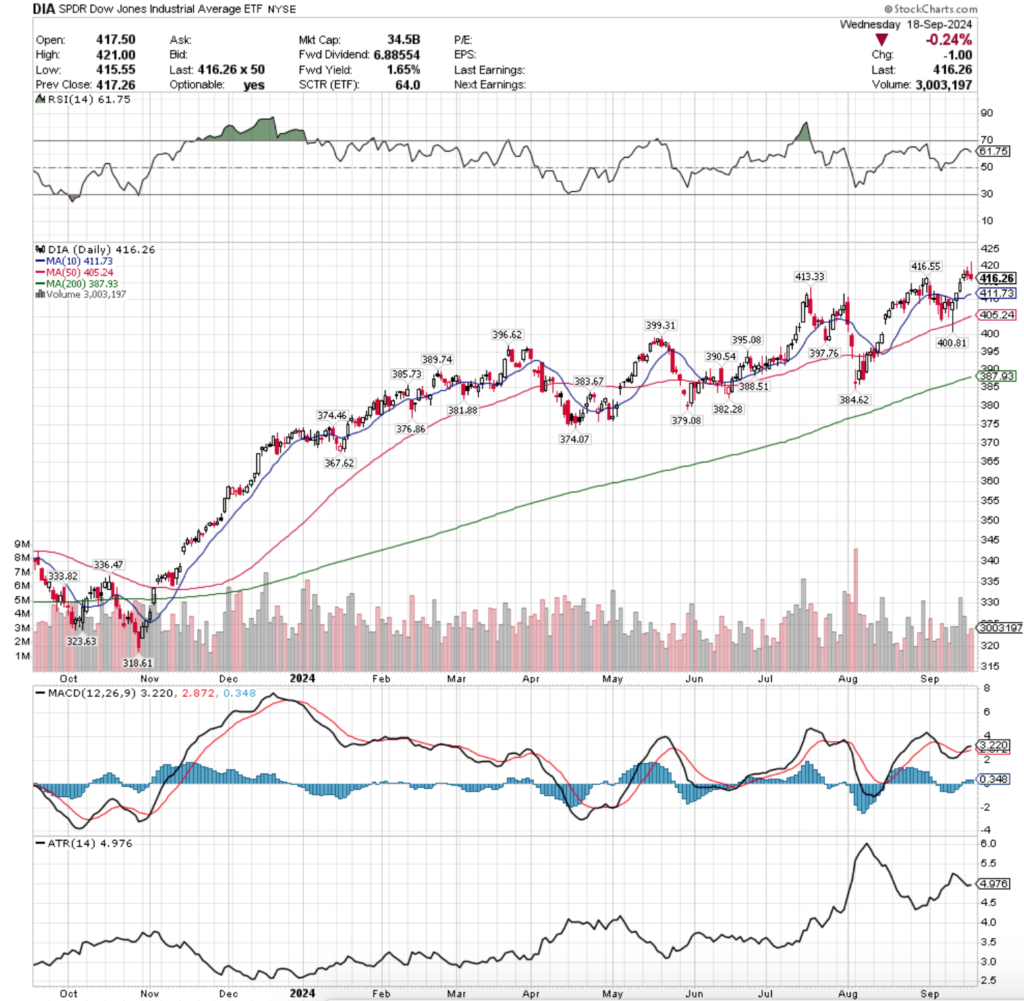
DIA ETF – SPDR Dow Jones Industrial Average ETF’s Technical Performance Over The Past Year
Their RSI is approaching overbought levels & has flattened out at 67.87, while their MACD continues on bullishly.
DIA’s MACD continuing higher can be attributed to Thursday’s gap up session, but like SPY & IWM they closed Thursday’s session lower than where it opened on a spinning top candle, indicating uncertainty with a touch of bearishness.
Volumes were -7.22% below the previous year’s average (3,316,000 vs. 3,574,071), which is not s sign of strength given that three of their five sessions last week resulted in advances.
Monday kicked DIA’s week off on an uncertain note, as the day resulted in a spinning top & set up the next two day’s consolidation range.
Tuesday the uncertainty continued, as a low volume declining session also resulted in a spinning top as investors awaited the FOMC announcement on Wednesday afternoon.
Wednesday set up the end of the week’s new all-time high as prices rallied during the day, but ultimately closed lower for the day as investors were eager to take profits off of the table.
Thursday opened to a gap up, but the uncertainty & uneasiness theme remained in play as the session closed lower than it opened & closed as a hanging man candle, which is a sign of bearishness.
Thursday saw the highest volumes of the week as well, which was likely due to profit taking by folks who benefitted from the gap up to the all-time high.
Friday the uncertainty continued, when an average volume session resulted in an advance of +0.1% & closed in a spinning top candle heading into the weekend.
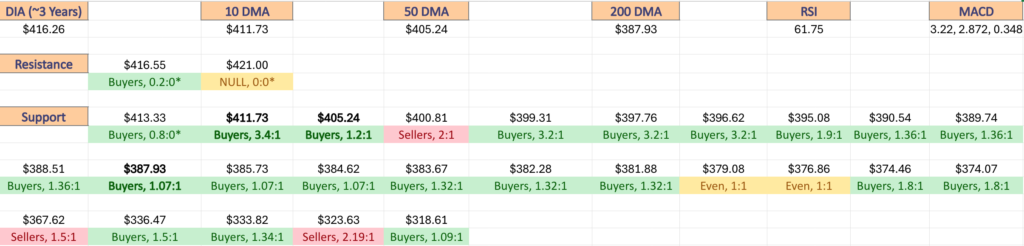
DIA has the most Buyer dominated support levels of the four major index ETFs primarily due to the slow ascent it has taken in the wake of the rapid climb it took in Q4 2023.
This has also benefitted it by creating more support levels along the way than the other index ETFs enjoy, which makes sense as investors have run to blue chip names in recent history.
With that said, there has not been much downside testing against the more recent price levels, as can be seen in the table below where the denominator (Sellers) is 0 for the first few price levels.
With this in mind, it would be wise to be cautious in the event of a decline for DIA, as there has been limited downside testing above $403.99/share.
While this does not mean that shares will necessarily tank between the current price & $400/share, it is entirely possible that market participants who got in above this level will leave in droves to protect their profits (~5% from $400).
It would also be wise to be cautious if in the coming days a new all-time high is hit but volumes are weak, as that would set up a prime time for a price reversal, especially with DIA’s RSI nearing the overbought level.
DIA has support at the $415.32 (Volume Sentiment: Buyers, 0.8:0*), $413.53 (10 Day Moving Average, Volume Sentiment: Buyers, 0.8:0*), $412.11 (Volume Sentiment: Buyers, 0.8:0*) & $412.11/share (Volume Sentiment: Buyers, 0.8:0*) price levels, with resistance at the $421.53/share (All-Time High, Volume Sentiment: NULL, 0:0*) price levels.
DIA ETF’s Price Level:Volume Sentiment Over The Past ~3 Years
The Week Ahead
Monday the week kicks off with Atlanta Fed President Bostic speaking at 8 am, S&P Flash U.S. Services PMI & S&P Flash U.S. Manufacturing PMI data at 9:45 am, Chicago Fed President Gooslbee speaking at 10:15 am& Minneapolis Fed President Kashkari speaking at 1pm.
AAR Corp reports earnings after Monday’s closing bell.
Fed Reserve Governor Bowman speaks at 9 am Tuesday, with the S&P Case-Schiller Home Price Index data coming out at 9 as well, followed by Consumer Confidence data at 10 am.
Tuesday morning’s earnings reports include AutoZone & Thor Industries, with KB Home, Progress Software, Stitch Fix & Worthington Enterprises scheduled to report after the session’s close.
Wednesday brings us New Home Sales data at 10 am & at 4pm Fed Governor Kugler speaks.
Cintas reports earnings Wednesday morning before the opening bell, followed by Micron Technology, Concentrix, H.B. Fuller, Jefferies & Worthington Steel after the session’s close.
Initial Jobless Claims, Durable-Goods Orders, Durable-Goods minus Transportation & GDP (second revision) data come out Thursday morning at 8:30 am, followed by Fed Governor Kugler & Boston Fed President Collins speaking together at 9:10 am, Fed Governor Bowman speaking at 9:15 am, Fed Chair Powell delivering opening remarks at 9:20 am & Fed President Williams speaking at 9:25 am.
In a busy morning Pending Home Sales data is released Thursday at 10 am, Fed Vice Chair for Supervision Barr speaks at 10:30 am, as does Fed Governor Cook & at 1pm Fed President Kashkari & Chair for Supervision Barr speak together at 1 pm.
Accenture, CarMax, Jabil & TD Synnex are all schedule to report earnings on Thursday morning before the session opens, with Costco Wholesale, BlackBerry & Vail Resorts due to report earnings after the closing bell.
Friday brings another busy day on the data front, with Personal Income, Personal Spending, PCE Index, PCE Year-over-year, Core PCE Index, Core PCE Year-over-Year, Advanced U.S. Trade Balance in Goods, Advanced Wholesale Inventories & Advanced Retail Inventories data due out at 8:30 am, followed by Consumer Sentiment (final) at 10 am & Fed Governor Bowman speaking at 1:15 pm.
There are no major earnings reports due out on Friday.
See you back here next week!
*** I DO NOT OWN SHARES OR OPTIONS CONTRACT POSITIONS IN SPY, QQQ, IWM OR DIA AT THE TIME OF PUBLISHING THIS ARTICLE ***
The VIX closed at 16.15, indicating an implied one day move of +/-1.02% & a one month implied move of +/-4.67% for the S&P 500.
Highest Technical Rated S&P 500 Components Per 9/20/2024’s Close:
1 – VST
2 – CEG
3 – FICO
4 – ORCL
5 – MMM
6 – KKR
7 – CARR
8 – AXON
9 – IRM
10 – K
Lowest Technical Rated S&P 500 Components Per 9/20/2024’s Close:
1 – WBA
2 – MRNA
3 – DLTR
4 – DG
5 – SMCI
6 – DXCM
7 – INTC
8 – EL
9 – BBWI
10 – BA
Highest Volume Rated S&P 500 Components Per 9/20/2024’s Close:
1 – BIO
2 – FDX
3 – ETSY
4 – HII
5 – IEX
6 – GD
7 – TYL
8 – CB
9 – AAPL
10 – VTRS
Lowest Volume Rated S&P 500 Components Per 9/20/2024’s Close:
1 – LUV
2 – FSLR
3 – UAL
4 – AMD
5 – CMG
6 – TSCO
7 – HAS
8 – SMCI
9 – POOL
10 – BBY
Highest Technical Rated ETFs Per 9/20/2024’s Close:
1 – UTSL
2 – NAIL
3 – JNUG
4 – UPW
5 – NUGT
6 – DRN
7 – FBL
8 – BABX
9 – GDMN
10 – DFEN
Lowest Technical Rated ETFs Per 9/20/2024’s Close:
1 – NVDQ
2 – NVD
3 – TSLZ
4 – TSDD
5 – UVIX
6 – MRNY
7 – CONL
8 – MSOX
9 – JDST
10 – SSG
Highest Volume Rated ETFs Per 9/20/2024’s Close:
1 – SMDY
2 – USCA
3 – JUNZ
4 – FOVL
5 – WRND
6 – ESGA
7 – AEMB
8 – OCTQ
9 – TAFL
10 – GFEB
Lowest Volume Rated ETFs Per 9/20/2024’s Close:
1 – NUSB
2 – XHYC
3 – XHYT
4 – SHUS
5 – IMAR
6 – GSEE
7 – XHYI
8 – FTHF
9 – FORH
10 – USIN
Highest Technical Rated General Stocks Per 9/20/2024’s Close:
1 – RAASY
2 – TIL
3 – LASE
4 – ADD
5 – NEON
6 – TSSI
7 – SMMT
8 – BASA
9 – RAIL
10 – COMM
Lowest Technical Rated General Stocks Per 9/20/2024’s Close:
1 – SIRI
2 – MULN
3 – UPC
4 – YELLQ
5 – WTO
6 – NDRA
7 – PEGY
8 – VMAR
9 – OMEX
10 – MLGO
Highest Volume Rated General Stocks Per 9/20/2024’s Close:
1 – OUT
2 – BNZI
3 – NBY
4 – GXAI
5 – FRES
6 – AENT
7 – ULY
8 – LFLY
9 – GDHG
10 – LGCB
Lowest Volume Rated General Stocks Per 9/20/2024’s Close:
1 – CTXXF
2 – AATC
3 – NAUFF
4 – VRDR
5 – TTNP
6 – SFES
7 – MTEK
8 – XRTX
9 – DTEGF
10 – QH
*** THE LIST ABOVE IS STRICTLY FOR INFORMATIONAL PURPOSES – I MAY OR MAY NOT HAVE OR INITIATE A LONG, SHORT, OR LONG/SHORT POSITION IN ANY NAME ABOVE AT ANY TIME ***
The VIX closed at 16.33, indicating an implied one day move of +/-1.03% & an implied one month move of +/-4.72% for the S&P 500.
Highest Technical Rated S&P 500 Components Per 9/19/2024’s Close:
1 – VST
2 – FICO
3 – ORCL
4 – CARR
5 – KKR
6 – MMM
7 – K
8 – AXON
9 – TRGP
10 – GE
Lowest Technical Rated S&P 500 Components Per 9/19/2024’s Close:
1 – WBA
2 – MRNA
3 – SMCI
4 – DLTR
5 – DG
6 – INTC
7 – DXCM
8 – EL
9 – BBWI
10 – BA
Highest Volume Rated S&P 500 Components Per 9/19/2024’s Close:
1 – FRT
2 – DRI
3 – FDX
4 – BRO
5 – EFX
6 – AJG
7 – FDS
8 – WTW
9 – AVY
10 – BKR
Lowest Volume Rated S&P 500 Components Per 9/19/2024’s Close:
1 – K
2 – APH
3 – CVS
4 – CI
5 – TJX
6 – SBUX
7 – LUV
8 – PARA
9 – CMG
10 – TT
Highest Technical Rated ETFs Per 9/19/2024’s Close:
1 – NAIL
2 – DPST
3 – UTSL
4 – DRN
5 – FBL
6 – BABX
7 – JNUG
8 – NUGT
9 – FAS
10 – DUSL
Lowest Technical Rated ETFs Per 9/19/2024’s Close:
1 – NVDQ
2 – NVD
3 – TSLZ
4 – TSDD
5 – UVIX
6 – MRNY
7 – CONL
8 – SSG
9 – NVDS
10 – TSLQ
Highest Volume Rated ETFs Per 9/19/2024’s Close:
1 – MCHS
2 – GUSA
3 – CVRD
4 – HYTR
5 – FTAG
6 – IVEG
7 – FTRB
8 – BKAG
9 – JUCY
10 – WEIX
Lowest Volume Rated ETFs Per 9/19/2024’s Close:
1 – QCAP
2 – XHYI
3 – BHYB
4 – XHYF
5 – SBND
6 – SHUS
7 – USIN
8 – MAGG
9 – ZTEN
10 – ISDB
Highest Technical Rated General Stocks Per 9/19/2024’s Close:
1 – BNZI
2 – GDHG
3 – MKFG
4 – RAASY
5 – TIL
6 – ADD
7 – ENCC
8 – LASE
9 – NEON
10 – TSSI
Lowest Technical Rated General Stocks Per 9/19/2024’s Close:
1 – TMNA
2 – LSDIF
3 – ASPU
4 – GPLDF
5 – ISUNQ
6 – DMKPQ
7 – EXPRQ
8 – SMFL
9 – ZEVY
10 – FUNFF
Highest Volume Rated General Stocks Per 9/19/2024’s Close:
1 – ZEO
2 – SGN
3 – TWO
4 – ACHL
5 – TBIO
6 – GSIW
7 – LFLY
8 – ACNT
9 – NCI
10 – NLY
Lowest Volume Rated General Stocks Per 9/19/2024’s Close:
1 – OGCP
2 – ELLO
3 – BDL
4 – VHIBF
5 – DSNY
6 – ARESF
7 – DTEGF
8 – SMREF
9 – TGLDF
10 – YYGH
*** THE LIST ABOVE IS STRICTLY FOR INFORMATIONAL PURPOSES – I MAY OR MAY NOT HAVE OR INITIATE A LONG, SHORT, OR LONG/SHORT POSITION IN ANY NAME ABOVE AT ANY TIME ***
What a week it’s been; a 50 bps cut from the FOMC, fresh all-time highs for the S&P 500 & Dow Jones Industrial Average & the usual gloomy month of September has been ok for stocks thus far, although the VIX sits at 16.8, indicating an implied one day move of +/-1.06% & an implied one month move of +/-4.86%.
Many of the same elements of political uncertainty in the U.S. & abroad remain or have escalated since our last index ETF price level:volume sentiment check in from July & as a result volatility looks to remain elevated in the coming months.
This makes it a prime time to check in on historic Buyer:Seller (or Seller:Buyer) sentiment at the price levels that each index ETF has traded at over the past few years in order to assess the strength of each’s support & resistance levels.
Due to the aforementioned new high price levels that each index ETF has been experiencing & the subdued volumes that we have seen since April many of the higher range price levels are still “NULL”, meaning that they are not 0, but there is not enough data currently to work with in terms of assigning buyer:seller (Seller:Buyer) strength ratios.
Additionally, you will notice as you go through the numbers that the higher prices tend to skew more towards the buyers, as there have been limited downside tests against these price levels, and the low volumes have not helped this.
Similarly, you will notice that there tend to be more sellers towards the lower ends of the price ranges.
Upon retests of a price level these numbers will become evened out more, but in the meantime the strength (weakness) of each level’s ratio can be used like a barometer to assess how strongly buyers & sellers have historically felt at each & how that may impact their decisions in the future.
Each section below contains a view of each index ETF’s chart (for a technical breakdown of each ETF’s chart please see this past weekend’s market review note), as well as a list of their current one year support & resistance levels with the volume sentiment noted beneath it on the table.
There is an additional table beneath this table with each price level’s sentiment, as well as a typed text version below that is able to be copied & pasted.
Note that “NULL, 0:0*” values denote areas that each name has traded at but with limited volume data to work with from a comparison standpoint in terms of creating a ratio of buyers:sellers (or vice versa).
Also, prices that do have a ratio of Buyers:Sellers (Sellers:Buyers) where the denominator is 0 are denoted with an asterisk “*” as well.
In the written lists of the price levels & volume sentiments the price levels that contain support & resistance levels are marked in BOLD.
Recall that at price extremes such as the highs that we have recently hit there will tend to be skewed data due to the small sample size & factor that into how you interpret each price level’s reported sentiment.
This is intended to serve as an additional tool to use during your due diligence process & is not meant to replace doing your own research & is not financial advice.
Price Level:Volume Sentiment Analysis For SPY (S&P 500) ETF
SPY ETF – SPDR S&P 500 ETF’s Technical Performance Over The Past Year
SPY, the SPDR S&P 500 ETF hit an fresh all-time high today despite closing -0.3% yesterday in the wake of the FOMC interest rate announcement.
While recent price movements have been more volatile over the past couple of months it has helped them establish more nearby support levels to their current price than what they had during July’s check-in.
Still though, with the low volumes that we are seeing there is not much reason to celebrate just yet & as a result it is worth having an understanding of the strength of their support levels.
This is especially true as in the event of a 10% correction for SPY their price enters a Seller dominated zone which may possibly lead to further downside movements as support levels are weak in these price zones.
Below is a list of the volume sentiments at each price level SPY has traded at over the past 2-3 years.
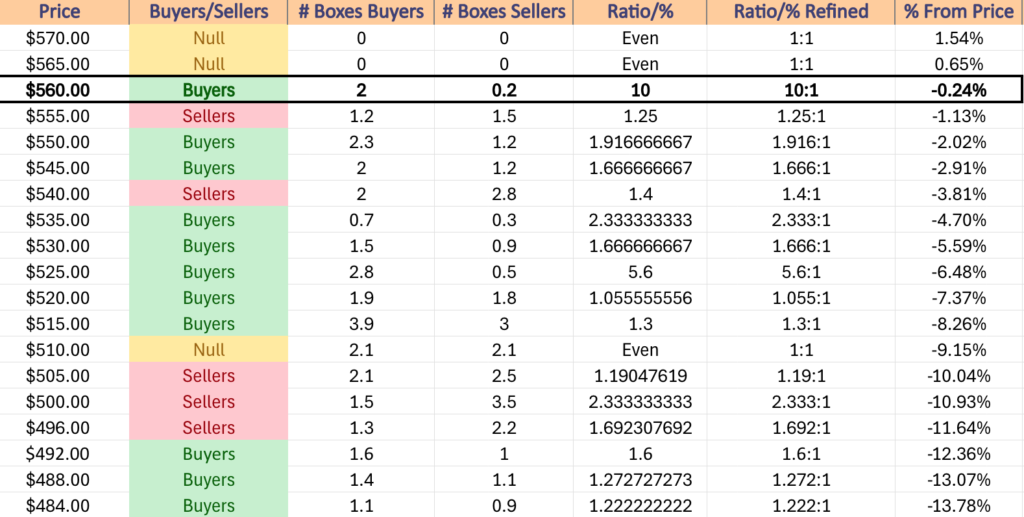
SPY ETF’s Price Level:Volume Sentiment Over The Past ~2 Years
SPY ETF’s Price Level:Volume Sentiment Over The Past ~2 Years
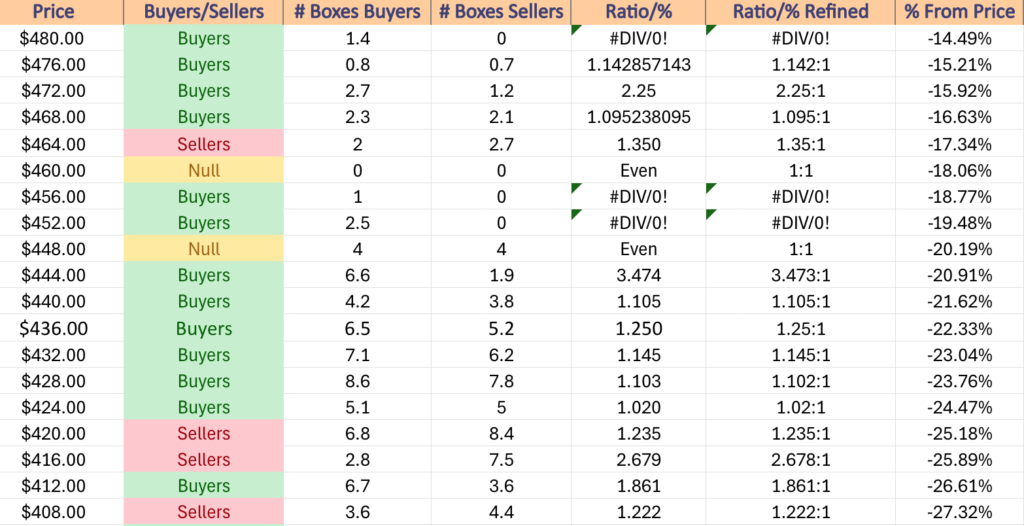
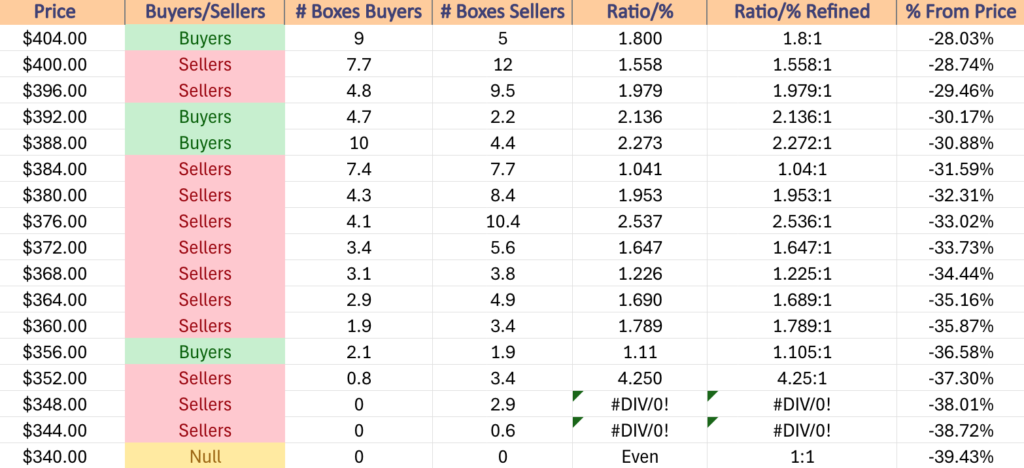
Price Level:Volume Sentiment For SPY ETF Over The Past ~2 Years
Price Level:Volume Sentiment For SPY ETF Over The Past ~2 Years
$570 – NULL – 0:0*, +1.54% From Current Price
$565 – NULL – 0:0*, +0.65% From Current Price
$560 – Buyers – 10:1, -0.24% From Current Price – Current Price Level*
$555 – Sellers – 1.25:1, -1.13% From Current Price
$550 – Buyers – 1.92:1, -2.02% From Current Price – 10 & 50 Day Moving Averages**
$545 – Buyers – 1.67:1, -2.91% From Current Price
$540 – Sellers – 1.4:1, -3.81% From Current Price
$535 – Buyers – 2.33:1, -4.7% From Current Price
$530 – Buyers – 1.67:1, -5.59% From Current Price
$525 – Buyers – 5.6:1, -6.48% From Current Price
$520 – Buyers – 1.06:1, -7.37% From Current Price
$515 – Buyers – 1.3:1, -8.26% From Current Price – 200 Day Moving Average*
$510 – Even – 1:1, -9.15% From Current Price
$505 – Sellers – 1.19:1, -10.04% From Current Price
$500 – Sellers – 2.33:1, -11.64% From Current Price
$496 – Sellers – 1.69:1, -12.36% From Current Price
$492 – Buyers – 1.6:1, -12.36% From Current Price
$488 – Buyers – 1.27:1, -13.07% From Current Price
$484 – Buyers – 1.22:1, -13.78% From Current Price
$480 – Buyers – 1.4:0*, -14.49% From Current Price
$476 – Buyers – 1.14:1, -15.21% From Current Price
$472 – Buyers – 2.25:1, -15.92% From Current Price
$468 – Buyers – 1.1:1, -16.63% From Current Price
$464 – Sellers – 1.35:1, -17.34% From Current Price
$460 – NULL – 0:0*, -18.06% From Current Price
$456 – Buyers – 1:0*, -18.77% From Current Price
$452 – Buyers – 2.5:0*, -19.48% From Current Price
$448 – Even – 1:1, -20.19% From Current Price
$444 – Buyers – 3.47:1, -20.91% From Current Price
$440 – Buyers – 1.11:1, -21.62% From Current Price
$436 – Buyers – 1.25:1, -22.33% From Current Price
$432 – Buyers – 1.15:1. -23.04% From Current Price
$428 – Buyers – 1.1:1, -23.76% From Current Price
$424 – Buyers – 1.02:1, -24.47% From Current Price
$420 – Sellers – 1.24:1, -25.18% From Current Price
$416 – Sellers – 2.68:1, -25.89% From Current Price
$412 – Buyers – 1.86:1, -26.61% From Current Price
$408 – Sellers – 1.22:1, -27.32% From Current Price
$404 – Buyers – 1.8:1, -28.03% From Current Price
$400 – Sellers – 1.56:1, -28.74% From Current Price
$396 – Sellers – 1.98:1, -29.46% From Current Price
$392 – Buyers – 2.14:1, -30.17% From Current Price
$388 – Buyers – 2.27:1, -30.88% From Current Price
$384 – Sellers – 1.04:1, -31.59% From Current Price
$380 – Sellers – 1.95:1, -32.31% From Current Price
$376 – Sellers – 2.54:1, -33.02% From Current Price
$372 – Sellers – 1.65:1, -33.73% From Current Price
$368 – Sellers – 1.23:1, -34.44% From Current Price
$364 – Sellers – 1.69:1, -35.16% From Current Price
$360 – Sellers – 1.79:1, -35.87% From Current Price
$356 – Buyers – 1.11:1, -36.58% From Current Price
$352 – Sellers – 4.25:1, -37.3% From Current Price
$348 – Sellers – 2.9:0*, -38.01% From Current Price
$344 – Sellers – 0.6:0*, -38.72% From Current Price
$340 – NULL – 0:0*, -39.43% From Current Price
Price Level:Volume Sentiment Analysis For QQQ (NASDAQ 100) ETF
QQQ ETF – Invesco QQQ Trust ETF’s Technical Performance Over The Past Year
QQQ, the Invesco QQQ Trust ETF that tracks the NASDAQ 100 has begun to show more weakness than SPY after months of trading in similar manners.
While lower interest rates are more beneficial to this tech-heavy index, the size of yesterday’s cut indicates that there may be more weakness in the QQQ index components that in the medium-term may become more apparent compared to their SPY counterparts.
QQQ’s current price level is a seller dominated zone, as is the one directly below it & it is faced with a similar set up in the event of a 10% decline as SPY was noted to have.
Another item to note on QQQ’s chart is the proximity of price to the three moving averages shown, as a sudden movement downward would cause the price to become wedged in between all three, with the 10 & 50 day moving averages providing resistance from above & moving downwards, while the support of the 200 DMA would be pushing upwards, which may cause increased volatility.
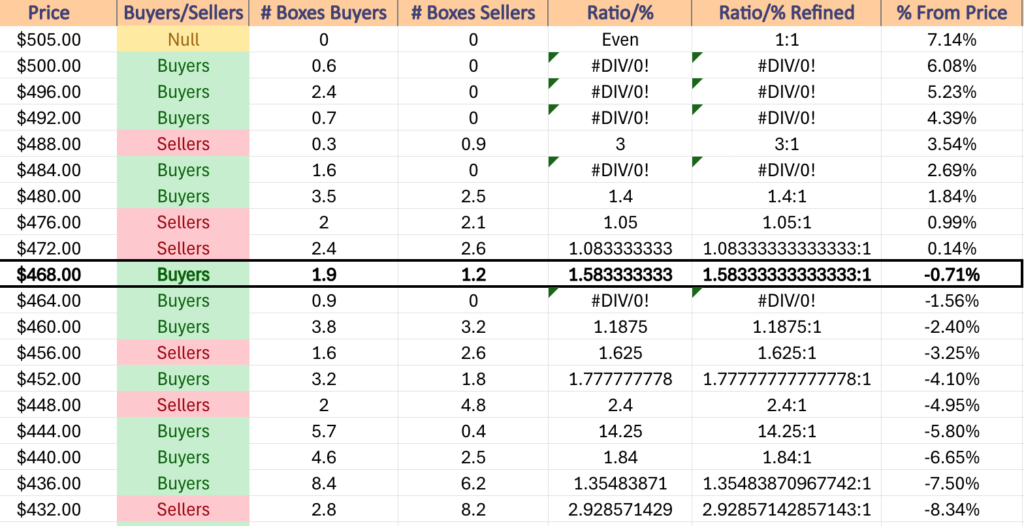
There will be more on that in this weekend’s market review note; below is QQQ’s volume sentiment at each price level it has traded at for the past 2-3 years, as well as their support & resistance levels with the sentiments noted.
QQQ ETF’s Price Level:Volume Sentiment Over The Past ~2 Years
QQQ ETF’s Price Level:Volume Sentiment Over The Past ~2 Years
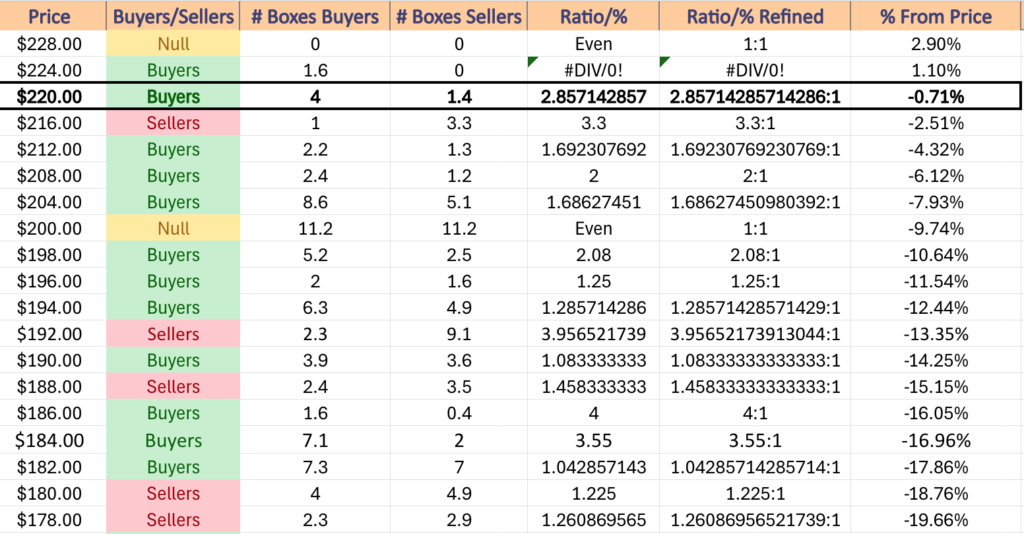
Price Level:Volume Sentiment For QQQ ETF Over The Past ~2 Years
Price Level:Volume Sentiment For QQQ ETF Over The Past ~2 Years
QQQ ETF’s Price Level:Volume Sentiment Over The Past ~2 Years
$505 – NULL – 0:0*, +7.14% From Current Price
$500 – Buyers – 0.6:0*, +6.08% From Current Price
$496 – Buyers – 2.4:0*, +5.23% From Current Price
$492 – Buyers – 0.7:0*, +4.39% From Current Price
$488 – Sellers – 3:1, +3.54% From Current Price
$484 – Buyers – 1.6:0*, +2.69% From Current Price
$480 – Buyers – 1.4:1, +1.84% From Current Price
$476 – Sellers – 1.05:1, +0.99% From Current Price
$472 – Sellers – 1.08:1, +0.14% From Current Price
$468 – Buyers – 1.58:1, -0.71% From Current Price – 50 Day Moving Average & Current Price Level**
$464 – Buyers – 0.9:0*, -1.56% From Current Price – 10 day Moving Average*
$460 – Buyers – 1.19:1, -2.4% From Current Price
$456 – Sellers – 1.63:1, -3.25% From Current Price
$452 – Buyers – 1.78:1, -4.1% From Current Price
$448 – Sellers – 2.4:1, -4.95% From Current Price
$444 – Buyers – 14.25:1, -5.8% From Current Price
$440 – Buyers – 1.84:1, -6.65% From Current Price – 200 Day Moving Average*
$436 – Buyers – 1.36:1, -7.5% From Current Price
$432 – Sellers – 2.93:1, -8.34% From Current Price
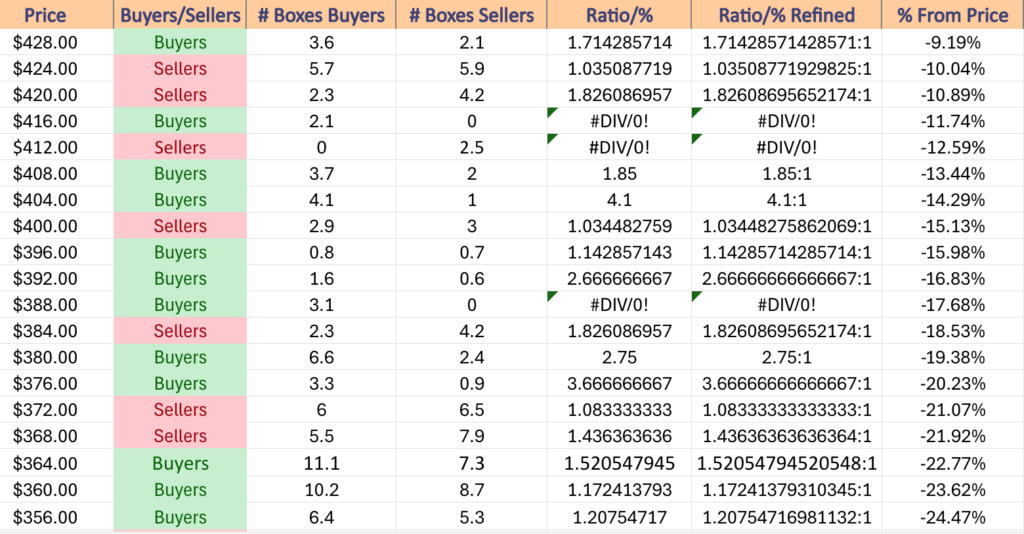
$428 – Buyers – 1.71:1, -9.19% From Current Price
$424 – Sellers – 1.04:1, -10.04% From Current Price
$420 – Sellers – 1.83:1, -10.89% From Current Price
$416 – Buyers – 2.1:0*, -11.74% From Current Price
$412 – Sellers – 2.5:0*, -12.59% From Current Price
$408 – Buyers – 1.85:1, -13.44% From Current Price
$404 – Buyers – 4.1:1, -14.29% From Current Price
$400 – Sellers – 1.03:1, -15.13% From Current Price
$396 – Buyers – 1.14:1, -15.98% From Current Price
$392 – Buyers – 2.67:1, -16.83% From Current Price
$388 – Buyers – 3.1:0*, -17.68% From Current Price
$384 – Sellers – 1.83:1, -18.53% From Current Price
$380 – Buyers – 2.75:1, -19.38% From Current Price
$376 – Buyers – 3.67:1, -20.23% From Current Price
$372 – Sellers – 1.08:1, -21.07% From Current Price
$368 – Sellers – 1.44:1, -21.92% From Current Price
$364 – Buyers – 1.52:1, -22.77% From Current Price
$360 – Buyers – 1.17:1, -23.62% From Current Price
$356 – Buyers – 1.21:1, -24.47% From Current Price
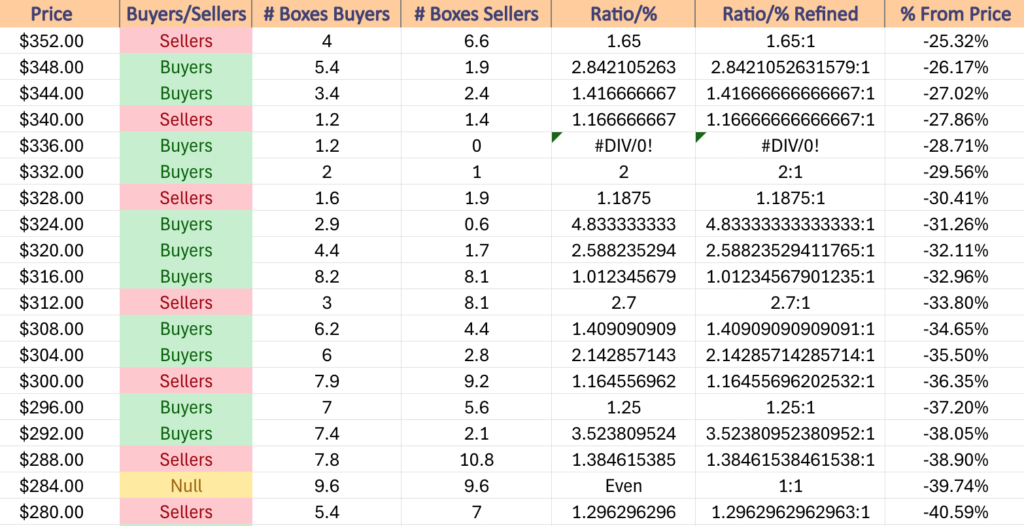
$352 – Sellers – 1.65:1, -25.32% From Current Price
$348 – Buyers – 2.84:1, -26.17% From Current Price
$344 – Buyers – 1.42:1, -27.02% From Current Price
$340 – Sellers – 1.17:1, -27.86% From Current Price
$336 – Buyers – 1.2:0*, -28.71% From Current Price
$332 – Buyers – 2:1, -29.56% From Current Price
$328 – Sellers – 1.19:1, -30.41% From Current Price
$324 – Buyers – 4.83:1, -31.26% From Current Price
$320 – Buyers – 2.59:1, -32.11% From Current Price
$316 – Buyers – 1.01:1, -32.96% From Current Price
$312 – Sellers – 2.7:1, -33.8% From Current Price
$308 – Buyers – 1.41:1, -34.65% From Current Price
$304 – Buyers – 2.14:1, -35.5% From Current Price
$300 – Sellers – 1.17:1, -36.35% From Current Price
$296 – Buyers – 1.25:1, -37.2% From Current Price
$292 – Buyers – 3.52:1, -38.05% From Current Price
$288 – Sellers – 1.39:1, -38.9% From Current Price
$284 – Even – 1:1, -39.74% From Current Price
$280 – Sellers – 1.3:1, -40.59% From Current Price
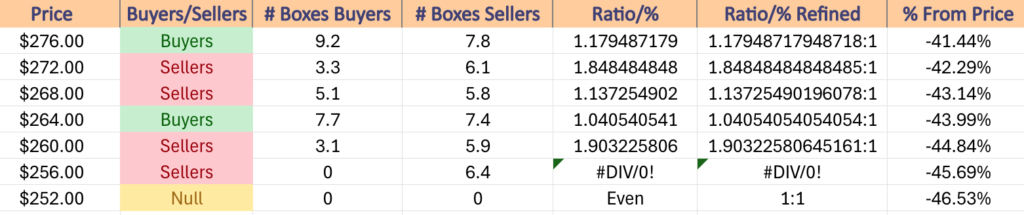
$276 – Buyers – 1.18:1, -41.44% From Current Price
$272 – Sellers – 1.85:1, -42.29% From Current Price
$268 – Sellers – 1.14:1, -42.14% From Current Price
$264 – Buyers – 1.04:1, -43.14% From Current Price
$260 – Sellers – 1.9:1, -44.84% From Current Price
$256 – Sellers – 6.4:0*, -45.69% From Current Price
$252 – NULL – 0:0*, -46.53% From Current Price
Price Level:Volume Sentiment Analysis For IWM (Russell 2000) ETF
IWM ETF – iShares Russell 2000 ETF’s Technical Performance Over The Past Year
IWM, the iShares Russell 2000 ETF has been unable to retest their 52-week high set just before our last check in in July, but their recent volume levels have jumped compared to the previous handful of months.
This index trades in a much more consolidated range-bound fashion & slowly advances while oscillating around a price range compared to how SPY & QQQ trade, so their list of price levels for the past 2-3 years is shorter than the previous two ETFs.
This is beneficial for them though, as it provides them with more local support levels, which are outlined in the data below.
IWM ETF’s Price Level:Volume Sentiment Over The Past ~2 Years
IWM ETF’s Price Level:Volume Sentiment Over The Past ~2 Years
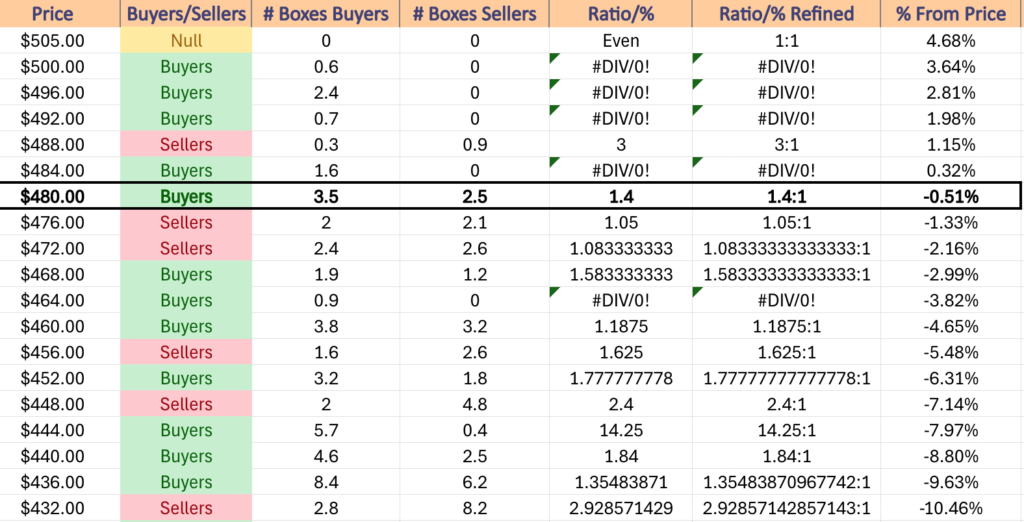
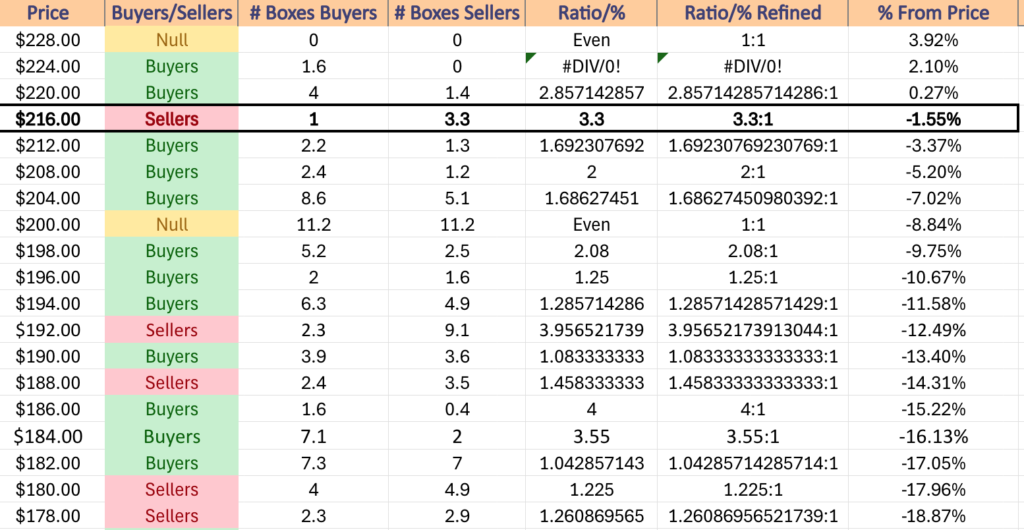
Price Level:Volume Sentiment For IWM ETF Over The Past ~2 Years
$228 – NULL – 0:0*, +3.92% From Current Price
$224 – Buyers – 1.6:0*, +2.1% From Current Price
$220 – Buyers – 2.86:1, +0.27% From Current Price
$216 – Sellers – 3.3:1, -1.55% From Current Price – Current Price Level*
$212 – Buyers – 1.69:1, -3.37% From Current Price – 10 & 50 Day Moving Averages**
$208 – Buyers – 2:1, -5.2% From Current Price
$204 – Buyers – 1.69:1, -7.02% From Current Price
$200 – Even – 1:1, -8.84% From Current Price – 200 Day Moving Average*
$198 – Buyers – 2.08:1, -9.75% From Current Price
$196 – Buyers – 1.25:1, -10.67% From Current Price
$194 – Buyers – 1.29:1, -11.58% From Current Price
$192 – Sellers – 3.96:1, -12.49% From Current Price
$190 – Buyers – 1.08:1, -13.4% From Current Price
$188 – Sellers – 1.46:1, -14.31% From Current Price
$186 – Buyer – 4:1, -15.22% From Current Price
$184 – Buyers – 3.55:1, -16.13% From Current Price
$182 – Buyers – 1.04:1, -17.05% From Current Price
$180 – Sellers – 1.23:1, -17.96% From Current Price
$178 – Sellers – 1.26:1, -18.87% From Current Price
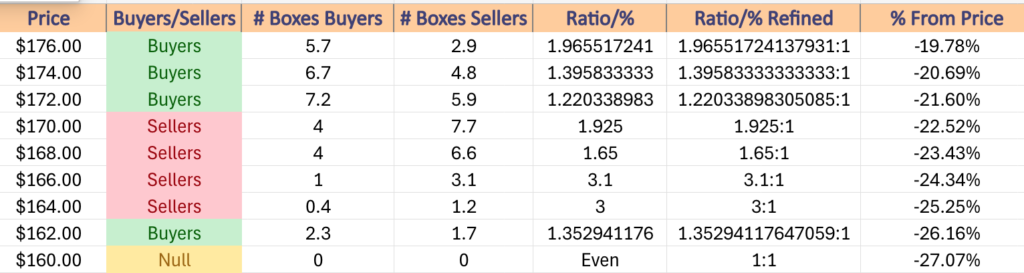
$176 – Buyers – 1.97:1, -19.78% From Current Price
$174 – Buyers – 1.4:1, -20.69% From Current Price
$172 – Buyers – 1.22:1, -21.6% From Current Price
$170 – Sellers – 1.93:1, -22.52% From Current Price
$168 – Sellers – 1.65:1, -23.43% From Current Price
$166 – Sellers – 3.1:1, -24.34% From Current Price
$164 – Sellers – 3:1, -25.25% From Current Price
$162 – Buyers – 1.36:1, -26.16% From Current Price
$160 – NULL – 0:0*, -27.07% From Current Price
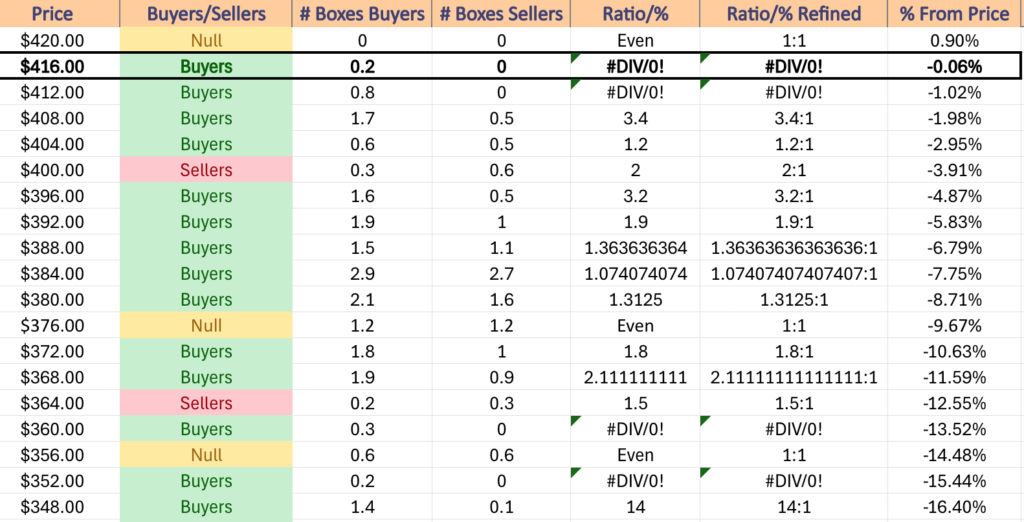
Price Level:Volume Sentiment Analysis For DIA (Dow Jones Industrial Average) ETF
DIA ETF – SPDR Dow Jones Industrial Average ETF’s Technical Performance Over The Past Year
As a result, they too have more local support levels than SPY or QQQ, as the blue chip index tends to be an investor favorite.
This leads them to have a great deal of Buyer support, which in the event of a decline we will see their ratios become more diluted than they are currently in the data below from the past 3-4 years.
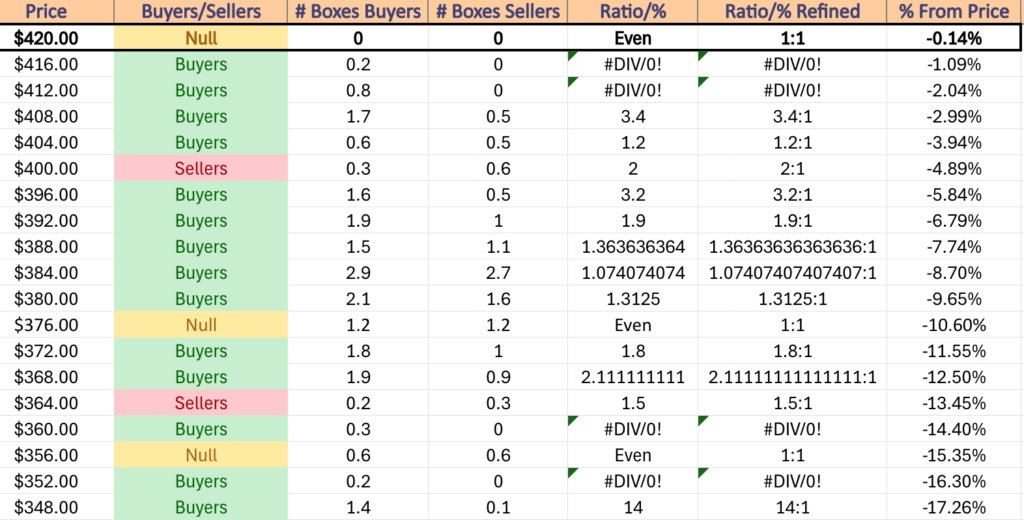
Price Level:Volume Sentiment For DIA ETF Over The Past ~3 Years
DIA ETF’s Price Level:Volume Sentiment Over The Past ~3 Years
DIA ETF’s Price Level:Volume Sentiment Over The Past ~3 Years
$420 – NULL – 0:0*, +0.9% From Current Price
$416 – Buyers – 0.2:0*, -0.06% From Current Price – Current Price Level*
$412 – Buyers – 0.8:0*, -1.02% From Current Price
$408 – Buyers – 3.4:1, -1.98% From Current Price – 10 Day Moving Average*
$404 – Buyers – 1.2:1, -2.95% From Current Price – 50 Day Moving Average*
$400 – Sellers – 2:1, -3.91% From Current Price
$396 – Buyers – 3.2:1, -4.87% From Current Price
$392 – Buyers – 1.9:1, -5.83% From Current Price
$388 – Buyers – 1.36:1, -6.79% From Current Price
$384 – Buyers – 1.07:1, -7.75% From Current Price – 200 Day Moving Average*
$380 – Buyers – 1.31:1, -8.71% From Current Price
$376 – Even – 1:1, -9.67% From Current Price
$372 – Buyers – 1.8:1, -10.63% From Current Price
$368 – Buyers – 2.11:1, -11.59% From Current Price
$364 – Sellers – 1.5:1, -12.55% From Current Price
$360 – Buyers – 0.3:0*, -13.52% From Current Price
$356 – Even – 1:1, -14.48% From Current Price
$352 – Buyers – 0.2:0*, -15.44% From Current Price
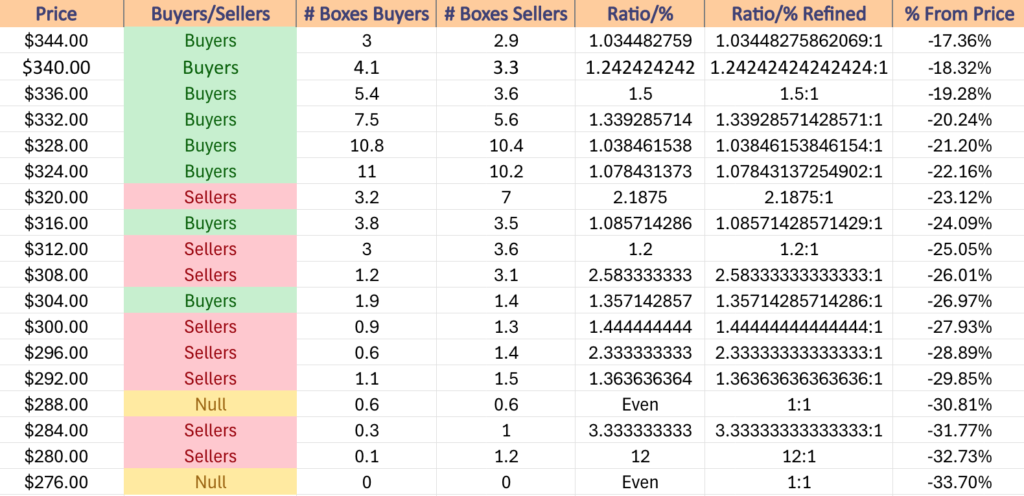
$348 – Buyers – 14:1, -16.4% From Current Price
$344 – Buyers – 1.03:1, -17.36% From Current Price
$340 – Buyers – 1.24:1, -18.32% From Current Price
$336 – Buyers – 1.5:1, -19.28% From Current Price
$332 – Buyers – 1.34:1, -20.24% From Current Price
$328 – Buyers – 1.04:1, -21.2% From Current Price
$324 – Buyers – 1.08:1, -22.16% From Current Price
$320 – Sellers – 2.19:1, -23.12% From Current Price
$316 – Buyers – 1.09:1, -24.09% From Current Price
$312 – Sellers – 1.2:1, -25.05% From Current Price
$308 – Sellers – 2.58:1, -26.01% From Current Price
$304 – Buyers – 1.36:1, -26.97% From Current Price
$300 – Sellers – 1.44:1, -27.93% From Current Price
$296 – Sellers – 2.33:1, -28.89% From Current Price
$292 – Sellers – 1.36:1, -29.85% From Current Price
$288 – Even – 1:1, -30.81% From Current Price
$284 – Sellers – 3.33:1, -31.77% From Current Price
$280 – Sellers – 12:1, -32.73% From Current Price
$276 – NULL – 0:0*, -33.7% From Current Price
*** I DO NOT OWN SHARES OR OPTIONS CONTRACT POSITIONS IN SPY, QQQ, IWM OR DIA AT THE TIME OF PUBLISHING THIS ARTICLE ***
The VIX closed at 18.23, indicating a one month implied move of +/-1.15% & a one month implied move of +/-5.27% for the S&P 500.
Highest Technical Rated S&P 500 Components Per 9/18/2024’s Close:
1 – VST
2 – FICO
3 – IRM
4 – ORCL
5 – K
6 – MMM
7 – TRGP
8 – CARR
9 – AXON
10 – GE
Lowest Technical Rated S&P 500 Components Per 9/18/2024’s Close:
1 – WBA
2 – SMCI
3 – MRNA
4 – INTC
5 – DXCM
6 – DG
7 – DLTR
8 – EL
9 – BBWI
10 – BA
Highest Volume Rated S&P 500 Components Per 9/18/2024’s Close:
1 – SYY
2 – GIS
3 – BRO
4 – AVY
5 – EA
6 – JNPR
7 – RMD
8 – CPT
9 – TMUS
10 – CSGP
Lowest Volume Rated S&P 500 Components Per 9/18/2024’s Close:
1 – SOLV
2 – TSCO
3 – LVS
4 – KEYS
5 – FTNT
6 – CVS
7 – AIZ
8 – MCD
9 – FAST
10 – GPN
Highest Technical Rated ETFs Per 9/18/2024’s Close:
1 – NAIL
2 – UTSL
3 – DRN
4 – UPW
5 – DPST
6 – URE
7 – NUGT
8 – FAS
9 – DFEN
10 – JNUG
Lowest Technical Rated ETFs Per 9/18/2024’s Close:
1 – NVDQ
2 – NVD
3 – CONL
4 – MRNY
5 – UVIX
6 – TSLZ
7 – TSDD
8 – MSOX
9 – CONY
10 – GXLM
Highest Volume Rated ETFs Per 9/18/2024’s Close:
1 – MAYZ
2 – PBMY
3 – QLC
4 – SHPP
5 – SCLZ
6 – QCON
7 – SIFI
8 – LFEQ
9 – USVN
10 – ECLN
Lowest Volume Rated ETFs Per 9/18/2024’s Close:
1 – AUGZ
2 – IMAY
3 – IQHI
4 – SHUS
5 – IMAR
6 – QLVD
7 – BBBL
8 – MSTQ
9 – PSTR
10 – XFIX
Highest Technical Rated General Stocks Per 9/18/2024’s Close:
1 – TIL
2 – ENCC
3 – NEON
4 – LASE
5 – ADD
6 – SMMT
7 – TSSI
8 – LUMN
9 – RSPI
10 – PRKR
Lowest Technical Rated General Stocks Per 9/18/2024’s Close:
1 – WTO
2 – PEGY
3 – UPC
4 – VMAR
5 – YELLQ
6 – NDRA
7 – MLGO
8 – HPH
9 – IDEX
10 – SLXN
Highest Volume Rated General Stocks Per 9/18/2024’s Close:
1 – VVOS
2 – SLG
3 – OMEX
4 – NVVE
5 – PRTG
6 – WBUY
7 – THRD
8 – SNES
9 – APLT
10 – WHLR
Lowest Volume Rated General Stocks Per 9/18/2024’s Close:
1 – CRECF
2 – LITOF
3 – OMQS
4 – CVWFF
5 – AUXXF
6 – IVFH
7 – MRRDF
8 – TGLDF
9 – SOAR
10 – ASST
*** THE LIST ABOVE IS STRICTLY FOR INFORMATIONAL PURPOSES – I MAY OR MAY NOT HAVE OR INITIATE A LONG, SHORT, OR LONG/SHORT POSITION IN ANY NAME ABOVE AT ANY TIME ***
The VIX closed at 17.61, indicating an implied one day move of +/-1.11% & an implied one month move of +/-5.09%.
Highest Technical Rated S&P 500 Components Per 9/17/2024’s Close:
1 – ORCL
2 – VST
3 – FICO
4 – IRM
5 – K
6 – MMM
7 – TRGP
8 – EBAY
9 – CARR
10 – AXON
Lowest Technical Rated S&P 500 Components Per 9/17/2024’s Close:
1 – DECK
2 – WBA
3 – SMCI
4 – DXCM
5 – DLTR
6 – DG
7 – MRNA
8 – INTC
9 – BBWI
10 – EL
Highest Volume Rated S&P 500 Components Per 9/17/2024’s Close:
1 – INTC
2 – FE
3 – JNPR
4 – WRB
5 – EW
6 – ACN
7 – EXR
8 – NCLH
9 – EA
10 – ADBE
Lowest Volume Rated S&P 500 Components Per 9/17/2024’s Close:
1 – KEYS
2 – ON
3 – SBUX
4 – PWR
5 – APH
6 – SMCI
7 – FTNT
8 – CRWD
9 – TRGP
10 – BAX
Highest Technical Rated ETFs Per 9/17/2024’s Close:
1 – UTSL
2 – NAIL
3 – DRN
4 – UPW
5 – JNUG
6 – NUGT
7 – URE
8 – FAS
9 – GDMN
10 – DPST
Lowest Technical Rated ETFs Per 9/17/2024’s Close:
1 – NVDQ
2 – NVD
3 – CONL
4 – MRNY
5 – TSLZ
6 – TSDD
7 – CONY
8 – UVIX
9 – JDST
10 – NVDS
Highest Volume Rated ETFs Per 9/17/2024’s Close:
1 – BHYB
2 – BBLB
3 – HTUS
4 – NUSB
5 – OCTJ
6 – IBIB
7 – IOPP
8 – GDMA
9 – JRE
10 – QQJG
Lowest Volume Rated ETFs Per 9/17/2024’s Close:
1 – XHYF
2 – IQHI
3 – EHLS
4 – SIO
5 – JULD
6 – MAYT
7 – SHUS
8 – SMRI
9 – IBIJ
10 – XHYI
Highest Technical Rated General Stocks Per 9/17/2024’s Close:
1 – TIL
2 – LBUY
3 – GLMD
4 – NEON
5 – IVDA
6 – ADD
7 – LASE
8 – SMMT
9 – TSSI
10 – RAIL
Lowest Technical Rated General Stocks Per 9/17/2024’s Close:
1 – WTO
2 – OMEX
3 – PEGY
4 – YELLQ
5 – EGIO
6 – UPC
7 – VMAR
8 – VLDX
9 – NDRA
10 – DECK
Highest Volume Rated General Stocks Per 9/17/2024’s Close:
1 – GLMD
2 – OUT
3 – DTSS
4 – SMSI
5 – TWO
6 – WHLR
7 – HCTI
8 – SES
9 – BFI
10 – OMEX
Lowest Volume Rated General Stocks Per 9/17/2024’s Close:
1 – RSPI
2 – MSCLF
3 – YBGJ
4 – TGLDF
5 – NAUFF
6 – MRAI
7 – LGCL
8 – XRTX
9 – ENBP
10 – CNFR
*** THE LIST ABOVE IS STRICTLY FOR INFORMATIONAL PURPOSES – I MAY OR MAY NOT HAVE OR INITIATE A LONG, SHORT, OR LONG/SHORT POSITION IN ANY NAME ABOVE AT ANY TIME ***
The VIX closed at 17.14, indicating an implied one day move of +/-1.08% & an implied one month move of +/-4.95%.
Highest Technical Rated S&P 500 Components Per 9/16/2024’s Close:
1 – ORCL
2 – IRM
3 – FICO
4 – MMM
5 – VST
6 – K
7 – AXON
8 – TRGP
9 – EBAY
10 – VTR
Lowest Technical Rated S&P 500 Components Per 9/16/2024’s Close:
1 – WBA
2 – MRNA
3 – DLTR
4 – SMCI
5 – INTC
6 – DG
7 – DXCM
8 – EL
9 – BBWI
10 – APA
Highest Volume Rated S&P 500 Components Per 9/16/2024’s Close:
1 – ORCL
2 – SLB
3 – HUM
4 – QRVO
5 – CMS
6 – CPT
7 – NCLH
8 – GEHC
9 – ADBE
10 – INTC
Lowest Volume Rated S&P 500 Components Per 9/16/2024’s Close:
1 – CNP
2 – NI
3 – EXPE
4 – ANSS
5 – KEY
6 – JKHY
7 – ANET
8 – LUV
9 – AON
10 – CI
Highest Technical Rated ETFs Per 9/16/2024’s Close:
1 – UTSL
2 – DRN
3 – NAIL
4 – JNUG
5 – UPW
6 – NUGT
7 – URE
8 – GDMN
9 – DFEN
10 – UGL
Lowest Technical Rated ETFs Per 9/16/2024’s Close:
1 – NVDQ
2 – NVD
3 – CONL
4 – MRNY
5 – UVIX
6 – TSLZ
7 – TSDD
8 – CONY
9 – JDST
10 – NVDS
Highest Volume Rated ETFs Per 9/16/2024’s Close:
1 – SMCO
2 – GSPY
3 – NPFI
4 – RDOG
5 – EVIM
6 – IDEC
7 – IPKW
8 – CEW
9 – NBGR
10 – PABU
Lowest Volume Rated ETFs Per 9/16/2024’s Close:
1 – AUGZ
2 – BHYB
3 – IMAY
4 – FORH
5 – MEMS
6 – VNSE
7 – MDPL
8 – XFIX
9 – PSTR
10 – PSMJ
Highest Technical Rated General Stocks Per 9/16/2024’s Close:
1 – KSCP
2 – ISPC
3 – RAASY
4 – ONPH
5 – TIL
6 – ZEPP
7 – SMMT
8 – ADD
9 – NEON
10 – TSSI
Lowest Technical Rated General Stocks Per 9/16/2024’s Close:
1 – YELLQ
2 – NDRA
3 – MULN
4 – VMAR
5 – UPC
6 – EGIO
7 – HPH
8 – MLGO
9 – LTM
10 – SLXN
Highest Volume Rated General Stocks Per 9/16/2024’s Close:
1 – BBLG
2 – NCNA
3 – REE
4 – WHLR
5 – SLG
6 – MAMA
7 – AVGR
8 – DRMA
9 – MCVT
10 – ZNTL
Lowest Volume Rated General Stocks Per 9/16/2024’s Close:
1 – HPQFF
2 – PYFRF
3 – OLNCF
4 – BNET
5 – XRTX
6 – CBDBY
7 – VYBE
8 – LMRXF
9 – INTJ
10 – OKYO
*** THE LIST ABOVE IS STRICTLY FOR INFORMATIONAL PURPOSES – I MAY OR MAY NOT HAVE OR INITIATE A LONG, SHORT, OR LONG/SHORT POSITION IN ANY NAME ABOVE AT ANY TIME ***