The VIX closed at 17.61, indicating an implied one day move of +/-1.11% & an implied one month move of +/-5.09% for the S&P 500.
Highest Technical Rated S&P 500 Components Per 6/4/2025’s Close:
1 – PLTR
2 – NRG
3 – GEV
4 – STX
5 – AXON
6 – AVGO
7 – HWM
8 – VST
9 – DG
10 – MOS
Lowest Technical Rated S&P 500 Components Per 6/4/2025’s Close:
1 – UNH
2 – REGN
3 – ENPH
4 – COO
5 – DECK
6 – MRNA
7 – DOW
8 – ARE
9 – LYB
10 – BDX
Highest Volume Rated S&P 500 Components Per 6/4/2025’s Close:
1 – CRWD
2 – DLTR
3 – ON
4 – HPE
5 – PCG
6 – WFC
7 – FDS
8 – VRTS
9 – OKE
10 – TDY
Lowest Volume Rated S&P 500 Components Per 6/4/2025’s Close:
1 – GEHC
2 – ALGN
3 – NOW
4 – HON
5 – PH
6 – LW
7 – URI
8 – MKC
9 – WBA
10 – FRT
Highest Technical Rated ETFs Per 6/4/2025’s Close:
1 – JNUG
2 – NUGT
3 – DFEN
4 – HOOX
5 – ROBN
6 – HOOG
7 – AUMI
8 – URAA
9 – GOEX
10 – GDMN
Lowest Technical Rated ETFs Per 6/4/2025’s Close:
1 – ETHD
2 – MSOX
3 – TSLZ
4 – HZEN
5 – TSLQ
6 – TSDD
7 – SOXS
8 – JDST
9 – NVDQ
10 – NVD
Highest Volume Rated ETFs Per 6/4/2025’s Close:
1 – LSVD
2 – GSIG
3 – LFAO
4 – SEMI
5 – BWZ
6 – NANR
7 – RODE
8 – NSCR
9 – HJUL
10 – DVQQ
Lowest Volume Rated ETFs Per 6/4/2025’s Close:
1 – IGPT
2 – NDEC
3 – UNIY
4 – SMAX
5 – HYDW
6 – GVUS
7 – DECZ
8 – TRSY
9 – JHEM
10 – XBB
Highest Technical Rated General Stocks Per 6/4/2025’s Close:
1 – RGC
2 – SBET
3 – NAKA
4 – NCL
5 – ASST
6 – BSGM
7 – TMPOQ
8 – DFDV
9 – ROMA
10 – SVT
Lowest Technical Rated General Stocks Per 6/4/2025’s Close:
1 – GDHG
2 – DGLY
3 – FMTO
4 – ZCAR
5 – APDN
6 – JYD
7 – APVO
8 – MLGO
9 – HOLO
10 – ELPW
Highest Volume Rated General Stocks Per 6/4/2025’s Close:
1 – EHGO
2 – CLRB
3 – TOPS
4 – STSS
5 – NA
6 – MULN
7 – HOTH
8 – LOOP
9 – NKGFF
10 – BAOS
Lowest Volume Rated General Stocks Per 6/4/2025’s Close:
1 – CRVW
2 – MTWO
3 – NYMXF
4 – KRKR
5 – AHOTF
6 – PSYTF
7 – DTEGF
8 – ZKIN
9 – MRM
10 – ARBV
*** THE LIST ABOVE IS STRICTLY FOR INFORMATIONAL PURPOSES – I MAY OR MAY NOT HAVE OR INITIATE A LONG, SHORT, OR LONG/SHORT POSITION IN ANY NAME ABOVE AT ANY TIME ***
Some of their top holdings include Costco Wholesale Corp. (COST), Walmart Inc. (WMT), Proctor & Gamble Co. (PG), Phillip Morris International (PM), Coca Cola Co. (KO), Altria Group (MO), Mondelez International Inc. (MDLZ), Colgate Palmolive (CL), Pepsico Inc. (PEP) & Kimberly Clark Corp. (KMB).
While XLP is so close to it’s 52-week high it is a good time to check in on its historic volume sentiment from the past ~9 years to gain insight into how it may trade in any upcoming upside or downside re-tests, particularly around pivotal support/resistance levels.
Below is a brief technical analysis of XLP, as well as a price level:volume sentiment analysis of each of the price levels XLP has traded at over the past ~9 years.
Included in this data is also their recent support & resistance levels so that readers can gain insight into how strong/weak these support/resistance levels may be in the future, based on past market participant behavior.
It is not intended to serve as financial advice, but rather as an additional tool to reference while performing your own due diligence on XLP.
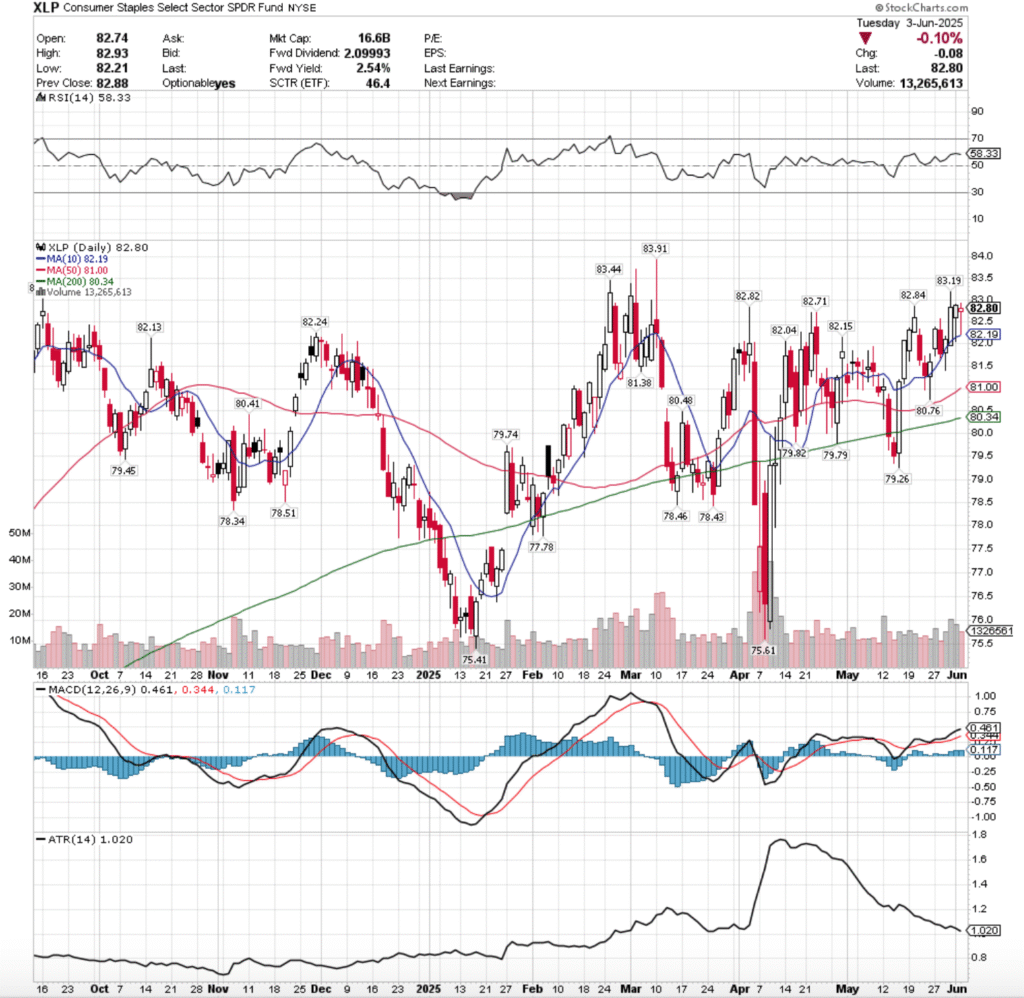
Technical Analysis Of XLP, The Consumer Staples Select Sector SPDR Fund ETF
XLP ETF – SPDR Consumer Staples Select Sector SPDR Fund ETF’s Technical Performance Over The Past Year
Their RSI is beginning to trend downward & currently sits at 58.33, while their MACD is bullish, but its histogram is flat, indicating that there is not a great deal of enthusiasm following their past week and a half.
Volumes have been +23.91% higher than the prior year’s average over the past week & a half (14,098,333.33 vs. 11,377,920), which is important to note asmost of it came on the past three sessions & went advance, advance, decline.
Last week began on a gap up session after the long holiday weekend, where Tuesday advanced +0.91%.
Wednesday opened lower, tested higher to break above the $82.50/share level temporarily, before declining down to the support of the 10 day moving average & closing the day for a loss just above the short-term trend line.
Wednesday had the weakest volume of all of the past week & a half, indicating that there is still “buy & hold” sentiment in the air for the Consumer Staples names, but that there is caution as well as the session hugged the 10 day moving average in the end.
Thursday opened slightly higher, showed that there was extreme downside appetite when the $81.50/share mark was temporarily broken through as short-term profits continued to be taken from Tuesday’s gap up, but Buyers came to the rescue & forced the close higher, forming a weak looking bullish harami pattern.
Friday saw the a major influx of both price & volume for XLP, as the session opened below the 10 DMA’s resistance, broke out above it on the highest volume since mid-May & touched a high price of $83.19/share, before closing up +0.88% for the day.
While the high volume was a sign in the right direction, the tall upper shadow on the day’s candle indicates that there was a solid deal of intraday profit taking taking place & that more could be on the horizon.
Opening this week, Monday featured a lower open, a decline that retested & temporarily broke through the support of the 10 day moving average, before a rally to close +0.06% higher day-over-day.
While the volume was similar to Friday’s (but slightly lower), the day’s lower shadow indicates that there is a severe amount of discomfort & hesitency among market participants at these high price levels.
Tuesday is when the real weakness began to be exposed though, as XLP opened lower, retraced down to re-test the support of the 10 day moving average, which held up before XLP rallied to close above its open, but there was a lot of profit taking & hints of fear beginning to emerge.
The amount of volume from the session also shows that there was strong sentiment to get out of the pool/take profits, which is a theme that is likely to continue in the near-term, particularly after today’s employment data & the upcoming FOMC Minutes.
XLP’s upside case isn’t much to write about, as they’re ~2% off of their all-time high, which would be the target price to be watching for in the near-term in terms of advances, before watching to see if there is an upside breakout.
In the event that there is, you’ll want to see high volume levels that are sustained for a bit of time before buying into anything long-term at these levels.
The consolidation case has been made recently by daily lows & lower shadows, as they all seem to revert back to the 10 day moving average (short-term trendline), which would mean that any consolidation would likely oscillate around the 10 DMA until we see an upside or downside catalyst.
To the downside, there is a healthy amount of support touchpoints into the $82-82.99/share zone, however, should they break down, the $81-81.99/share price zone is Seller dominated historically over near the past decade, which will likely mean that we will see some selling pressure should prices dip to those levels.
The $80-80.99/share price level is also Seller dominated, with the $79-79.99/share zone being a Buyer zone historically, before more Seller zones emerge.
Should the 200 day moving average break down, more than likely the $79/share level breaks down, exposing XLP to a great deal of Seller pressure.
While the names covered in this ETF are Consumer Staples, it does not make the downside scenario above impossible.
The section below outlines the volume sentiment at each price level XLP has traded at over the past ~9 years & can be used to assess the strength/weakness of the support/resistance levels & price levels that XLP retests in the coming weeks.
This can aid in understanding how market participants may behave again at each level.
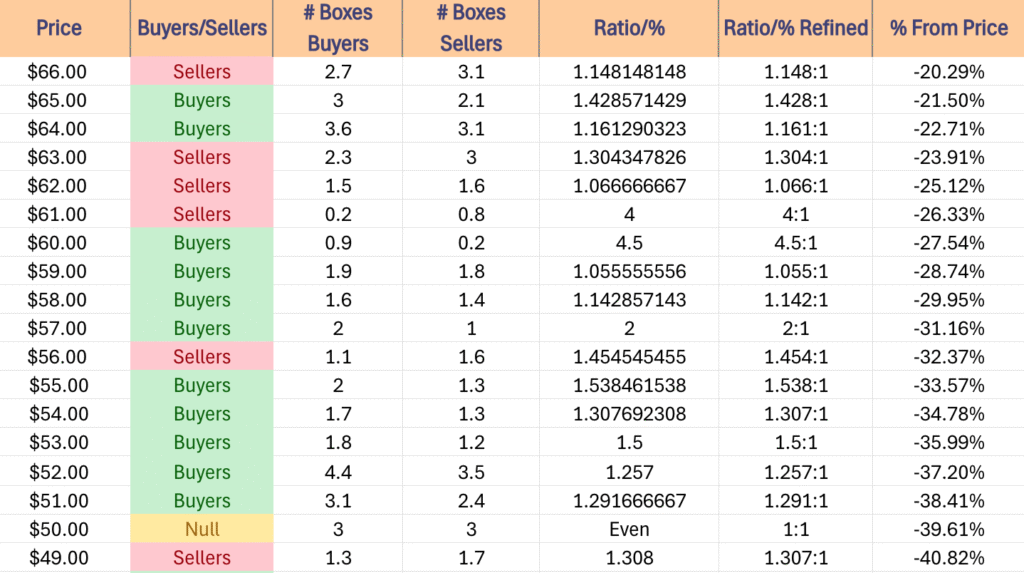
Price Level:Volume Sentiment Analysis For XLP, The Consumer Staples Select Sector SPDR Fund ETF
The top table below shows the support & resistance levels of XLP from the past year’s chart, as well as their price level:volume sentiment at each from data covering the past ~9 years, using Tuesday 5/3/2025’s closing data for their price & moving averages/other technicals.
The 10, 50 & 200 day moving averages are denoted with bold.
The next tables show the volume sentiment at each individual price level XLP has traded at over the past ~9 years.
Beneath them is a copy & pasteable list of the same data, where the support/resistance levels are denoted in bold.
All ratios with “0” in the denominator are denoted with a “*”.
NULL values are price levels that had limited trading volume, whether it be due to gaps, quick advances or they are at price extremes; in the event that they are retested & there is more data they would have a distinct “Buyers”, “Sellers” or “Even” title.
This is not intended as financial advice, but rather another tool to consider when performing your own research & due diligence on XLP.
The following section lays out XLP’s one year support/resistance levels, as well as their Buyer:Seller (Seller:Buyer) ratios at each price level that they’ve traded at over the past ~9 years, which can be used as a barometer for estimating the expected strength/weakness of each of the support/resistance levels.
XLP ETF’s Price Level:Volume Sentiment Over The Past ~9 Years At Their One Year Support/Resistance Levels
XLP ETF’s Price Level:Volume Sentiment Over The Past ~9 Years
Price Level:Volume Sentiment For XLP ETF Over The Past ~9 Years
Price Level:Volume Sentiment For XLP ETF Over The Past ~9 Years
$84 – NULL – 0:0*, +1.45% From Current Price Level
$83 – Buyers – 0.3:0*, +0.24% From Current Price Level
$82 – Buyers – 2.5:1, -0.97% From Current Price Level – Current Price & 10 Day Moving Average**
$81 – Sellers – 1.3:1, -2.17% From Current Price Level – 50 Day Moving Average*
$80 – Sellers – 1.25:1, -3.38% From Current Price Level – 200 Day Moving Average*
$79 – Buyers – 2.38:1, -4.59% From Current Price Level
$78 – Sellers – 2.33:1, -5.8% From Current Price Level
$77 – Buyers – 1.67:1, -7% From Current Price Level
$76 – Sellers – 1.18:1, -8.21% From Current Price Level
$75 – Sellers – 1.33:1, -9.42% From Current Price Level
$74 – Buyers – 1.5:1, -10.63% From Current Price Level
$73 – Buyers – 1.43:1, -11.84% From Current Price Level
$72 – Buyers – 1.25:1, -13.04% From Current Price Level
$71 – Buyers – 1.32:1, -14.25% From Current Price Level
$70 – Sellers – 1.14:1, -15.46% From Current Price Level
$69 – Buyers – 1.18:1, -16.67% From Current Price Level
$68 – Buyers – 1.04:1, -17.87% From Current Price Level
$67 – Sellers – 1.07:1, -19.08% From Current Price Level
$66 – Sellers – 1.15:1, -20.29% From Current Price Level
$65 – Buyers – 1.43:1, -21.5% From Current Price Level
$64 – Buyers – 1.16:1, -22.71% From Current Price Level
$63 – Sellers – 1.3:1, -23.91% From Current Price Level
$62 – Sellers – 1.07:1, -25.12% From Current Price Level
$61 – Sellers – 4:1, -26.33% From Current Price Level
$60 – Buyers – 4.5:1, -27.54% From Current Price Level
$59 – Buyers – 1.06:1, -28.74% From Current Price Level
$58 – Buyers – 1.14:1, -29.95% From Current Price Level
$57 – Buyers – 2:1, -31.16% From Current Price Level
$56 – Sellers – 1.46:1, -32.37% From Current Price Level
$55 – Buyers – 1.54:1, -33.57% From Current Price Level
$54 – Buyers – 1.31:1, -34.78% From Current Price Level
$53 – Buyers – 1.5:1, -35.99% From Current Price Level
$52 – Buyers – 1.26:1, -37.2% From Current Price Level
$51 – Buyers – 1.29:1, -38.41% From Current Price Level
$50 – Even – 1:1, -39.61% From Current Price Level
$49 – Sellers – 1.31:1, -40.82% From Current Price Level
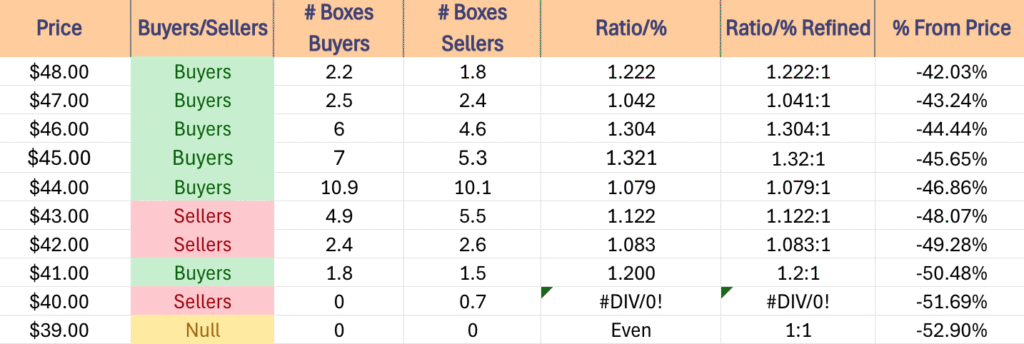
$48 – Buyers – 1.22:1, -42.03% From Current Price Level
$47 – Buyers – 1.04:1, -43.24% From Current Price Level
$46 – Buyers – 1.3:1, -44.44% From Current Price Level
$45 – Buyers – 1.32:1, -45.65% From Current Price Level
$44 – Buyers – 1.08:1, -46.86% From Current Price Level
$43 – Sellers – 1.12:1, -48.07% From Current Price Level
$42 – Sellers – 1.08:1, -49.28% From Current Price Level
$41 – Buyers – 1.2:1, -50.48% From Current Price Level
$40 – Sellers – 0.7:0*, -51.69% From Current Price Level
$39 – NULL – 0:0*, -52.9% From Current Price Level
*** I DO NOT OWN SHARES OR OPTIONS CONTRACT POSITIONS IN XLP AT THE TIME OF PUBLISHING THIS ARTICLE ***
The VIX closed at 17.69, indicating an implied one day move of +/-1.12% & an implied one month move of +/-5.11% for the S&P 500.
Highest Technical Rated S&P 500 Components Per 6/3/2025’s Close:
1 – PLTR
2 – NRG
3 – GEV
4 – HWM
5 – VST
6 – AVGO
7 – CRWD
8 – STX
9 – AXON
10 – DG
Lowest Technical Rated S&P 500 Components Per 6/3/2025’s Close:
1 – UNH
2 – REGN
3 – ENPH
4 – COO
5 – DECK
6 – DOW
7 – ARE
8 – ALB
9 – LYB
10 – MRNA
Highest Volume Rated S&P 500 Components Per 6/3/2025’s Close:
1 – DG
2 – CEG
3 – INCY
4 – FDS
5 – ON
6 – KVUE
7 – DLTR
8 – CPB
9 – UNP
10 – COO
Lowest Volume Rated S&P 500 Components Per 6/3/2025’s Close:
1 – WBA
2 – BRO
3 – FRT
4 – CRL
5 – ALGN
6 – NOC
7 – FOX
8 – GPN
9 – MTCH
10 – HAS
Highest Technical Rated ETFs Per 6/3/2025’s Close:
1 – JNUG
2 – NUGT
3 – DFEN
4 – HOOX
5 – ROBN
6 – AUMI
7 – GDMN
8 – URAA
9 – GOEX
10 – CRPT
Lowest Technical Rated ETFs Per 6/3/2025’s Close:
1 – ETHD
2 – TSLZ
3 – TSLQ
4 – TSDD
5 – MSOX
6 – HZEN
7 – JDST
8 – NVDQ
9 – SOXS
10 – NVD
Highest Volume Rated ETFs Per 6/3/2025’s Close:
1 – BBBI
2 – XHYT
3 – QVML
4 – HYSD
5 – NBCC
6 – PSQO
7 – XHYC
8 – DMCY
9 – MVPL
10 – XHYH
Lowest Volume Rated ETFs Per 6/3/2025’s Close:
1 – KVLE
2 – USCA
3 – KLMN
4 – TDEC
5 – HYDW
6 – DECZ
7 – NJNK
8 – BUFM
9 – MQQQ
10 – MFSB
Highest Technical Rated General Stocks Per 6/3/2025’s Close:
1 – RGC
2 – SBET
3 – NAKA
4 – BSGM
5 – LYRA
6 – ASST
7 – NCL
8 – TMPOQ
9 – MCTR
10 – SVT
Lowest Technical Rated General Stocks Per 6/3/2025’s Close:
1 – QVCGB
2 – GDHG
3 – FMTO
4 – DGLY
5 – SUNE
6 – ZCAR
7 – APDN
8 – REVB
9 – WHLR
10 – XHG
Highest Volume Rated General Stocks Per 6/3/2025’s Close:
1 – KPRX
2 – MCTR
3 – WHLR
4 – TRAW
5 – CMBM
6 – ESLA
7 – SOAR
8 – RSLS
9 – OUT
10 – REVB
Lowest Volume Rated General Stocks Per 6/3/2025’s Close:
1 – KLNG
2 – OMH
3 – VHIBF
4 – GVH
5 – AIJTY
6 – ACKRF
7 – ENRT
8 – SBIG
9 – NMHI
10 – INEO
*** THE LIST ABOVE IS STRICTLY FOR INFORMATIONAL PURPOSES – I MAY OR MAY NOT HAVE OR INITIATE A LONG, SHORT, OR LONG/SHORT POSITION IN ANY NAME ABOVE AT ANY TIME ***
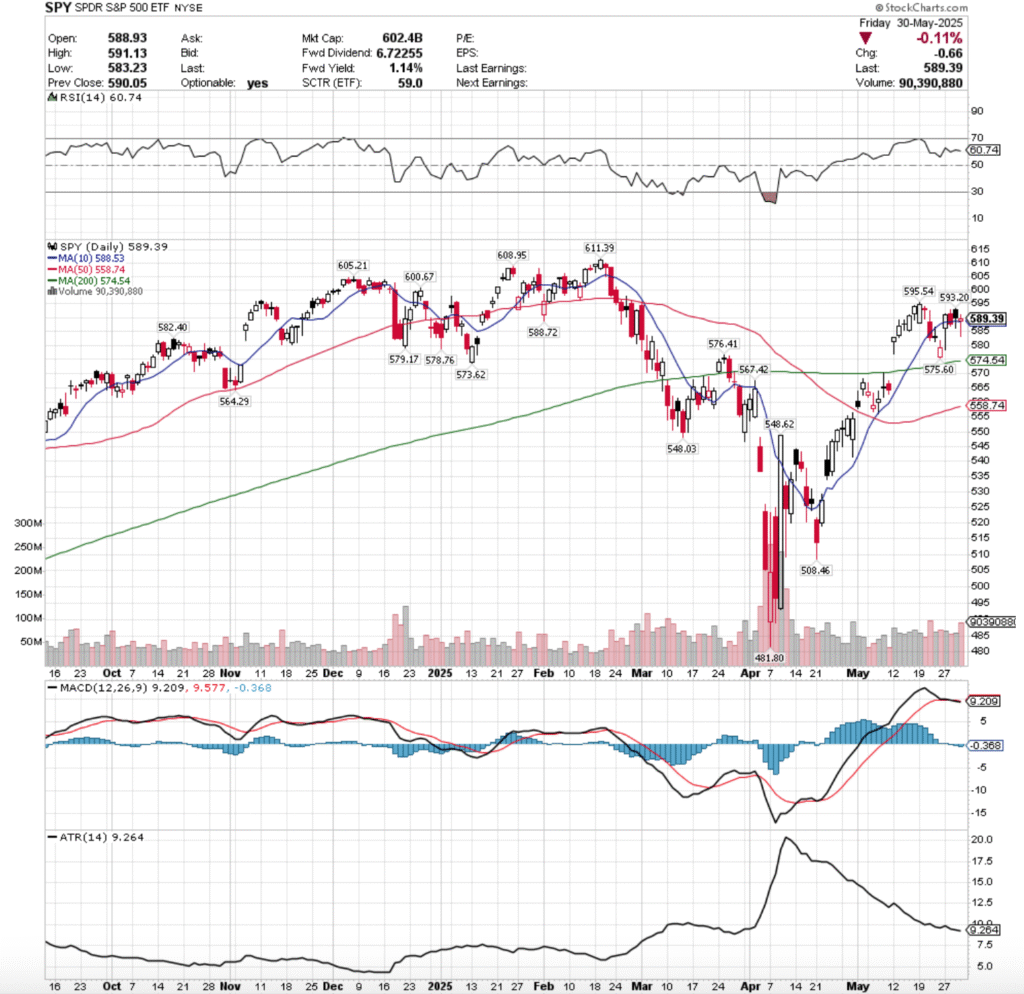
SPY, the SPDR S&P 500 ETF gained +1.78% last week, while the VIX closed the week at 18.57, indicating an implied one day move of +/-1.17% & an implied one month move of +/-5.37%.
SPY ETF – SPDR S&P 500 ETF’s Technical Performance Over The Past Year
Their RSI is relatively flat after last week’s limited price range, currently sitting at 60.74, while their MACD crossed over bearishly, but is also relatively flat.
Volumes were +32.73% above the prior year’s average (75,427,500 vs. 56,826,680), which is an area for concern given the highest volume session was Friday’s profit taking decline & two other sessions were cause for concern (75% of the week, given it was a holiday week).
Tuesday the week opened on a gap up, but with very shaky footing beneath it.
While the day closed as a +2.08% advancing session, the day’s low had retraced the entire gap range & into Friday’s candle’s body below Friday’s closing price.
While this occurred on the second highest volume of the week, it looked a lot more like an intra-day profit grab on a shortened week vs. an actual solid advancing session.
Wednesday opened slightly higher, but was pulled back down & ultimately broke down though the support of the 10 day moving average, indicating that the short-term trend is possibly in trouble.
Thursday reinforced this hazy outlook for SPY, when on an opening gap up there was no footing to be found & intraday the support of the 10 DMA broke down again as shown by the candle’s lower shadow.
The combination of the week’s second lowest volume, the deep intraday breakdown of the 10 DMA’s support, even if only temporary & the close being lower than the day’s open are all causes for concern, as market participants are clearly not thinking we’re out of the woods just yet.
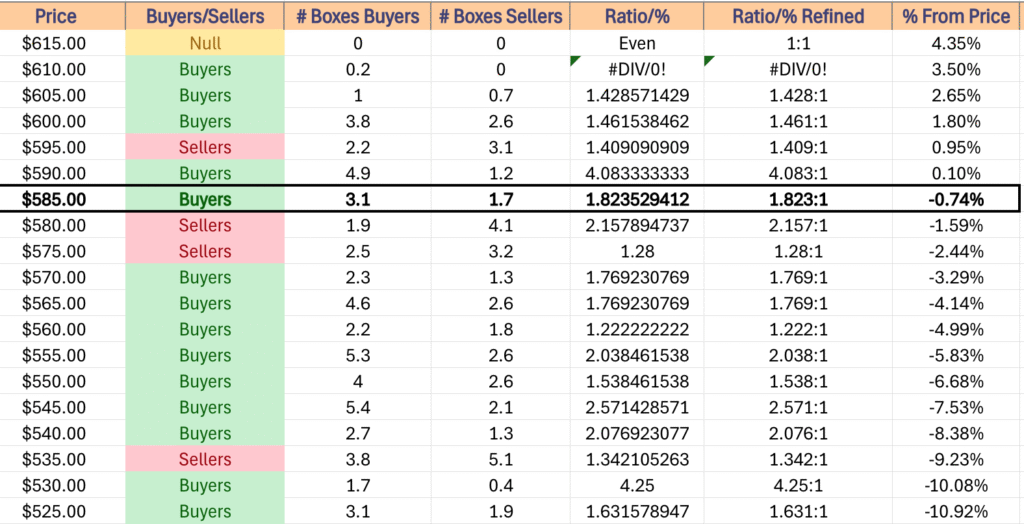
Friday also did little to inspire confidence for SPY, as the week’s highest volume session opened below Thursday’s closing price, dropped temporarily intraday to below $585/share, before managing to advance above the day’s open into the close, but still resulted in a decline of -0.11%.
The high volume isn’t as bad in this instance as it may have been viewed in an outright declining day, given that there was a good amount of shares changing hands, folks taking profits & some folks buying back in in anticipation of this coming week, which will have aslew of Fed speakers & also some data points that will shed insight into the state of employment & manufacturing in the U.S..
What is alarming though is that the session opened just above the 10 DMA’s support, managed to break down through it -0.97% to the day’s low, and then saw the close wind up just marginally above the day’s open.
The Day-over-Day change in lows is also an area of concern heading into the new week, as it is exposing that there is more & more downside appetite among market participants.
In last week’s market review note we noted that there was going to be an interesting Seller zone cross through in order for price to re-test the 10 DMA & then ultimately if broken through, test the strength of it as a support level.
Most of that was accomplished by Tuesday morning’s gap up open, which should be tread carefully around given that the volume level was second highest of a 4 day week, but nothing that expressed proper conviction behind the move & it’s likely not sustainable.
This week, to the upside there will need to be the same sustainable high advancing volume levels mentioned over the past months now, but the $600.67 mark is an area to watch.
Should prices test this level it means having passed through a Seller zone to the upside, and there may be some high participation that forces prices to continue higher.
In the event of further consolidation, expect price to continue to oscillate around the 10 day moving average as we await a catalyst to the upside or downside.
In the event that it takes a few weeks to reach one (highly doubtful), there may be a slight bump to the upside from the 50 DMA crossing over the 200 DMA bullishly, but this is an extreme case example.
To the downside, the 200 day moving average is an area all eyes should be focused on, as the long-term trendline was only crossed over on a gap up, which was somewhat speculative.
How market participants think of the price in relation to the long-term trend is going to be a key area to watch.
While the past few years show that price zones down to $574.99/share have been Seller dominated, there may be some footing to be found once price has dropped below there, which would alleviate concerns of the 200 DMA being re-tested, but it is certainly an area to be watching.
Price will like oscillate between the 10 & 200 DMAs for a while while we await a further up/downside catalyst in the event that this decline takes place.
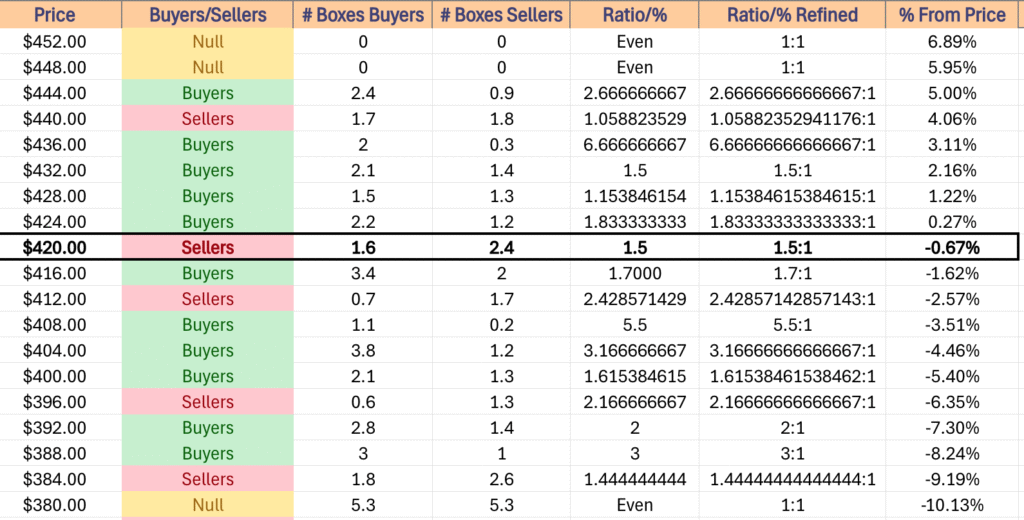
SPY has support at the $588.72 (Volume Sentiment: Buyers, 1.82:1), $588.53 (10 Day Moving Average, Volume Sentiment: Buyers, 1.82:1), $582.40 (Volume Sentiment: Sellers, 2.16:1) & $579.17/share (Volume Sentiment: Sellers, 1.28:1) price levels, with resistance at the $593.20 (Volume Sentiment: Buyers, 4.08:1), $595.54 (Volume Sentiment: Sellers, 1.41:1), $600.67 (Volume Sentiment: Buyers, 1.46:1) & $605.21/share (Volume Sentiment: Buyers, 1.43:1) price levels.
SPY ETF’s Price Level:Volume Sentiment Over The Past ~3 Years
QQQ, the Invesco QQQ Trust ETF advanced +1.94% for the week, as the tech-heavy index was the favorite of the major four index ETFs.
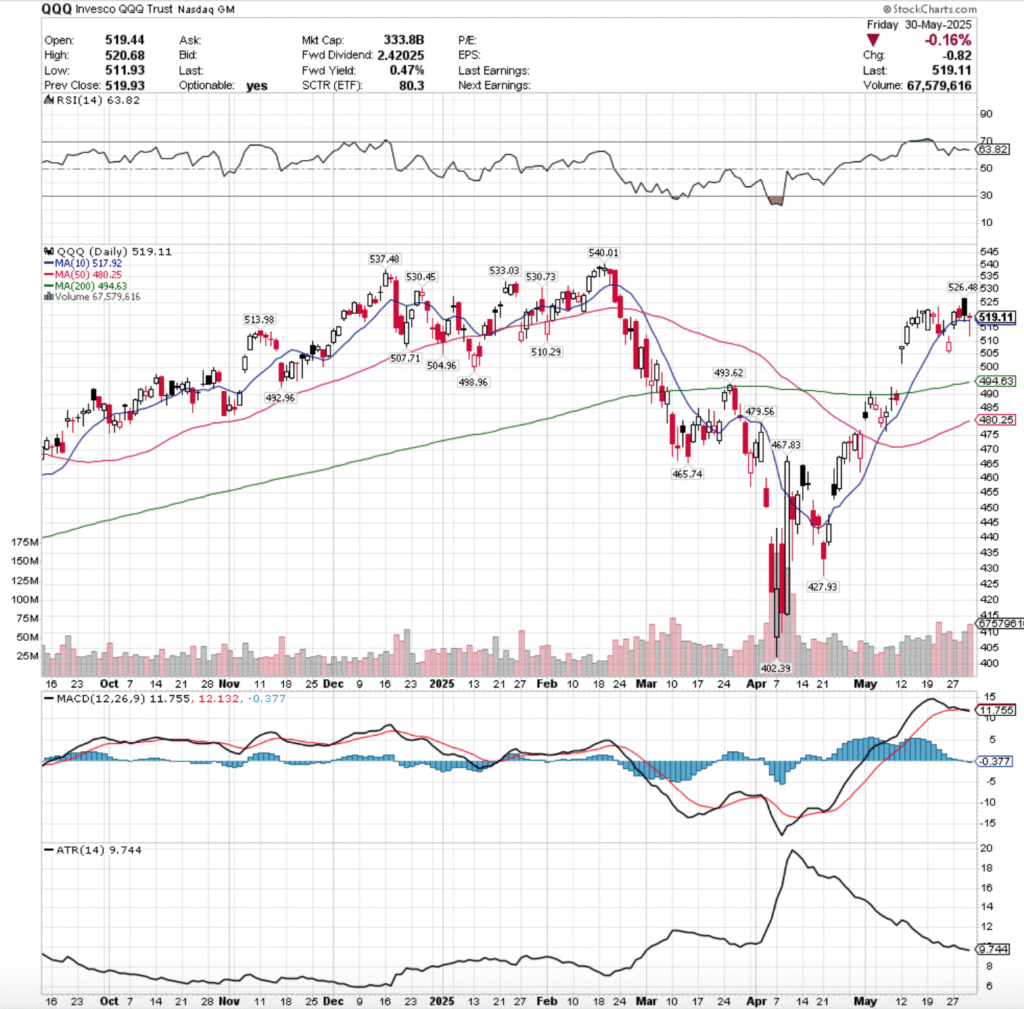
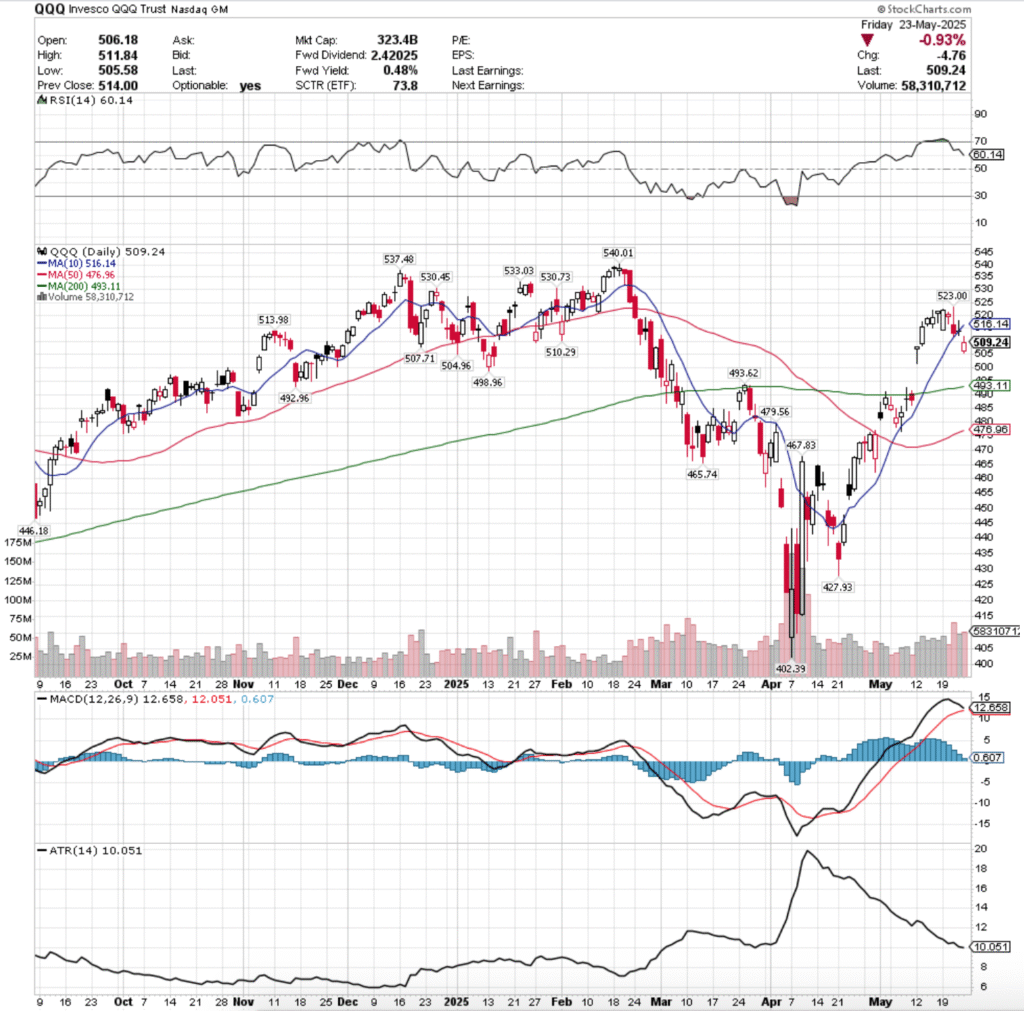
QQQ ETF – Invesco QQQ Trust ETF’s Technical Performance Over The Past Year
Their RSI has flattened out following last week as well, but currently sits at 63.82, while their MACD is bearish.
Volumes were +45.75% higher than the prior year’s average (55,062,500 vs. 37,779,012), which paints a similar problem as the one mentioned above for SPY.
Tuesday the week opened up a similar gap up, gaining +2.35% on the day on the second lowest volume of the week.
It opened just beneath the 10 day moving average’s support, temporarily dipped below the $515/share level on the low end of the day’s range, before gaining some steam & powering higher to close setting the stage for the week to be above the 10 DMA.
Wednesday opened on a gap higher, tested slightly higher as displayed on their upper shadow, but declined the rest of the day to re-test the 10 day moving average’s support, which was able to hold up & force the day to close above it, despite declining -0.44% on the day.
Thursday is where the concern really began though & cracks began to show, as the session opened on a gap higher, but it was mostly downhill from there.
QQQ declined to dip beneath the support of the 10 day moving average, but was able to rally higher to close lower on the day than it opened, but still for a day-over-day gain of +0.2%.
Thursday was the second highest volume day of the week, and while it can be said that it covered a wide range of prices, it can also be said that it was a day of heavy profit-taking, which reflects negative sentiment & calls into question the strength of the short-term trend line (10 day moving average).
Friday confirmed that there was a bit of blood in the water, as QQQ opened lower, briefly tested to the upside, but was rejected near the close of Thursday’s session, and prices free-fell in a profit taking bonanza that dropped QQQ down to $511.93/share during the day’s low.
While prices climbed back to close the day as a dragonfly doji, this downside appetite doesn’t inspire confidence in the tech-heavy index.
Given the proximity of the short-term trend line & the new downside appetite that made a run at closing the window of Tuesday’s gap (assuming it closed near the lows), it is going to be worth watching for a rugpull in the coming week.
To the upside there are two place to watch, first being the $526.48 level & second being the resistance zone in the $530-531/share level.
While the table below shows that this is all Buyer oriented historically, this looks primed to be a time of ratio dilution with Sellers stepping in, so there will need to be some solid volume behind any upwards moves to make them sustain.
The consolidation case looks like a bit of oscillating around the 10 DMA awaiting an upside/downside catalyst, with a chance up a slight uptick when the 50 DMA crosses bullishly over the 200 DMA, but that’s weeks away, should it occur.
The downside view looks tricky, as in the event that the first support levels of $517.92 breaks down, we enter a Seller zone with two support levels, which should they break down may become problematic, given the window from early May that needs to be closed.
In the event that the gap begins to fill, the strength of the long-term trend line (200 DMA) is going to be key, but more likely to be determined by recent candles near the approach & their volume trends.
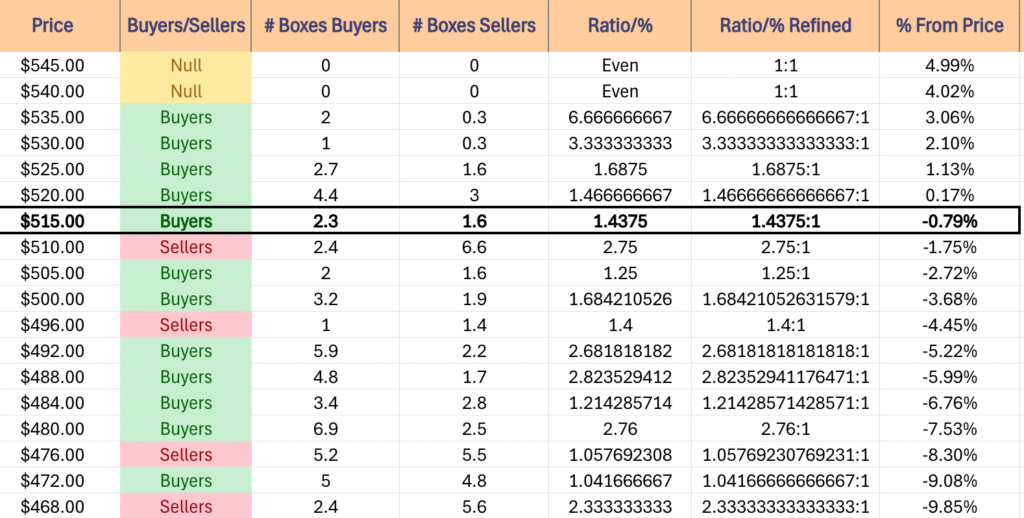
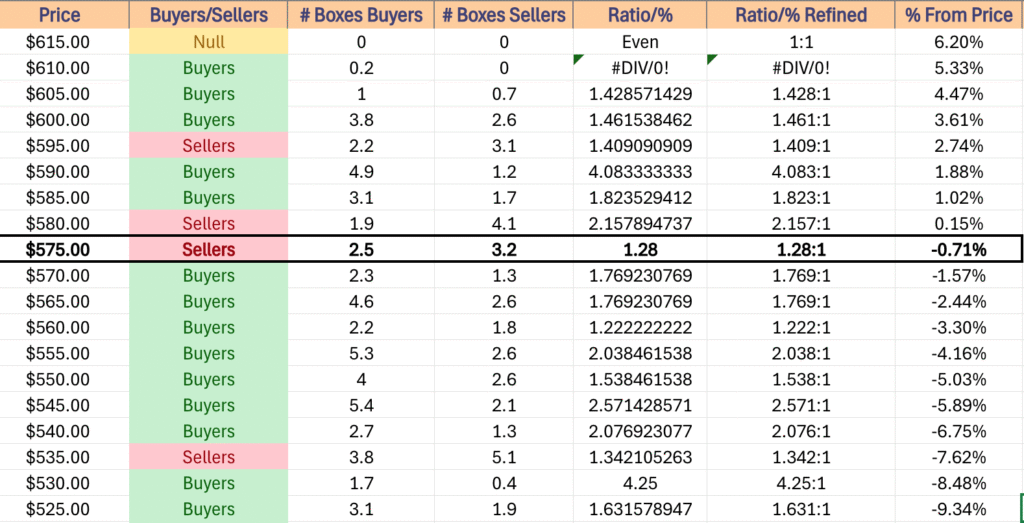
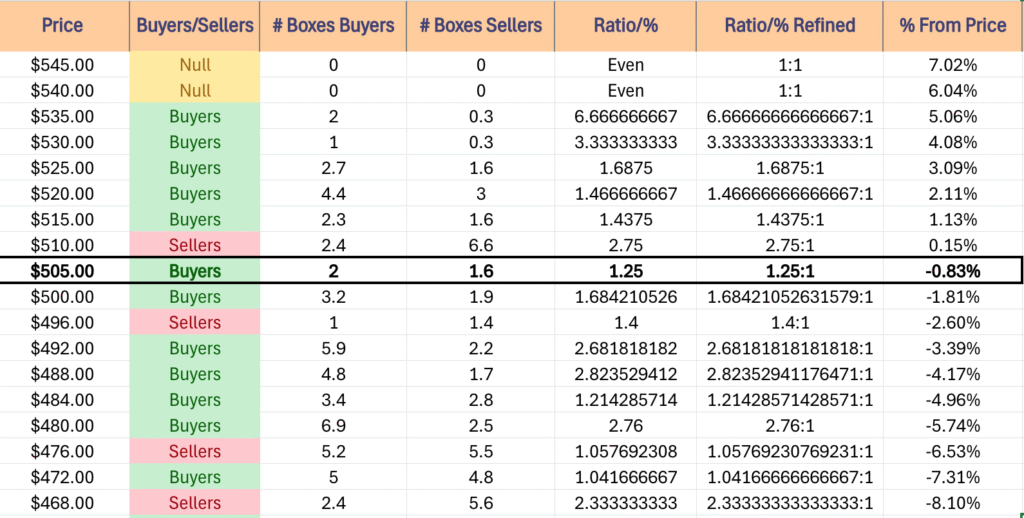
QQQ has support at the $517.92 (10 Day Moving Average, Volume Sentiment: Buyers, 1.44:1), $513.98 (Volume Sentiment: Sellers, 2.75:1), $510.29 (Volume Sentiment: Sellers, 2.75:1) & $507.71/share (Volume Sentiment: Buyers, 1.25:1) price levels, with resistance at the $526.48 (Volume Sentiment: Buyers, 1.69:1), $530.45 (Volume Sentiment: Buyers, 3.33:1), $530.73 (Volume Sentiment: Buyers, 3.33:1) & $533.03/share (Volume Sentiment: Buyers, 3.33:1) price levels.
QQQ ETF’s Price Level:Volume Sentiment Over The Past ~1 Year
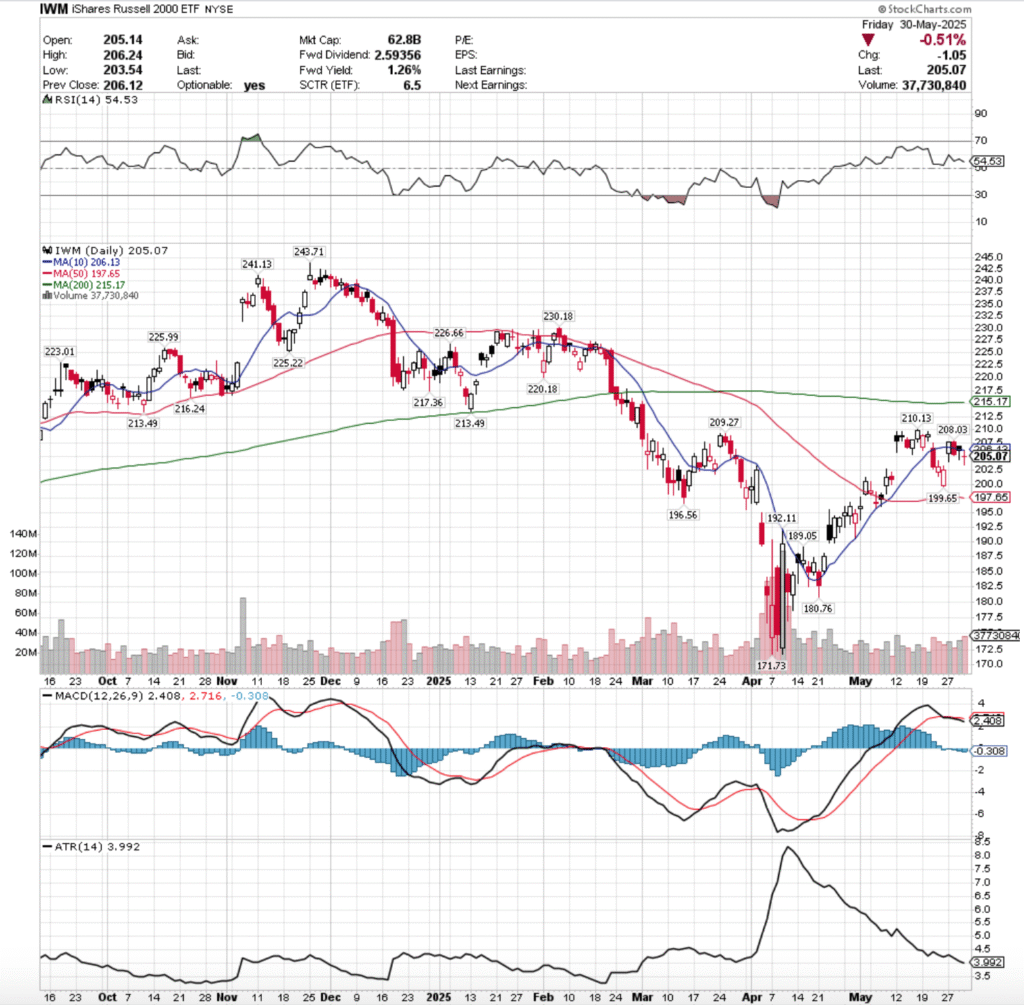
IWM ETF – iShares Russell 2000 ETF’s Technical Performance Over The Past Year
Their RSI is trending down towards the neutral 50-mark, currently sitting at 54.53, while their MACD is bearish, but has been relatively flat awaiting a catalyst for the past week.
Volumes were +6.82% above the prior year’s average level (32,070,000 vs. 30,022,411), which like the two aforementioned index ETFs is a cause for concern for IWM & its components.
The story of the week for IWM is similar to SPY & QQQ, however the 10 DMA did not prevail, which is slight cause for concern for the other two indexes.
While IWM is expected to lag them/be more of a slow grower with more oscillations on the way up, the short-term trendline’s breakdown paints a broad weak picture for the others.
Tuesday opened on a gap up, tested lower intra-day, but was able to power higher & close above the support of the 10 day moving average despite opening the day below it.
Wednesday opened in linen with Tuesday’s close, but made short work of sinking down through the 10 DMA’s support on the week’s weakest volume.
Thursday had a unique set up that signaled there was impending trouble on the horizon for IWM.
The session opened midway through Wednesday’s range, then broke out to the downside & was able to close lower than the open but above the day’s low & in-line with the 10 DMA.
Friday the week wound down on a week of skeptical uncertainty, as the week;s highest volume session resulted in a doji candle that opened on a gap lower, was unable to break out above the 10 DMA’s resistance to the upside, and a lot of profits were taken based on the amount of shares that exchanged hands over the last session of the week.
IWM is in a unique spot as it is more influenced by the larger cap indexes at the moment, as the uncertainty we’re surrounded by has folks not eager to jump into small cap names that are relatively unheard of.
As a result, the long-term trend line is the area of focus on the upside, given their state of limbo & that they’re trading below it.
Like SPY & QQQ, they’re going to need an influx in sustainable advancing volume to make a run at the 200 DMA’s resistance, so it’s something to keep an eye on, but not a focal point of IWM’s near-term performance.
In the consolidation case, we’ll see oscillations around the 10 DMA, which may wind up testing some of the other nearby support/resistance levels, which may cause the consolidation range to change, but the oscillations to continue.
The downside case brings all eyes on the 50 day moving average’s support, given that IWM is trading below its long & short-term trendlines.
Seller sentiment can bring IWM to the $197.99/share level, which would place it in the neighborhood of said re-test, which is a safe place to look in the coming week or two.
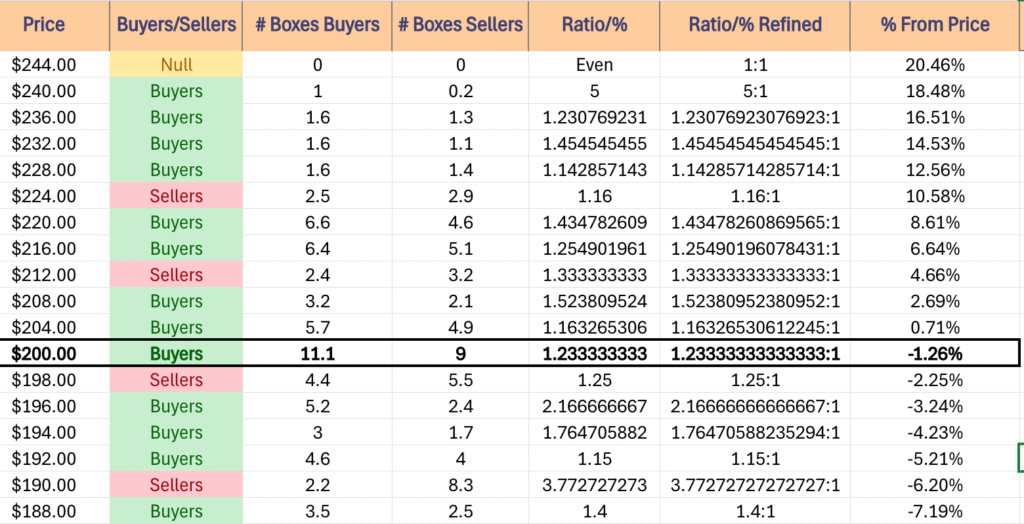
IWM has support at the $199.65 (Volume Sentiment: Sellers, 1.25:1), $197.65 (Volume Sentiment: Buyers, 2.17:1), $196.56 (Volume Sentiment: Buyers, 2.17:1) & $192.11/share (Volume Sentiment: Buyers, 1.15:1) price levels, with resistance at the $206.13 (10 Day Moving Average, Volume Sentiment: Buyers, 1.16:1), $208.03 (Volume Sentiment: Buyers, 1.52:1), $209.27 (Volume Sentiment: Buyers, 1.52:1) & $210.13/share (Volume Sentiment: Buyers, 1.52:1) price levels.
IWM ETF’s Price Level:Volume Sentiment Over The Past ~2-3 Years
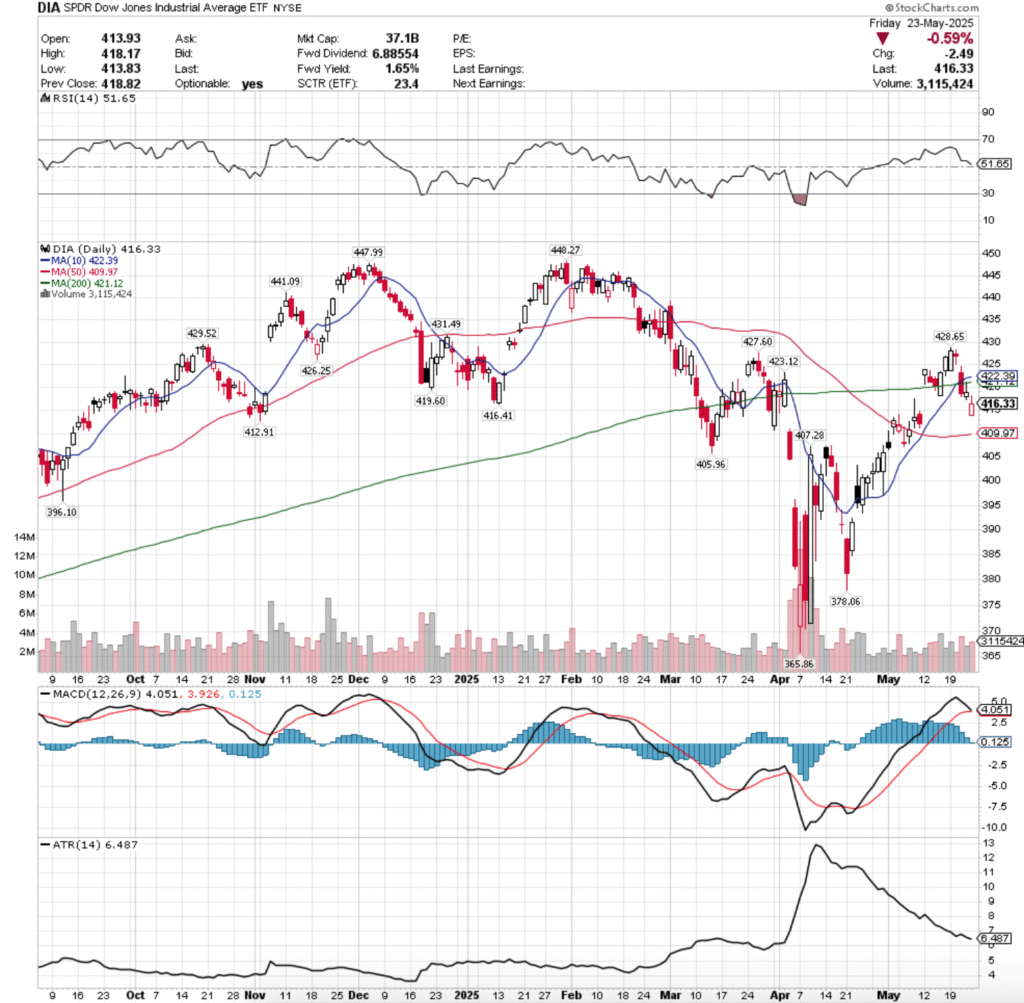
DIA, the SPDR Dow Jones Industrial Average ETF climbed +1.57% last week, but there was an air of caution based on volume levels, as we continue to see a more “buy & hold”/”wait & see” approach from the blue chip index.
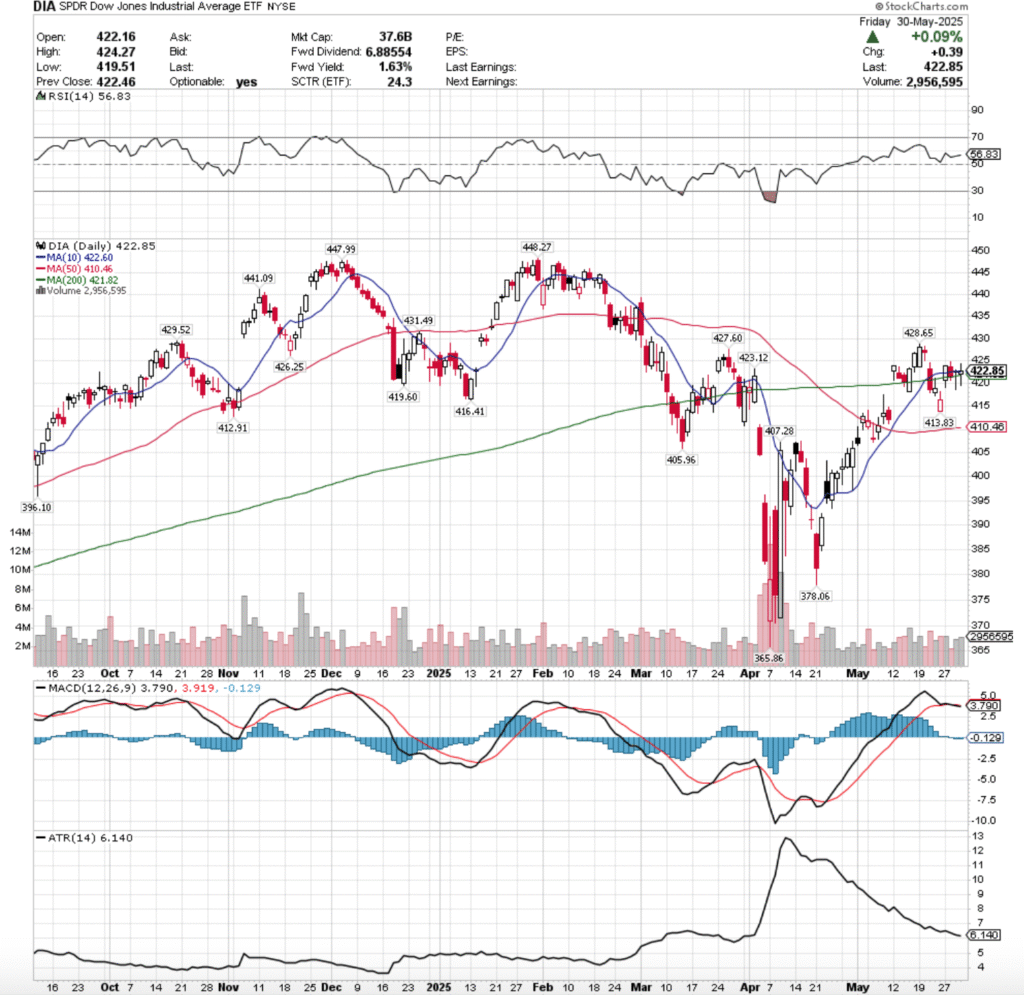
DIA ETF – SPDR Dow Jones Industrial Average ETF’s Technical Performance Over The Past Year
Their RSI is currently 56.83, while their MACD is bearish, but relatively flat following last week’s consolidation range.
Volumes were -16.39% lower than the prior year’s average level (2,657,500 vs. 3,178,498), signaling that there are a lot of market participants in “wait & see” mode with the blue chip index & its components.
DIA’s week opened Tuesday with more volume than its peers comparitively speaking & was a gap up open that was able to break above the resistance of the 200 day moving average, but not until after it showed that it had a bit of downside appetite down to the $419.19/share level.
Wednesday opened slightly lower, tried to rip higher, but ultimately sank down to close just above the 200 DMA, after briefly breaking through it to the downside, but forming a bearish harami pattern with Tuesday’s candle.
Thursday things continued to be interesting, as the day opened & closed as technically a bullish harami cross, but there was a major catch.
While the daily candle is a dragonfly doji, looking closely there are a few causes for concern, namely that the session opened & closed in-line with the short-term trendline, but intraday its support broke down, as did the support of the long-term trend line.
Given that the volume was the second lowest of the week but that wide of a price range was covered there is reason for doubt regarding the near-term for DIA.
Friday didn’t settle this fear, opening lower near the 200 DMA’s support, dropping below the $420/share level, before advancing to just short of the $425/share price level & closing just beneath it as a spinning top candle.
The indecision marked by the day’s candle sets the stage for an interesting week.
To the upside, the first resistance levels is in a Seller dominated zone (table below), which as mentioned now for months will require a steady, consistent uptick in advancing volume to break above, even if this past week’s consolidation does become a launch pad.
From there, the high water mark becomes the $431.49/share level, which while there is historic Buyer sentiment all the way up to it, it wanes after the next price level, which makes it worth keeping an eye out to see if Sellers step in, rejecting an advance & diluting the historic ratio.
The consolidation case should prices not break the next resistance levels looks similar to what last week delivered, and shows DIA oscillating around the 10 & 200 day moving averages until we see an upside or downside catalyst.
An area of caution though for that scenario is that we are in a Buyer dominated price zone historically, and that may mean that any slight slips wind up leading to larger declines than expected.
In the event of a downside catalyst, the next two support levels are in a Seller dominated historic price zone.
Should both the long & short term trendlines (10 & 200 DMAs) break down & these levels can’t foot support, watch for the windows created in May to be filled & prices revert towards the 50 day moving average’s support.
Watching Volume levels & comparing them with the historic sentiments in the table below will be beneficial in navigating these markets.
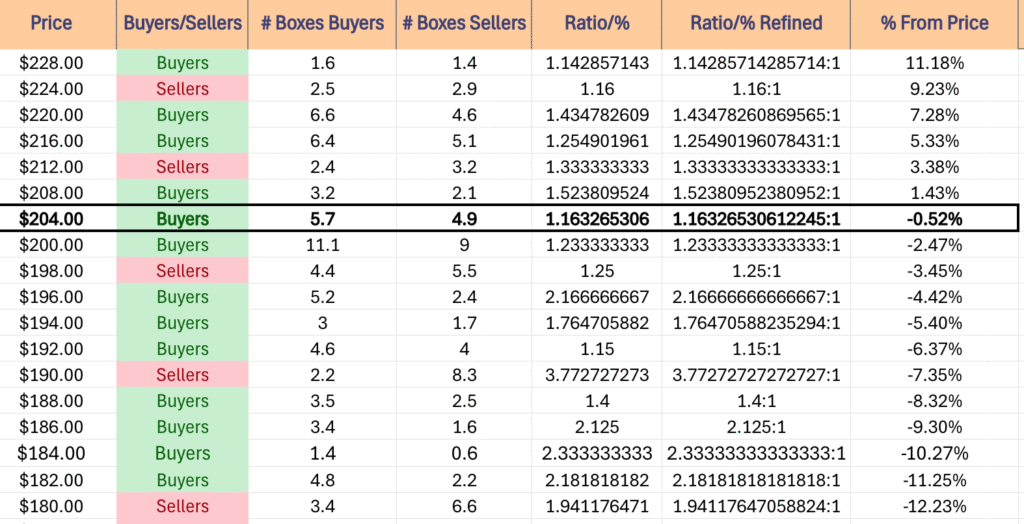
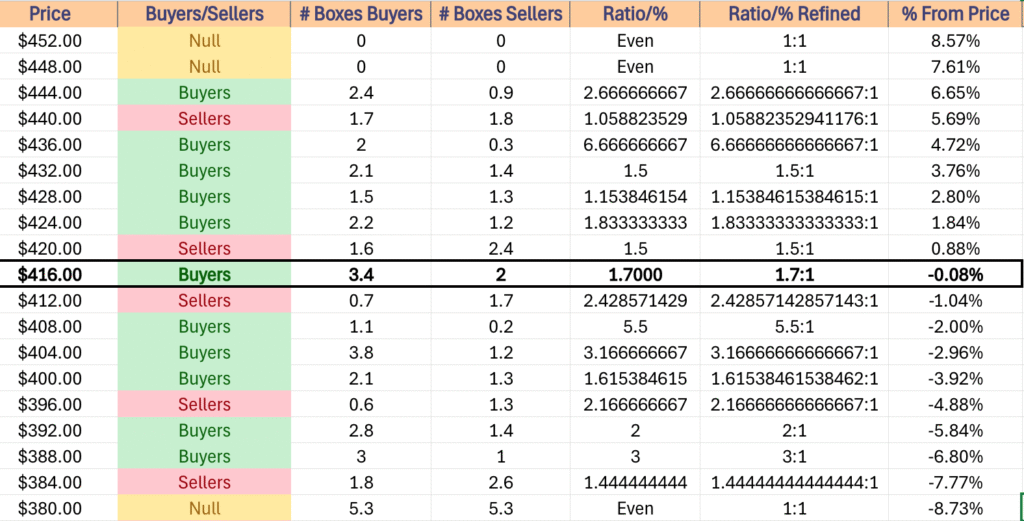
DIA has support at the $422.60 (10 Day Moving Average, Volume Sentiment: Sellers, 1.5:1), $421.82 (200 Day Moving Average, Volume Sentiment: Sellers, 1.5:1), $419.60 (Volume Sentiment: Buyers, 1.7:1) & $416.41/share (Volume Sentiment: Buyers, 1.7:1) price levels, with resistance at the $423.12 (Volume Sentiment: Sellers, 1.5:1), $426.25 (Volume Sentiment: Buyers, 1.83:1), $427.60 (Volume Sentiment: Buyers, 1.83:1) & $428.65/share (Volume Sentiment: Buyers, 1.15:1) price levels.
DIA ETF’s Price Level:Volume Sentiment Over The Past ~4-5 Years
The Week Ahead
Monday kicks the week off with S&P Final Manufacturing PMI data at 9:45 am, ISM Manufacturing data comes out at 10 am along with Construction Spending data, Fed President Logan speaks at 10:15 am, Fed President Goolsbee speaks at 12:45 pm & Fed Chair Powell speaks at 1 pm.
Before Monday’s opening bell Campbell’s Soup & Science Applications Report Earnings, before Credo Technology Group after the close.
Factory Orders & Job Openings data come out Tuesday at 10 am, before Fed President Goolsbee speaks at 12:45 pm, Fed Governor Cook speaks at 1 pm & Fed President Logan speaks at 3:30 pm.
Tuesday morning’s earnings calls include Dollar General, Donaldson, Ferguson, NIO, Ollie’s Bargain Outlet & Signet Jewelers, before CrowdStrike Holdings, Asana, Couchbase, Guidewire Software, Hewlett Packard Enterprise & Yext after the session’s closing bell.
Wednesday morning brings us ADP Employment numbers at 8:15 am, Fed Presidents Bostic & Cook speak at 10:15 am, S&P Final U.S. Services PMI data comes out at 9:45 am, ISM Services data comes out at 10 am & the Fed’s Beige Book is released at 2pm.
Dollar Tree, Genesco, REV Group, Sprinklr & Thor Industries report earnings before the opening bell on Wednesday, while Argan, Descartes, Five Below, Greif, MongoDB, PVH & Verint Systems report earnings following the session’s close.
Thursday brings us Initial Jobless Claims, U.S. Trade Deficit & U.S. Productivity data at 8:30 am, before Fed Governor Kugler speaks at 12 pm & Fed President Harker speaks at 1:30 pm.
Brown-Forman, Ciena, Cracker Barrell, Hello Group, Toro & Victoria’s Secret all report earnings before Thursday’s open, before Broadcom, Braze, DocuSign, Lululemon Athletica, Mission Produce, Petco Health & Welness, Rubrik, Samsara, Service Titan, Vail Resorts & Zumiez report after the closing bell.
U.S. Employment Report, U.S. Unemployment Rate, U.S. Hourly Wages & Hourly Wages Year-over-Year are all due Friday morning at 8:30 am, followed by Consumer Credit at 3pm.
Friday features ABM Industries reporting earnings after the session’s close.
See you back here next week!
*** I DO NOT OWN SHARES OR OPTIONS CONTRACT POSITIONS IN SPY, QQQ, IWM OR DIA AT THE TIME OF PUBLISHING THIS ARTICLE ***
The VIX closed at 18.57, indicating an implied one day move of +/-1.17% & an implied one month move of +/-5.37% for the S&P 500.
Highest Technical Rated S&P 500 Components Per 5/30/2025’s Close:
1 – PLTR
2 – NRG
3 – GEV
4 – HWM
5 – AXON
6 – MOS
7 – CRWD
8 – NFLX
9 – STX
10 – CEG
Lowest Technical Rated S&P 500 Components Per 5/30/2025’s Close:
1 – UNH
2 – ENPH
3 – REGN
4 – COO
5 – DECK
6 – DOW
7 – MRNA
8 – ALB
9 – ARE
10 – BLDR
Highest Volume Rated S&P 500 Components Per 5/30/2025’s Close:
1 – AIZ
2 – IPG
3 – EMN
4 – DAY
5 – AOS
6 – HST
7 – VTRS
8 – WBA
9 – REGN
10 – TECH
Lowest Volume Rated S&P 500 Components Per 5/30/2025’s Close:
1 – COIN
2 – SMCI
3 – CRL
4 – MTCH
5 – TPR
6 – AES
7 – SBUX
8 – TKO
9 – KMB
10 – RL
Highest Technical Rated ETFs Per 5/30/2025’s Close:
1 – JNUG
2 – DFEN
3 – NUGT
4 – MEXX
5 – SHLD
6 – ROBN
7 – HIMZ
8 – RBLU
9 – URAA
10 – AUMI
Lowest Technical Rated ETFs Per 5/30/2025’s Close:
1 – TSLZ
2 – TSLQ
3 – TSDD
4 – ETHD
5 – MSOX
6 – HZEN
7 – BTCZ
8 – SBIT
9 – FIAT
10 – NVDQ
Highest Volume Rated ETFs Per 5/30/2025’s Close:
1 – SPCZ
2 – EMCS
3 – GVUS
4 – KVLE
5 – FHEQ
6 – LFAZ
7 – USCA
8 – LKOR
9 – MFSB
10 – XIJN
Lowest Volume Rated ETFs Per 5/30/2025’s Close:
1 – KLMN
2 – CCNR
3 – AGRH
4 – ZSEP
5 – SSPY
6 – FDIV
7 – NNOV
8 – CARK
9 – KOOL
10 – MYCG
Highest Technical Rated General Stocks Per 5/30/2025’s Close:
1 – RGC
2 – SBET
3 – NAKA
4 – BSGM
5 – TMPOQ
6 – ASST
7 – DFDV
8 – SVT
9 – IMCC
10 – AIJTY
Lowest Technical Rated General Stocks Per 5/30/2025’s Close:
1 – TBIO
2 – MULN
3 – GDHG
4 – DGLY
5 – FMTO
6 – SUNE
7 – NCNA
8 – WHLR
9 – APDN
10 – EJH
Highest Volume Rated General Stocks Per 5/30/2025’s Close:
1 – GITS
2 – BLRX
3 – TIRX
4 – DEA
5 – OUT
6 – BENF
7 – GWH
8 – VIVK
9 – SLE
10 – RRGB
Lowest Volume Rated General Stocks Per 5/30/2025’s Close:
1 – CANSF
2 – IDKFF
3 – ESMC
4 – ACKRF
5 – NSFDF
6 – CVVUF
7 – IDXG
8 – YGTFF
9 – VRDR
10 – STEC
*** THE LIST ABOVE IS STRICTLY FOR INFORMATIONAL PURPOSES – I MAY OR MAY NOT HAVE OR INITIATE A LONG, SHORT, OR LONG/SHORT POSITION IN ANY NAME ABOVE AT ANY TIME ***
The VIX closed at 19.31, indicating an implied one day move of +/-1.22% & an implied one month move of +/-5.58% for the S&P 500.
Highest Technical Rated S&P 500 Components Per 5/28/2025’s Close:
1 – PLTR
2 – NRG
3 – GEV
4 – HWM
5 – AXON
6 – MOS
7 – CEG
8 – NFLX
9 – CRWD
10 – STX
Lowest Technical Rated S&P 500 Components Per 5/28/2025’s Close:
1 – ENPH
2 – UNH
3 – MRNA
4 – DECK
5 – AES
6 – ARE
7 – BLDR
8 – DOW
9 – IQV
10 – ALB
Highest Volume Rated S&P 500 Components Per 5/28/2025’s Close:
1 – SNPS
2 – ANSS
3 – CDNS
4 – CNP
5 – FICO
6 – HOLX
7 – AOS
8 – NTRS
9 – HPQ
10 – VMC
Lowest Volume Rated S&P 500 Components Per 5/28/2025’s Close:
1 – NFLX
2 – CRL
3 – AKAM
4 – URI
5 – PPG
6 – UAL
7 – FSLR
8 – JBHT
9 – FAST
10 – PWR
Highest Technical Rated ETFs Per 5/28/2025’s Close:
1 – IONX
2 – URAA
3 – JNUG
4 – MEXX
5 – RKLX
6 – DFEN
7 – BTCL
8 – BITU
9 – NUGT
10 – BTFX
Lowest Technical Rated ETFs Per 5/28/2025’s Close:
1 – TSLZ
2 – TSLQ
3 – TSDD
4 – ETHD
5 – MSOX
6 – BTCZ
7 – SBIT
8 – HZEN
9 – NVD
10 – SOXS
Highest Volume Rated ETFs Per 5/28/2025’s Close:
1 – FTHF
2 – SJLD
3 – ZSC
4 – PQJL
5 – GFGF
6 – CRDT
7 – RSPE
8 – QLTI
9 – GSID
10 – QAT
Lowest Volume Rated ETFs Per 5/28/2025’s Close:
1 – AGRH
2 – BBEM
3 – CCNR
4 – HYDW
5 – AUGZ
6 – UNOV
7 – RFLR
8 – DECZ
9 – NMB
10 – XTJL
Highest Technical Rated General Stocks Per 5/28/2025’s Close:
1 – RGC
2 – NAKA
3 – SBET
4 – DFDV
5 – BGSM
6 – ASST
7 – TMPOQ
8 – SMFL
9 – AIJTY
10 – BROG
Lowest Technical Rated General Stocks Per 5/28/2025’s Close:
1 – GDHG
2 – MULN
3 – FMTO
4 – SUNE
5 – DGLY
6 – NCNA
7 – WHLR
8 – YHC
9 – STSS
10 – XHG
Highest Volume Rated General Stocks Per 5/28/2025’s Close:
1 – SPRO
2 – OMTK
3 – SGD
4 – IMCC
5 – SCWO
6 – OUT
7 – ECDA
8 – MAMA
9 – PLRZ
10 – BROG
Lowest Volume Rated General Stocks Per 5/28/2025’s Close:
1 – CIAFF
2 – HEWA
3 – LTHCF
4 – PLSDF
5 – ROKRF
6 – GALKF
7 – MOGU
8 – STEK
9 – OMH
10 – SXTC
*** THE LIST ABOVE IS STRICTLY FOR INFORMATIONAL PURPOSES – I MAY OR MAY NOT HAVE OR INITIATE A LONG, SHORT, OR LONG/SHORT POSITION IN ANY NAME ABOVE AT ANY TIME ***
The VIX closed at 18.96, indicating an implied one day move of +/-1.2% & an implied one month move of +/-5.48% for the S&P 500.
Highest Technical Rated S&P 500 Components Per 5/27/2025’s Close:
1 – NRG
2 – PLTR
3 – GEV
4 – HWM
5 – AXON
6 – CRWD
7 – CEG
8 – MOS
9 – NFLX
10 – RL
Lowest Technical Rated S&P 500 Components Per 5/27/2025’s Close:
1 – UNH
2 – ENPH
3 – FICO
4 – MRNA
5 – ARE
6 – DECK
7 – IQV
8 – AES
9 – DOW
10 – FI
Highest Volume Rated S&P 500 Components Per 5/27/2025’s Close:
1 – HOLX
2 – FICO
3 – CPRT
4 – AZO
5 – GEN
6 – VMC
7 – ROST
8 – WMB
9 – INTU
10 – WDAY
Lowest Volume Rated S&P 500 Components Per 5/27/2025’s Close:
1 – CRL
2 – DTE
3 – IP
4 – DXCM
5 – APA
6 – ETN
7 – EXE
8 – ADM
9 – NI
10 – PARA
Highest Technical Rated ETFs Per 5/27/2025’s Close:
1 – IONX
2 – TESL
3 – BTCL
4 – BITU
5 – URAA
6 – BITX
7 – BTFX
8 – MEXX
9 – MAXI
10 – RKLX
Lowest Technical Rated ETFs Per 5/27/2025’s Close:
1 – TSLZ
2 – TSLQ
3 – TSDD
4 – ETHD
5 – MSOX
6 – BTCZ
7 – SBIT
8 – FIAT
9 – SOXS
10 – NVDQ
Highest Volume Rated ETFs Per 5/27/2025’s Close:
1 – PJFM
2 – PQJL
3 – HCOM
4 – UNIY
5 – LEAD
6 – MYMF
7 – CORO
8 – HYDW
9 – SDD
10 – EFRA
Lowest Volume Rated ETFs Per 5/27/2025’s Close:
1 – PSCW
2 – AGRH
3 – CCNR
4 – BBEM
5 – AUGZ
6 – FLAO
7 – AUGW
8 – XAPR
9 – SBND
10 – UNOV
Highest Technical Rated General Stocks Per 5/27/2025’s Close:
1 – RGC
2 – SBET
3 – NAKA
4 – DFDV
5 – BSGM
6 – ASST
7 – TMPOQ
8 – QNCCF
9 – AIJTY
10 – VIGL
Lowest Technical Rated General Stocks Per 5/27/2025’s Close:
1 – XELA
2 – GWSO
3 – GDHG
4 – MULN
5 – FMTO
6 – SUNE
7 – NCNA
8 – STSS
9 – DGLY
10 – XHG
Highest Volume Rated General Stocks Per 5/27/2025’s Close:
1 – TWO
2 – LVWR
3 – OUT
4 – SBET
5 – ETWO
6 – WORX
7 – CETX
8 – AEON
9 – CURR
10 – NCRA
Lowest Volume Rated General Stocks Per 5/27/2025’s Close:
1 – ALPIB
2 – PSYTF
3 – JPOTF
4 – SBIG
5 – YAAS
6 – AZMTF
7 – NMTLF
8 – CNUCF
9 – HEWA
10 – DCMDF
*** THE LIST ABOVE IS STRICTLY FOR INFORMATIONAL PURPOSES – I MAY OR MAY NOT HAVE OR INITIATE A LONG, SHORT, OR LONG/SHORT POSITION IN ANY NAME ABOVE AT ANY TIME ***
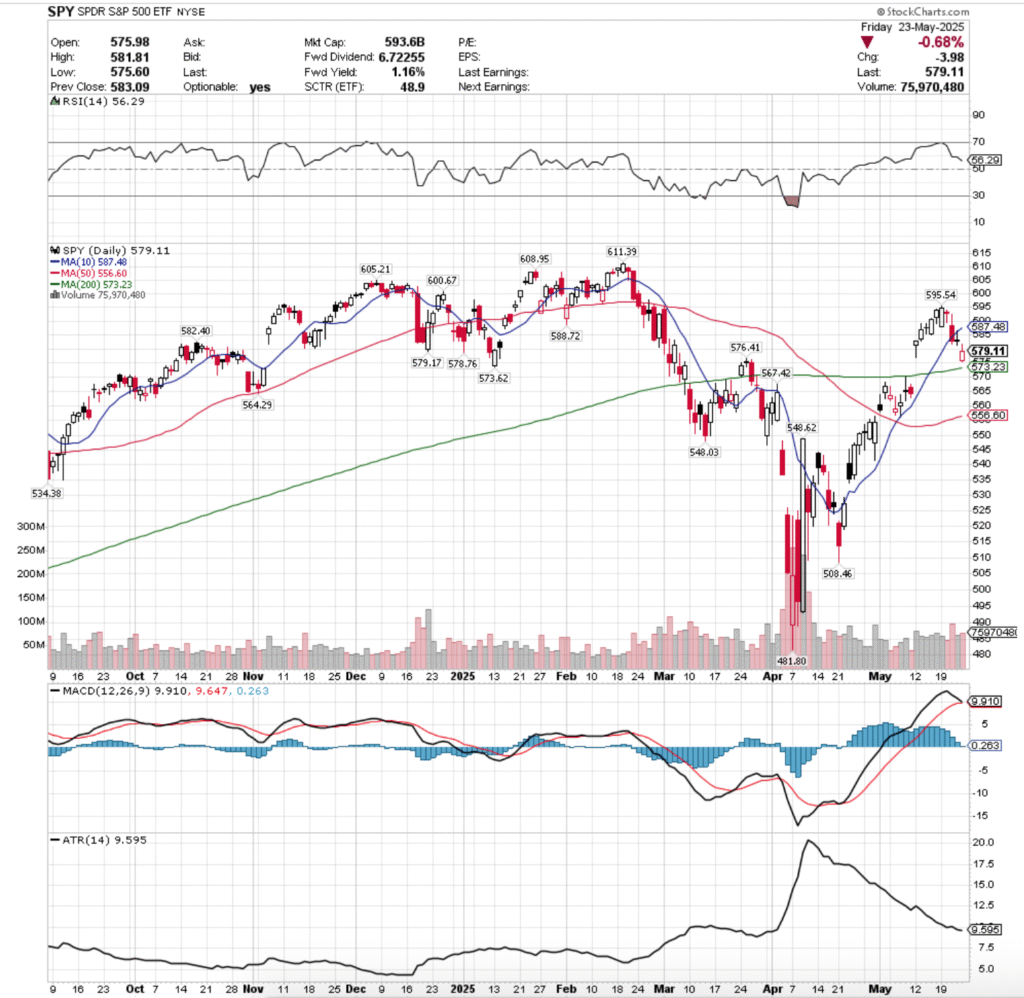
SPY, the SPDR S&P 500 ETF declined -2.54% last week, while the VIX closed the week out at 20.57, indicating an implied one day move of +/-1.3% & an implied one month move of +/-5.95%.
SPY ETF – SPDR S&P 500 ETF’s Techincal Performance Over The Past Year
Their RSI is trending down towards the neutral 50 level & sits currently at 56.29, while their MACD is set to cross over bearishly on Tuesday or Wednesday of this coming week (barring any unusual jumps in price).
Volumes were +31.36% higher than the prior year’s average levels (74,174,000 vs. 56,466,920), which certainly does not inspire near-term confidence, especially heading into a shortened holiday week.
Monday saw SPY walk up to the edge of the diving board, as the week’s second lowest volume session formed a bullish engulfing pattern with the previous Friday’s session, but SPY’s oscillators had begun to show fatigue as we noted last week.
Tuesday is when the breakdown began, as the session opened & formed a dragonfly doji that also created a bearish harami with Monday’s candle on the lowest volume of the week.
While many analysts think of the dragonfly doji as indicating that there is a spike on the horizon & maybe a reversal occuring, the low volume paired with the lower shadow’s range set the stage for more pain throughout the week, particularly given SPY’s proximity to their 10 day moving average.
Wednesday confirmed this, when SPY opened on a gap down, attempted to retrace back towards its closing price level on Tuesday, only to on the highest volume of the week see market participants head towards the exits, and SPY declined -1.69% on the day, closing down by the support of their 10 DMA.
It is worth noting that the 10 DMA temporarily broke down during the session as well, as there was quite a bit of selling pressure surrounding SPY.
Thursday saw SPY opened below the resistance of the 10 day moving average, attempt a run up at it, but it was unable to break out above it & the session closed as a gravestone doji for a gain of +0.04% for the day.
Thursday’s lower shadow also signaled that there was slightly more appetite to the downside day-over-day, which while it was a small amount, isn’t something to be ignored.
Friday showed a risk-off into the holiday weekend theme, as the week’s second highest volume session opened on a gap down, managed to briefly break above Thursday’s low price, and wound up settling higher than it opened, but for a day-over-day loss of -0.68%.
The support of the 200 day moving average was not tested, but prices were trending more in that direction than higher by the end of the week.
Heading into the new week the upside will be contingent on the strength or weakness of the 10 day moving average’s resistance.
What will make this even more interesting to watch is that the current price zone that the 10 DMA is in is historically a Buyer dominated zone, but SPY must first travel through the Seller dominated zone in the middle to earn said re-test, which may wind up showing signs of Buyer-fatigue even in the even that prices make it to that level.
SPY will still need to show strong, consistent advancing volume in order to begin to appear like a base that can be built off of is forming for a reversal.
Should the 10 DMA dip into the Seller dominated zone just above Friday’s closing price it is unlikely that there will be a successful retest of the 10 DMA this week.
The consolidation case involves oscillating between the 200 & 10 day moving averages, while staying around the window created by the gap up open from two Monday’s ago while awaiting a catalyst to the upside or the downside.
There are still some highly anticipated earnings calls this week, including the likes of NVDIA & Salesforce, a slew of Federal Reserve speakers on tap for the week & we’ll get a read on inflation based on PCE data that comes out Friday.
Without any meaningful catalyst in either direction & without some strong volume the consolidation & “wait & see” heading into next week seems the most likely.
In the event of downside action, should the 200 day moving average’s support break down then we will likely see a drop below $570/share & since there are only two support touch-points in the $560’s price range all eyes will be looking towards the 50 day moving average’s support, which will be moving higher to greet SPY’s price.
Given that this week is a short one, unless there is a major catalyst to the upside or downside it seems most likely that things will remain relatively quiet, barring any extreme news or surprises.
SPY has support at the $578.76 (Volume Sentiment: Sellers, 1.28:1), $576.41 (Volume Sentiment: Sellers, 1.28:1), $573.62 (Volume Sentiment: Buyers, 1.77:1) & $573.23/share (200 Day Moving Average, Volume Sentiment: Buyers, 1.77:1) price levels, with resistance at the $579.17 (Volume Sentiment: Sellers, 1.28:1), $582.40 (Volume Sentiment: Sellers, 2.16:1), $587.48 (10 Day Moving Average, Volume Sentiment: Buyers, 1.82:1) & $588.72/share (Volume Sentiment: Buyers, 1.82:1).
SPY ETF’s Price Level:Volume Sentiment Over The Past ~2-3 Years
QQQ, the Invesco QQQ Trust ETF dipped -2.35% last week, as the tech-heavy index managed to log the best performance of the four majors.
QQQ ETF – Invesco QQQ Trust’s Technical Performance Over The Past Year
Their RSI dropped back below overbought levels last week & is currently trending lower at 60.14, while their MACD is set to crossover bearishly either Tuesday or Wednesday of this week following last week’s declines.
Volumes were +49.63% higher than the prior year’s average levels (56,066,000 vs. 37,470,0040), which while it shows that there was certainly a degree of profit taking during a week when all major index ETF’s declined, also shows that there is still a decent degree of hopes & optimism attached to Wednesday’s earnings calls for NVDA & Salesforce.
Monday opened the week up for QQQ in a similar manner to SPY, setting the stage for price to jump off of the diving board into the rest of the week.
Tuesday opened lower, tested to below the midway point of Monday’s session before recovering to close higher than it opened, but as a hanging man candle (bearish).
Tuesday also featured the week’s lowest volume, indicating that there was not much positive sentiment behind the day’s price action, even though it did manage to close above its opening price level.
Wednesday saw a shimmer of optimism, as despite a gap down open QQQ’s price was able to rally back to touch $523/share temporarily, but intraday profits were taken quickly, forcing QQQ to retreat & close in-line with the support of their 10 day moving average.
Thursday it was clear that market participants didn’t know which way was up, but they did know that they were only willing to go so much higher up from Wednesday’s close.
The session opened nearly in-line with Wednesday’s close & the 10 day moving average, attempted to rally higher, but was thwarted not much higher than Wednesday’s open, and the support of the 10 day moving average was temporarily broken through.
Friday this carried into the weekend, when the week’s second highest session by Volume opened on a gap lower, tested but managed to stay above the $505/share level, closing the day above its open at $509.24/share.
QQQ is in a similar boat to SPY (as they’ve been relatively similar for years), any upside movement is going to require some stable, strong advancing volume & some form of an upside catalyst, at which point all eyes will be on the 10 day moving average.
Without those conditions, at best any upside move will result in oscillations around the 10 day moving average while awaiting something to move the market.
The consolidation case features oscillations in between the 10 & 200 day moving averages while awaiting news to propel QQQ higher or to break down the 200 day moving average’s support.
In the event of a move lower, the $496-499.99/share price level is Seller dominated over the past year, which would walk prices up with some momentum behind them to retest that 200 DMA.
The window formed at the end of April/early May would then become of interest, as it was never fully closed.
It would also then see the 50 day moving average’s support be tested, which is interesting given that said gap up occurred last time that QQQ’s price tested the 50 DMA.
The table below will be handy for navigating these re-tests.
QQQ has support at the $507.71 (Volume Sentiment: Buyers, 1.25:1), $504.96 (Volume Sentiment: Buyers, 1.68:1), $498.96 (Volume Sentiment: Sellers, 1.4:1) & $493.62/share (Volume Sentiment: Buyers, 2.68:1) price levels, with resistance at the $510.29 (Volume Sentiment: Sellers, 2.75:1), $513.98 (Volume Sentiment: Sellers, 2.75:1), $516.14 (10 Day Moving Average, Volume Sentiment: Buyers, 1.44:1) & $523/share (Volume Sentiment: Buyers, 1.47:1).
QQQ ETF’s Price Level:Volume Sentiment Over The Past ~1 Year
IWM, the iShares Russell 2000 ETF fell -3.47% last week, as market participants shunned the small cap index in favor of the other four major indexes.
IWM ETF – iShares Russell 2000 ETF’s Techincal Performance Over The Past Year
Their RSI has flattened out just above the neutral 50 level & is currently at 52.21, while their MACD just crossed over bearishly late last week.
Volumes were -2.8% lower than the prior year’s average level (29,110,000 vs. 29,949,360), which indicates that there is certainly a bit of negative sentiment attached to the small cap index currently amidst market volatility.
Small cap names are not going to have an easy time recovering in the event that weakness is shown by SPY, QQQ or DIA in the next week or two, given how much uncertainty market participants are showing around those larger, more household names.
Monday the small cap index opened on a gap down, but managed to rally back to close above its open, but the session occurred on very weak volume.
Tuesday the uncertainty continued, when prices closed as a spinning top candle, indicating indecision on the weakest volume of the week (which only added to said sense of uncertainty).
Wednesday is when the damn gave way, opening on a gap down in-line with the 10 day moving average, briefly testing higher, but ultimately sliding back beneath the resistance of the 10 day moving average & declining -2.81% for the day.
Given the week’s highest volume occurred Wednesday, this should be taken as a sign of “everybody out of the pool” & that there is slipping levels of confidence in IWM.
The rest of the week IWM moved almost as though it was on stairs, opening Thursday on a gap down & closing the day as a spinning top, which indicates that there was indecision in the air, and lots of it given it occurred on the week’s second strongest volume.
This is especially true given the nature in how much profit taking (and loss cutting) was taking place intra-day when you look at the price levels that IWM was circling around all day.
Friday the week wound down on another gap down open to $199.78, but prices managed to find footing heading into the holiday weekend & closed at $202.56/share.
Heading into the fresh, shortened holiday week IWM has less upside potential of the index ETF’s listed so far, mostly as they have little to do with the major earnings calls of the week & the general uneasiness of market participants is not very telling of the strength of the small cap index.
However, in the event that a rising tide comes along to lift all boats, the 10 day moving average will be an interesting test for IWM, as even if they manage to break above it, they’ve got a Seller dominated zone right above it that seperates them from the long-term trend line.
IWM’s consolidation case revolves around price oscillating between the 10 & 50 day moving averages for the rest of the week, awaiting a nudge to the upside or downside.
The downside case involves a test of the 50 day moving average’s support, which is in a Buyer dominated price zone that falls just below a Seller zone.
If this does happen, all eyes should go to the windows that were created by gap up sessions on the bookends of April 2025, as those levels will likely be retested to formally close the window.
The table below is useful for assessing the strength/weakness of IWM’s support/resistance levels if they are approached again for re-tests.
IWM has support at the $202.46 (Volume Sentiment: Buyers, 1.23:1), $197.50 (50 Day Moving Average, Volume Sentiment: Buyers, 2.17:1), $196.56 (Volume Sentiment: Buyers, 2.17:1) & $192.11/share (Volume Sentiment: Buyers, 1.15:1) price levels, with resistance at the $206.83 (10 Day Moving Average, Volume Sentiment: Buyers, 1.16:1), $209.27 (Volume Sentiment: Buyers, 1.52:1), $210.13 Volume Sentiment: Buyers, 1.52:1) & $213.49/share (2 Touch-Points, Volume Sentiment: Sellers, 1.33:1).
IWM ETF’s Price Level:Volume Sentiment Over The Past ~2-3 Years
DIA, the SPDR Dow Jones Industrial Average ETF lost -2.4% last week, as the blue chip index managed to continue to be a fan favorite among market participants & the “buy & hold” remained alive and well to a degree.
DIA ETF – SPDR Dow Jones Industrial Average ETF’s Techincal Performance Over The Past Year
Their RSI is trending back down towards the neutral 50-level, sitting currently at 51.65, while their MACD is primed to cross over bearishly on Tuesday or Wednesday of this week.
Volumes were -9.06% lower than the previous year’s average though (2,894,000 vs. 3,182,400), showing that the “Buy & Hold” crowd is beginning to reassess their holdings & may be taking some profits down from the table.
Monday the week opened on a strong note for DIA, as it bravely walked up to the top of the diving board, ready to descend into the week.
Tuesday formed a bearish harami pattern with Monday’s candle and the day’s low signaled that the <$425/share level was on the menu in the coming days.
Wednesday the legs gave out for DIA, opening with a gap down that was able to below through the support of the 10 & 200 day moving averages & close -1.93% on the day on the highest volume of the week.
Thursday confirmed what the majority said with their sell buttons the previous day, when DIA was unable to break above the 200 DMA’s resistance & wound up resulting in a spinning top, indicating that there was a bit of indecision in the market, but that it should not be mistaken for optimism.
Friday showed another gap down open, but was able to rally higher & close at $416.33/share heading into the weekend.
For DIA this week, the upside will require a breakthrough of the 10 & 200 day moving averages, which may prove difficult given that both reside in Seller dominated price levels.
In the event of consolidation while awaiting positive or negative news to dictate market direction, DIA is primed to oscillate between the 10/200 & 50 day moving averages while it closes the window that it created back earlier in May.
To the downside, in the event that the 50 DMA’s support breaks down, there is looking to be a bit of trouble for DIA, as that would leave only 5 support levels on their past year chart (one of which will be knocked off of it on next Monday’s session).
DIA has support at the $412.91 (Volume Sentiment: Sellers, 2.43:1), $409.97 (50 Day Moving Average, Volume Sentiment: Buyers, 5.5:1), $407.28 (Volume Sentiment: Buyers, 3.17:1) & $405.96/share (Volume Sentiment: Buyers, 3.17:1) price levels, with resistance at the $ 416.41(Volume Sentiment: Buyers, 1.7:1), $419.60 (Volume Sentiment: Buyers, 1.7:1), $421.12 (200 Day Moving Average, Volume Sentiment: Sellers, 1.5:1) & $422.39/share (10 Day Moving Average, Volume Sentiment: Sellers, 1.5:1).
DIA ETF’s Price Level:Volume Seniment Over The Past ~4-5 Years
The Week Ahead
Monday has no economic news or earnings reports as it is Memorial Day.
Fed President Kashkari speaks in Tokyo at 4 am on Tuesday, before Durable-Goods Orders & Du rable-Goods minus Transportation data at 8:30 am, S&P CoreLogic Case Shiller Home Price Index (20 cities) data at 9 am, Consumer Confidence data at 10 am & FEd President Williams speaking at 8 pm.
AutoZone, Bank of Nova Scotia & Skyline Champion all report earnings before Tuesday’s opening bell, followed by Box, Okta, Semtech & Sociedad Quimica y Minera after the session’s close.
Wednesday begins with Fed President Kashkari speaking at 4 am again, followed by May’s FOMC Minutes at 2 pm.
Abercrombie & Fitch, Bank of Montreal, Capri Holdings, Columbus McKinnon, Dick’s Sporting Goods, Kingsoft Cloud, Macy’s, Monro Muffler, Photronics & Phressia all report earnings before Wednesday’s session’s opening bell, before NVDIA, SalesForce, Agilent Technologies, C3.ai, e.l.f. Beauty, HP Inc., nCino, Nordson, Nutanix, Pure Storage, SentinelOne, Synopsys & Veeva Systems are due to report after the closing bell.
Initial Jobless Claims, GDP (First Revision) & Fed President Barkin speak at 8:30 am on Thursday, before Pending Home Sales at 10 am, Fed President Goolsbee speaking at 10:40 pm, Fed President Kugler Speaking at 2pm, Fed President Daly speaking at 4pm & Fed President Logan speaking at 8:25 pm.
Thursday morning’s earnings reports include American Woodmark, ATS Corp., Bath & Body Works, Best Buy, Burlington Stores, Caleres, CIBC, Foot Locker, Hamilton Lane, Hormel Foods, Kohl’s, Li Auto, Roivant Sciences, Royal Bank of Canada & SpartanNash, before Costco Wholesale, Ambarella, American Eagle, Cooper, Dell Technologies, Elastic, Gap, Marvell Technology, NetApp, PagerDuty, UiPath, Ulta Beauty & Zscaler all report following the closing bell.
Friday morning is a busy one, with Personal Income, Consumer Spending, PCE Index, PCE Year-over-Year, Core PCE Index, Core PCE YEar-over-Year, Advanced U.S. Trade Balance in Goods, Advanced Retail Inventories & Advanced Wholesale Inventories data at 8:30 am, followed by Chicago Business Barometer (PMI) data at 9:45 am, Consumer Sentiment (final) data at 10 am & Fed President Daly speaking at 4:45pm.
Shoe Carnival reports earnings after Friday afternoon’s closing bell.
See you back here next week!
*** I DO NOT OWN SHARES OR OPTIONS CONTRACT POSITIONS IN SPY, QQQ, IWM OR DIA AT THE TIME OF PUBLISHINGTHIS ARTICLE ***
The VIX closed at 20.28, indicating an implied one day move of +/-1.28% & an implied one month move of +/-5.86% for the S&P 500.
Highest Technical Rated S&P 500 Components Per 5/22/2025’s Close:
1 – NRG
2 – PLTR
3 – GEV
4 – HWM
5 – AXON
6 – COIN
7 – NFLX
8 – MOS
9 – RL
10 – PODD
Lowest Technical Rated S&P 500 Components Per 5/22/2025’s Close:
1 – ENPH
2 – UNH
3 – AES
4 – ARE
5 – MRNA
6 – IQV
7 – DOW
8 – TECH
9 – ALB
10 – BLDR
Highest Volume Rated S&P 500 Components Per 5/22/2025’s Close:
1 – ENPH
2 – WSM
3 – NEE
4 – FICO
5 – LHX
6 – AES
7 – DECK
8 – ADI
9 – TTWO
10 – WDAY
Lowest Volume Rated S&P 500 Components Per 5/22/2025’s Close:
1 – NFLX
2 – BA
3 – DXCM
4 – WBA
5 – CAH
6 – IP
7 – BLK
8 – SMCI
9 – AVY
10 – NOW
Highest Technical Rated ETFs Per 5/22/2025’s Close:
1 – BTCL
2 – BITU
3 – BITX
4 – BTFX
5 – TESL
6 – CRPT
7 – MAXI
8 – ROBN
9 – BRRR
10 – BTC
Lowest Technical Rated ETFs Per 5/22/2025’s Close:
1 – TSLZ
2 – ETHD
3 – TSLQ
4 – TSDD
5 – BTCZ
6 – SBIT
7 – FIAT
8 – NVD
9 – SOXS
10 – HZEN
Highest Volume Rated ETFs Per 5/22/2025’s Close:
1 – EAFG
2 – FLDZ
3 – JHCR
4 – CCNR
5 – KCSH
6 – SHPP
7 – AUGP
8 – TSEP
9 – RORO
10 – IBHK
Lowest Volume Rated ETFs Per 5/22/2025’s Close:
1 – FLAO
2 – ACLO
3 – AAPR
4 – CGUI
5 – EFZ
6 – AGRH
7 – TOTR
8 – SFEB
9 – SDFI
10 – AUGM
Highest Technical Rated General Stocks Per 5/22/2025’s Close:
1 – DFDV
2 – KDLY
3 – RGC
4 – ASST
5 – TMPOQ
6 – BSGM
7 – VIGL
8 – AIJTY
9 – AREN
10 – QBTS
Lowest Technical Rated General Stocks Per 5/22/2025’s Close:
1 – DGLY
2 – MULN
3 – FMTO
4 – SUNE
5 – NCNA
6 – YHC
7 – WHLR
8 – XHG
9 – REE
10 – HTCO
Highest Volume Rated General Stocks Per 5/22/2025’s Close:
1 – SLG
2 – OUT
3 – VIGL
4 – BDRX
5 – XAGE
6 – SGBX
7 – IMNM
8 – IMMX
9 – NVTS
10 – BON
Lowest Volume Rated General Stocks Per 5/22/2025’s Close:
1 – AHOTF
2 – CAPC
3 – AKTSQ
4 – RDEXF
5 – PAANF
6 – FDVA
7 – FNRN
8 – IDXG
9 – ARESF
10 – CCM
*** THE LIST ABOVE IS STRICTLY FOR INFORMATIONAL PURPOSES – I MAY OR MAY NOT HAVE OR INITIATE A LONG, SHORT, OR LONG/SHORT POSITION IN ANY NAME ABOVE AT ANY TIME ***
The VIX closed at 20.87, indicating an implied one day move of +/-1.32% & an implied one month move of +/-6.03% for the S&P 500.
Highest Technical Rated S&P 500 Components Per 5/21/2025’s Close:
1 – NRG
2 – PLTR
3 – GEV
4 – AXON
5 – HWM
6 – MOS
7 – NFLX
8 – PODD
9 – RL
10 – COIN
Lowest Technical Rated S&P 500 Components Per 5/21/2025’s Close:
1 – UNH
2 – MRNA
3 – ENPH
4 – ARE
5 – IQV
6 – ALB
7 – TECH
8 – BLDR
9 – DOW
10 – AES
Highest Volume Rated S&P 500 Components Per 5/21/2025’s Close:
1 – FICO
2 – PANW
3 – TGT
4 – UNH
5 – TTWO
6 – AES
7 – KEYS
8 – SOLV
9 – EFX
10 – TJX
Lowest Volume Rated S&P 500 Components Per 5/21/2025’s Close:
1 – CRL
2 – APD
3 – WST
4 – MHK
5 – COR
6 – BKNG
7 – MOH
8 – CPT
9 – HES
10 – TKO
Highest Technical Rated ETFs Per 5/21/2025’s Close:
1 – CRPT
2 – TESL
3 – BTCL
4 – BITU
5 – BTFX
6 – BITX
7 – MAXI
8 – MEXX
9 – BLOK
10 – ROBN
Lowest Technical Rated ETFs Per 5/21/2025’s Close:
1 – TSLZ
2 – TSLQ
3 – TSDD
4 – ETHD
5 – MSOX
6 – BTCZ
7 – SBIT
8 – HZEN
9 – FIAT
10 – SOXS
Highest Volume Rated ETFs Per 5/21/2025’s Close:
1 – VMAX
2 – HQGO
3 – MUSE
4 – AUGP
5 – JHCR
6 – BMDL
7 – LOCT
8 – OCTU
9 – SPUC
10 – HAPY
Lowest Volume Rated ETFs Per 5/21/2025’s Close:
1 – VYM
2 – WTPI
3 – XLE
4 – XAR
5 – XDTE
6 – XBI
7 – WEBL
8 – CVRD
9 – QMNV
10 – PSCJ
Highest Technical Rated General Stocks Per 5/21/2025’s Close:
1 – KDLY
2 – RGC
3 – ASST
4 – SRNE
5 – AREN
6 – FRCB
7 – SVT
8 – ONXGF
9 – BSGM
10 – RGLS
Lowest Technical Rated General Stocks Per 5/21/2025’s Close:
1 – XELA
2 – PTPI
3 – NCNA
4 – MULN
5 – FMTO
6 – SUNE
7 – CURR
8 – WLGS
9 – CYCC
10 – RSLS
Highest Volume Rated General Stocks Per 5/21/2025’s Close:
1 – DEA
2 – SGMA
3 – LTRY
4 – WOK
5 – BDSX
6 – BOLT
7 – APVO
8 – AKYA
9 – CFSB
10 – EDBL
Lowest Volume Rated General Stocks Per 5/21/2025’s Close:
1 – WYY
2 – WWR
3 – CAPC
4 – RDEXF
5 – ASPU
6 – CHXMF
7 – LBRMF
8 – DXYN
9 – ANKOF
10 – NCRA
*** THE LIST ABOVE IS STRICTLY FOR INFORMATIONAL PURPOSES – I MAY OR MAY NOT HAVE OR INITIATE A LONG, SHORT, OR LONG/SHORT POSITION IN ANY NAME ABOVE AT ANY TIME ***