Since our last Volume Sentiment Analysis at the beginning of April the major four indexes have advanced, but there has still been plenty of volatility & a good amount of gap activity.
Last night the VIX closed at 18.09, indicating an implied one day move of +/-1.14% & an implied one month move of +/-5.23% for the S&P 500.
Volumes have been more elevated than they had been for much of the past year, however as we’ve noted many times over the past year, volumes Y-o-Y between 2025-2024 are still below the prior year’s average levels from 2023 & earlier.
While some may take this as a sign of confidence, given the market’s actual price movements it appears more like uncertainty & profit grabbing than any actual change in long-term sentiment.
With that said, there is still a lot of uncertainty in the air regarding tariffs & foreign relations, as well as with the future state of corporate earnings, which makes it an important time to have an understanding of how market participants have behaved historically at different price levels as we begin to see re-tests.
This is especially true in the wake of this week’s performance, where stretched out MACDs have begun to show weakness & that there is likely a breather on the horizon for markets, which will make the strength/weakness of support/resistance levels even more important.
This can be valuable when assessing risk in the event of retests of any of these levels.
Each section below contains a view of each index ETF’s chart (for a technical breakdown of each ETF’s chart please see this past weekend’s market review note), as well as a list of their current one year support & resistance levels with the volume sentiment noted beneath it on the table.
There is an additional table beneath this table with each price level’s sentiment, as well as a typed text version below that is able to be copied & pasted.
Note that “NULL, 0:0*” values denote areas that each name has traded at but with limited volume data to work with from a comparison standpoint in terms of creating a ratio of buyers:sellers (or vice versa) or is the outlier above the highest/lowest level with price data.
Also, prices that do have a ratio of Buyers:Sellers (Sellers:Buyers) where the denominator is 0 are denoted with an asterisk “*” as well.
In the written lists of the price levels & volume sentiments the price levels that contain support & resistance levels are marked in BOLD.
Recall that at price extremes such as the highs that we have recently hit there will tend to be skewed data due to the small sample size & factor that into how you interpret each price level’s reported sentiment.
This is intended to serve as an additional tool, similar to a barometer to use during your due diligence process & is not meant to replace doing your own research & is not financial advice.
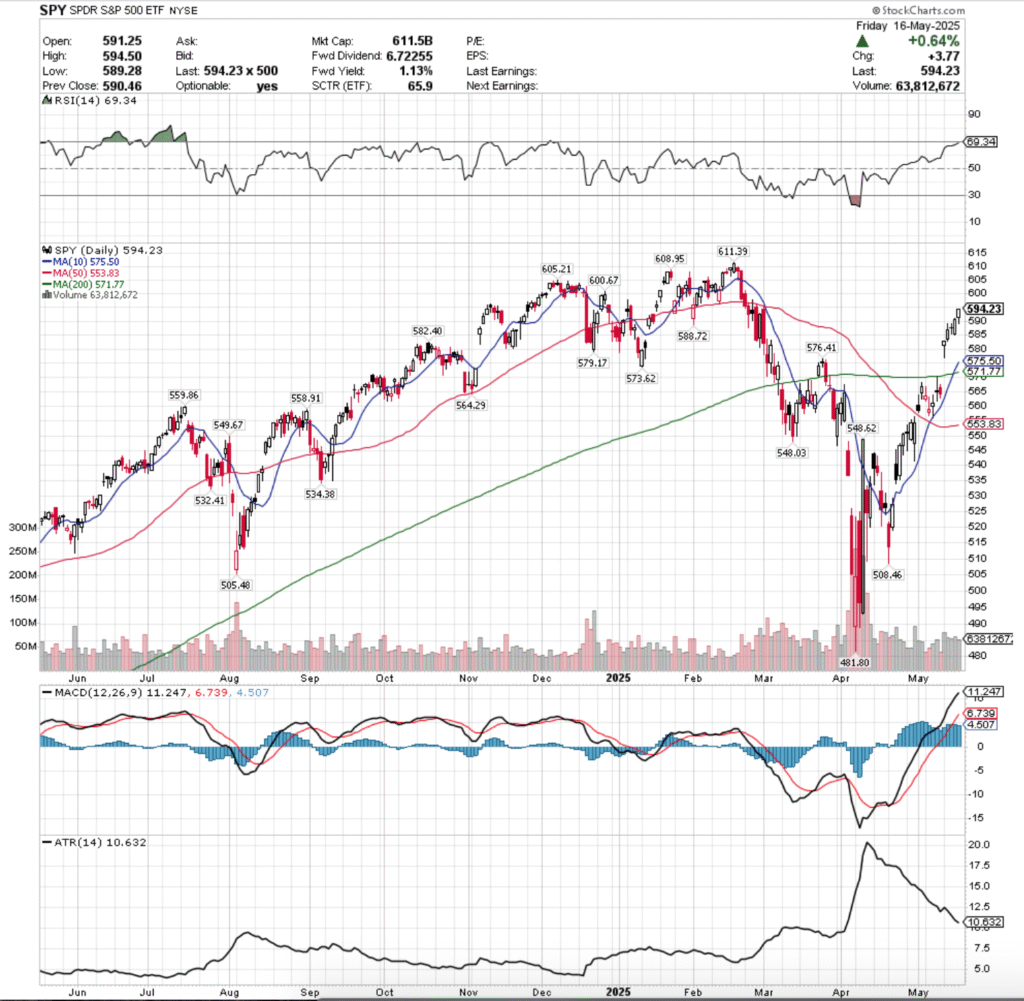
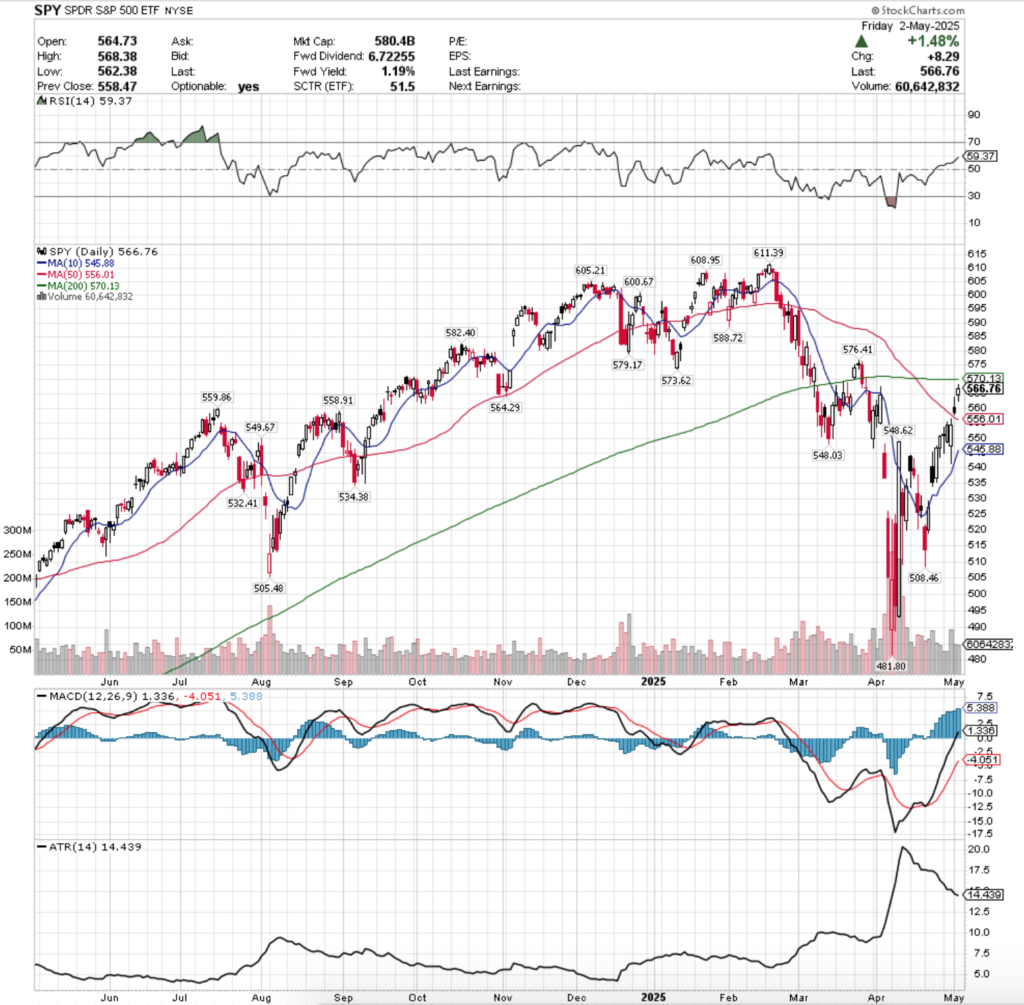
Price Level:Volume Sentiment Analysis For SPY, The SPDR S&P 500 ETF
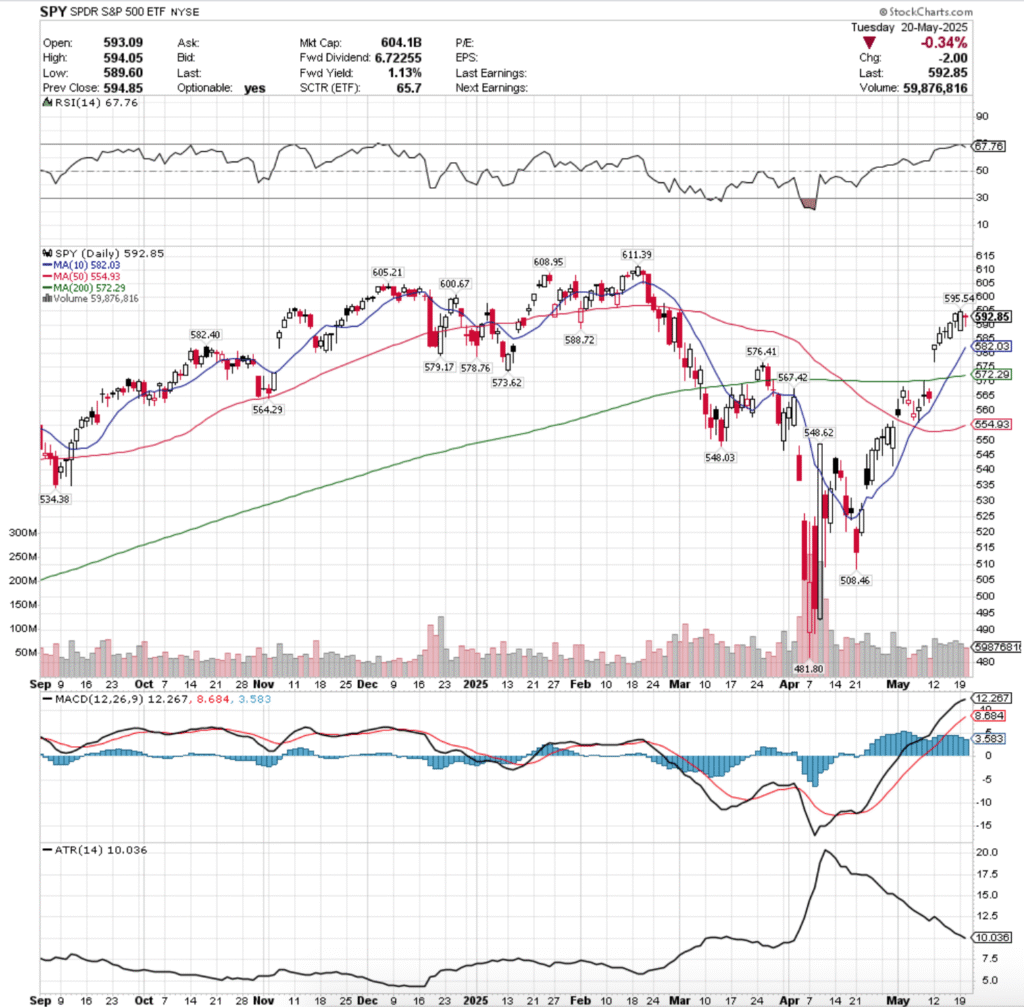
SPY, the SPDR S&P 500 ETF has shaken off the declines of late March, but based on the number & size of gaps & the proximity of SPY’s long & short-term trend lines to one another & price, we may see some profit taking on the near-term horizon.
While SPY’s recent gains have placed it back within 5 resistance levels of its all-time high, its oscillators above are signaling there is likely to be a cool-down period soon.
This will be interesting, as five of the next 6 support levels are historically Seller zones, and the window left open by last Monday’s gap up is primed to close, which will also involve a re-test of the long-term moving average.
For a deeper dive into the near-term horizon for SPY see the market review in the link in the section above.
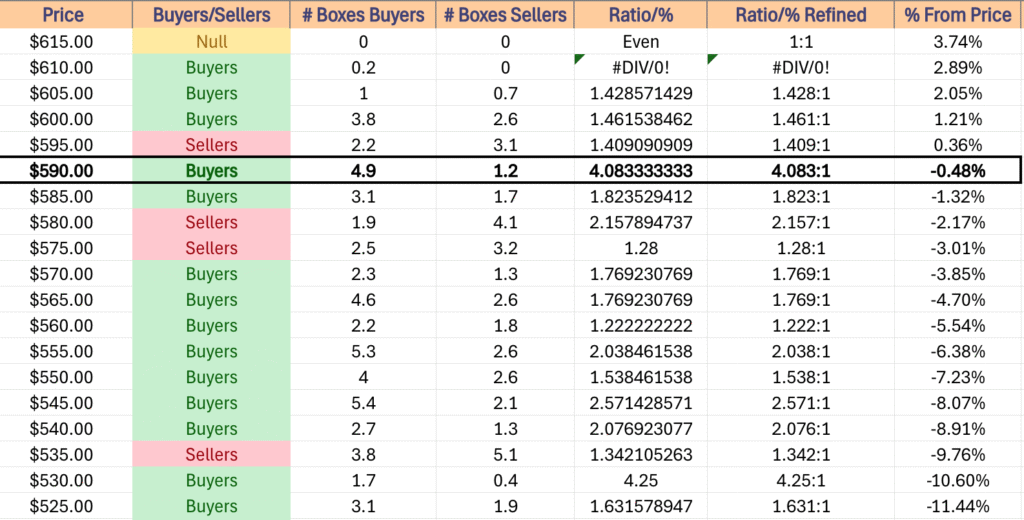
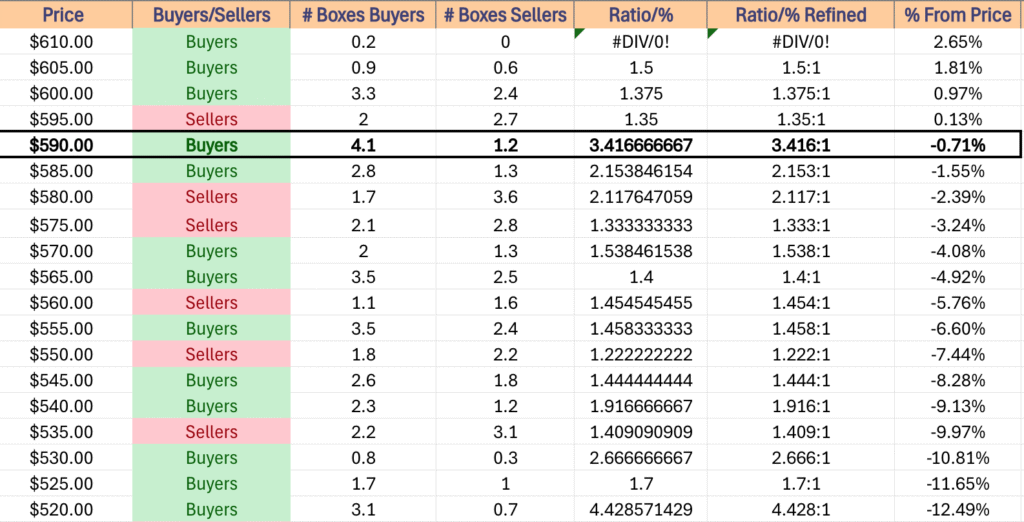
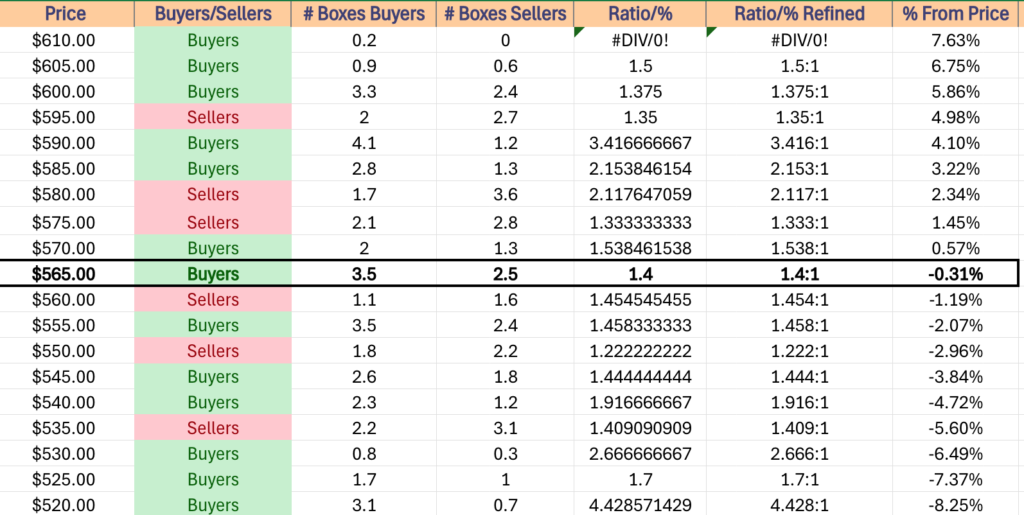
$610 – Buyers – 0.2:0*, +2.89% From Current Price Level
$615 – NULL – 0:0*, +3.74% From Current Price Level
$605 – Buyers – 1.43:1, +2.05% From Current Price Level
$600 – Buyers – 1.46:1, +1.21% From Current Price Level
$595 – Sellers – 1.41, +0.36% From Current Price Level
$590 – Buyers – 4.08:1, -0.48% From Current Price Level – Current Price Level*
$585 – Buyers – 1.82:1, -1.32% From Current Price Level
$580 – Sellers – 2.16:1, -2.17% From Current Price Level – 10 Day Moving Average*
$575 – Sellers – 1.28:1, -3.01% From Current Price Level
$570 – Buyers – 1.77:1, -3.85% From Current Price Level – 200 Day Moving Average*
$565 – Buyers – 1.77:1, -4.7% From Current Price Level
$560 – Buyers – 1.22:1, -5.54% From Current Price Level
$555 – Buyers – 2.08:1, -6.38% From Current Price Level
$550 – Buyers – 1.54:1, -7.23% From Current Price Level – 50 Day Moving Average*
$545 – Buyers – 2.57:1, -8.07% From Current Price Level
$540 – Buyers – 2.08:1, -8.91% From Current Price Level
$535 – Sellers – 1.34:1, -9.76% From Current Price Level
$530 – Buyers – 4.25:1, -10.6% From Current Price Level
$525 – Buyers – 1.63:1, -11.44% From Current Price Level
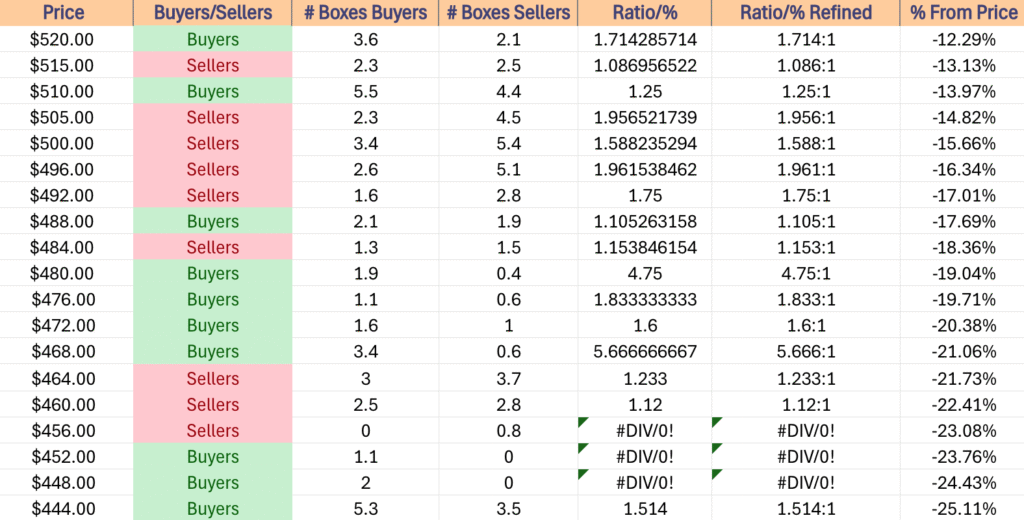
$520 – Buyers – 1.71:1, -12.29% From Current Price Level
$515 – Sellers – 1.09:1, -13.13% From Current Price Level
$510 – Buyers – 1.25:1, -13.97% From Current Price Level
$505 – Sellers – 1.96:1, -14.82% From Current Price Level
$500 – Sellers – 1.59:1, -15.66% From Current Price Level
$496 – Sellers – 1.96:1, -16.34% From Current Price Level
$492 – Sellers – 1.75:1, -17.01% From Current Price Level
$488 – Buyers – 1.11:1, -17.69% From Current Price Level
$484 – Sellers – 1.15:1, -18.36% From Current Price Level
$480 – Buyers – 4.75:1, -19.04% From Current Price Level
$476 – Buyers – 1.83:1, -19.71% From Current Price Level
$472 – Buyers, 1.6:1, -20.38% From Current Price Level
$468 – Buyers – 5.67:1, -21.06% From Current Price Level
$464 – Sellers – 1.23:1, -21.73% From Current Price Level
$460 – Sellers – 1.12:1, -22.41% From Current Price Level
$456 – Sellers – 0.8:0*, -23.08% From Current Price Level
$452 – Buyers – 1.1:0*, -23.76% From Current Price Level
$448 – Buyers – 2:0*, -24.43% From Current Price Level
$444 – Buyers – 1.51:1, -25.11% From Current Price Level
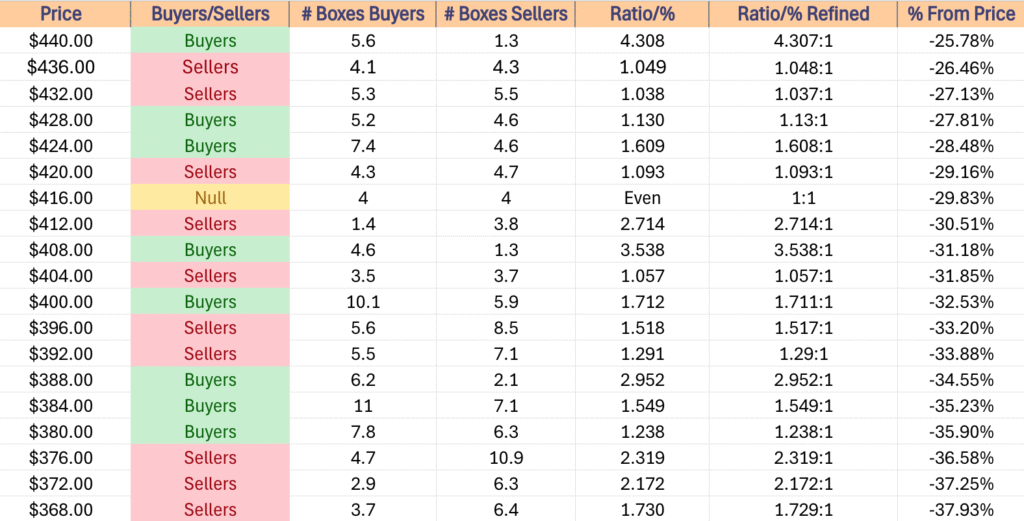
$440 – Buyers – 4.31:1, -25.78% From Current Price Level
$436 – Sellers – 1.05:1, -26.46% From Current Price Level
$432 – Sellers -1.04:1, -27.13% From Current Price Level
$428 – Buyers – 1.13:1, -27.81% From Current Price Level
$424 – Buyers – 1.61:1, -28.48% From Current Price Level
$420 – Sellers – 1.09:1, -29.16% From Current Price Level
$416 – Even – 1:1, -29.83% From Current Price Level
$412 -Sellers – 2.71:1, -30.51% From Current Price Level
$408 – Buyers – 3.54:1, -31.18% From Current Price Level
$404 – Sellers – 1.06:1, -31.85% From Current Price Level
$400 – Buyers – 1.71:1, -32.53% From Current Price Level
$396 – Sellers – 1.52:1, -33.2% From Current Price Level
$392 – Sellers – 1.29:1, -33.88% From Current Price Level
$388 – Buyers – 2.95:1, -34.55% From Current Price Level
$384 – Buyers – 1.55:1, -35.23% From Current Price Level
$380 – Buyers – 1.24:1, -35.9% From Current Price Level
$376 – Sellers – 2.32:1, -36.58% From Current Price Level
$372 – Sellers – 2.17:1, -37.25% From Current Price Level
$368 – Sellers – 1.73:1, -37.93% From Current Price Level
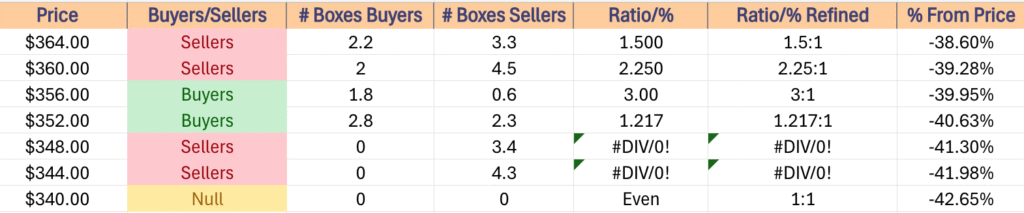
$364 – Sellers – 1.5:1, -38.6% From Current Price Level
$360 – Sellers – 2.25:1, -39.28% From Current Price Level
$356 – Buyers – 3:1, -39.95% From Current Price Level
$352 – Buyers – 1.22:1, -40.63% From Current Price Level
$348 – Sellers – 3.4:0*, -41.3% From Current Price Level
$344 – Sellers – 4.3:0*, -41.98% From Current Price Level
$340 – NULL – 0:0*, -42.65% From Current Price Level
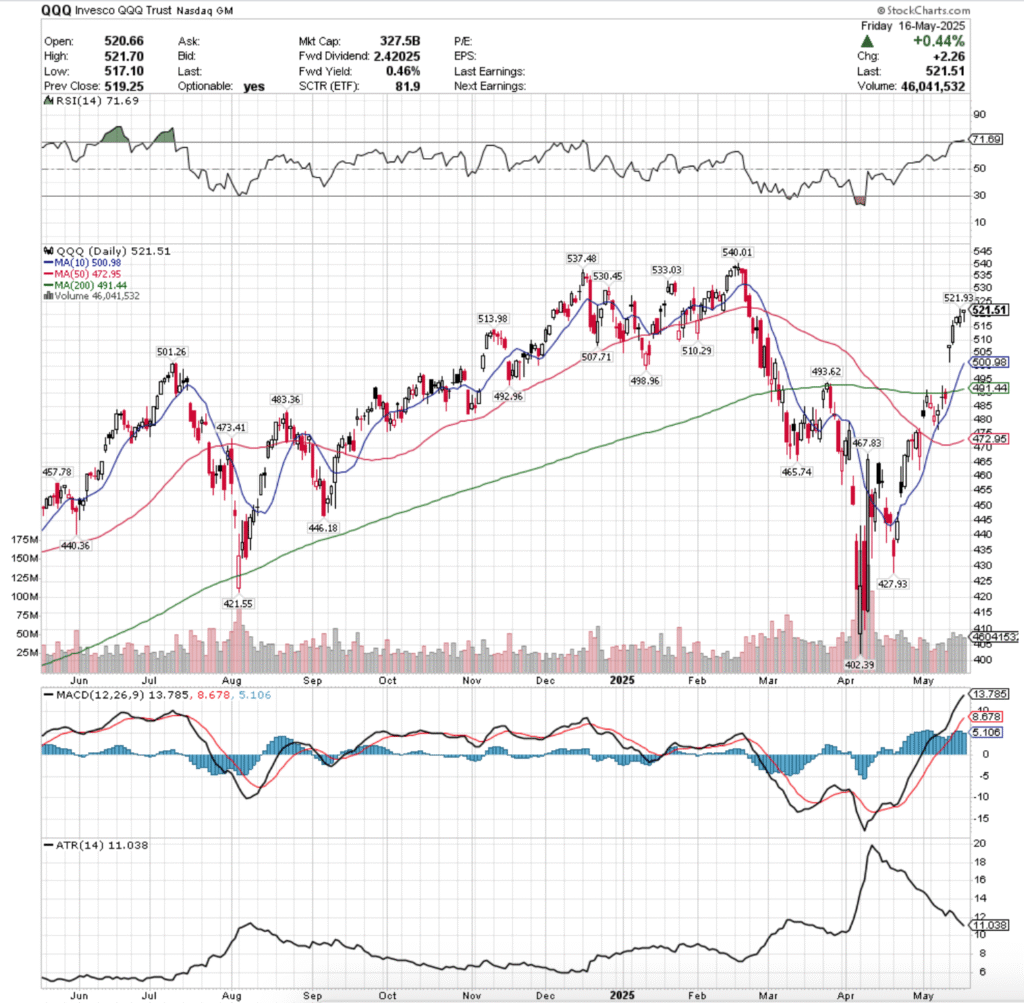
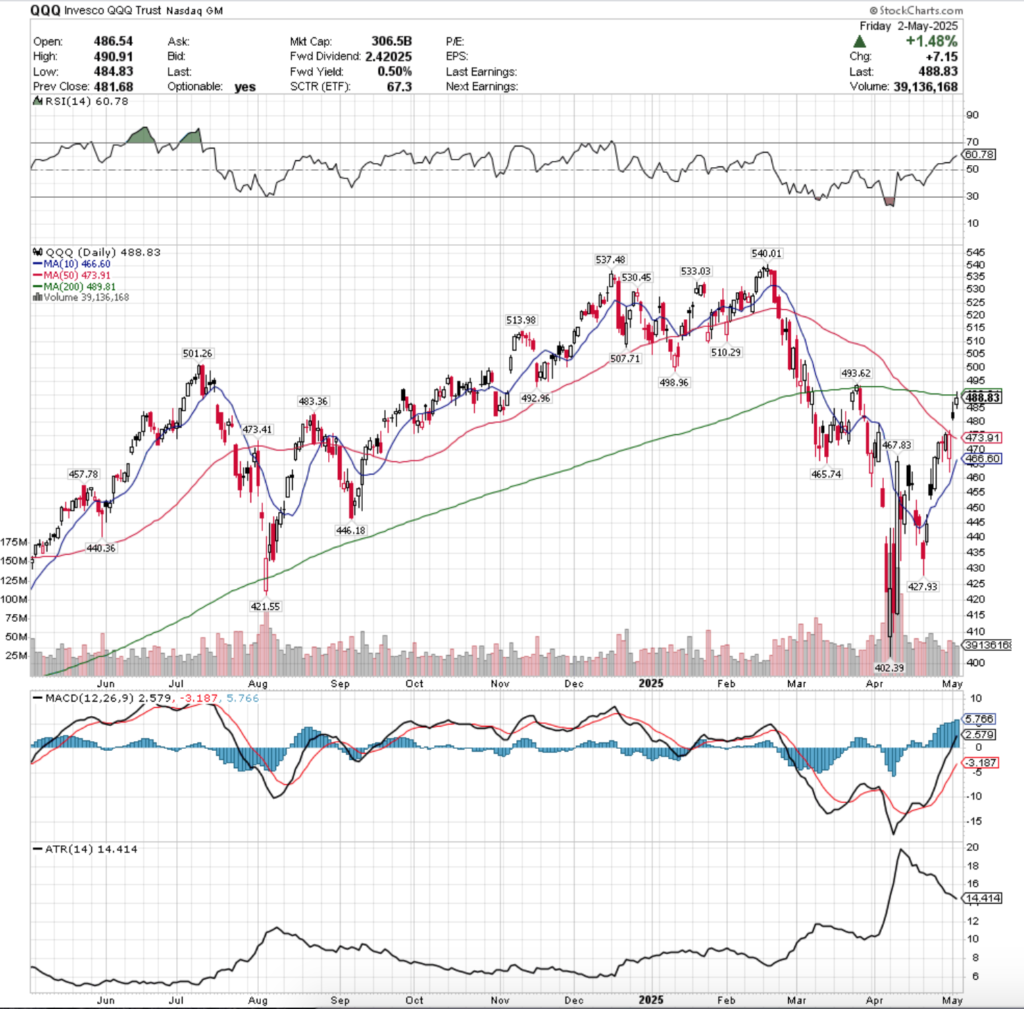
Price Level:Volume Sentiment Analysis For QQQ, The Invesco QQQ Trust ETF
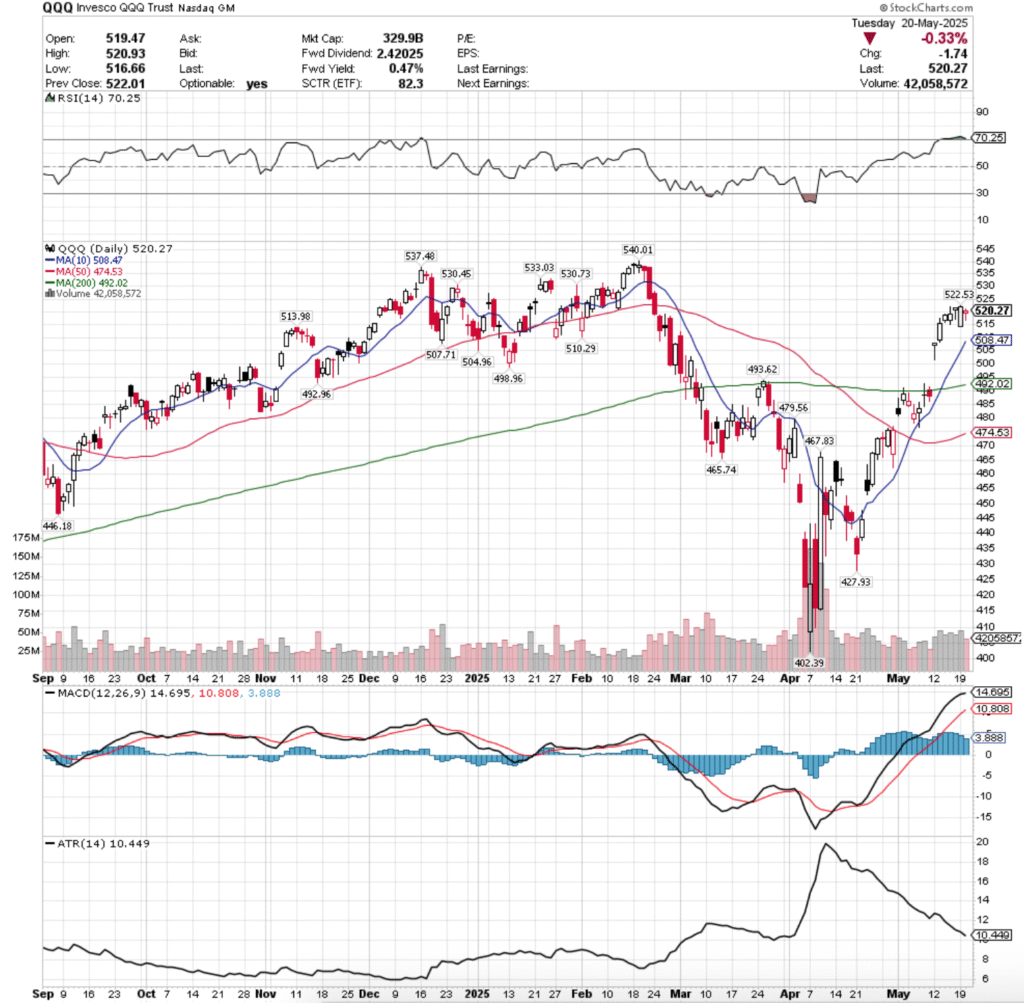
QQQ, the Invesco QQQ Trust ETF has had a similar past month & a half to SPY, as the two indexes have moved together for the past few years for the most part.
Their volume trends have also had some similarities, with neither at the moment appearing to be ready for a convincing lift-off that has sustainable support.
With that said, the data below when combined with the near-term outlook in this week’s market review note in the link in section one can be beneficial to identify where QQQ & its component stocks wind up heading next.
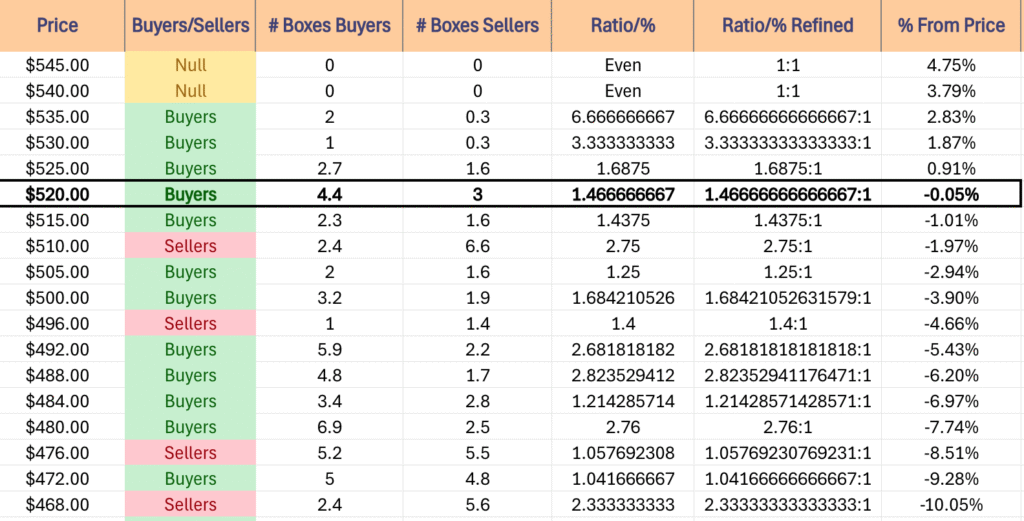
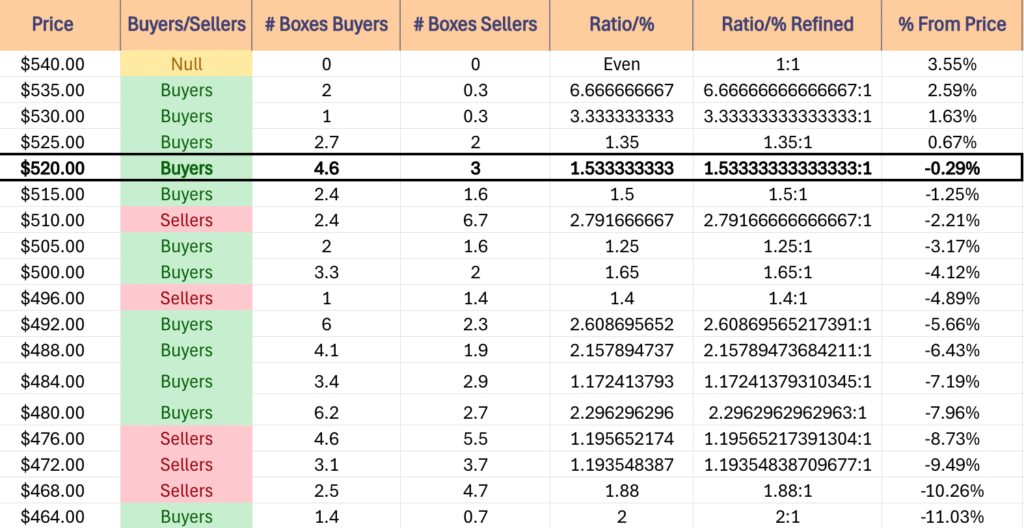
$545 – NULL – 0:0*, +4.75% From Current Price Level
$540 – NULL – 0:0*, +3.79% From Current Price Level
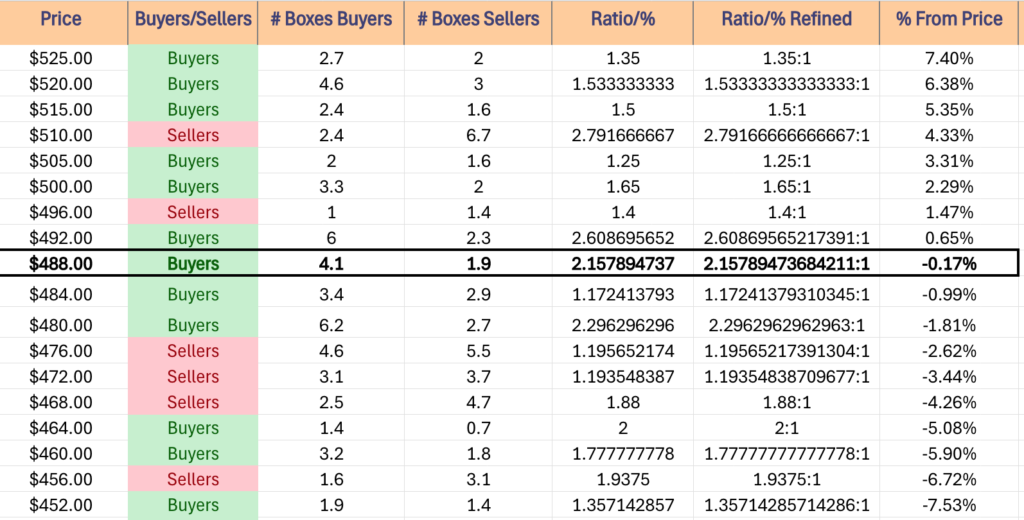
$535 – Buyer s- 6.67:1, +2.83% From Current Price Level
$530 – Buyers – 3.33:1, +1.87% From Current Price Level
$525 – Buyers – 1.69:1, +0.91% From Current Price Level
$520 – Buyers – 1.47:1, -0.05% From Current Price Level – Current Price Level*
$515 – Buyers – 1.44:1, -1.01% From Current Price Level
$510 – Sellers – 2.75:1, -1.97% From Current Price Level
$505 – Buyers – 1.25:1, -2.94% From Current Price Level – 10 Day Moving Average*
$500 – Buyers – 1.68:1, -3.9% From Current Price Level
$496 – Sellers – 1.4:1, -4.66% From Current Price Level
$492 – Buyers – 2.68:1, -5.43% From Current Price Level – 200 Day Moving Average*
$488 – Buyers – 2.82:1, -6.2% From Current Price Level
$484 – Buyers – 1.21:1, -6.97% From Current Price Level
$480 – Buyers – 2.76:1, -7.74% From Current Price Level
$476 – Sellers – 1.06:1, -8.51% From Current Price Level
$472 – Buyers- 1.04:1, -9.28% From Current Price Level – 50 Day Moving Average*
$468 – Sellers – 2.33:1, – 10.05% From Current Price Level
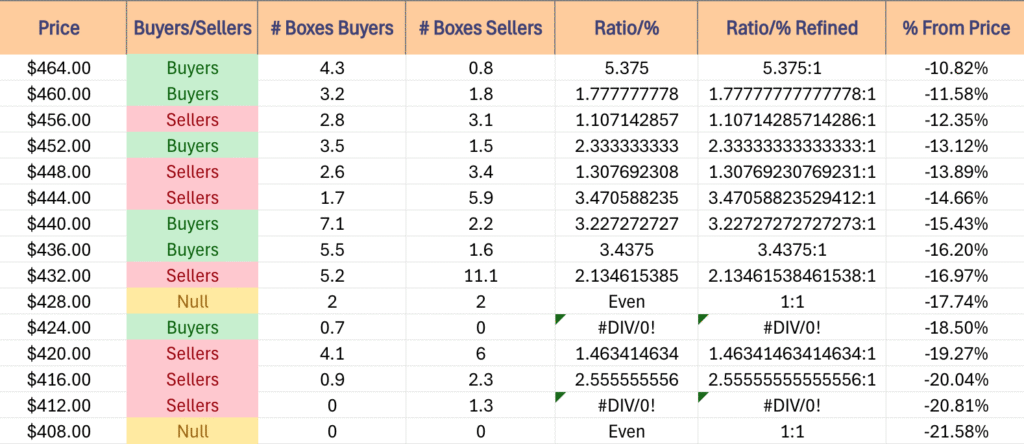
$464 – Buyers – 5.38:1, -10.82% From Current Price Level
$460 – Buyers – 1.78:1, -11.58% From Current Price Level
$456 – Sellers – 1.11:1, -12.35% From Current Price Level
$452 – Buyers – 2.33:1, -13.12% From Current Price Level
$448 – Sellers – 1.31:1, -13.89% From Current Price Level
$444 – Sellers – 3.47:1, -14.66% From Current Price Level
$440 – Buyers – 3.23:1, -15.43% From Current Price Level
$436 – Buyers – 3.44:1, -16.2% From Current Price Level
$432 – Sellers – 2.13:1, -16.97% From Current Price Level
$428 – Even – 1:1, -17.74% From Current Price Level
$424 – Buyers – 0.7:0*, -18.5% From Current Price Level
$420 – Sellers – 1.46:1, -19.27% From Current Price Level
$416 – Sellers – 2.56:1, -20.04% From Current Price Level
$412 – Sellers – 1.3:0*, -20.81% From Current Price Level
$408 – NULL – 0:0*, -21.58% From Current Price Level
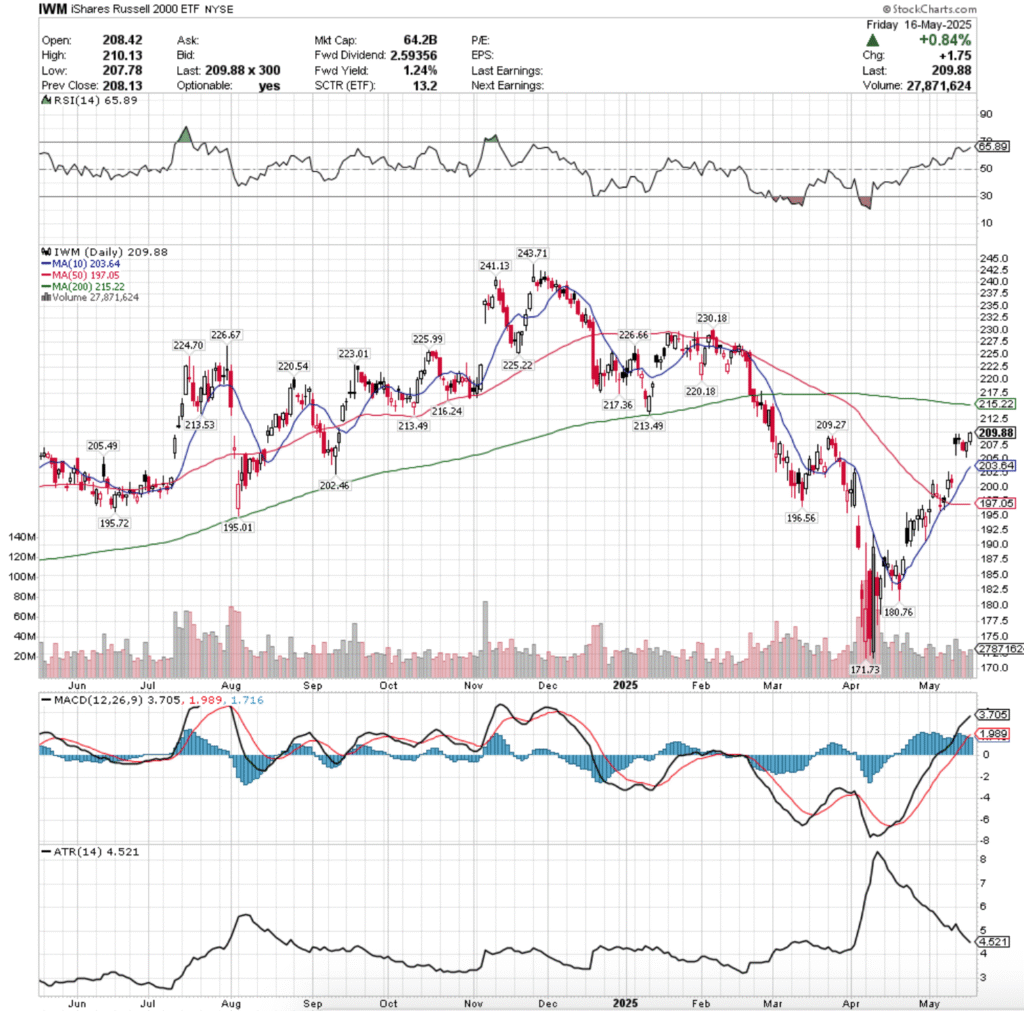
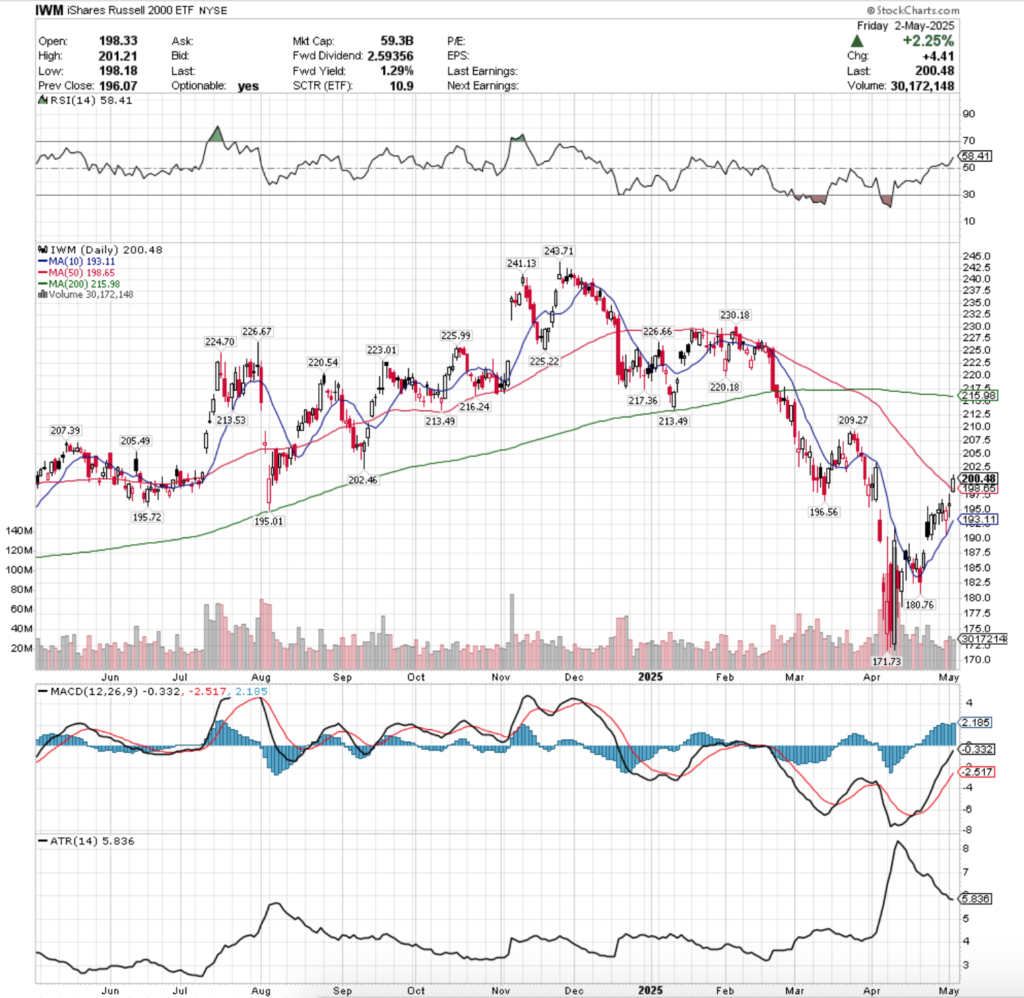
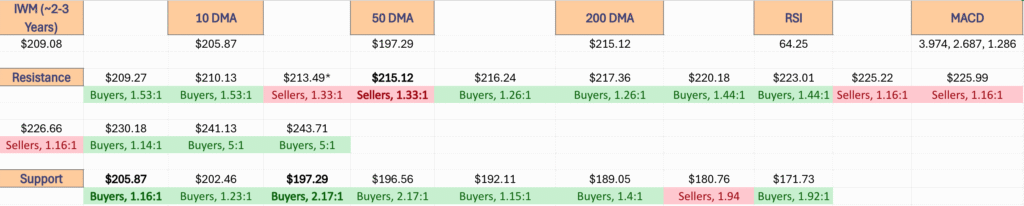
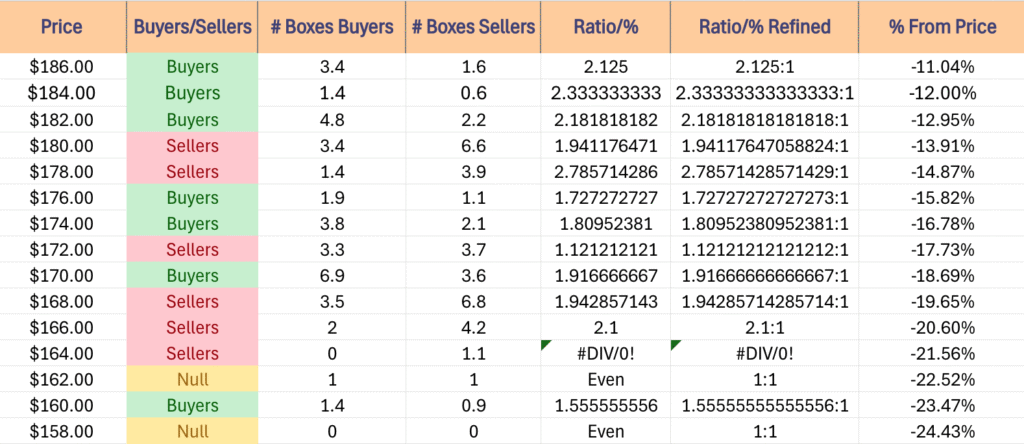
Price Level:Volume Sentiment Analysis For IWM, The iShares Russell 2000 ETF

IWM, the iShares Russell 2000 ETF has also recovered a bit from the declines of late-March, but at a more muted pace that SPY or QQQ.
They’re still closer to the bottom of their one year chart & are still lagging their 200 day moving average (long-term trend line), with less support levels on the one year chart than resistance levels.
The small cap index has moved in a similar, but less resilient manner to DIA, but given that the blue chip index is more likely to be bought & held than the small cap index it would be wise to monitor them both independently of one another.
Combining the data below with the past week’s near-to-mid-term horizon for IWM is beneficial for gaining insight into how market participants may behave in the coming weeks-to-months.

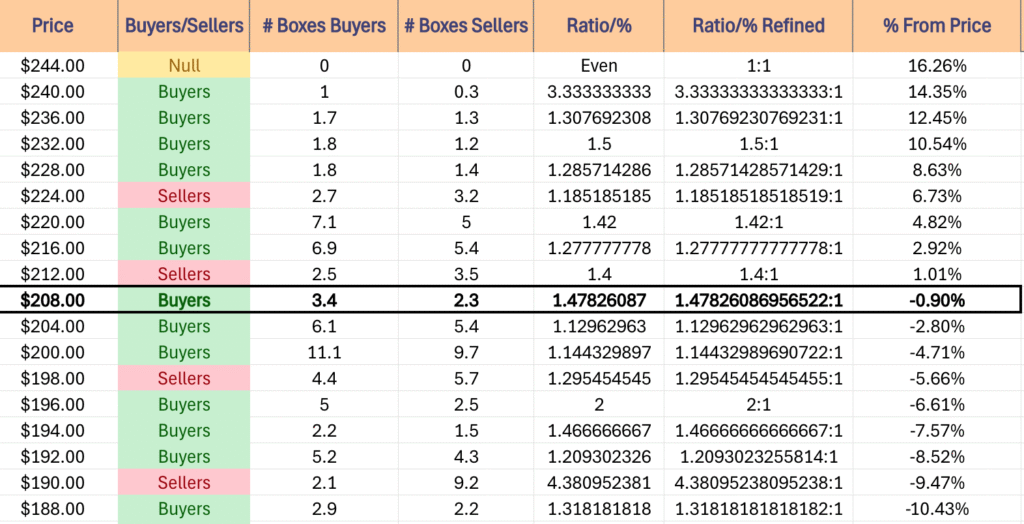
$244 – NULL – 0:0*, +16.7% From Current Price Level
$240 – Buyers – 5:1, +14.79% From Current Price Level
$236 – Buyers – 1.23:1, +12.88% From Current Price Level
$232 – Buyers – 1.46:1, +10.96% From Current Price Level
$228 – Buyers – 1.14:1, +9.05% From Current Price Level
$224 – Sellers – 1.16:1, +7.14% From Current Price Level
$220 – Buyers – 1.44:1, +5.22% From Current Price Level
$216 – Buyers – 1.26:1, +3.31% From Current Price Level
$212 – Sellers – 1.33:1, +1.4% From Current Price Level – 200 Day Moving Average*
$208 – Buyers – 1.52:1, -0.52% From Current Price Level – Current Price Level*
$204 – Buyers – 1.16:1, -2.43% From Current Price Level – 10 Day Moving Average*
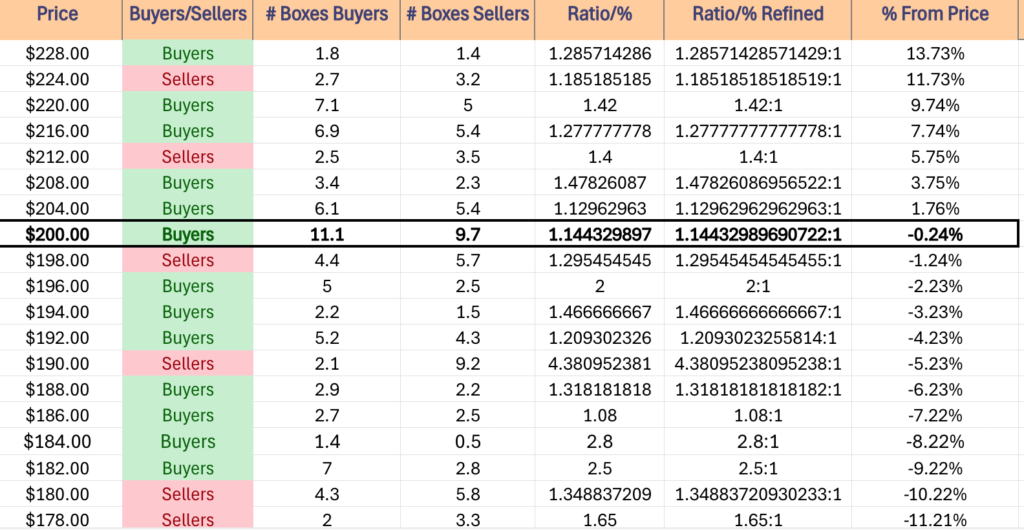
$200 – Buyers – 1.23:1, -4.34% From Current Price Level
$198 – Sellers – 1.25:1, -5.3% From Current Price Level
$196 – Buyers – 2.17:1, -6.26% From Current Price Level – 50 Day Moving Average*
$194 – Buyers – 1.77:1, -7.21% From Current Price Level
$192 – Buyers – 1.15:1, -8.17% From Current Price Level
$190 – Sellers – 3.77:1, -9.13% From Current Price Level
$188 – Buyers – 1.4:1, -10.08% From Current Price Level
$186 – Buyers – 2.13:1, -11.04% From Current Price Level
$184 – Buyers – 2.33:1, -12% From Current Price Level
$182 – Buyers – 2.18:1, -12.95% From Current Price Level
$180 – Sellers – 1.94:1, -13.91% From Current Price Level
$178 – Sellers – 2.79:1, -14.87% From Current Price Level
$176 – Buyers – 1.73:1, -15.82% From Current Price Level
$174 – Buyers – 1.81:1, -16.78% From Current Price Level
$172 – Sellers – 1.12:1, -17.73% From Current Price Level
$170 – Buyers – 1.92:1, -18.69% From Current Price Level
$168 – Sellers – 1.94:1, -19.65% From Current Price Level
$166 – Sellers – 2.1:1, -20.6% From Current Price Level
$164 – Sellers – 1.1:0*, -21.56% From Current Price Level
$162 – Even – 1:1, -22.52% From Current Price Level
$160 – Buyers – 1.56:1, -23.47% From Current Price Level
$158 – NULL – 0:0*, -24.43% From Current Price Level
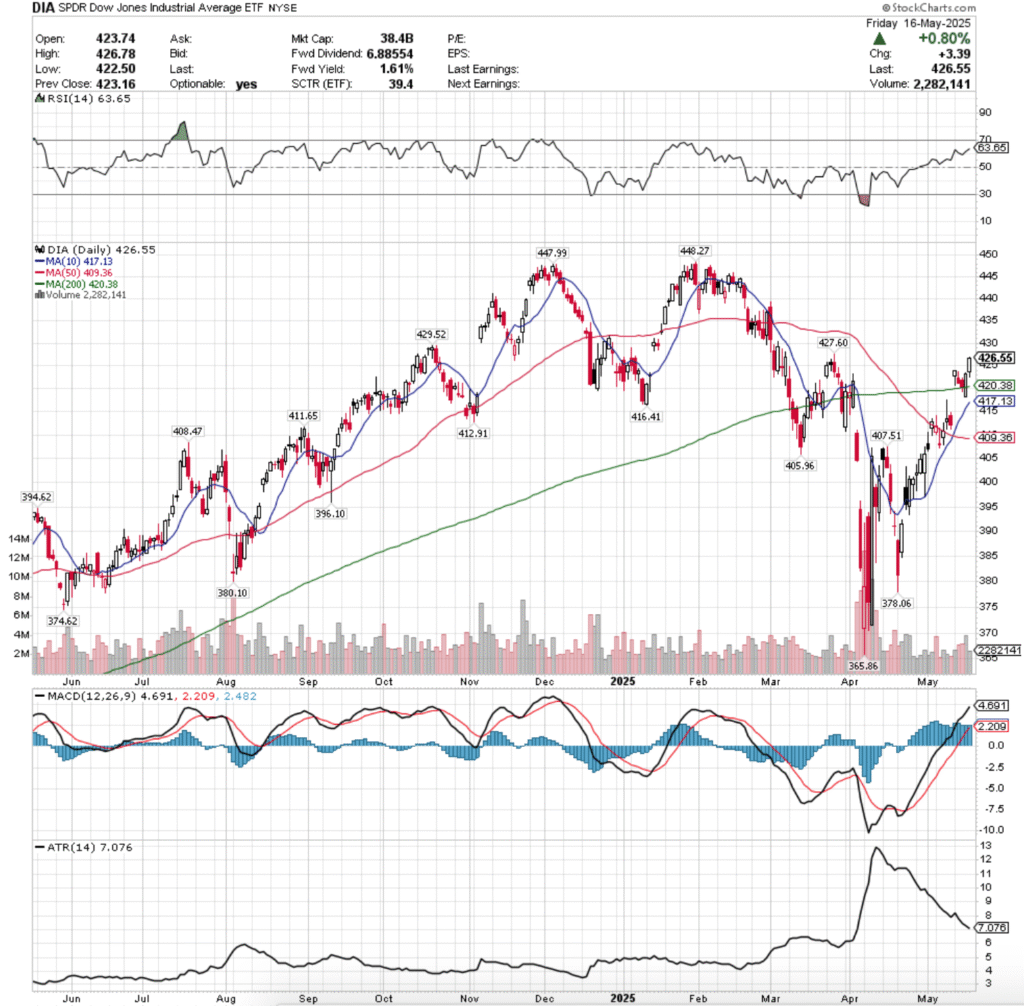
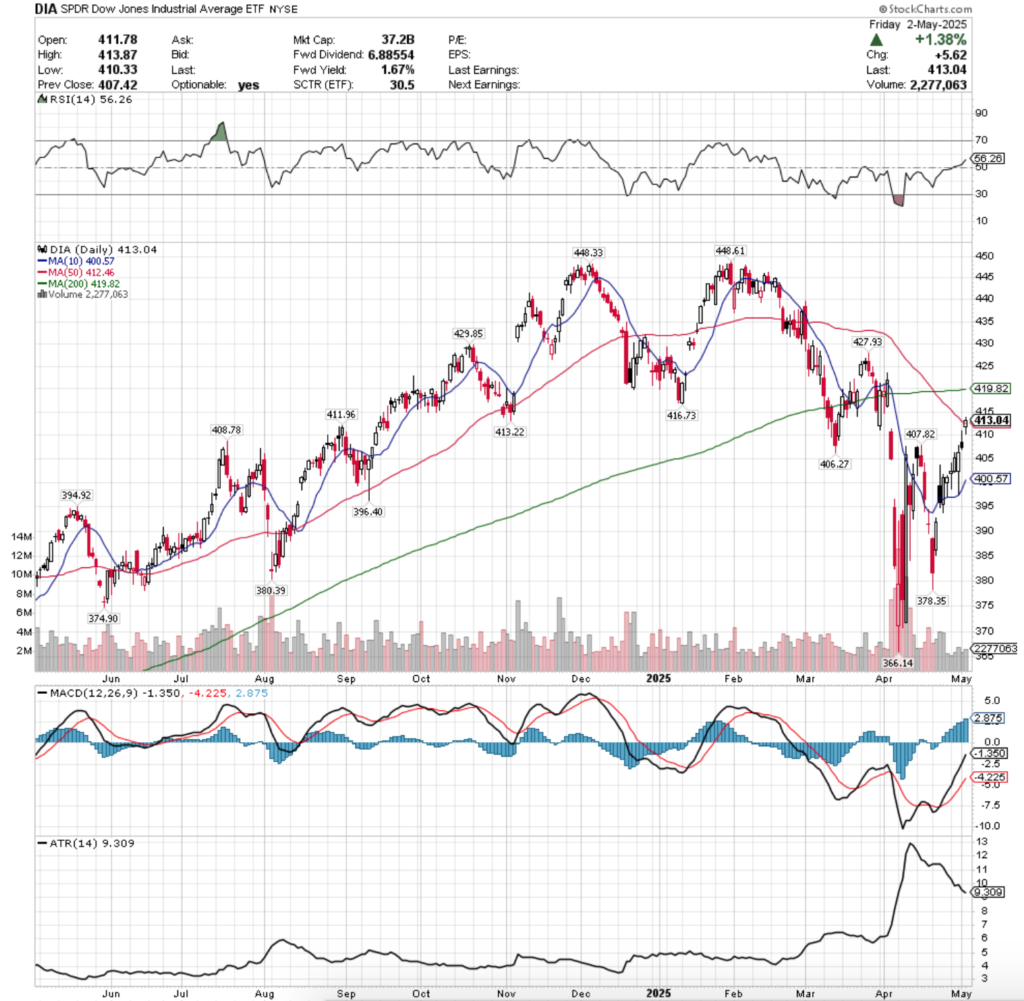
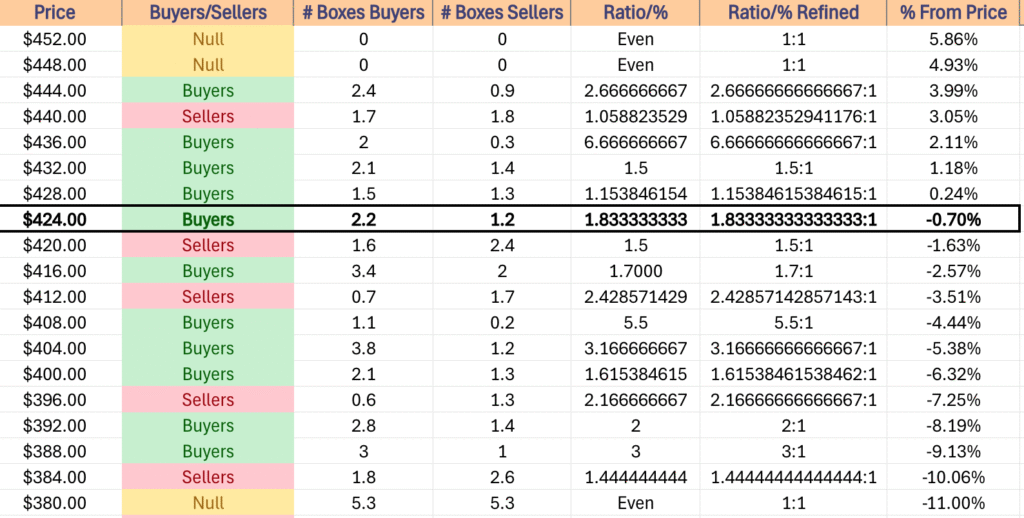
Price Level:Volume Sentiment Analysis For DIA, The SPDR Dow Jones Industrial Average ETF
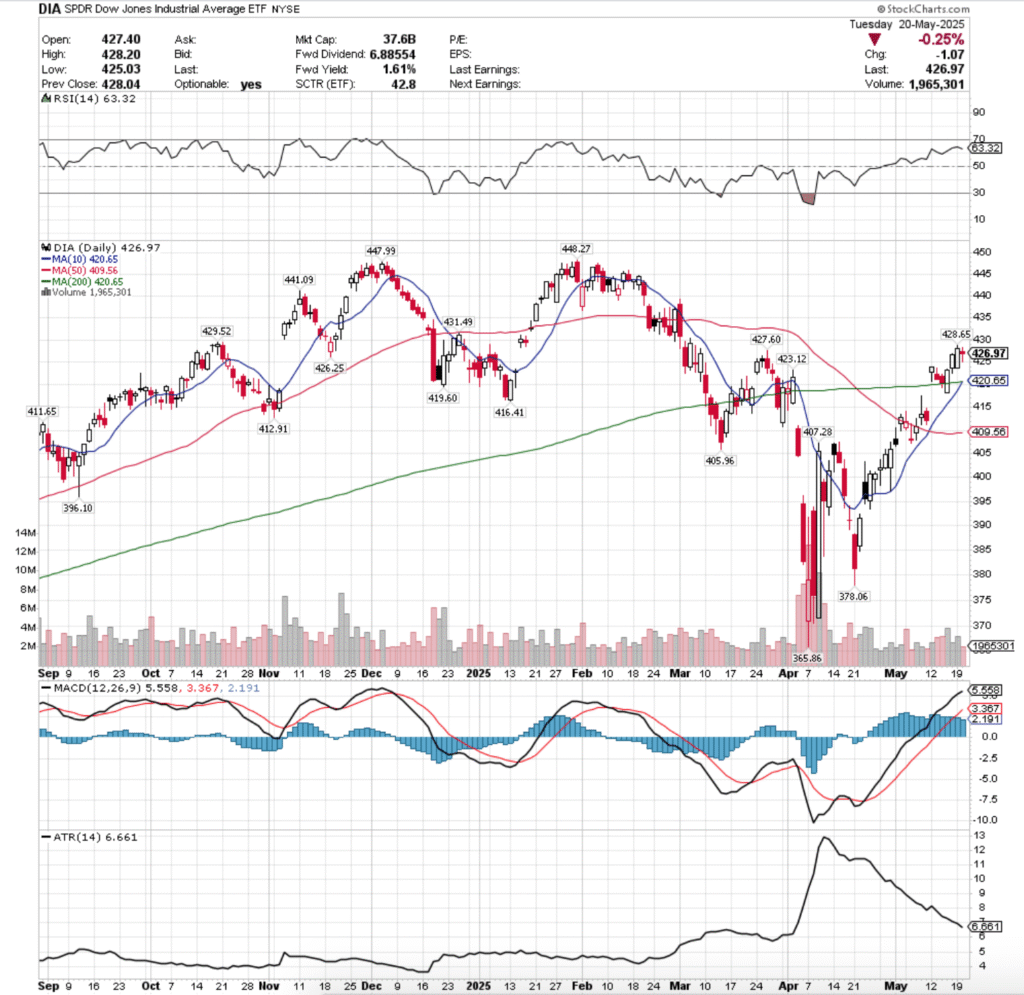
DIA, the SPDR Dow Jones Industrial Average ETF has also bounced back from the losses of late-March & early-April.
Volumes though show a more cautious buy & hold approach happening to the blue chip index vs. the other three majors, but any downside catalyst can at this point in time cause that to break down.
With a lot of uncertainty on the horizon, knowing how market participants have behaved in the past is beneficial for understanding how DIA may behave in the future.
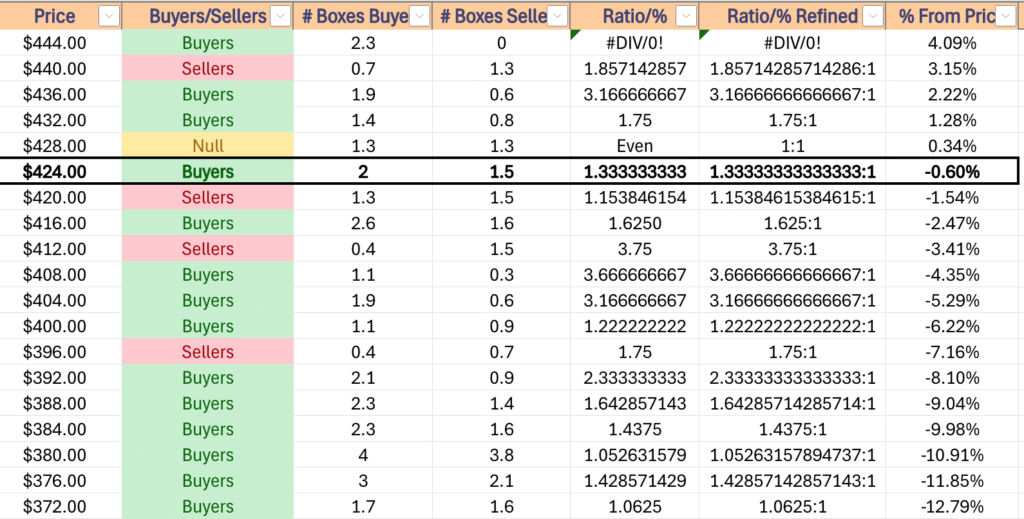
$452 – NULL – 0:0*, +5.86% From Current Price Level
$448 – NULL – 0:0*, +4.93% From Current Price Level
$444 – Buyers – 2.67:1, +3.99% From Current Price Level
$440 – Sellers – 1.06:1, +3.05% From Current Price Level
$436 – Buyers – 6.67:1, +2.11% From Current Price Level
$432 – Buyers – 1.5:1, +1.18% From Current Price Level
$428 – Buyers – 1.15:1, +0.24% From Current Price Level
$424 – Buyers – 1.83:1, -0.7% From Current Price Level – Current Price Level*
$420 – Sellers – 1.5:1, -1.63% From Current Price Level – 10 & 200 Day Moving Averages*
$416 – Buyers – 1.7:1, -2.57% From Current Price Level
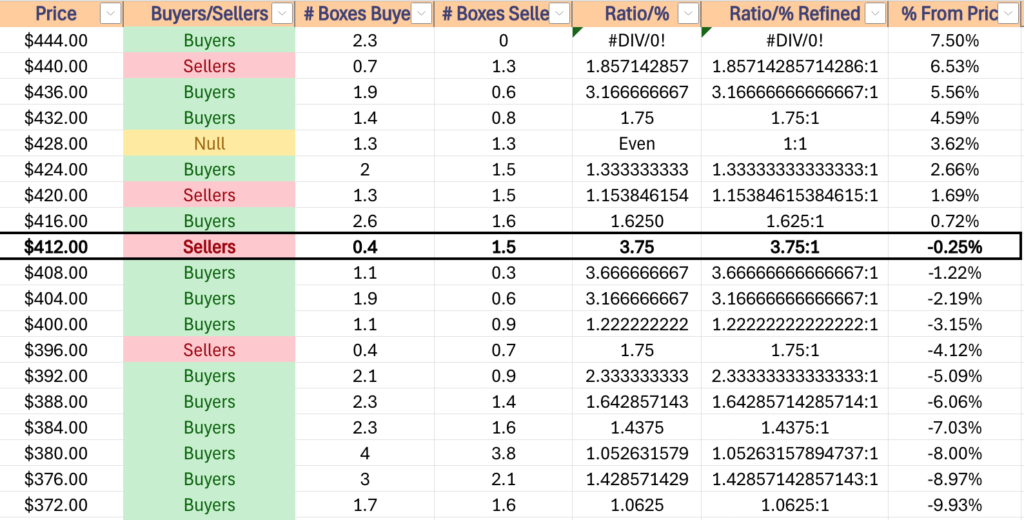
$412 – Sellers – 4.42:1, -3.51% From Current Price Level
$408 – Buyers – 5.5:1, -4.44% From Current Price Level – 50 Day Moving Average*
$404 – Buyers – 3.17:1, -5.38% From Current Price Level
$400 – Buyers – 1.62:1, -6.32% From Current Price Level
$396 – Sellers – 2.17:1, -7.25% From Current Price Level
$392 – Buyers – 2:1, -8.19% From Current Price Level
$388 – Buyers – 3:1, -9.13% From Current Price Level
$384 – Sellers – 1.44:1, -10.06% From Current Price Level
$380 – Even – 1:1, -11% From Current Price Level
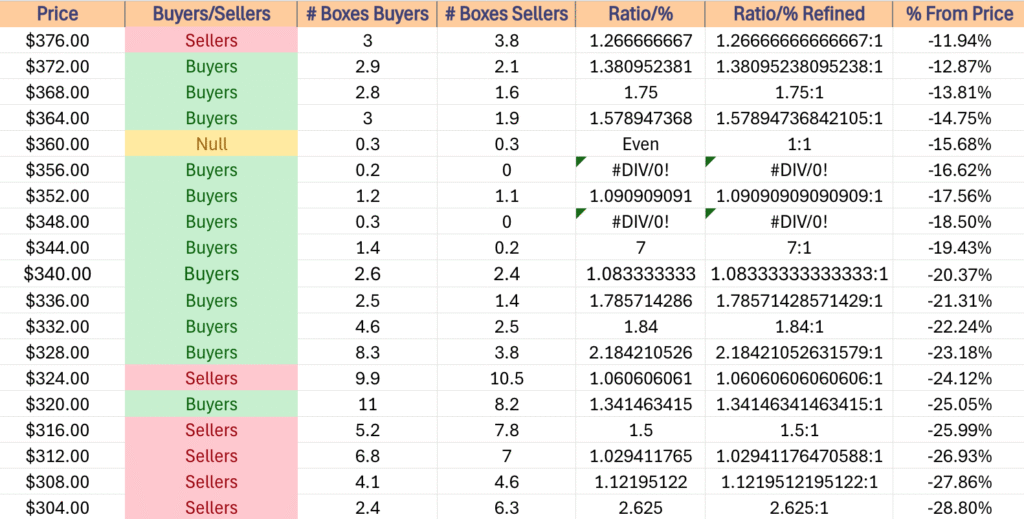
$376 – Sellers – 1.27:1, -11.94% From Current Price Level
$372 – Buyers – 1.38:1, -12.87% From Current Price Level
$368 – Buyers – 1.75:1, -13.81% From Current Price Level
$364 – Buyers – 1.58:1, -14.75% From Current Price Level
$360 – Even – 1:1, -15.68% From Current Price Level
$356 – Buyers – 0.2:0*, -16.62% From Current Price Level
$352 – Buyers – 1.09:1, -17.56% From Current Price Level
$348 – Buyers – 0.3:0*, -18.5% From Current Price Level
$344 – Buyers – 7:1, -19.43% From Current Price Level
$340 – Buyers – 1.08:1, -20.37% From Current Price Level
$336 – Buyers – 1.79:1, -21.31% From Current Price Level
$332 – Buyers – 1.84:1, -22.24% From Current Price Level
$328 – BUyers – 2.18:1, -23.18% From Current Price Level
$324 – Sellers – 1.06:1, -24.12% From Current Price Level
$320 – Buyers – 1.34:1, -25.99% From Current Price Level
$316 – Sellers – 1.5:1, -25.99% From Current Price Level
$312 – Sellers – 1.03:1, -26.93% From Current Price Level
$308 – Sellers – 1.12:1, -27.86% From Current Price Level
$304 – Sellers – 2.63:1, -28.8% From Current Price Level
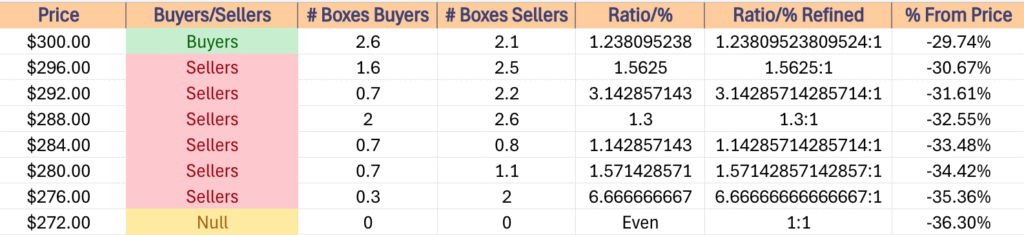
$300 – Buyers – 1.24:1, -29.74% From Current Price Level
$296 – Sellers – 1.56:1, -30.67% From Current Price Level
$292 – Sellers – 3.14:1, -31.62% From Current Price Level
$288 – Sellers – 1.3:1, -32.55% From Current Price Level
$284 – Sellers – 1.14:1, -33.48% From Current Price Level
$280 – Sellers – 1.57:1, -34.42% From Current Price Level
$276 – Sellers – 6.67:1, -35.36% From Current Price Level
$272 – NULL – 0:0*, -36.3% From Current Price Level
*** I DO NOT OWN SHARES OR OPTIONS CONTRACT POSITIONS IN SPY, QQQ, IWM OR DIA AT THE TIME OF PUBLISHING THIS ARTICLE ***