URA, the Global X Uranium ETF has had a strong past year, advancing +47.72% (ex-distributions & using Tuesday 7/16/2024’s closing price & the adjusted closing price of 7/17/2023*).
Though they’ve fallen -9.54% since their 52-week high set on 5/20/2024, they’ve gained +42.22% since their 52-week low which occurred on 8/2/2023*.
With the acknowledgement that data centers & artificial intelligence are going to require more energy than what the U.S. currently has the capabilities of supplying, the conversation has begun to shift towards nuclear power as a solution.
For comparison on the power needs, current estimates state that a single data center uses the electricity equivalent of 50,000 homes.
An article I was reading the other day mentioned that Alphabet, Amazon & Microsoft have ~5,400 data centers, of which 600 are in full use.
That energy requirement comes out to ~30M homes worth of electricity, which is ~8x the number of houses in New Jersey (3.7M units, per NJLM), and it’s still only using 11% of the total number of data centers listed for those three companies.
Should this force more nuclear power generation there will be a greater demand for Uranium, making URA a prime candidate for investors to look at.
In addition to the exposure to the nuclear play, URA also has great international diversification, with only one of its top ten holdings being a US listed company (UEC, Uranium Energy Corp.).
While markets hover near all-time & 52-week highs as earnings season kicks off & market participants await a September FOMC interest rate announcement, there may be some volatility to present a more favorable entry to a position in URA.
It should be noted that URA pays a 5.75% distribution yield which can serve as a cushion for long-term holders in the event of a decline.
Below is a brief technical analysis of URA’s recent performance, as well as a breakdown of URA’s volume sentiment at the price levels it has traded at over the past 3-4 years.
It is not intended to serve as financial advice, but rather as an additional tool to reference while performing your own due diligence into URA.
* On 7/17/2023 URA closed at $21.879, but their adjusted close for this day was $20.61, which is why their overall annual quoted growth figure is larger than their 52-week low comparison, which is using the lowest of their quoted Low prices for the past year
Technical Analysis Of URA, The Global X Uranium ETF
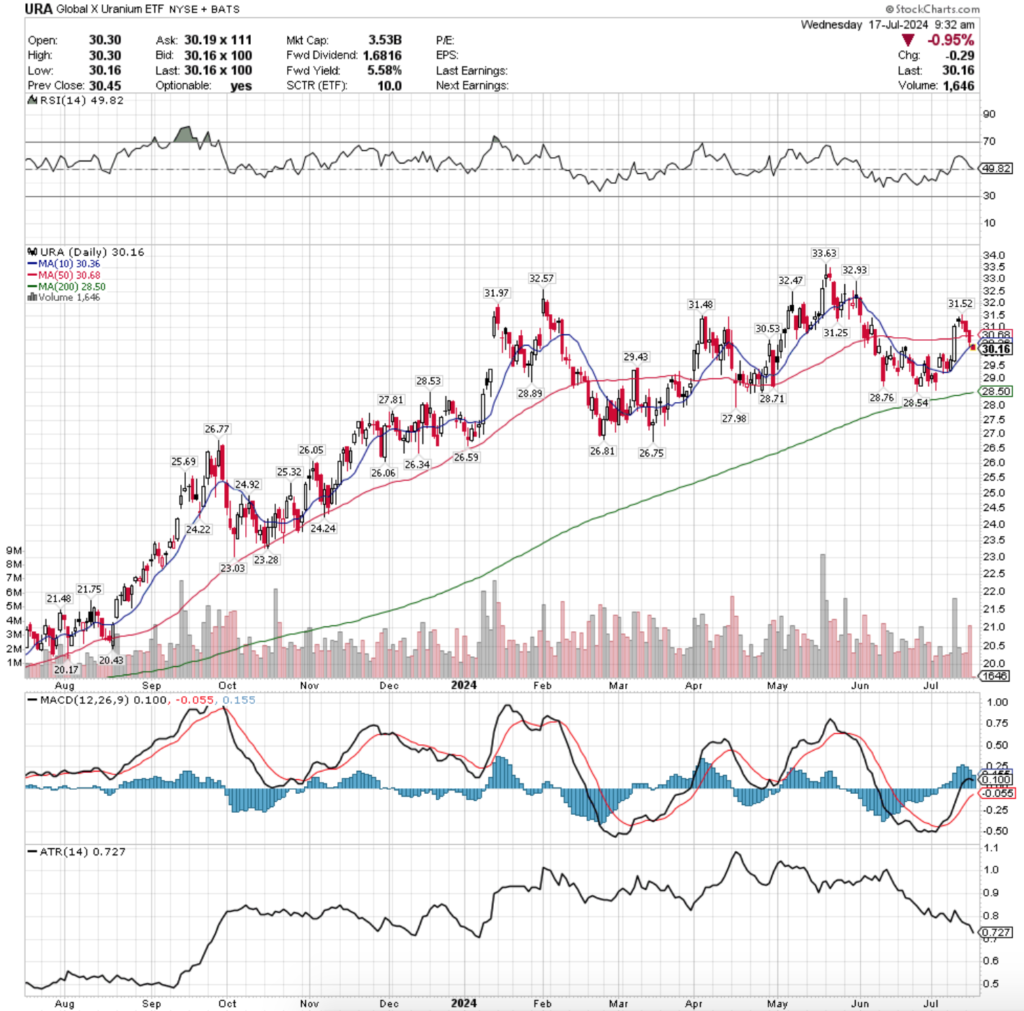
URA ETF – Global X Uranium ETF’s Technical Performance Over The Past Year
Their RSI is currently just below the neutral mark of 50 & sits currently at 49.82, while their MACD is bullish but signaling signs of weakness & like there is an impending bearish crossover in the coming days.
Over the past week & a half (excluding today, 7/17/2024) volumes have been -0.37% below the prior year’s average (2,642,300 vs. 2,652,048.81), most notably helped by a high volume bullish session on last Wednesday & yesterday’s above average bearish session.
Volumes as a whole have been lower than average for the better part of the last ten weeks as indicated by the major four index ETFs (SPY, QQQ, IWM & DIA).
Last week kicked off on a bearish note Monday, but the 10 day moving average was able to provide support & led to a bullish Tuesday & Wednesday.
Wednesday’s session advanced +4.4% day-over-day, breaking through the resistance of the 50 day moving average on the highest volume seen in two months, but things began to fall apart from there.
Thursday sent out an ominous message, as the session opened on a gap up, tested slightly higher, before resulting in a hanging man candle (bearish) that closed lower than it opened (also bearish).
As Thursday implied, the sentiment was risk off going into the weekend, with a touch of uncertainty as a high wave spinning top candle marked the close of the declining session with light volume.
This week opened up to profit taking on Monday, where there was slightly more volume than Friday but it was still subdued.
Yesterday (Tuesday, 7/16/2024) was where actual trouble began to show, as URA declined below the support of the 50 day moving average & continued lower to test the 10 DMA’s support with its lower shadow, closing just above it.
Yesterday’s volumes were the second highest of the past week & a half & show that there mood appears to have currently soured on URA for the near-term.
This morning that theme continued as prices opened around the 10 DMA & quickly drifted lower.
URA’s Average True Range has been declining since the beginning of July, but should begin to climb if this volatility continues into the near-term.
The good news is that in the event that the declines do continue on, URA has one support touch-point in the $29-29.99/share range, and a cluster of support from $28.50 (200 Day Moving Average) to $28.99/share.
The $29-29.99/share range is currently dominated by Sellers over the past 3-4 years at a ratio of 1.12:1, but the $28-28.99/share range has seen Buyers besting the sellers at a ratio of 1.14:1 in that time period, which should add strength to the support zone.
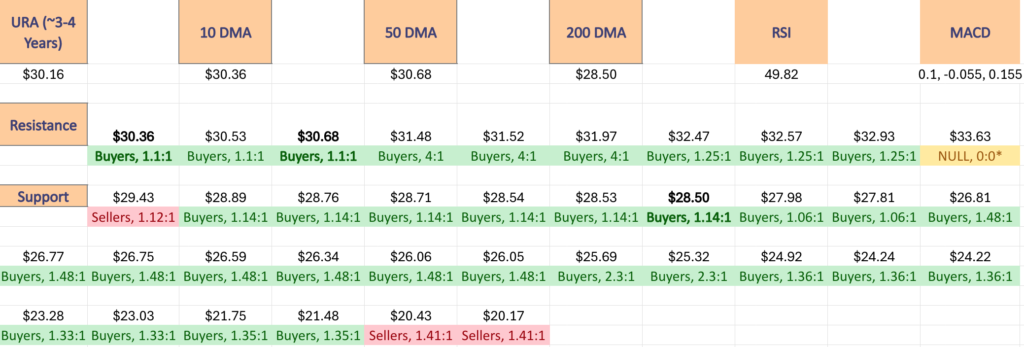
The data below can be used to help assess the strength of support & resistance levels for URA in the future, along with whatever other indicators, oscillators & market data that you prefer to use in your due diligence.
Price Level:Volume Sentiment Analysis Of URA, The Global X Uranium ETF
The top table below shows the support & resistance levels of XLK ETF from the past year’s chart, as well as their price level:volume sentiment at each, using Monday’s closing price.
The moving averages are denoted with bold.
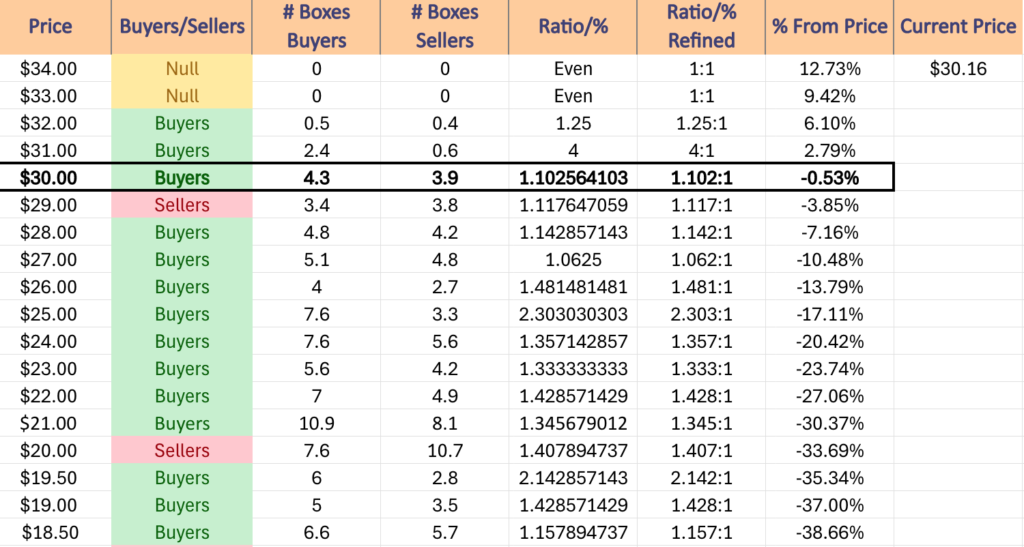
The next charts show the volume sentiment at each individual price level URA has traded at over the past ~3-4 years.
Beneath them is a copy & pasteable list of the same data, where the support/resistance levels are denoted in bold.
All ratios with “0” in the denominator are denoted with a “*”.
NULL values are price levels that had limited trading volume, whether it be due to gaps, quick advances or they are at price extremes; in the event that they are retested & there is more data they would have a distinct “Buyers”, “Sellers” or “Even” title.
This is not intended as financial advice, but rather another tool to consider when performing your own research & due diligence on URA ETF or any of its components.
The URA ETF’s Price Level:Volume Sentiment Over The Past 3-4 Years At Their Past Year’s Support & Resistance Levels
URA ETF’s Price Level:Volume Sentiment Over The Past 3-4 Years
Analyzing URA ETF’s Price Level:Volume Sentiment Over The Past 3-4 Years
URA ETF’S Price Level:Volume Sentiment Over The Past 3-4 Years
$34 – NULL – 0:0*, +12.73% From Current Price Level
$33 – NULL – 0:0*, +9.42% From Current Price Level
$32 – Buyers – 1.25:1, +6.1% From Current Price Level
$31 – Buyers – 4:1, +2.79% From Current Price Level
$30 – Buyers – 1.1:1, -0.53% From Current Price Level – CURRENT PRICE BOX & 10 & 50 DAY MOVING AVERAGES**
$29 – Sellers – 1.12:1, -3.85% From Current Price Level
$28 – Buyers – 1.14:1, -7.16% From Current Price Level – 200 Day Moving Average*
$27 – Buyers – 1.06:1, -10.48% From Current Price Level
$26 – Buyers – 1.48:1, -13.79% From Current Price Level
$25 – Buyers – 2.3:1, -17.11% From Current Price Level
$24 – Buyers – 1.36:1, -20.42% From Current Price Level
$23 – Buyers – 1.33:1, -23.74% From Current Price Level
$22 – Buyers – 1.43:1, -27.06% From Current Price Level
$21 – Buyers – 1.35:1, -30.37% From Current Price Level
$20 – Sellers – 1.41:1, -33.69% From Current Price Level
$19.50 – Buyers – 2.14:1, -35.34% From Current Price Level
$19 – Buyers – 1.43:1, -37% From Current Price Level
$18.50 – Buyers – 1.16:1, -38.66% From Current Price Level
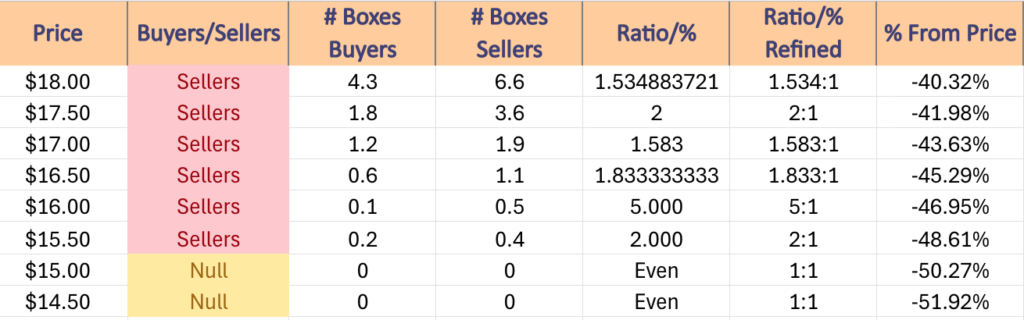
$18 – Sellers – 1.53:1, -40.32% From Current Price Level
$17.50 – Sellers – 2:1, -41.98% From Current Price Level
$17 – Sellers – 1.58:1, -43.63% From Current Price Level
$16.50 – Sellers – 1.83:1, -45.29% From Current Price Level
$16 – Sellers – 5:1, -46.95% From Current Price Level
$15.50 – Sellers – 2:1, -48.61% From Current Price Level
$15 – NULL – 0:0*, -50.27% From Current Price Level
$14.50 – NULL – 0:0*, -51.92% From Current Price Level
*** I DO NOT OWN SHARES OR OPTIONS CONTRACT POSITIONS IN URA AT THE TIME OF PUBLISHING THIS ARTICLE ***
Highest Technical Rated S&P 500 Components Per 7/16/2024’s Close:
1 – NVDA
2 – GLW
3 – TER
4 – IRM
5 – MPWR
6 – RCL
7 – TSLA
8 – AVGO
9 – FICO
10 – SYF
Lowest Technical Rated S&P 500 Components Per 7/16/2024’s Close:
1 – WBA
2 – NKE
3 – EL
4 – LULU
5 – ALB
6 – LW
7 – AAL
8 – DLTR
9 – SBUX
10 – BMY
Highest Volume Rated S&P 500 Components Per 7/16/2024’s Close:
1 – SCHW
2 – RJF
3 – PNC
4 – MTCH
5 – STT
6 – UNH
7 – MS
8 – BAX
9 – AMP
10 – JBHT
Lowest Volume Rated S&P 500 Components Per 7/16/2024’s Close:
1 – ADSK
2 – ADBE
3 – FOX
4 – INCY
5 – HPE
6 – MNST
7 – BALL
8 – HES
9 – PARA
10 – PANW
Highest Technical Rated ETFs Per 7/16/2024’s Close:
1 – NVDQ
2 – NVDL
3 – NVDU
4 – WGMI
5 – USD
6 – SOXL
7 – DAPP
8 – DPST
9 – TSLL
10 – CRPT
Lowest Technical Rated ETFs Per 7/16/2024’s Close:
1 – NVD
2 – TSDD
3 – BOIL
4 – NVDX
5 – SOXS
6 – SSG
7 – LABD
8 – UVIX
9 – NVDS
10 – JDST
Highest Volume Rated ETFs Per 7/16/2024’s Close:
1 – CPII
2 – XSHQ
3 – HYBB
4 – JVAL
5 – XTN
6 – QQQN
7 – MAYZ
8 – LSGR
9 – XTL
10 – IDEC
Lowest Volume Rated ETFs Per 7/16/2024’s Close:
1 – ARP
2 – USCA
3 – KONG
4 – XHYH
5 – HJAN
6 – APRZ
7 – PSCW
8 – XCLR
9 – FEUS
10 – RTAI
Highest Technical Rated General Stocks Per 7/16/2024’s Close:
1 – ZAPP
2 – TSSI
3 – EBS
4 – FTEL
5 – PLCKF
6 – MEDS
7 – KOSS
8 – CULTF
9 – WULF
10 – SMR
Lowest Technical Rated General Stocks Per 7/16/2024’s Close:
1 – HLVX
2 – VLCN
3 – CNSP
4 – AIEV
5 – EFSH
6 – GWAV
7 – ASLN
8 – DSY
9 – GRI
10 -BNED
Highest Volume Rated General Stocks Per 7/16/2024’s Close:
1 – SILO
2 – TWO
3 – TKLF
4 – CDT
5 – SPRC
6 – LASE
7 – ATGL
8 – PAPL
9 – SHIM
10 – COSO
Lowest Volume Rated General Stocks Per 7/16/2024’s Close:
1 – VAPO
2 – SABK
3 – NHYKF
4 – GV
5 – PLAG
6 – SHCAY
7 – GUYGF
8 – MSGM
9 – CHCI
10 – AMS
*** THE LIST ABOVE IS STRICTLY FOR INFORMATIONAL PURPOSES – I MAY OR MAY NOT HAVE OR INITIATE A LONG, SHORT, OR LONG/SHORT POSITION IN ANY NAME ABOVE AT ANY TIME ***
Highest Technical Rated S&P 500 Components Per 7/15/2024’s Close:
1 – NVDA
2 – GLW
3 – TER
4 – SMCI
5 – IRM
6 – TSLA
7 – VST
8 – ANET
9 – MPWR
10 – LLY
Lowest Technical Rated S&P 500 Components Per 7/15/2024’s Close:
1 -WBA
2 – NKE
3 – LULU
4 -EL
5 – ALB
6 – AAL
7 – MOH
8 – LW
9 – SBUX
10 – GPN
Highest Volume Rated S&P 500 Components Per 7/15/2024’s Close:
1 – CNP
2 – MKC
3 – FSLR
4 – EG
5 – AES
6 – NEE
7 – STZ
8 – SCHW
9 – BK
10 – MS
Lowest Volume Rated S&P 500 Components Per 7/15/2024’s Close:
1 – PARA
2 – GL
3 – INCY
4 – ABBV
5 – FOX
6 – ADSK
7 – TSN
8 – ADBE
9 – TRMB
10 – GEN
Highest Technical Rated ETFs Per 7/15/2024’s Close:
1 – NVDL
2 – NVDU
3 – USD
4 – SOXL
5 – WGMI
6 – DAPP
7 – TSLL
8 – BCHG
9 – HZEN
10 – AAPU
Lowest Technical Rated ETFs Per 7/15/2024’s Close:
1 – NVD
2 – TSDD
3 – BOIL
4 – SOXS
5 – SSG
6 – UVIX
7 – NVDS
8 – LABD
9 – NVDD
10 – JDST
Highest Volume Rated ETFs Per 7/15/2024’s Close:
1 – TMET
2 – IPP
3 – FEBP
4 – LVOL
5 – SUPP
6 – XJAN
7 – ARVR
8 – ION
9 – SQEW
10 – INOV
Lowest Volume Rated ETFs Per 7/15/2024’s Close:
1 – XVOL
2 – GTR
3 – GGUS
4 – GVUS
5 – USCA
6 – FDVL
7 – PABD
8 – IDEC
9 – MAYT
10 – SYUS
Highest Technical Rated General Stocks Per 7/15/2024’s Close:
1 – ZAPP
2 – PLCKF
3 – TSSI
4 – FTEL
5 – MEDS
6 – EBS
7 – WGS
8 – SMR
9 – AEHL
10 – ASTS
Lowest Technical Rated General Stocks Per 7/15/2024’s Close:
1 – HLVX
2 – VLCN
3 – CNSP
4 – DSY
5 – NBY
6 – SEDG
7 – VSTM
8 – WW
9 – THAR
10 – FRES
Highest Volume Rated General Stocks Per 7/15/2024’s Close:
1 – AEON
2 – GRNQ
3 – DATS
4 – MIRA
5 – ARTL
6 – AMIX
7 – OUT
8 – SCNI
9 – PHOT
10 – AREB
Lowest Volume Rated General Stocks Per 7/15/2024’s Close:
1 – LCGMF
2 – MIMOQ
3 – AQSZF
4 – TLRS
5 – LEMIF
6 – QTRHF
7 – REZZF
8 – SCND
9 – MGTI
10 – KRKR
*** THE LIST ABOVE IS STRICTLY FOR INFORMATIONAL PURPOSES – I MAY OR MAY NOT HAVE OR INITIATE A LONG, SHORT, OR LONG/SHORT POSITION IN ANY NAME ABOVE AT ANY TIME **
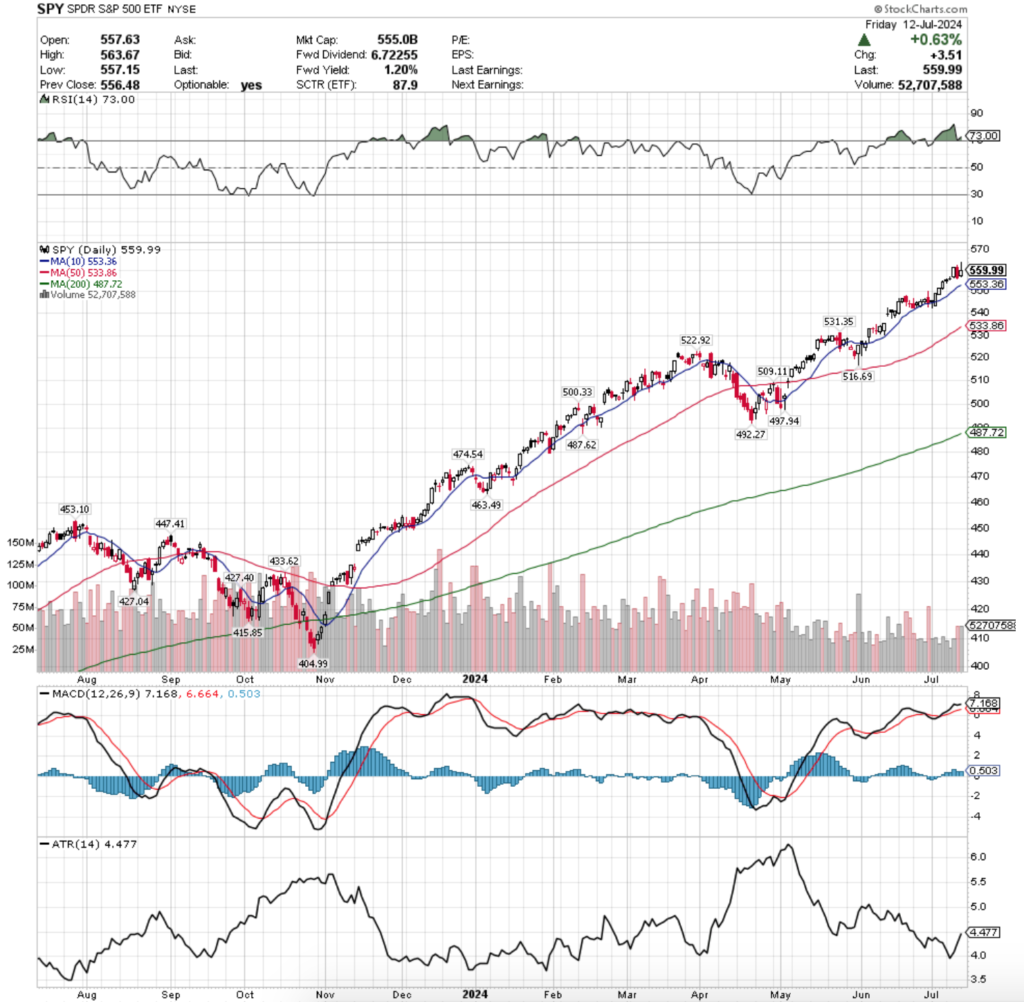
SPY, the SPDR S&P 500 ETF added +0.96% last week, while the VIX closed the week at 12.46, indicating a one day implied move of +/-0.79% & a one month implied move of +/-3.6%.
SPY ETF – SPDR S&P 500 ETF’s Technical Performance Over The Past Year
Their RSI is still in overbought territory despite having deflated slightly last week & still sits at 73, while their MACD remains bullish but is losing steam & looking like it will cross over the signal line bearishly in the first half of the week.
Volumes were -41.54% below the prior year’s average volume (41,637,020 vs. 71,227,029), indicating that there are still a lot of market participants who are sitting on the sidelines still watching to see what happens in the near-term.
Monday began the week on an uncertain note, where a low volume session resulted in a spinning top, however the open-closing price range was concentrated in the top of the day’s candle, signaling there was some appetite to go higher.
The trend continued into Tuesday, when prices advanced slightly on the week’s lowest volume & the day’s candle resulted in a doji, indicating further uncertainty & temporary equilibrium in prices for SPY.
Things began to heat up on Wednesday though, as prices opened slightly higher, tested a bit lower before making the biggest one day gain of the week & setting up what looks to be a new consolidation range based on the rest of the week’s price action.
Thursday saw some of the week’s highest volume in a session that resulted in a bearish engulfing candle, where there was a slight bit of interest in prices going higher based on the day’s upper shadow, but ultimately bears took control of the session & pushed prices down to close below Wednesday’s open.
Friday was a mixed bag, where prices opened above Thursday’s close & marched much higher, only to be met with extreme selling pressure as folks took a risk-off into the weekend approach to close the session only +0.63%.
While the upper shadow of Friday’s candle shows that there were some bullish folks out there, there was not enough staying power to keep them from selling & taking profits before heading off for the weekend.
As noted above, it looks like Wednesday’s session will prove to have established a new range that SPY will fluctuate around in for the near-term unless earnings reports turn out to be incredibly bullish.
With the waning histogram levels on the MACD & the slope of the line in relation to the signal, it appears that it is ready to make a move at a bearish crossover by later on this week.
Given that a new all-time high was reached on Friday, another area to watch is Friday’s high price, which has now become the only resistance level for SPY’s chart.
There’s extremely limited historical data for this price point, making it difficult to anticipate how market participants will behave at it, which makes it even more imperative to have a keen eye on it going into a new week.
Prices have separated themselves from the 10 day moving average following Wednesday’s move, making them further from their nearest support level.
This is important as upon any test of it there may be increased selling pressure based on how SPY has behaved previously when their 10 & 50 DMAs were the first two levels of SPY’s support.
Volume will also be a key area to be watching, as after months of low volume in relation to the previous year’s average levels any uptick in buying or selling pressure can be viewed as a sentiment factor at these high price levels.
If SPY is to continue grinding higher it’s going to need a strong increase in sentiment, as otherwise one or two days of profit taking can lead to steeper declines.
SPY’s Average True Range has been climbing over the past week, which should continue on into this week as volatility is likely to increase in the near-term.
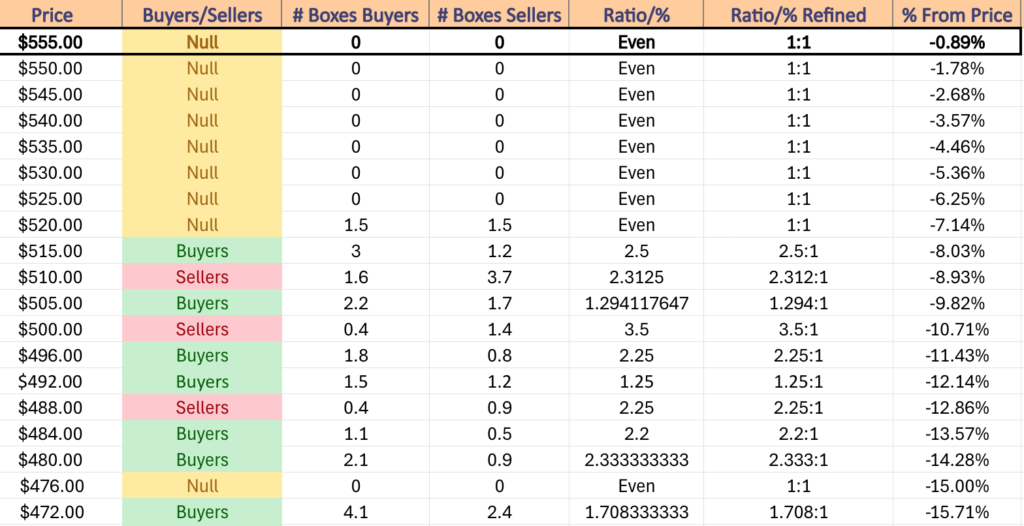
SPY has support at the $553.36 (10 Day Moving Average, Volume Sentiment: NULL, 0:0*), $533.86 (50 Day Moving Average, Volume Sentiment: NULL, 0:0*), $531.35 (Volume Sentiment: NULL, 0:0*) & $522.92/share (Volume Sentiment: NULL, 0:0*) price levels, with resistance at the $563.67/share (All-Time High, Volume Sentiment: NULL, 0:0*) price levels.
SPY ETF’s Price Level:Volume Sentiment Over The Past 1-2 Years
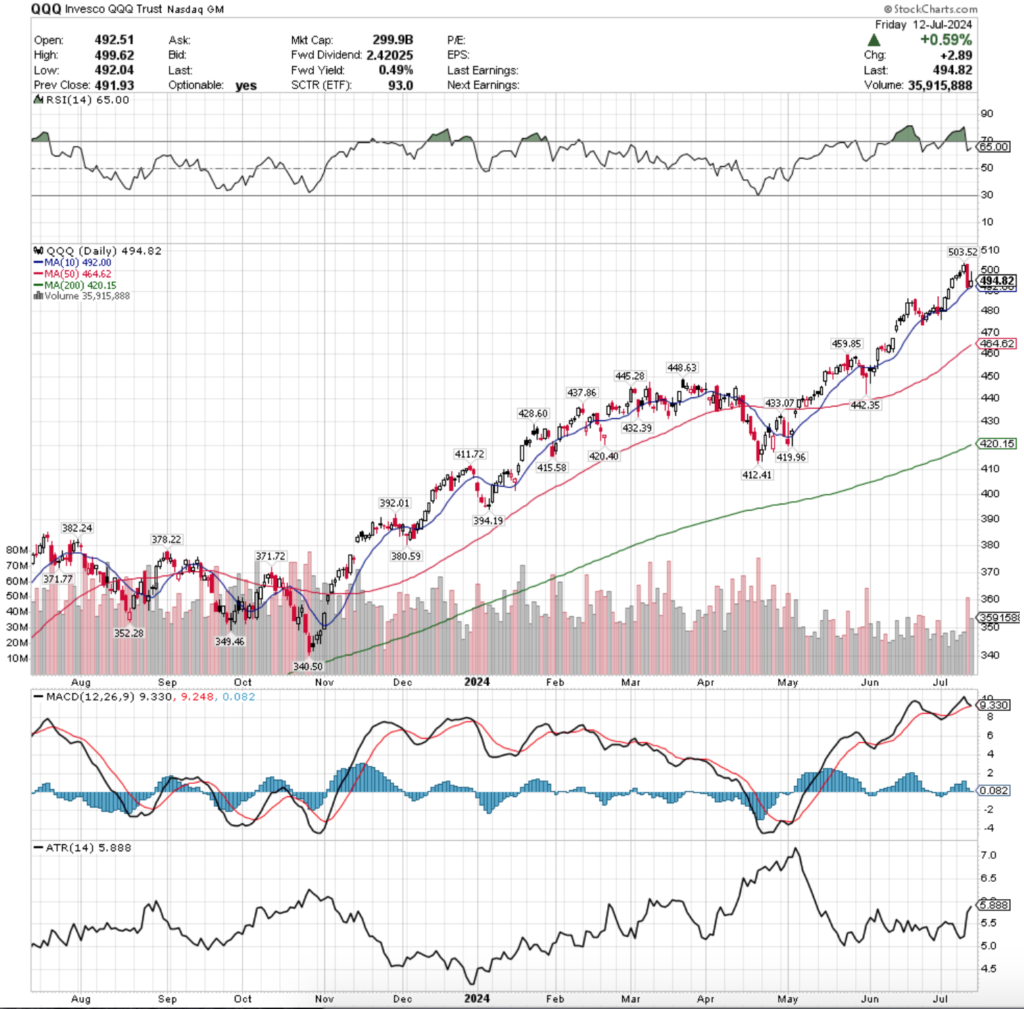
QQQ ETF – Invesco QQQ Trust ETF’s Technical Performance Over The Past Year
Their RSI is trending back towards overbought conditions & is currently at 65, while their MACD is bullish, but primed to cross over the signal line bearishly on Monday or Tuesday.
Volumes were -27.19% below the previous year’s average (32,556,580 vs. 33,409,553), which should raise an eyebrow given that the highest volume session of the week by a long-shot was Thursday’s declining session.
QQQ’s week started on a similar note to SPY’s, a spinning top candle on Monday indicated that there was a bit of hesitancy & indecision on the part of market participants, which was further confirmed by the session having the lowest volume of the week.
Tuesday is when the cracks began to show & it became evident that folks were getting a bit nervous & antsy, as the session opened higher & tested slightly above the open, only to succumb to the bears & be pushed to close lower than the open.
Wednesday began the three day pattern formation of the “%” (while I’ve never seen it written that way formally in my studies, it does look exactly like one), as prices opened higher & continued climbing into the session, establishing a new all-time high & closing not far beneath it.
Thursday exposed the weakness in QQQ, when a bearish engulfing candle showed that there was beginning to be a bit of fear in the market, as prices opened above Wednesday’s session & were pushed below even the previous Friday’s daily price range lows on volume levels not seen since late May.
Prices were supported by the 10 day moving average on Thursday, which is going to be a key area to keep an eye on this coming week.
Friday resulted in a bullish session, but it came with bearish implications, as based on the size of Friday’s candle’s upper shadow either bulls were out in full force & wanted to take some profits going into the weekend, or the well of enthusiasm for QQQ has begun to go dry in the near-term.
It should be noted that the 10 DMA held up as a support level on Friday too, but it is tough to tell how long that can last for heading into a new week of earnings & economic data.
QQQ’s MACD is another area to be focused on this week, as it is currently primed to cross over bearishly in the coming day or two.
If this happens, expect a lot more volatility & more advancing of their Average True Range, as well as a run to test the 50 day moving average, which is currently QQQ’s second level of support.
While there is also support in the window that formed by the gap up in the second week of June, the 50 DMA may have moved into that price window by the time of a test, given that the window begins just above the $470/share price level from the top & $467/share from the bottom.
While Friday’s candle did form a bullish harami with Thursday’s, we may be looking at a situation similar to April 4-5th, where prices fluttered around in the range of the 4th’s wide-range bearish candle for about a week before falling into decline.
This would form a double top with QQQ’s all-time high reached on Tuesday & confirm the strength of its resistance.
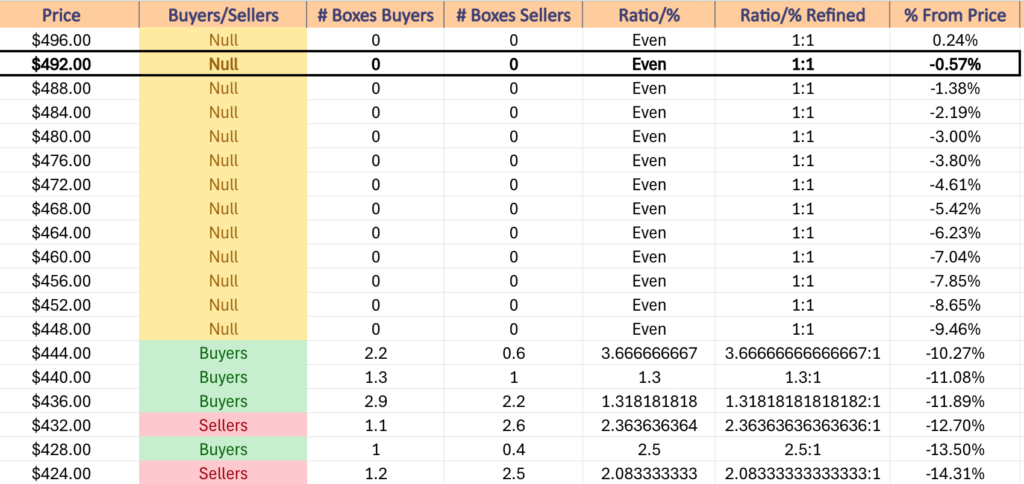
QQQ has support at the $492 (10 Day Moving Average, Volume Sentiment: NULL, 0:0*), $464.62 (50 Day Moving Average, Volume Sentiment: NULL, 0:0*), $459.85 (Volume Sentiment: NULL, 0:0*) & $448.63/share (Volume Sentiment: NULL, 0:0*) price levels, with resistance at the $503.52/share (All-Time High, Volume Sentiment: NULL, 0:0*) price levels.
QQQ ETF’s Price Level:Volume Sentiment Over The Past 1-2 Years
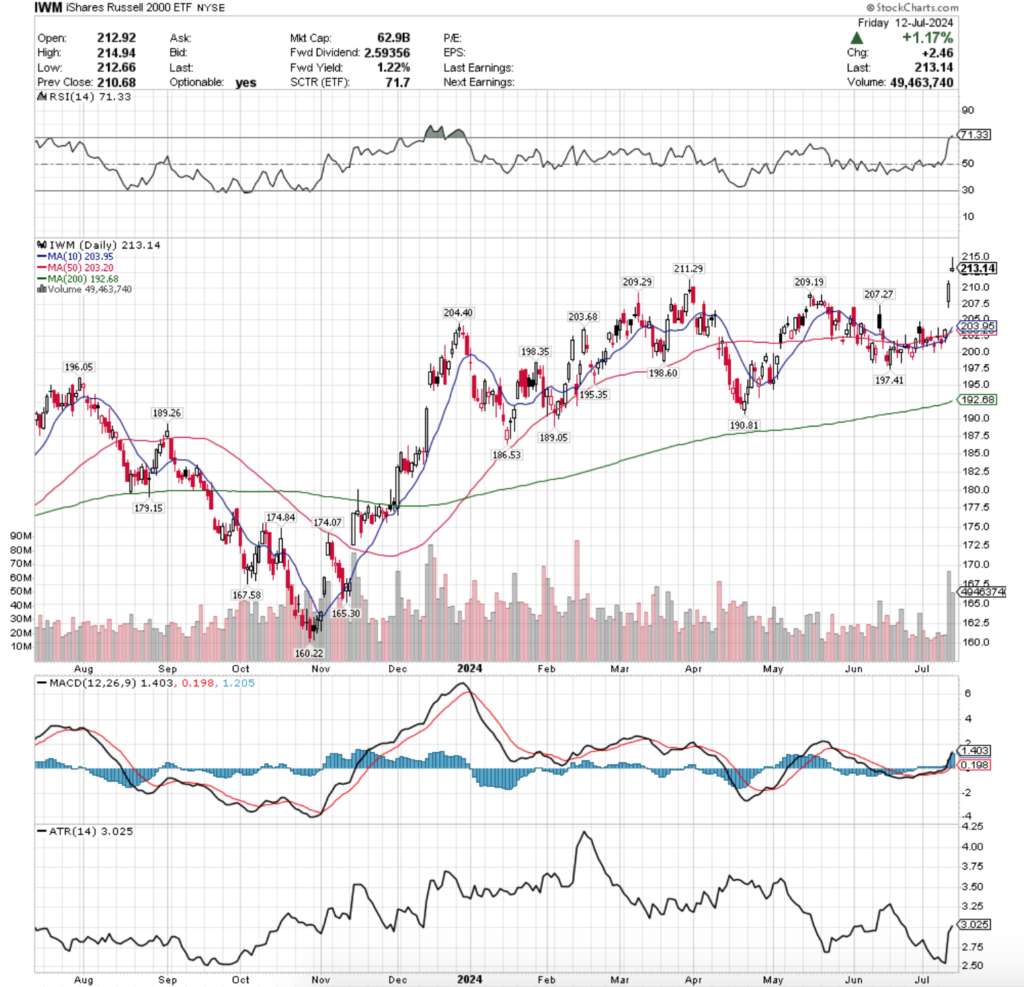
IWM ETF – iShares Russell 2000 ETF’s Technical Performance Over The Past Year
Their RSI crossed into overbought territory on Friday & is currently at 71.33, while their MACD is bullish, but does not appear to be on firm footing due to the rapid nature of its ascent.
Volumes were +4.28% above the previous year’s weekly average (34,840,240 vs. 33,409,553), due entirely to the strong bullish volume of the gap up sessions on Thursday & Friday.
Monday kicked the week off on a note of uncertainty, where low volumes & a long legged doji were the results of the day; prices tread water after having tested a good amount of price levels to the upside & downside & ultimately the support of the 50 day moving average was held in-tact.
Tuesday the bears got into IWM, with a session that opened lower than Monday, tested a bit higher but was rejected by the 50 DMA’s resistance & ultimately declined below the 10 DMA’s support before settling for the day in line with it.
There was a more optimistic air for IWM on Wednesday, when prices opened above Tuesday’s range & the 10 DMA, tested below the 10 DMAs support, before advancing beyond the resistance of the 50 DMA & managing to close above it as a support level.
Thursday opened with a gap up accounting for most of the week’s advances & was able to continue to climb higher on higher volumes than IWM has seen since February to close at over $210/share, breaking through the resistance zone that we’ve noted is at the $209/share price level.
The week wrapped up Friday with a similar, but less enthusiastic session that closed with a touch of warning.
Friday gapped up on the open & made a run at the $215/share level for IWM, but was unable to find footing & bears sent prices to close lower, with the day’s candle closing as a shooting star, which has near-term bearish implications.
IWM’s volume on Friday was high, which poses an interesting question: was the high volume due to folks who thought they missed the action on Thursday who went jumping into the water chasing IWM’s climb up, or was it more centered around people who’d profited already from earlier in the week selling & causing the long upper shadow of the shooting star candle?
The window created by Friday’s gap up will be an area of focus this week, as we wait to see if it serves as support or if it begins to fill.
Should it begin to fill the $211.29/share former 52-week high will be the first support level & how strong or weak it holds up will be key for determining the true strength behind the moves of the last two sessions.
December 12-13th of 2023 were the last time IWM’s RSI crossed into overbought territory, as it tends to stick more to oscillating around the neutral level in between the bounds of overbought & oversold.
When prices began to decline back from the RSI being in overbought territory there was a peak to trough decline of 8%+, which is something to be mindful of moving forward.
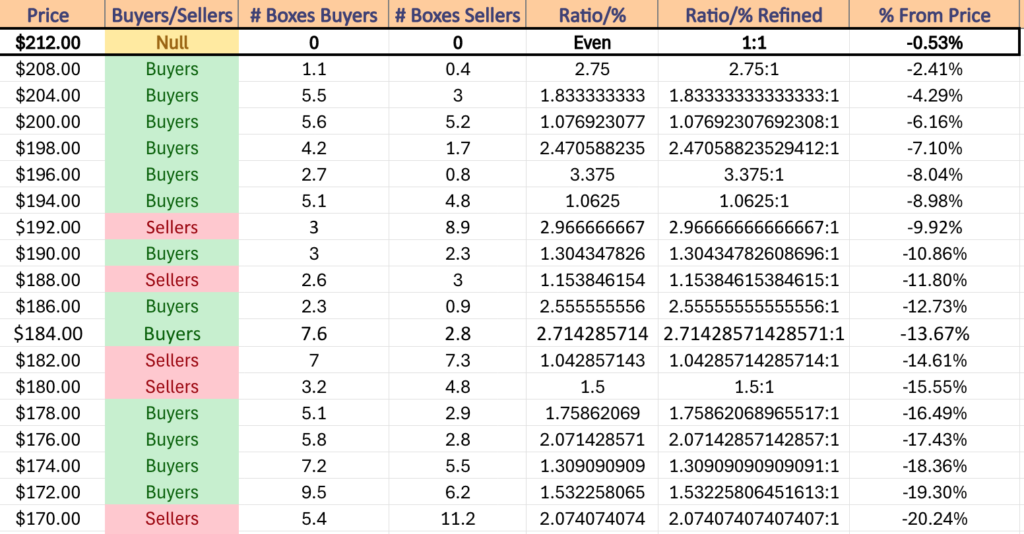
IWM has support at the $211.29 (Volume Sentiment: Buyers, 2.75:1), $209.29 (Volume Sentiment: Buyers, 2.75:1), $209.19 (Volume Sentiment: Buyers, 2.75:1) & $207.27/share (Volume Sentiment: Buyers, 1.83:1) price levels, with resistance at the $214.94/share (52-Week High, Volume Sentiment: NULL, 0:0*) price levels.
IWM ETF’s Price Level:Volume Sentiment Over The Past 1-2 Years
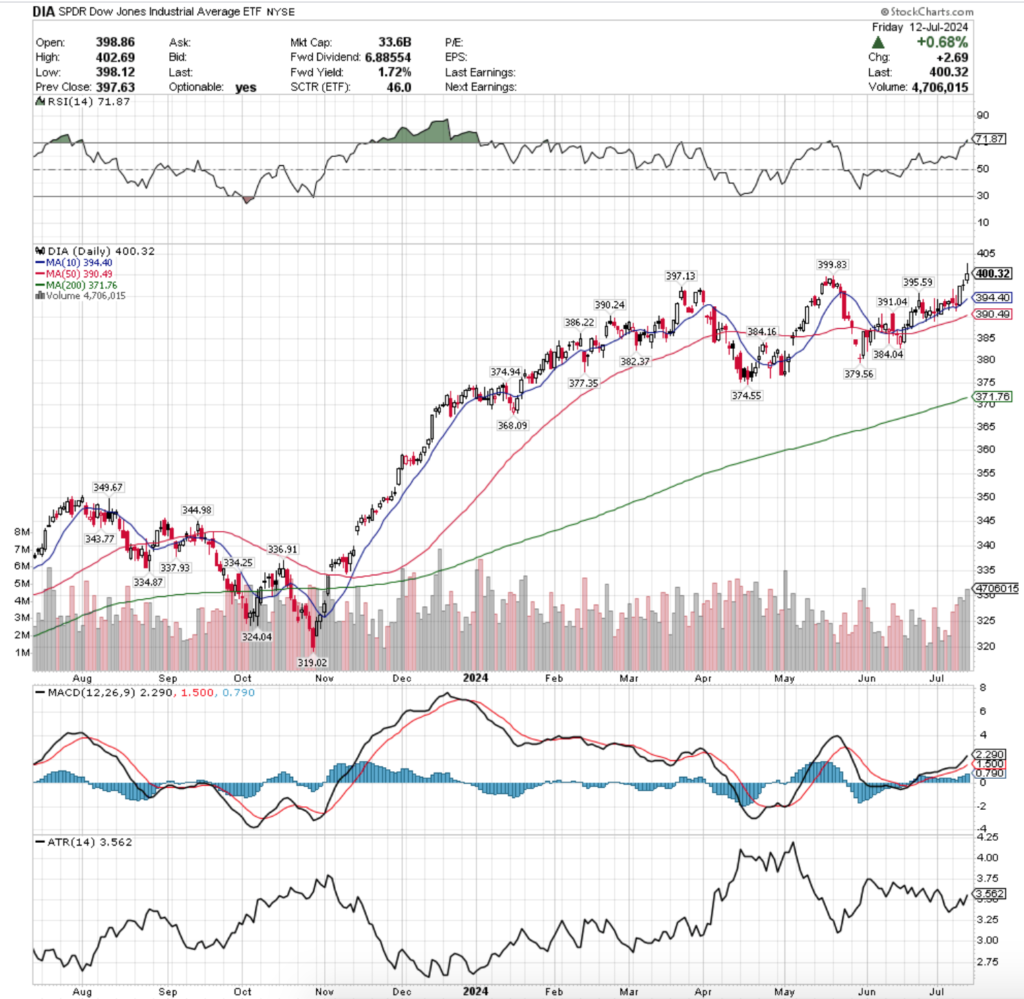
DIA ETF – SPDR Dow Jones Industrial Average ETF’s Technical Performance Over The Past Year
Their RSI just crossed into overbought territory on Friday & currently sits at 71.87, while their MACD is still bullish in the wake of the ascent that began in mid-June, which will be something to keep an eye on heading into the new week.
Volumes were the strongest for DIA last week of all the major indexes, coming in at +15.11% above average vs. the previous year (4,032,500 vs. 3,503,263), which provides some validation to the upwards price move, but is not entirely convincing just yet based on Friday’s price behavior.
DIA’s week started off on a rocky note, with Monday’s session having the lowest volumes of the week & resulting in a spinning top, indicating indecisiveness by market participants.
There was certainly a bullish appetite based on the long upper shadow, but the lower shadow also signaled that there were plenty of bears out there as well.
The 10 day moving average’s support did manage to hold up though & prices closed above it.
Tuesday was extremely similar to Monday, with less of a wise range between the open & closing prices on a declining session with slightly more volume.
Despite prices breaking temporarily below the 10 day moving average, they were able to recover & the session closed above it.
Wednesday provided a big leg up that was able to propel DIA into the close of the week, where the week’s second highest volume took an open at the 10 DMA & resulted in a +1% day-over-day gain.
The back end of the week is where trouble began brewing despite the advances.
Thursday was a showing of indecision as the session closed out as a doji just above the close of Wednesday on slightly less volume.
Friday looks at face value to have been a bullish sentiment day, but looking beneath the hood it isn’t entirely clear that that was truly the case.
DIA gapped up Friday morning on the open and based on its lower shadow briefly tested lower before powering to a new all-time high.
The troubling part comes down to the fact that the day’s candle closed as a shooting star with a slight lower shadow.
That lower shadow signals that there was still some bearish reluctance to continue higher in the direction of the opening gap during the session.
Another area of concern is the long upper shadow of the candle, as much like IWM’s Friday candle it can mean two things.
Either there was extreme optimism & most of that volume occurred due to the gap up & the bullish sentiment behind it, and or it occurred due to the long upper shadow, when market participants picked up some of their chips that they accumulated throughout the week & put them away before going into the weekend.
With this in mind, it will be wise to enter this week being prepared for some of the inflow volume of the latter end of the week to be sold as well.
DIA’s RSI is beginning to look like we may see a repeat of what occurred from mid-July 2023 to November of 2023, when overbought conditions persisted into August before declining through October.
Peak to trough that long-winded decline was -8.96% when all was said & done.
There are plenty of support levels for DIA that aren’t far off from their price as they have remained relatively bouncing around rangebound in 2024 following that steep November 2023 year end rally.
How this is impacted by any declines in the more fragile SPY or QQQ is yet to be seen, but will be something to keep an eye on should the time come.
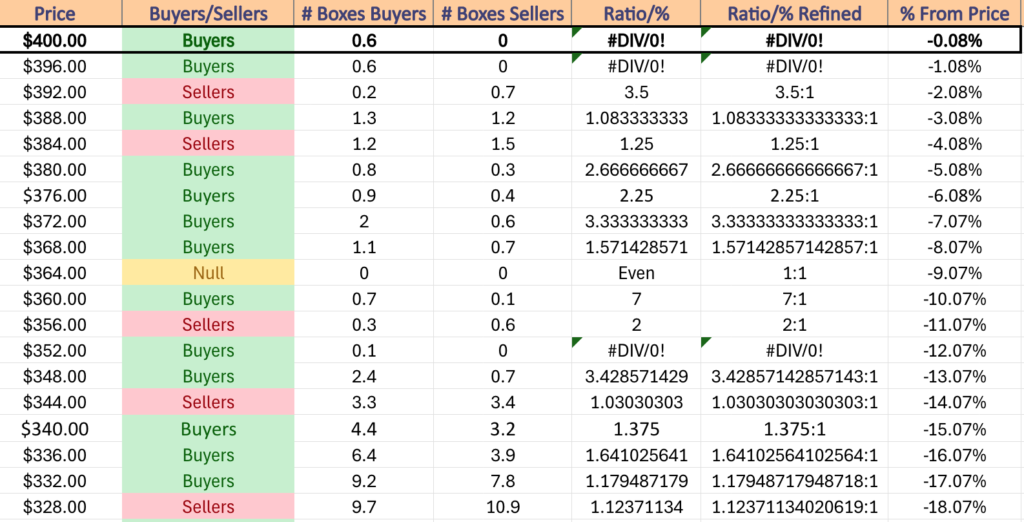
DIA has support at the $399.83 (Volume Sentiment: Buyers, 0.6:0*), $397.13 (Volume Sentiment: Buyers, 0.6:0*), $395.59 (Volume Sentiment: Sellers, 3.5:1) & $394.40/share (10 Day Moving Average, Volume Sentiment: Sellers, 3.5:1) price levels, with resistance at the $402.69/share (All-Time High, Volume Sentiment: NULL, 0:0*) price levels.
DIA ETF’s Price Level:Volume Sentiment Over The Past 3-4 Years
The Week Ahead
Monday starts the week off with Empire State Manufacturing Survey data at 8:30 am, followed by Fed Chairman Powell speaking at 12 pm.
BlackRock & Goldman Sachs report earnings before Monday’s opening bell.
U.S. Retail Sales, Retail Sales minus Autos, Import Price Index & Import Price Index minus Fuel data are all scheduled to be released at 8:30 am on Tuesday, followed by Business Inventories & Home Builder Confidence Index data at 10 am & Fed Governor Kugler speaking at 2:45 pm.
Tuesday morning begins with earnings reports from Bank of America, Morgan Stanley, PNC, Progressive, State Street & United Health Group, with Fulton Financial, Hancock Whitney, Interactive Brokers, J.B. Hunt Transport, Omnicom & Pinnacle Financial Partners scheduled to report after the closing bell.
Wednesday begins with Housing Starts & Building Permits data at 8:30 am, Industrial Production & Capacity Utilization data at 9:15 am & winds down with the Fed’s Beige Book at 2pm.
Johnson & Johnson, Ally Financial, ASML, Citizens Financial Group, Elevance Health, First Horizon, Northern Trust, Prologis, Synchrony Financial & U.S. Bancorp report earnings Wednesday morning, followed by Alcoa, Bank OZK, Cohen & Steers, Crown Castle, Discover Financial Services, Equifax, F.N.B. Corp., Home Bancshares, Kinder Morgan, Rexford Industrial Realty, SL Green Realty, Steel Dynamics, Synovus, United Airlines & Wintrust Financial reporting after the closing bell.
Initial Jobless Claims & Philadelphia Fed Manufacturing Survey data are released at 8:30 am on Thursday, before U.S. Leading Economic Indicators data comes out at 10 am.
Abbott Laboratories, Berkshire Hills Bancorp, Cintas, Commerce Bancshares, D.R. Horton, Domino’s Pizza, Hexcel, Insteel Industries, KeyCorp, M&T Bank, Manpower, Marsh & McLennan Companies, OFG Bancorp, Snap-On, Texas Capital, Textron, Virtu Financial & WNS report earnings Thursday before the opening bell, followed by Netflix, AAR Corp, Glacier Bancorp, PPG Industries, Resources Connection & Western Alliance Bancorp after the closing bell.
Friday ends on a quieter note, with NY Fed President Williams speaking at 10:40 am & Atlanta Fed President Bostic speaking at 1 pm.
American Express, Autoliv, Badger Meter, Comerica, Fifth Third Bancorp, Halliburton, Huntington Bancshares, Regions Financial, SLB & Travelers Companies are all due to report earnings before Friday morning’s opening bell.
See you back here next week!
*** I DO NOT OWN SHARES OR OPTIONS CONTRACT POSITIONS IN SPY, QQQ, IWM OR DIA AT THE TIME OF PUBLISHING THIS ARTICLE ***
Highest Technical Rated S&P 500 Components Per 7/12/2024’s Close:
1 – NVDA
2 – VST
3 – GLW
4 – SMCI
5 – AVGO
6 – TER
7 – ANET
8 – FICO
9 – LLY
10 – TRGP
Lowest Technical Rated S&P 500 Components Per 7/12/2024’s Close:
1 – WBA
2 -NKE
3 – LULU
4 – EL
5 – ALB
6 – AAL
7 – PAYC
8 – WBD
9 – MOH
10 – LW
Highest Volume Rated S&P 500 Components Per 7/12/2024’s Close:
1 – WFC
2 – NWS
3 – BK
4 – C
5 – FAST
6 – RVTY
7 – JBHT
8 – ARE
9 – POOL
10 – DAL
Lowest Volume Rated S&P 500 Components Per 7/12/2024’s Close:
1 – FOX
2 – GL
3 – TSN
4 – KKR
5 – ANSS
6 – JBL
7 – PARA
8 – HPE
9 – ADM
10 – CI
Highest Technical Rated ETFs Per 7/12/2024’s Close:
1 – NVDL
2 – NVDU
3 – USD
4 – SOXL
5 – TSLL
6 – AAPU
7 – WGMI
8 – TECL
9 – TSLR
10 – TQQQ
Lowest Technical Rated ETFs Per 7/12/2024’s Close:
1 – NVD
2 – TSDD
3 – SOXS
4 – SSG
5 – UVIX
6 – NVDS
7 – BOIL
8 – LABD
9 – NVDD
10 – JDST
Highest Volume Rated ETFs Per 7/12/2024’s Close:
1 – JHDV
2 – XBJL
3 – TJUL
4 – QQQS
5 – CLOX
6 – OCTZ
7 – GCOR
8 – BBEU
9 – IBD
10 – DIVG
Lowest Volume Rated ETFs Per 7/12/2024’s Close:
1 – XHYE
2 – IQSM
3 – MSMR
4 – JANQ
5 – QVMM
6 – FMNY
7 – VETZ
8 – FEIG
9 – NVBT
10 – SEPW
Highest Technical Rated General Stocks Per 7/12/2024’s Close:
1 – TSSI
2 – ZAPP
3 – FTEL
4 – WTO
5 – CULTF
6 -KZIA
7 – EBS
8 – FCCN
9 – WGS
10 – SMR
Lowest Technical Rated General Stocks Per 7/12/2024’s Close:
1 – CNSP
2 – AVTE
3 – GWAV
4 – DSY
5 – CRKN
6 – CJET
7 – KAVL
8 – TGL
9 – AKAN
10 – AONC
Highest Volume Rated General Stocks Per 7/12/2024’s Close:
1 – SLG
2 – OUT
3 – VEV
4 – SNTG
5 – LTRY
6 – XRTX
7 – UNIT
8 – QLGN
9 – NISN
10 – NSA
Lowest Volume Rated General Stocks Per 7/12/2024’s Close:
1 – ACKRF
2 -PRKR
3 – PAIYY
4 – NROM
5 – CAPC
6 – BRSHF
7 – MACE
8 – GENGF
9 – DBLVF
10 – DTEGF
*** THE LIST ABOVE IS STRICTLY FOR INFORMATIONAL PURPOSES – I MAY OR MAY NOT HAVE OR INITIATE A LONG, SHORT, OR LONG/SHORT POSITION IN ANY NAME ABOVE AT ANY TIME ***
Highest Technical Rated S&P 500 Components Per 7/11/2024’s Close:
1 – NVDA
2 – VST
3 – GLW
4 – AVGO
5 – TER
6 – SMCI
7 – ANET
8 – NTAP
9 – FICO
10 – CEG
Lowest Technical Rated S&P 500 Components Per 7/11/2024’s Close:
1 – WRB
2 – WBA
3 – NKE
4 – EL
5 – LULU
6 – ALB
7 – AAL
8 – PAYC
9 – MOH
10 – EPAM
Highest Volume Rated S&P 500 Components Per 7/11/2024’s Close:
1 – DAL
2 – COST
3 – CAG
4 – AAL
5 – COO
6 – BXP
7 – TSLA
8 – UAL
9 – CME
10 – DHI
Lowest Volume Rated S&P 500 Components Per 7/11/2024’s Close:
1 – FDS
2 – GL
3 – PARA
4 – NRG
5 – HPE
6 – DVA
7 – TSN
8 – DFS
9 – CTRA
10 – LYV
Highest Technical Rated ETFs Per 7/11/2024’s Close:
1 – NVDL
2 – NVDU
3 – USD
4 – SOXL
5 – FNGG
6 – AAPU
7 – JNUG
8 – TECL
9 – TSLL
10 – TQQQ
Lowest Technical Rated ETFs Per 7/11/2024’s Close:
1 – NVD
2 – TSDD
3 – SSG
4 – SOXS
5 – BOIL
6 – UVIX
7 – NVDS
8 – LABD
9 – JDST
10 – NVDD
Highest Volume Rated ETFs Per 7/11/2024’s Close:
1 – BHYB
2 – PWER
3 – LSGR
4 – ROE
5 – UTWY
6 – SPAQ
7 – MSTI
8 – CGSM
9 – ESGY
10 – ZTEN
Lowest Volume Rated ETFs Per 7/11/2024’s Close:
1 – USDU
2 – JOET
3 – SLVP
4 – PJIO
5 – VONE
6 – CLOI
7 – BOND
8 – KAPR
9 – IDOG
10 – IXN
Highest Technical Rated General Stocks Per 7/11/2024’s Close:
1 – KZIA
2 – AHFD
3 – TSSI
4 – AEHL
5 – FCCN
6 – FTEL
7 – CULTF
8 – ZAPP
9 – WGS
10 – WTO
Lowest Technical Rated General Stocks Per 7/11/2024’s Close:
1 – LSDIF
2 – AUSAF
3 – AETHF
4 – BRSHF
5 – NAVB
6 – MYLKF
7 – ECPN
8 – JUVAF
9 – HLVX
10 – BBIG
Highest Volume Rated General Stocks Per 7/11/2024’s Close:
1 – LCFY
2 – NEXI
3 – TWO
4 – FORD
5 – RNLX
6 – BDRX
7 – IFNNF
8 – SNTG
9 – CYN
10 – SLRX
Lowest Volume Rated General Stocks Per 7/11/2024’s Close:
1 – BCTF
2 – QTRHF
3 – PFLC
4 – EUBG
5 – BABYF
6 – WTER
7 – ENZN
8 – OTTW
9 – CKX
10 – WLGS
*** THE LIST ABOVE IS STRICTLY FOR INFORMATIONAL PURPOSES – I MAY OR MAY NOT HAVE OR INITIATE A LONG, SHORT, OR LONG/SHORT POSITION IN ANY NAME ABOVE AT ANY TIME ***
The CBOE Volatility Index is often referred to by investors & market pundits as “fear & greed index”, as it provides a view of future volatility in the near-to-mid-term that is reported as an annualized figure.
At a high level, it is calculated as a measure of at & out-of-the-money S&P 500 index options put & call contracts for the next two standard expiration dates that have over eight days until their expiration (up until there are two consecutive strike prices with no posted bid-ask pricing).
The midpoint of the bid-ask spread for the nearest at-the-money options in the series is then used to ultimately create a forward price for a synthetic option for the S&P 500 & the implied volatility of the synthetic option is what is quoted as the VIX on television & in newspapers.
The implied volatility is an annualized estimate of how much the price of the underlying security (in this case the S&P 500’s synthetic option) may move based on how market participants are currently buying & selling the security.
With this in mind, it can be inferred that there is a strong link between optimism/pessimism related to the S&P 500’s performance & the VIX reading, as more options tend to be traded when investors need protection from volatility (buying puts or selling out-of-the-money calls) leading to a higher VIX reading when the S&P 500 declines.
Using SPY as a proxy (the S&P 500 ETF) the relationship between the VIX reading, daily SPY changes & changes in trading volume will be examined in the following article.
Note that the date range used for historic data was 7/10/2023 to the closing data of 7/9/2024, resulting in 251 sessions of usable data (given that the one-day implied S&P 500 move based on a VIX closing price is a reflection of tomorrow’s change, not that same day’s closing price).
Examining The Relationship Between The VIX, SPY & Daily Volume
The closing VIX reading for 7/10/2023 was 15.07, while SPY’s closing price that day was $433.595, implying that SPY would close within a range of +/-0.95% on 7/11/2023 (30 Day/1 Month implied move of +/-4.36%).
The following day SPY closed at $436.36, a change of +0.64%, meaning that it fell within the VIX’s predicted one day implied volatility.
SPY’s volume increased by 3.24% day-over-day, with 7/10/2023’s volume being 62,443,500 & 7/11/2023’s volume being 64,463,800.
As mentioned above, there were 251 total session’s used in this article (as it began being written before 7/10/2024’s close).
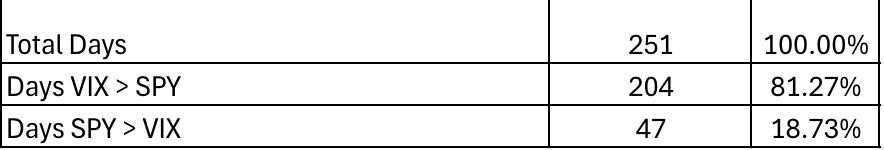
The VIX proved to be a fairly accurate calculation, as 81.3% (204 sessions) of the time in the past year the price of SPY closed within the range of the VIX reading, with 18.3% of the time (47 sessions) SPY outperforming it to the upside or the downside (recall that the VIX does not provide a direction of the movement, just the magnitude of it).
81.3% Of The Past Year’s Sessions The VIX Has Correctly Anticipated The Range Of Movement Of SPY For The Next Day’s Session, While 18.7% Of Sessions SPY Closed Outside Of The VIX’s One Day Implied Price Range
When looking at it from the perspective of a five day trading week, over the past year each week had about four days where SPY closed within the VIX’s predicted range, with roughly one day per week where it closed with a higher variance level than the VIX indicated (recall that it is predicting that moves will come in either direction, up or down).
When we isolate the times that SPY closed above or below the reading that the VIX implied, we find that 76.6% of the time (36 sessions) SPY had higher volumes than the previous day.
This would be expected, as often more volatile sessions are accompanied with higher trading volume, leaving 11 sessions (23.4%) occurring on days where the day-over-day volume change was lower than the day before.
In 76.6% Of Sessions In The Past Year When SPY Closed Outside Of The VIX’s Predicted One Day Range SPY’s Day-over-Day Volume Was Higher Than The Previous Day
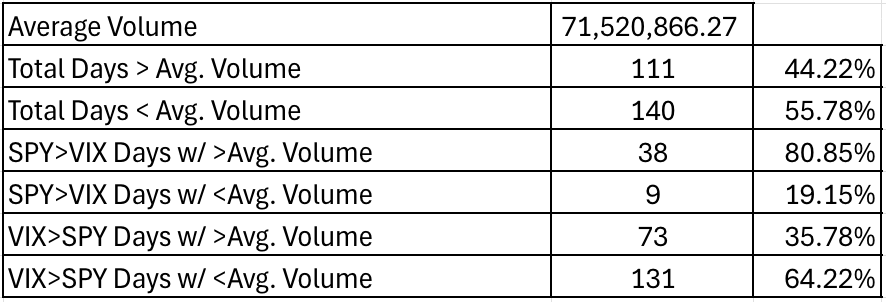
The average volume that SPY traded at during the time outlined above was 71,520,866.27, making it worth digging into how each sessions’ average volume fared in relation to SPY’s performance & the VIX.
In total, 111, or 44.2% of all days traded above that average volume quoted above, while 140 sessions (55.8%) traded below it.
For the sessions where SPY traded at a greater daily variance than what was predicted by the VIX, 80.85% of sessions (38) occurred on volumes that were above the annual average.
19.15% of sessions (9) where SPY traded outside of the predicted range of the VIX occurred on sessions with below average volume.
Looking at days where SPY closed within the range that the VIX predicted things look quite different, with only 35.8% of sessions (73) having above average volume & 64.2% of sessions (131) occurring with lower than average volume.
This can in part be explained by the dramatically larger sample size & the nature of the calculation, but was worth examining to see how the numbers fell in line with the other data points listed.
Comparing The One-Day Returns Of SPY Relative To The VIX’s One-Day Implied Range Of S&P 500 Movement In Relation To Each Session’s Volumes Vs. The Annual Average Volume
Tying It All Together
As we can see, the VIX does a pretty solid job of predicting the one day range that SPY prices will land in the following day.
While the performance may change if we changed the range to more than one year, 251 sessions is significant enough to draw conclusions from.
One thing to note is that while there has been some volatility in that sample size, the largest peak to trough drawdown was -9.5%, so expanding the sample size to include more years with greater volatility would likely change the results (such as past 2022, when there was a -26.6% decline peak to trough at the beginning of the year).
This is something that should be kept in mind in the event that there is increased volatility compared to the past year if referencing these results.
It is certainly something to keep in the back of one’s mind when watching intra-day sessions that have volumes that are higher than average out of the gate at the open/by midday, although other nearby candles & possible pattern formations should also be assessed before using it to make live predictions.
As always, this is not intended to be financial advice, just some observations about past market performance.
*** THIS IS NOT INTENDED TO SERVE AS FINANCIAL ADVICE, BUT RATHER AN ANALYSIS OF PAST MARKET BEHAVIOR – AS ALWAYS, DO YOUR OWN DUE DILIGENCE BEFORE PARTICIPATING IN FINANCIAL MARKETS ***
Highest Technical Rated S&P 500 Components Per 7/10/2024’s Close:
1 – NVDA
2 – VST
3 – GLW
4 – TSLA
5 – AVGO
6 – TER
7 – SMCI
8 – KLAC
9 – AMAT
10 – ANET
Lowest Technical Rated S&P 500 Components Per 7/10/2024’s Close:
1 – WBA
2 – NKE
3 – LULU
4 – EL
5 – PAYC
6 – ALB
7 – EPAM
8 – DAY
9 – POOL
10 – MOH
Highest Volume Rated S&P 500 Components Per 7/10/2024’s Close:
1 – CTLT
2 – KMX
3 – CNP
4 – DRI
5 – PTC
6 – MA
7 – GLW
8 – DECK
9 – AMD
10 – BDX
Lowest Volume Rated S&P 500 Components Per 7/10/2024’s Close:
1 – GL
2 – AES
3 – RMD
4 – JNPR
5 – COR
6 – ZBH
7 – TRGP
8 – MRK
9 – GM
10 – SPG
Highest Technical Rated ETFs Per 7/10/2024’s Close:
1 – NVDL
2 – NVDU
3 – USD
4 – SOXL
5 – TSLL
6 – TSLR
7 – FNGG
8 – TECL
9 – AAPU
10 – TQQQ
Lowest Technical Rated ETFs Per 7/10/2024’s Close:
1 – NVD
2 – TSDD
3 – SOXS
4 – SSG
5 – NVDS
6 – UVIX
7 – BOIL
8 – NVDD
9 – TECS
10 – MSOX
Highest Volume Rated ETFs Per 7/10/2024’s Close:
1 – SPCZ
2 – KOKU
3 – PUTD
4 – WEIX
5 – JANP
6 – VETZ
7 – CGRO
8 – XVOL
9 – IDEC
10 – USVN
Lowest Volume Rated ETFs Per 7/10/2024’s Close:
1 – SCHM
2 – FEDZ
3 – TDTF
4 – FTEC
5 – DUSB
6 – VEGI
7 – PGX
8 – SMCF
9 – USD
10 – YYY
Highest Technical Rated General Stocks Per 7/10/2024’s Close:
1 – FTEL
2 – ZAPP
3 – TSSI
4 – AEHL
5 – FCCN
6 – WTO
7 – WGS
8 – EBS
9 – MEDS
10 – MDIA
Lowest Technical Rated General Stocks Per 7/10/2024’s Close:
1 – LSDIF
2 – BRSHF
3 – MIMOQ
4 – CNCT
5 – NAVB
6 – JUVAF
7 – HLVX
8 – MAXN
9 – FTCHF
10 – CDT
Highest Volume Rated General Stocks Per 7/10/2024’s Close:
1 – KZIA
2 – OUT
3 – SLG
4 – GXAI
5 – AP
6 – NAAS
7 – SEEL
8 – MAMA
9 – MRIN
10 – WHLR
Lowest Volume Rated General Stocks Per 7/10/2024’s Close:
1 – MGRX
2 – ALUR
3 – RSTN
4 – MINM
5 – IINN
6 – GROM
7 – BROG
8 – PIK
9 – UURAF
10 – CCM
*** THE LIST ABOVE IS STRICTLY FOR INFORMATIONAL PURPOSES – I MAY OR MAY NOT HAVE OR INITIATE A LONG, SHORT, OR LONG/SHORT POSITION IN ANY NAME ABOVE AT ANY TIME ***
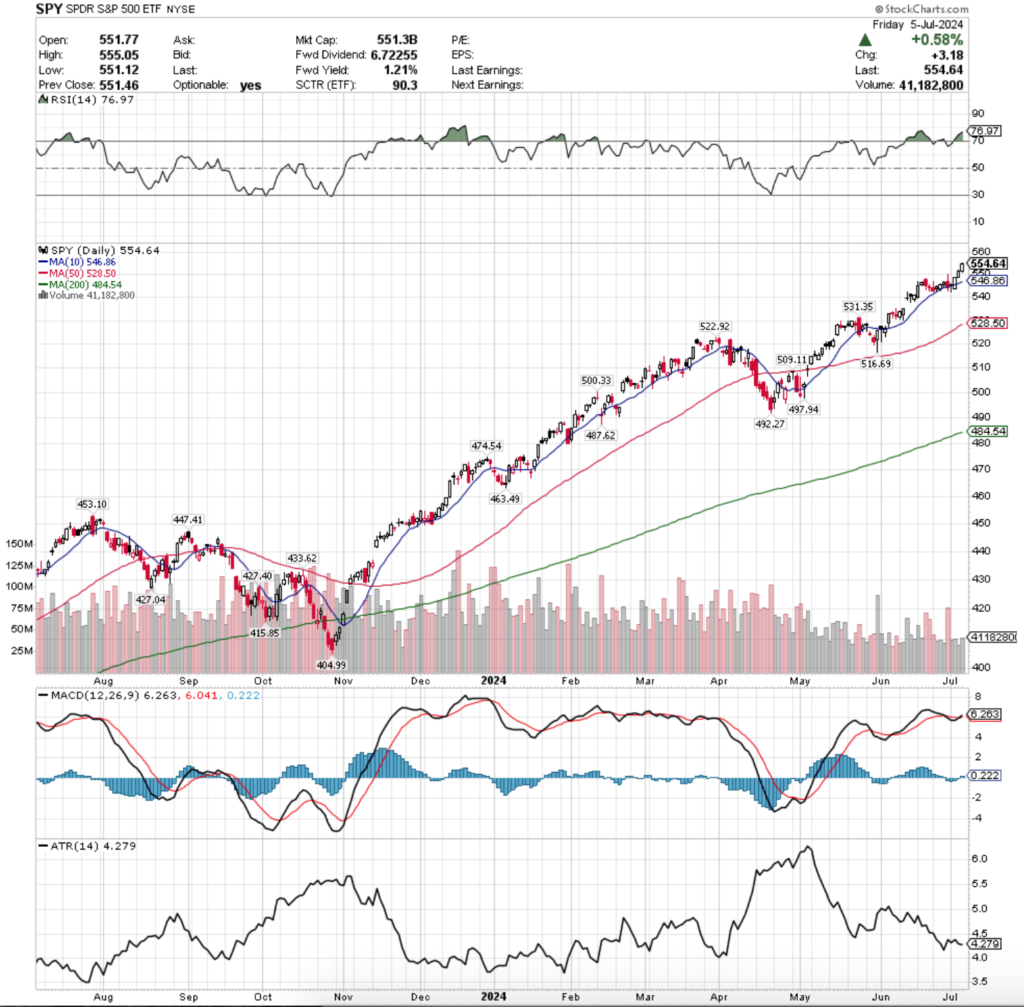
SPY, the SPDR S&P 500 ETF gained +1.91%, as weak volumes continued to plague the major index ETFs, while the VIX closed the week out at 12.48, implying a one day move of +/-0.79% & a one month implied move of +/-3.61%.
SPY ETF – SPDR S&P 500 ETF’s Technical Performance Over The Past Year
Volumes were well below average for the ninth consecutive week, coming in at -46.16% below the year prior’s average volume (38,725,950 vs. 71,930,498), which as we’ve noted each week is an area of increasing concern.
Despite the Fourth of July holiday & the half day trading session on the third reducing the week by ~30% there was still frothy light volume for now the ninth consecutive week.
While it is summertime, the low levels are still indicative of fear & reluctance to dive into markets while most of major indexes sit near all-time highs.
Monday signaled that the week ahead was likely in line with most peoples’ expectations, weak volume, but advancing.
A dragonfly doji set the stage for SPY to climb for the rest of the week, although the open & close were relatively in line with the 10 day moving average, which while it indicates that there is some strength in it as a support level, should be a cause of concern.
The rest of the week (which again, was 70% of a regular week in terms of the hours the market was open) continued to climb above the 10 DMA, but on volumes that looked more like the attendance at a kindergarten soccer game vs. a publicly traded ETF following the S&P 500.
Their RSI has climbed back into overbought territory after the surprise advances of the past week & currently sits at 76.97, while their MACD has crossed over bullishly, but is still tightly hugging the signal line.
While folks will say there is a stronger trend when candles are covering a wider range (particularly with little to no shadows), there is very little conviction behind the recent price movements.
This upcoming week has limited data releases aside from the CPI/PPI prints on Thursday & Friday, but earnings season is revived with the first of the big banks scheduled to report on Friday.
Indicators & oscillators suggest that the time for a mid-summer cool off is upon us, and the biggest question for most right now is what’s going to cause it?
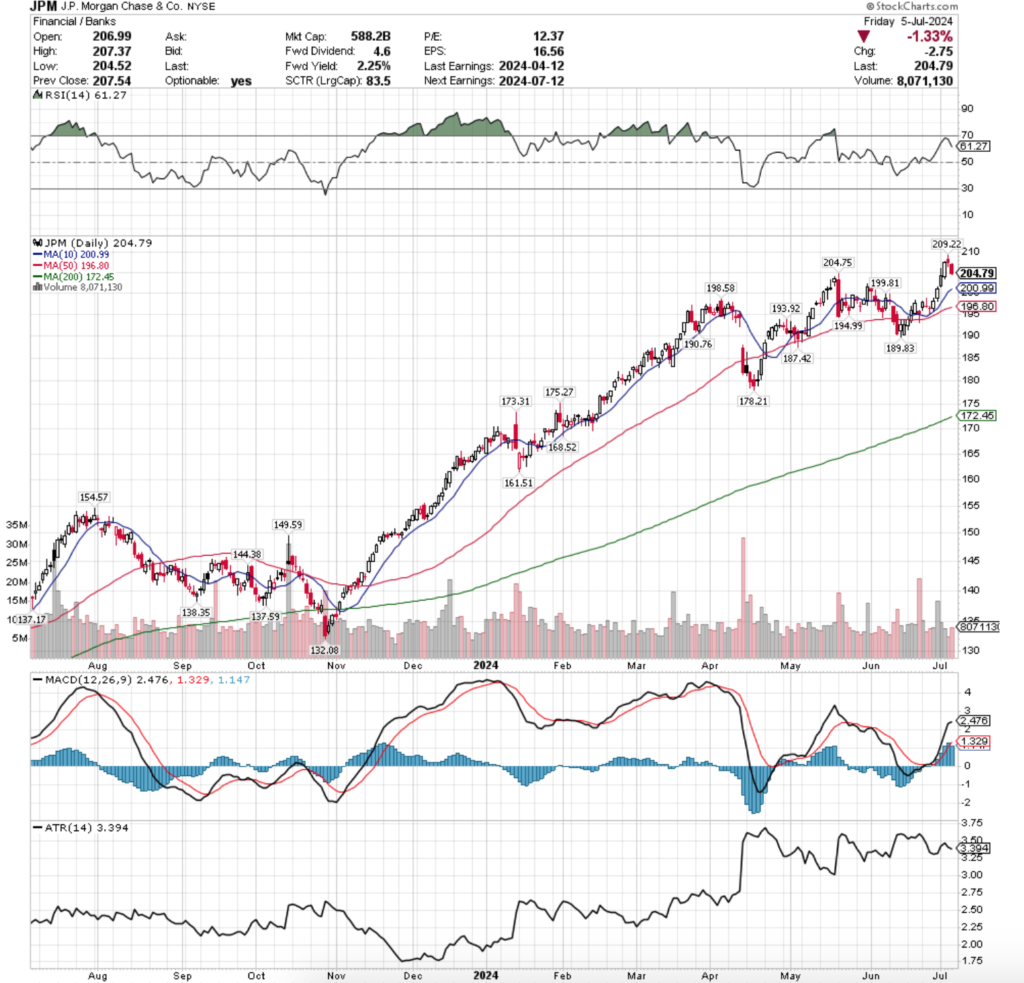
JPM’s chart’s evening star pattern seems to think so (per Sunday night reading, vacation time so this won’t be published until Wednesday PM) & bank stocks control the spigot that supplies the market hose (also hat tip to Jaime Dimon as this may be the first time a weekly post has featured an individual stock name).
JPM’s Technical Performance Over The Past Year
Not much has changed in terms of what to look at for SPY from last week’s note given the nature of how it traded & on the shorter time frame.
While they managed a new all-time high, the amount of conviction & sentiment behind the move was minimal at best & it appears that we’re skating on thin ice.
Based on the prolonged low volumes (9 weeks now), it is hard to imagine much of a catalyst given where markets stand now that would be able to power SPY & co. much higher in the near-term.
As noted last week, it’s still more of a question of whether we have a small consolidation or outright correct.
Volatility decreased slightly last week, but again, not much has changed from last week in terms of what to keep an eye on.
SPY has support at the $546.86 (All-Time High, Volume Sentiment: NULL, 0:0*), $531.35 (Volume Sentiment: NULL, 0:0*), $528.50 (50 Day Moving Average, Volume Sentiment: NULL, 0:0*) & $522.92/share (Volume Sentiment: Even, 1:1) price levels, with resistance at the $555.05/share (All-Time High, Volume Sentiment: NULL, 0:0*) price level.
SPY ETF’s Price Level:Volume Sentiment Over The Past 1-2 Years
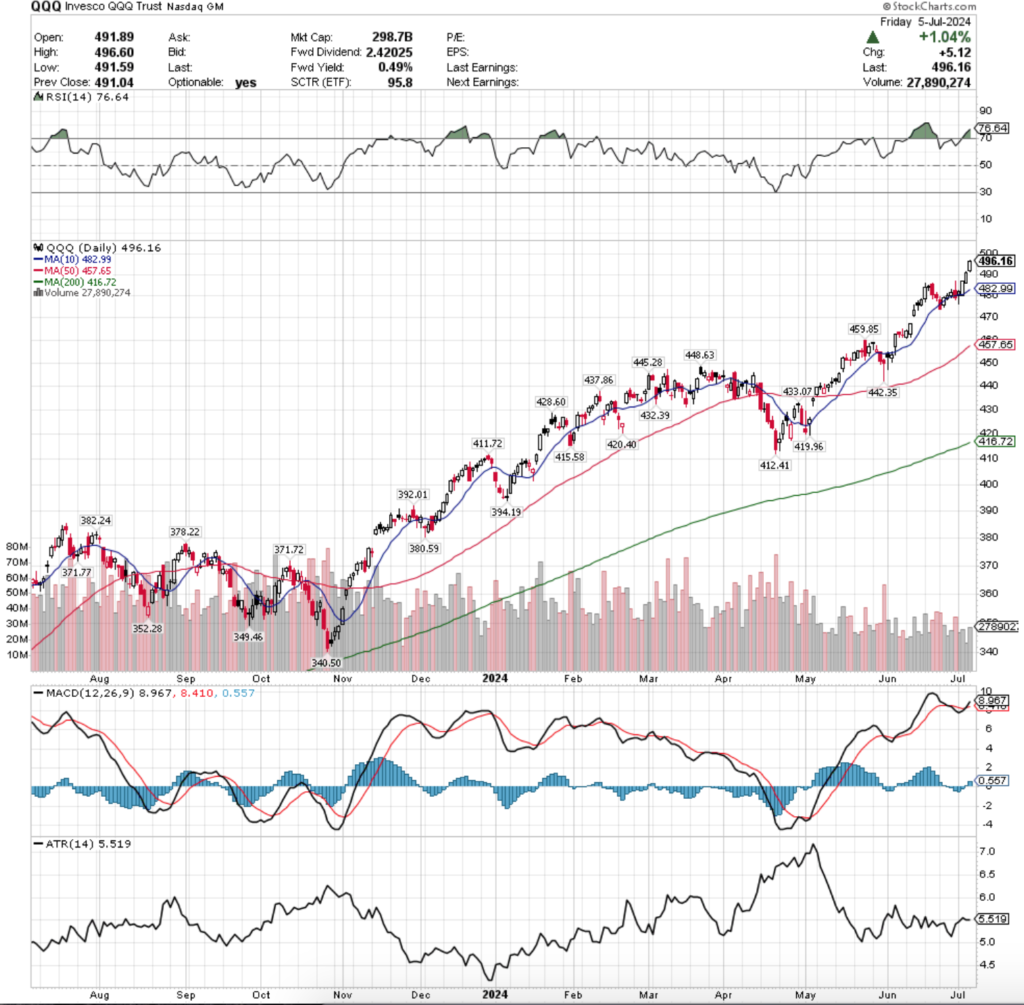
QQQ, the Invesco QQQ Trust ETF that tracks the NASDAQ 100, had the strongest week of the major four index ETFs, advancing 3.56%.
QQQ ETF – Invesco QQQ Trust ETF’s Technical Performance Over The Past Year
Their RSI has also trended into overbought territory & is currently 76.64, while their MACD has crossed over bullishly in the past week.
Volumes were -45.52% below the year prior’s average volume (24,538,100 vs. 45,038,444), as much like SPY & the other major index ETFs, everybody’s moved.
The primary difference between QQQ’s chart & SPY’s chartis the hammer candle from Monday’s session.
This indicated more conviction behind the move higher, contributing to QQQ being the strongest performing major index ETF of the four.
With the fluffy volume last week’s primary areas to look at are all still in play, perhaps we learn that last week was a silent squeeze.
For those that missed last week’s note, the strength of the 10 day moving average will set the stage for the next 3-4 weeks for QQQ & SPY.
The new all-time highs only make the declines more troubling, given that the primary support level is the 10 DMA, which is moving higher by its nature & becoming more decoupled from the regular price point support levels.
There is next to no volume strength at these levels, making a consolidation easily able to turn into a more serious decline.
CPI/PPI aren’t necessarily what market participants are holding in as high of regard for an inflation read vs. PCE, so what happens during earnings calls starting Friday will likely be what queues an issue, as it seems unlikely that folks have been holding out this much eagerly anticipating earnings reports to dive back into the pool.
For last week’s post & the areas to continue watching see here.
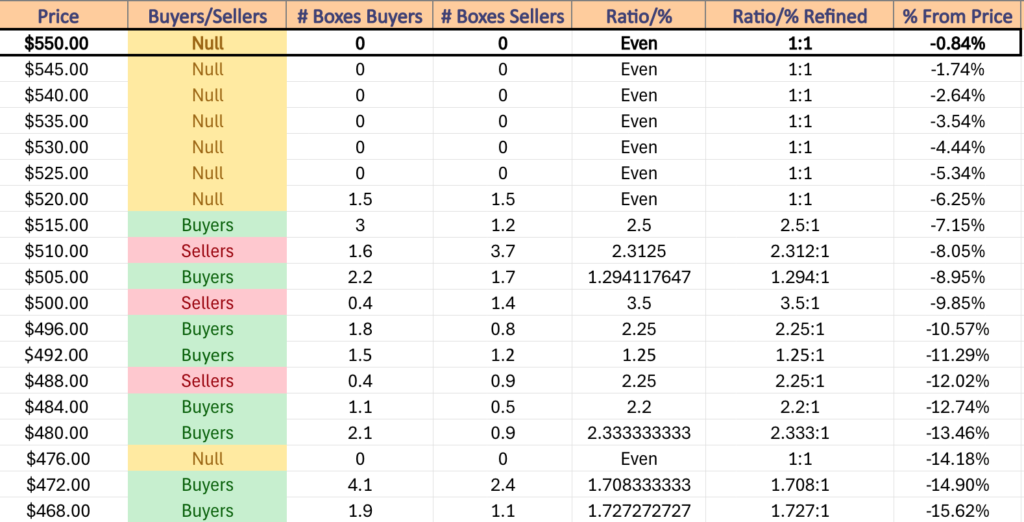
QQQ has support at the $482.99 (10 Day Moving Average, Volume Sentiment: NULL, 0:0*), $459.85 (Volume Sentiment: NULL, 0:0*), $457.65 (50 Day Moving Average, Volume Sentiment: NULL, 0:0*) & $448.63/share (Volume Sentiment: NULL, 0:0*) price levels, with resistance at the $496.60/share (All-Time High, Volume Sentiment: NULL, 0:0*) price level.
QQQ ETF’s Price Level:Volume Sentiment Over The Past 1-2 Years
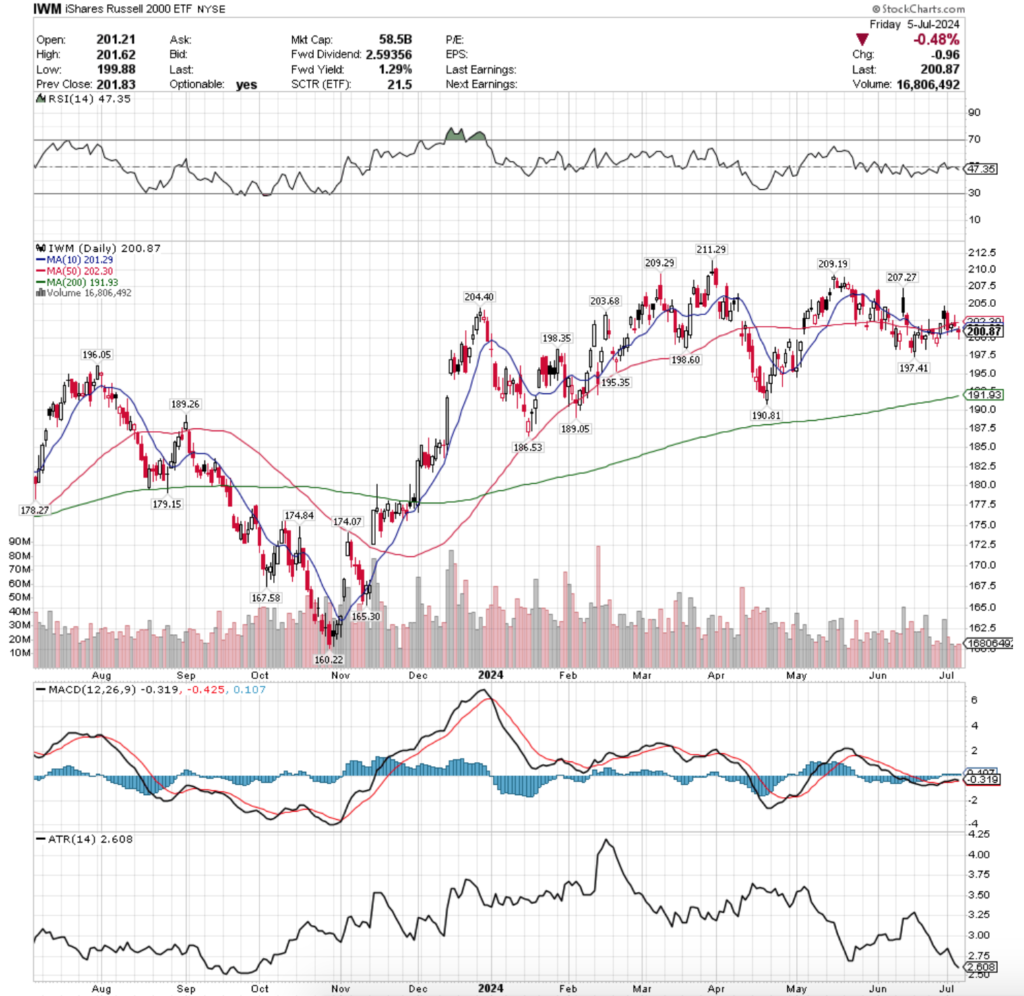
IWM ETF – iShares Russell 2000 ETF’s Technical Performance Over The Past Year
Their RSI is trending downward from the neutral level & sits currently at 47.35, while their MACD has been bullish, but remains tightly hugging the signal line due to the recent consolidation range IWM has traded in.
Volumes were -46.43% below average compared with the year prior (17,881,775 vs. 33,382,304), as even the small cap index can’t escape the lazy summer participation.
As has been noted every week for some time now, IWM & DIA charts have decoupled from SPY & QQQ for a while now, as AI names & other major tech components of the former indexes have helped keep them moving higher, while the former have spent more time consolidating.
What becomes more troubling about this is that since early May IWM has been consolidating alongside DIA, while SPY & QQQ have continued marching higher.
In the event of a consolidation or correction in SPY & QQQ, a large question becomes whether that will cause an equal reaction from IWM & DIA, or if it will cause some sort of pivot into their components & they will avoid major losses.
Monday last week began on a bearish note with prices opening mid-way through Friday’s range, testing below the support of both the 10 & 50 day moving averages, before ultimately settling just above the 10 DMA, but below the 50 DMA on the week’s highest volume session.
Tuesday made an attempt to break back above the 50 DMA, but was unsuccessful & closed just beneath it, but cracks were shown in IWM as prices temporarily dipped beneath the 10 DMA as well.
The weakness was confirmed with Wednesday & Friday’s sessions, when on Wednesday prices opened in line with the 50 day moving average before bounding higher to above the 50 day moving average, only to close lower, closer to in-line with the prior day’s close on the weakest volume of the week.
It should be noted that Wednesday was a half-day & should it have been a full session it was possibly going to be the highest volume of the week, but the candle closed as what would have been a shooting star if it occurred in a true uptrend, indicating bearish feeling.
The trouble continued into the close of the week when prices opened on a gap down in-line with the 10 DMA, only to temporarily dip above it before testing far below it & closing beneath the support of the 10 DMA.
The strength of the support zone between $197-198.60 will be a key area of focus in the coming weeks now that prices have broken down beneath the 10 & 50 day moving averages & while we await more meaningful volume to indicate strength of sentiment of IWM traders.
For last week’s post & the areas to continue watching see here.
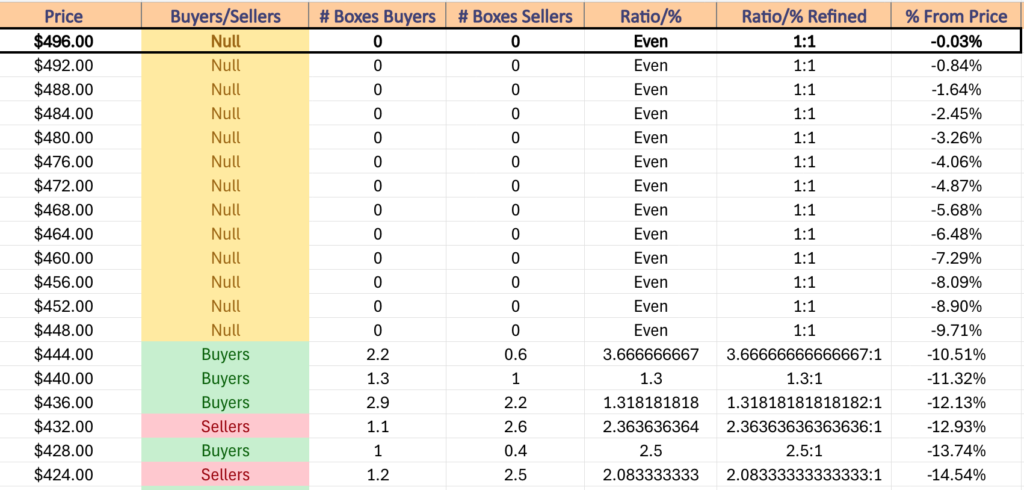
IWM has support at the $198.60 (Volume Sentiment: Buyers, 2.47:1), $198.35 (Volume Sentiment: Buyers, 2.47:1), $197.41 (Volume Sentiment: Buyers, 3.38:1) & $195.35/share (Volume Sentiment: Buyers, 1.06:1) price levels, with resistance at the $201.29 (10 Day Moving Average, Volume Sentiment: Buyers, 1.08:1), $202.30 (50 Day Moving Average, Volume Sentiment: Buyers, 1.08:1), $203.68 (Volume Sentiment: Buyers, 1.08:1) & $204.40/share (Volume Sentiment: Buyers, 1.83:1) price level.
IWM ETF’s Price Level:Volume Sentiment Over The Past 1-2 Years
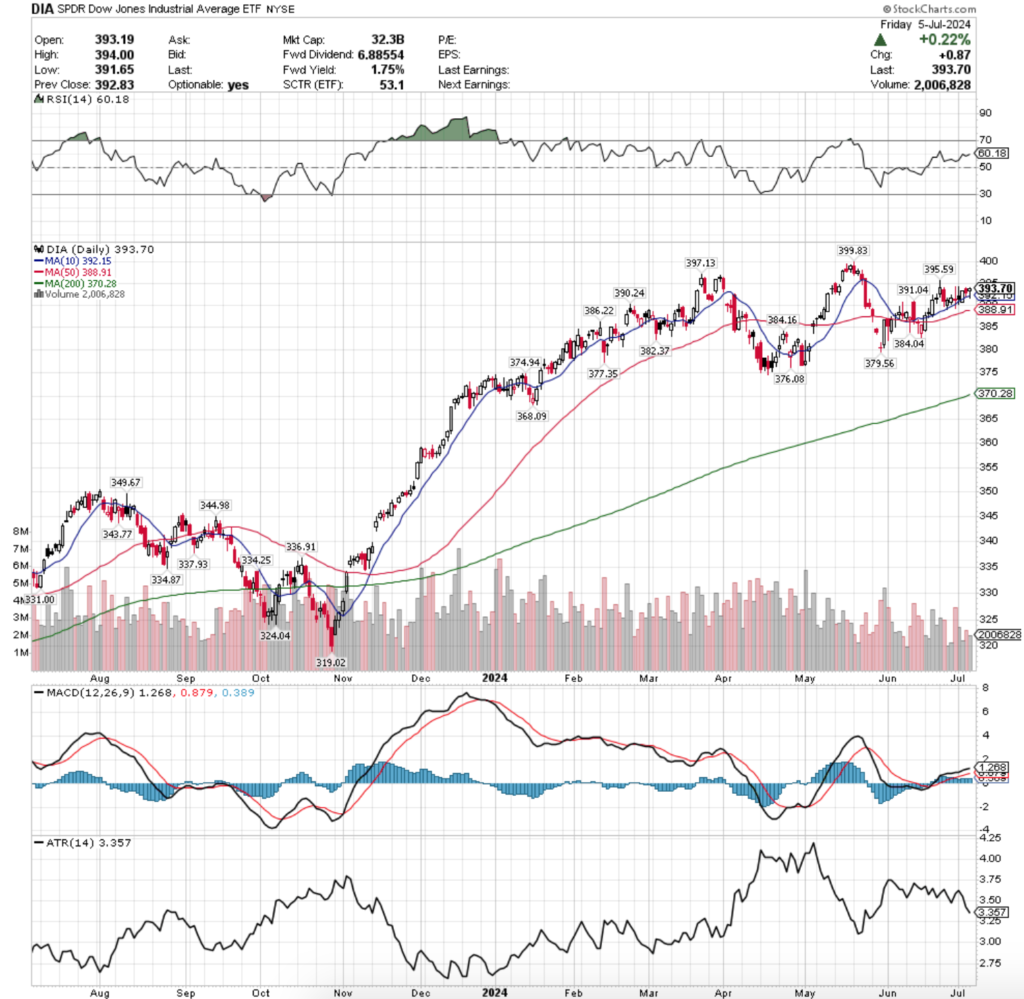
DIA ETF – SPDR Dow Jones Industrial Average ETF’s Technical Performance Over The Past Year
Their RSI is trending towards overbought (70) & currently sits at 60.18. while their MACD has stayed bullish following their recent consolidation.
Volumes were -38.48% below average compared with the year before’s average volumes (2,144,550 vs. 3,485,855), where it appears investors were doing the bare minimum to keep it afloat above the support of the 10 DMA.
Monday began DIA’s week on a weak outlook, where despite the week’s highest volumes prices were unable to crack above the prior Friday’s high & ultimately closed below where they opened just in-line with the 10 DMA’s support.
Tuesday opened below the 10 DMA, but was able to rally & push higher to close higher, but it should be viewed with a skeptical eye as despite completing the bullish engulfing 2 day pattern, the day’s wide range was not supported by the low volume.
Wednesday came in bearish for DIA, opening higher but showing that there was still more downside appetite than upside, as it tested the support of the 10 DMA, but ultimately closed just beneath Tuesday’s close.
It should be noted that the downside volume on Wednesday was slightly less than the upside volume on Monday, calling into question/further confirming the skeptical eye mentioned regarding Tuesday’s price action.
Friday ended the week on a further note of uncertainty, as the case for the bulls heading into the weekend was that the open-close price action was concentrated at the top of the day’s candle, but the reality of it was that the high of the day failed to break out of the recent high-range & the low of the day broke through the 10 DMA’s support.
The coming week’s performance will hinge upon whether or not that high range can be broken out of & or if the support of the 10 & 50 DMAs will be broken to the downside.
Their recent ascending triangle forming indicates that there is more appetite at the top of their recent trading range, but the lackluster volumes of the past couple of months don’t provide as much confirmation as one would like to see.
For last week’s post & the areas to continue watching see here.
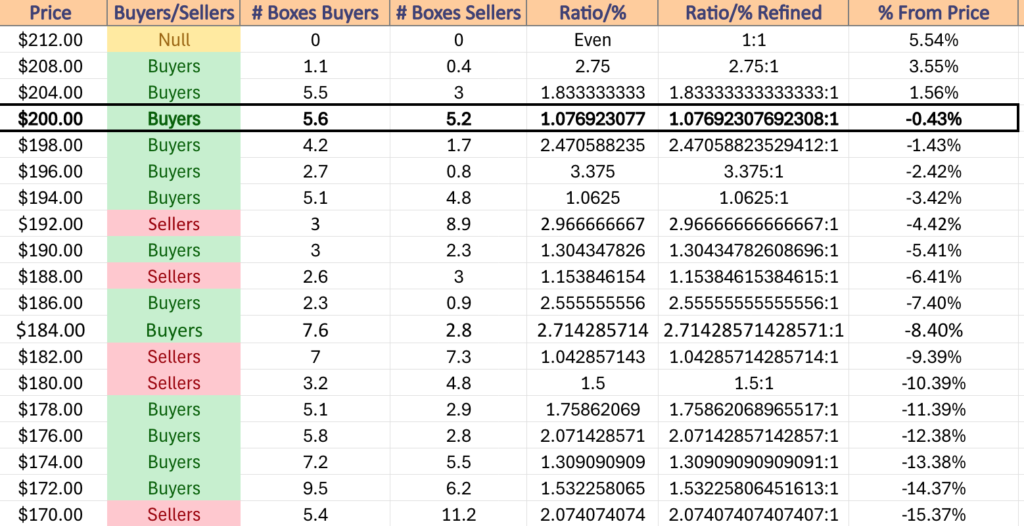
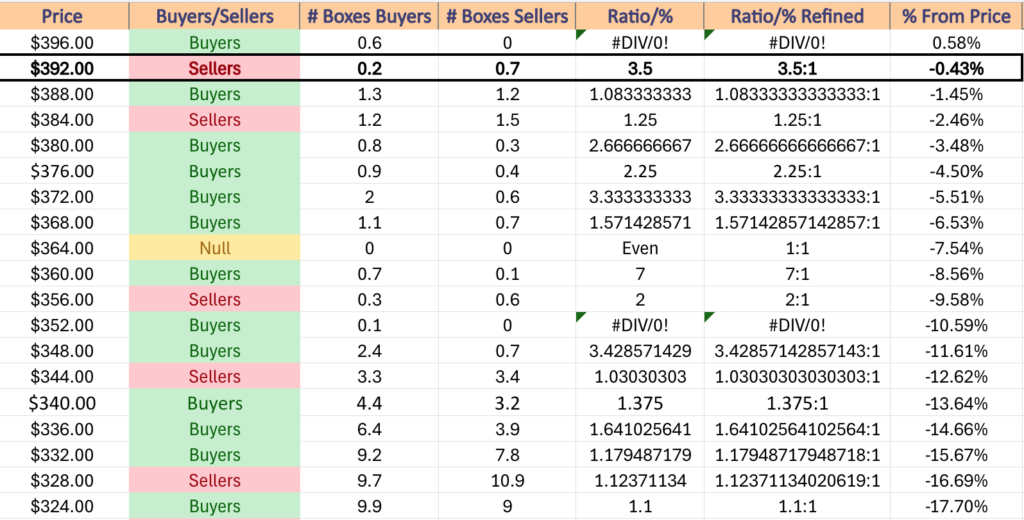
DIA has support at the $392.15 (10 Day Moving Average, Volume Sentiment: Sellers, 3.5:1), $391.04 (Volume Sentiment: Buyers, 1.08:1), $390.24 (Volume Sentiment: Buyers, 1.08:1) & $388.91/share (50 Day Moving Average, Volume Sentiment: Buyers, 1.08:1) price levels, with resistance at the $395.59 (Volume Sentiment: Sellers, 3.5:1), $397.13 (Volume Sentiment: Buyers, 0.6:0*) & $399.83/share (All-Time High, Volume Sentiment: Buyers, 0.6:0*) price level.
DIA ETF’s Price Level:Volume Sentiment Over The Past 3-4 Years
The Week Ahead
Next week begins on a slow note with Consumer Credit data released on Monday at 3pm.
Greenbrier reports earnings on Monday morning before the opening bell.
Tuesday brings us NFIB Optimism Index data at 6 am.
Helen of Troy reports earnings before Tuesday’s opening bell, before SMART Global reports after the close of trading.
Wholesale Inventories data is scheduled to be released Wednesday at 10 am.
Wednesday’s earnings calls include AZZ, PriceSmart &WD-40, all due to report after the closing bell.
Things heat up on Thursday with Initial Jobless Claims, Consumer Price Index, XPI Year-over-Year, Core CPI & Core CPI Year-Over-Year data at 8:30 am, followed by St. Louis Fed President Musalem speaking at 1pm &Monthly U.S. Federal Budget data at 2 pm.
Thursday morning kicks off with earnings from Delta Air Lines & Pepsi Co.
Friday the week wraps up with Producer Price Index, PPI Year-over-Year, Core PPI & Core PPI Year-over-Year data at 8:30 am, followed by Consumer Sentiment (prelim) data at 10 am.
Big bank earnings come back to town Friday, starting with JP Morgan Chase, Bank of New York Mellon, CitiGroup & Wells Fargo, with Fastenal also scheduled to report before the opening bell.
See you back here next week!
*** I DO NOT OWN SHARES OR OPTIONS CONTRACT POSITIONS IN SPY, QQQ, IWM OR DIA AT THE TIME OF PUBLISHING THIS ARTICLE ***
Highest Technical Rated S&P 500 Components Per 7/9/2024’s Close:
1 – NVDA
2 – VST
3 – TSLA
4 – GLW
5 – AVGO
6 – ANET
7 – SMCI
8 – AMAT
9 – TER
10 – KLAC
Lowest Technical Rated S&P 500 Components Per 7/9/2024’s Close:
1 – WBA
2 – ALB
3 – NKE
4 – LULU
5 – FRCB
6 – PAYC
7 – EL
8 – DAY
9 – EPAM
10 – POOL
Highest Volume Rated S&P 500 Components Per 7/9/2024’s Close:
1 – SW
2 – GLW
3 – PTC
4 – HBAN
5 – INTC
6 – GS
7 – ALB
8 – FITB
9 – MLM
10 – NOW
Lowest Volume Rated S&P 500 Components Per 7/9/2024’s Close:
1 – GL
2 – ALLE
3 – KKR
4 – WDC
5 – ADI
6 – DXCM
7 – J
8 – RSG
9 – VRSN
10 – VLTO
Highest Technical Rated ETFs Per 7/9/2024’s Close:
1 – NVDL
2 – NVDU
3 – USD
4 – TSLL
5 – TSLR
6 – SOXL
7 – FNGG
8 – TSLT
9 – TECL
10 – TQQQ
Lowest Technical Rated ETFs Per 7/9/2024’s Close:
1 – NVD
2 – TSDD
3 – SSG
4 – SOXS
5 – UVIX
6 – NVDS
7 – BOIL
8 – NVDD
9 – MSOX
10 – UVXY
Highest Volume Rated ETFs Per 7/9/2024’s Close:
1 – GLOW
2 – HYKE
3 – BCYIF
4 – IQSM
5 – HLGE
6 – IWLG
7 – SPXN
8 – WABF
9 – FLUD
10 – UNIY
Lowest Volume Rated ETFs Per 7/9/2024’s Close:
1 – VEGN
2 – DGRE
3 – TCHI
4 – PSEP
5 – XSD
6 – BAMG
7 – APRQ
8 – SCHY
9 – JXI
10 – EFAX
Highest Technical Rated General Stocks Per 7/9/2024’s Close:
1 – ZAPP
2 – FTEL
3 – TSSI
4 – SISI
5 – KOSS
6 – MDIA
7 – FCCN
8 – WTO
9 – RGS
10 – MEDS
Lowest Technical Rated General Stocks Per 7/9/2024’s Close:
1 – LSDIF
2 – EVLO
3 – RAASY
4 – BRSHF
5 – JUVAF
6 – MIMOQ
7 – NAVB
8 – TMPOQ
9 – HLVX
10 – FTCHF
Highest Volume Rated General Stocks Per 7/9/2024’s Close:
1 – SNGX
2 – JNVR
3 – ATNF
4 – TWO
5 – OUT
6 – LGMK
7 – QURE
8 – ZVSA
9 – BYFC
10 – GVH
Lowest Volume Rated General Stocks Per 7/9/2024’s Close:
1 – NRC
2 – CX
3 – ABG
4 – SVC
5 – BMO
6 – CSGP
7 – FLGC
8 – LZ
9 – ACHR
10 – WTO
*** THE LIST ABOVE IS STRICTLY FOR INFORMATIONAL PURPOSES – I MAY OR MAY NOT HAVE OR INITIATE A LONG, SHORT, OR LONG/SHORT POSITION IN ANY NAME ABOVE AT ANY TIME ***