XLV, The Health Care Select Sector SPDR Fund ETF has remained near-perfectly flat Y-o-Y, dipping only -0.04%, while having fallen -12.06% since their 52-week high in September of 2024, while sitting +8.27% above their 52-week low set in April of 2025 (all figures ex-distributions).
Some of their largest holdings include Eli Lilly & Co. (LLY), UnitedHealth Group Inc. (UNH), Johnson & Johnson (JNJ), AbbVie Inc. (ABBV), Abbott Laboratories (ABT), Merck & Co. Inc. (MRK), Intuitive Surgical Inc. (ISRG), Thermo Fisher Scientific (TMO), Amgen Inc. (AMGN) & Boston Scientific Corp. (BSX).
Given how close their 52-week low was & how sharp the V-shape of their rally since has gone, it is a good time to check in on the volume sentiments at of the prices they’ve traded at in recent history.
Below is a brief technical analysis of XLV, as well as a price level:volume sentiment analysis of each of the price levels XLV has traded at over the past ~3 years.
Included in this data is also their recent support & resistance levels so that readers can gain insight into how strong/weak these support/resistance levels may be in the future, based on past market participant behavior.
It is not intended to serve as financial advice, but rather as an additional tool to reference while performing your own due diligence on XLV.
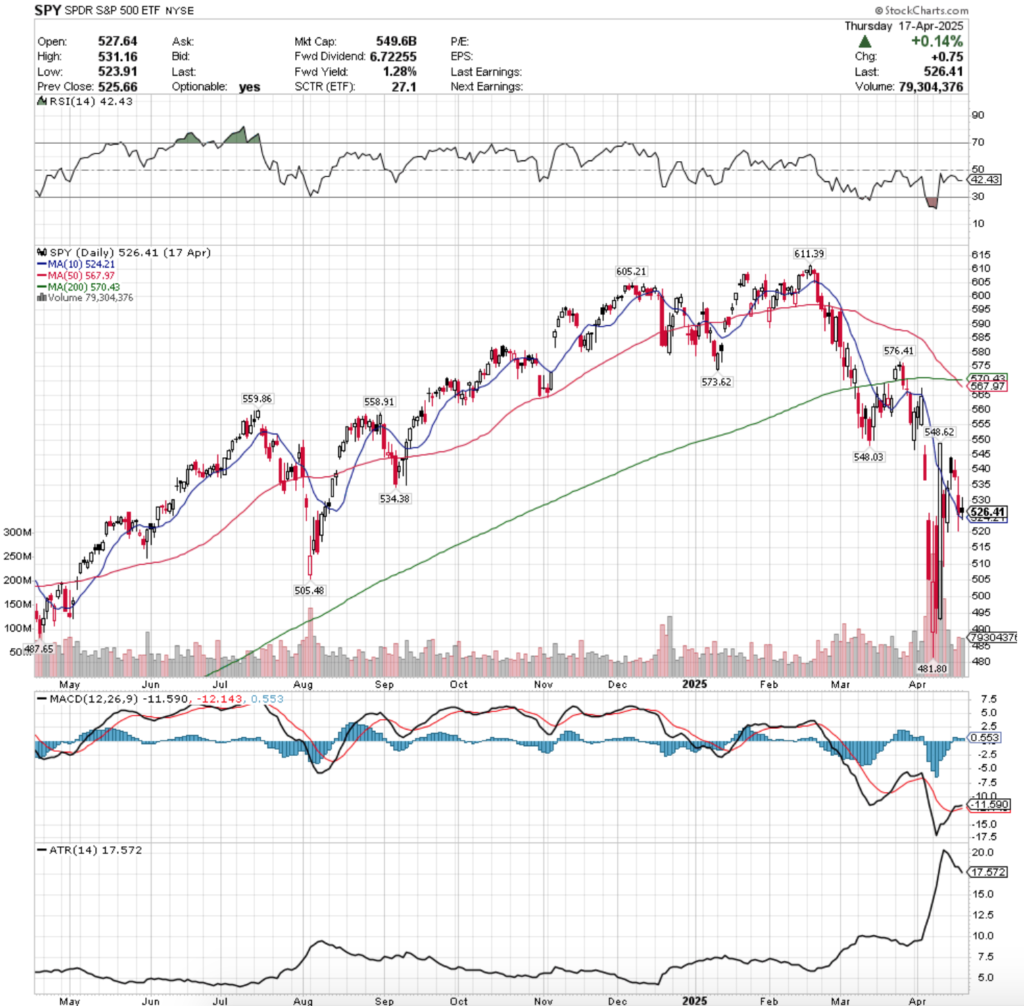
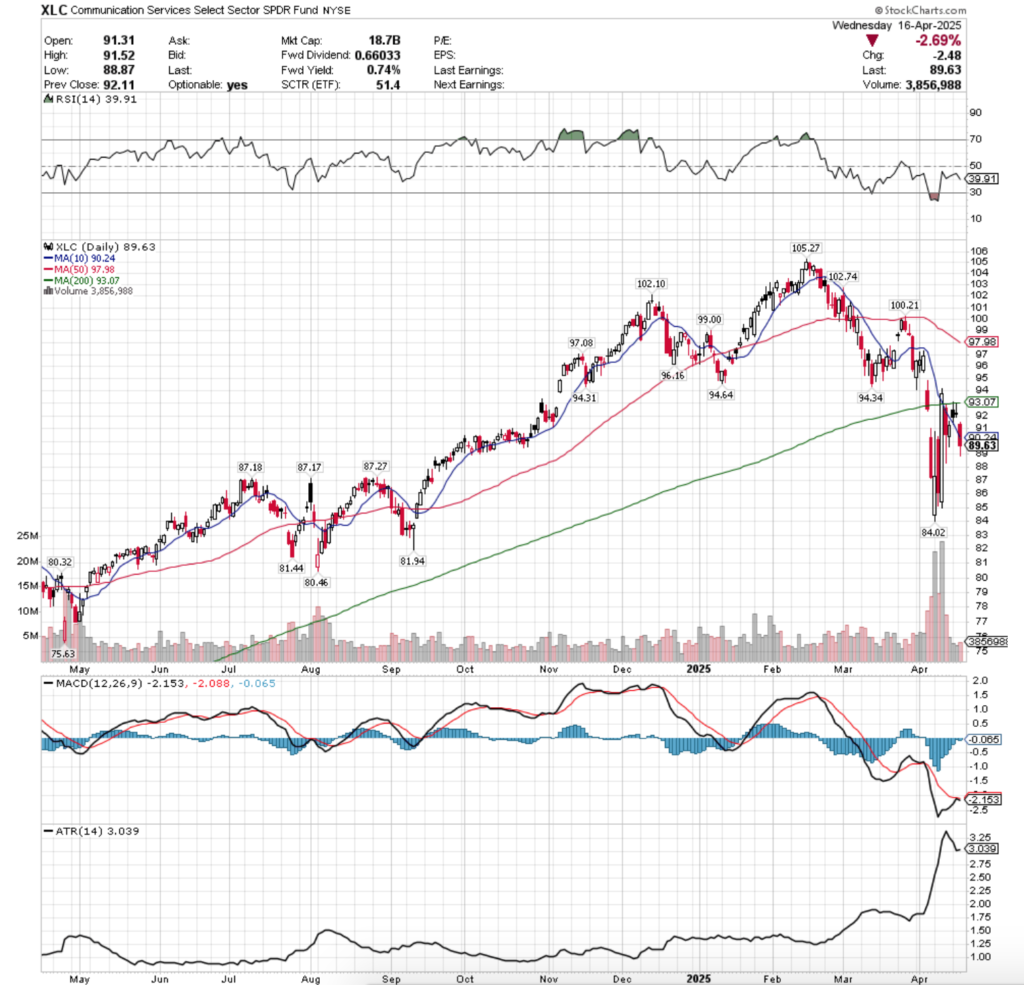
Technical Analysis Of XLV, The Health Care Select Sector SPDR Fund ETF
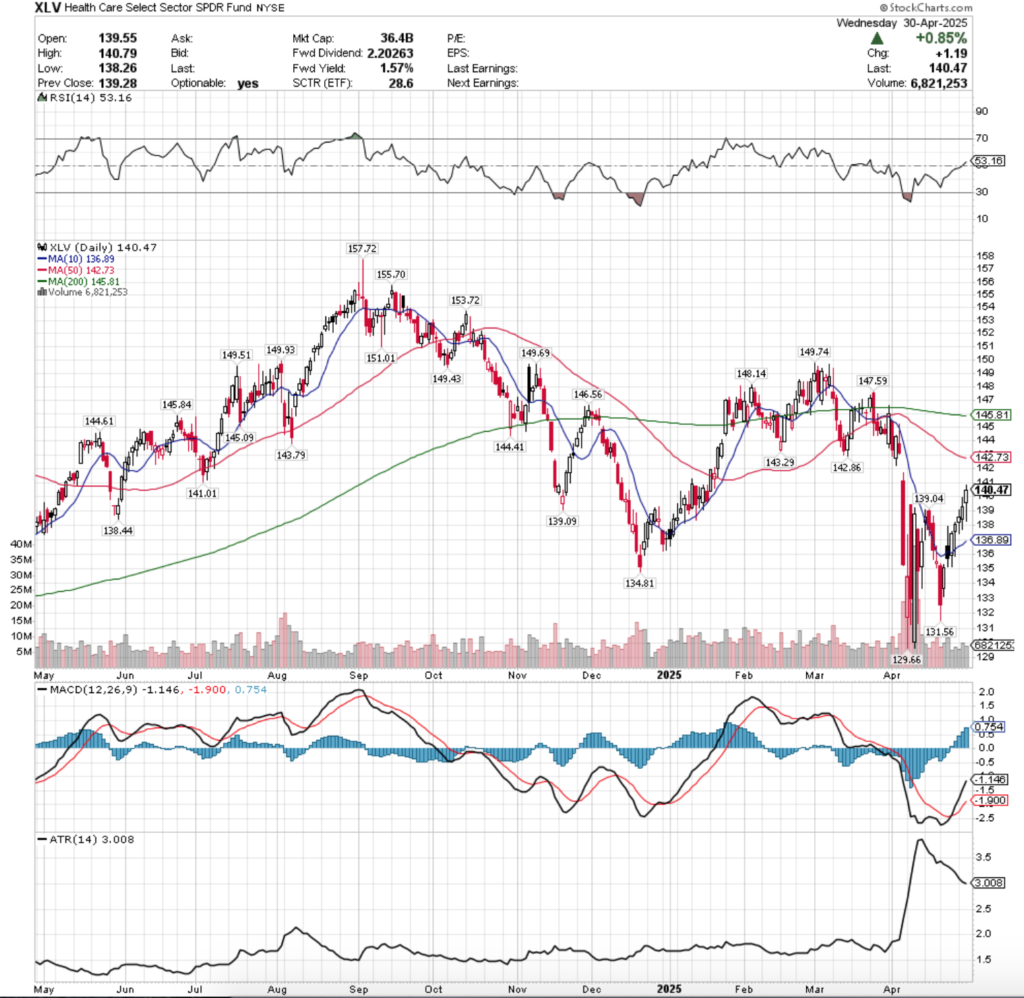
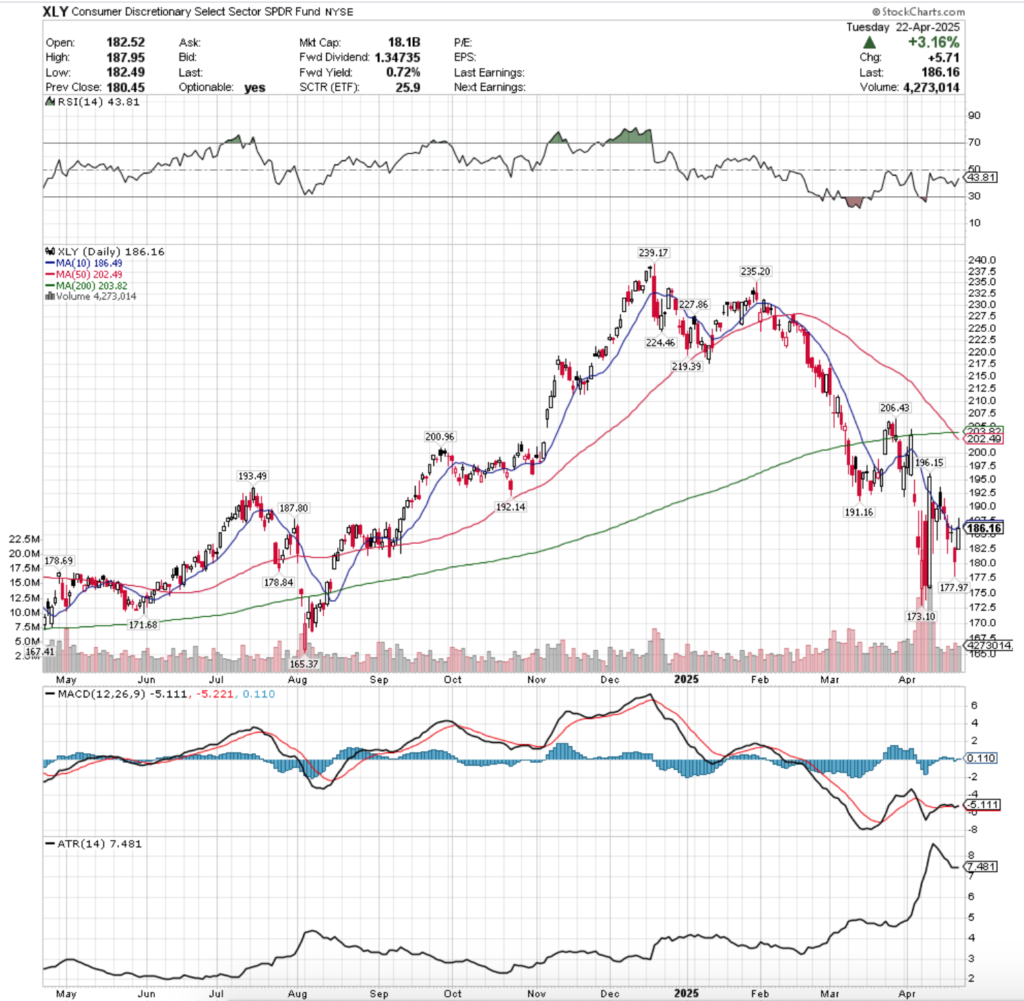
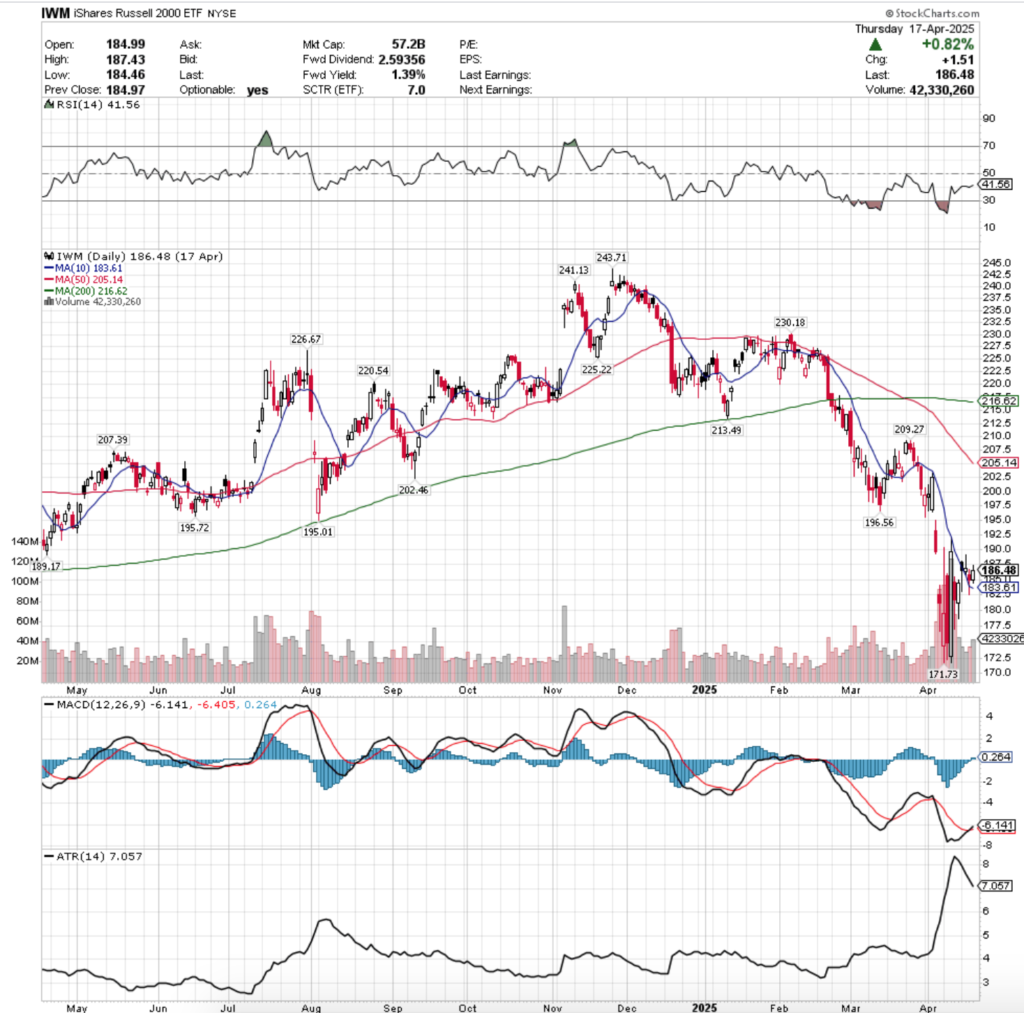
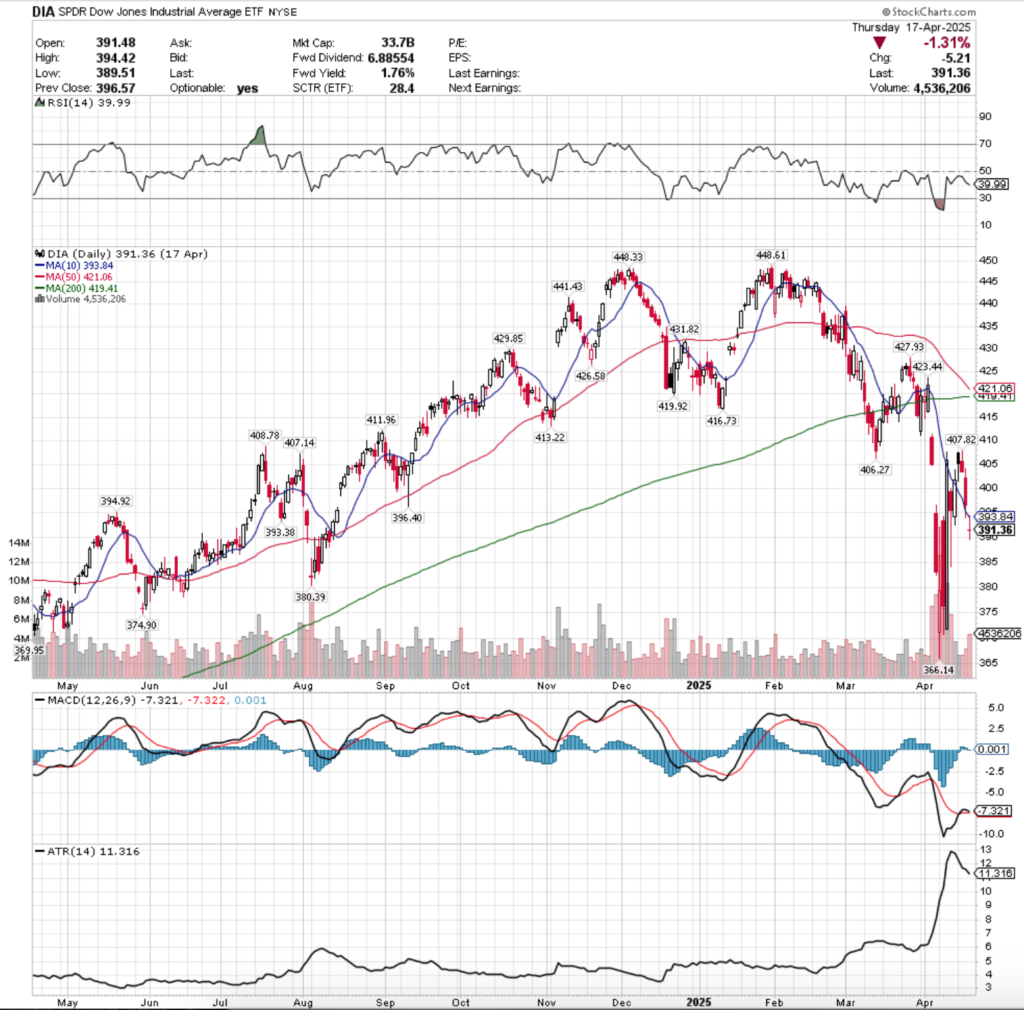
Their RSI has just bullishly advanced over the neutral 50-mark & currently sites at 53.16, while their MACD is still bullish after crossing over the signal line last week.
Volumes have been -9.64% vs. the prior year’s average over the past week & a half (7,012,500 vs. 7,760,714.29), which casts a light of skepticism on their recent bull run though, especially after all of the declining volume of early April, as it signals that there is still a great deal of uncertainty out there.
Last Monday opened on a gap down session with low volume that dipped as low as $131.56/share before closing at $132.57/share.
Tuesday opened midway between the range of XLV’s Monday candle’s real-body, tested lower briefly, before powering higher & closing just below Monday’s opening price to form a bullish harami pattern, which spurred the rally that we’ve witnessed since.
Wednesday opened on a gap higher above the 10 day moving average’s resistance, indicating that there is a short-term change in sentiment for XLV, but there were signs that this is not necessarily going to be long-lived.
While Wednesday was able to rally as high as $137.93/share, it was also pushed below the session to as low as $135.13/share to close below the 10 day moving average’s resistance at $135.73/share, as the highest volume of the past week & a half was attributed to intraday profit taking.
Thursday opened slightly higher, but below the 10 DMA, tested lower & found footing near Wednesday’s lows & managed to break above & close higher than the 10 DMA.
Friday opened on a gap up, retraced almost entirely all the way down Thursday’s candle’s real body, before breaking out higher to close above the $138/share mark.
The theme of these deep day-over-day retests (which have continued each day since), which also adds to the skepticism behind the strength of the rally, as it shows that there has still been a strong sense to stay close to the 10 day moving average & that there may be a bit of day-over-day profit taking happening.
This week kicked off on a gap up open for XLV, briefly breaking $139/share intra-day, to the upside, but also briefly breaking down below the $138/share level & the session resulted in ambiguity as the day’s candle closed as a spinning top.
This uncertainty will lead to an interesting next couple of days, particularly as we watch to see if there is any form of bearishness heading into the weekend/on the open of next week.
Tuesday also showed a wide range of indecision with the high waves on the day’s candle, which based on the small uptick in volume was also likely the result of a bit of intraday profit taking as the price moved further from the short-term trend line.
Wednesday opened on a gap up, but began showing cracks in the enthusiasm, as prices retraced down beyond the $139/share level & temporarily to below Tuesday’s opening price, before managing to find footing & rally higher into the close.
This indicates that there is likely to be more downside pressure on the horizon & that there is a growing appetite for profit taking in the wake of the recent run up.
The narrow tweezer v-shaped recovery also looks like it will be unsustainable in the long-run & that there will be some form of declines on the horizon.
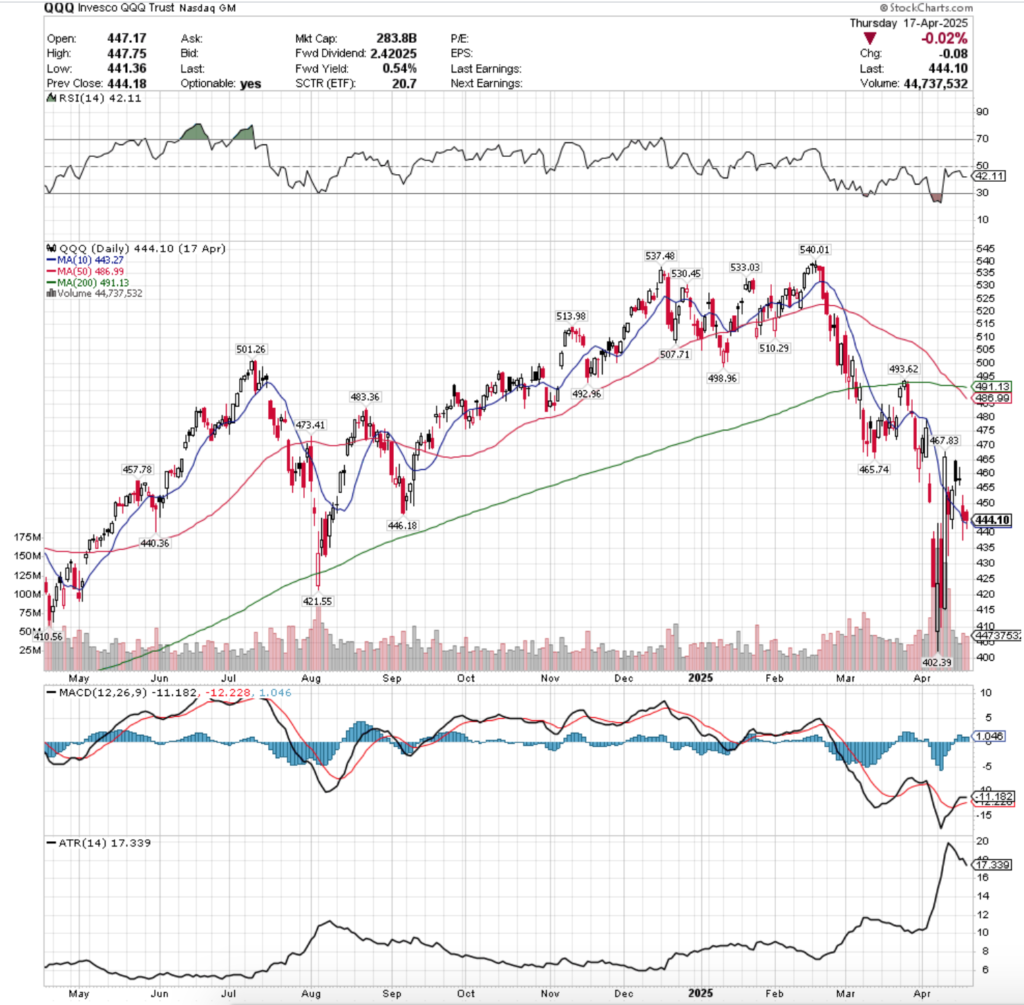
To the upside the first price level to be watching is $141.71, which is the high from April 4, 2025, as a retest of that that is unsuccessful is likely to indicate that there’s a consolidation coming.
Should it be broken through, there is a resistance zone between $142.73 (50 Day Moving Average) & $145.81/share (200 Day Moving Average) where there are eight total resistance touch-points (9 if you count the resistance level $0.04 above the 200 DMA) before the levels become less condensed.
What’s particularly troubling here is that each of those levels resides in a Seller dominated price level per the past ~3 years.
This makes it seem that we won’t be seeing any breakout above the long-term trend line’s (200 DMA) resistance for quite some time, unless it involves a high volume gap above it (and even then, it’s unlikely to sustain for long).
What’s more likely is that we see continued consolidation that oscillates around the 10 day moving average, as there is quite a bit of uncertainty still remaining in the market.
This is also in part because the price zones between the current price & the 10 DMA’s support are historically Seller dominated, but the 10 DMA resides in a Buyer oriented zone historically.
Another interesting point to watch there ties into the bear case, as while there are seven support levels between Wednesday’s closing price & the bottom of XLV’s one year chart, the lowest is at $129.66, which is the bottom point of the consolidation range mentioned above.
This likely will be why unless there is a major earnings disappointment, the XLV’s price will be following the 10 DMA & swimming around it like the remoras that swim around sharks & whales until we get an upside or downside catalyst.
One thing is for certain though, no heightened volume, no serious breakout in either direction, particularly after the subdued volume levels of the past year vs. the years prior.
With that said, it’s worth reviewing the tables in the section below, as well as the past 1,2 & 3 year charts (and other longer-dated ones based on your time horizons, but given this is ~3 years of data that’s a good idea to review) & assess where XLV might find its support & resistance, and reference the data below.
The section below outlines the volume sentiment at each price level XLV has traded at over the past ~3 years & can be used to assess the strength/weakness of the support/resistance levels & price levels that XLV retests in the coming weeks.
This can aid in understanding how market participants may behave again at each level.
Price Level:Volume Sentiment Analysis For XLV, The Health Care Select Sector SPDR Fund ETF
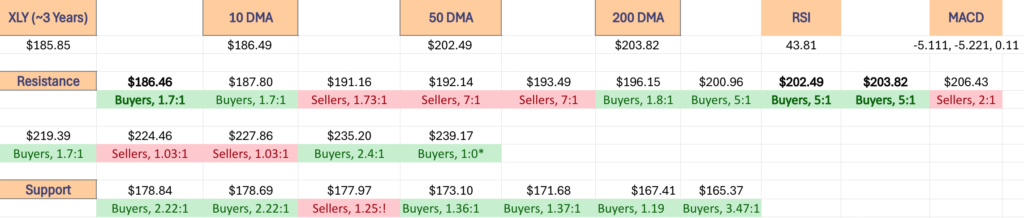
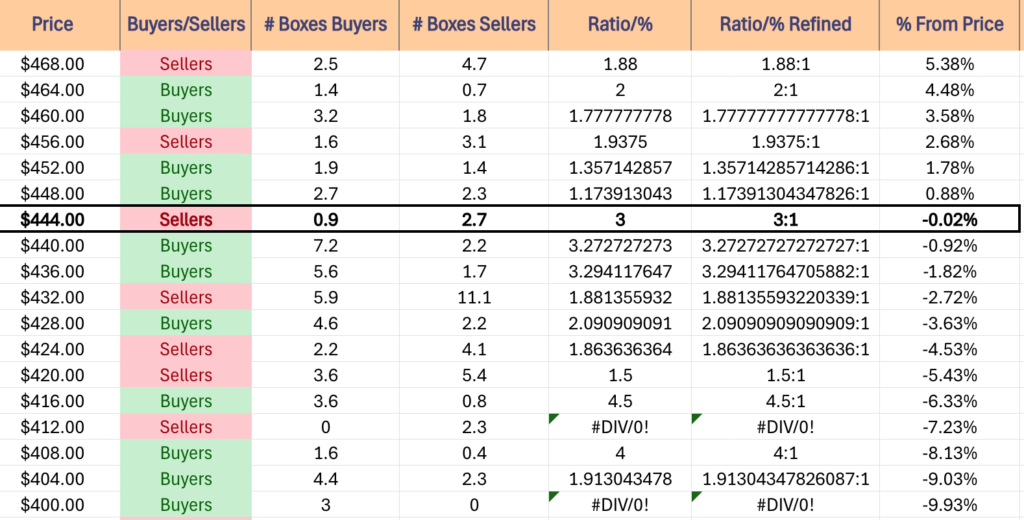
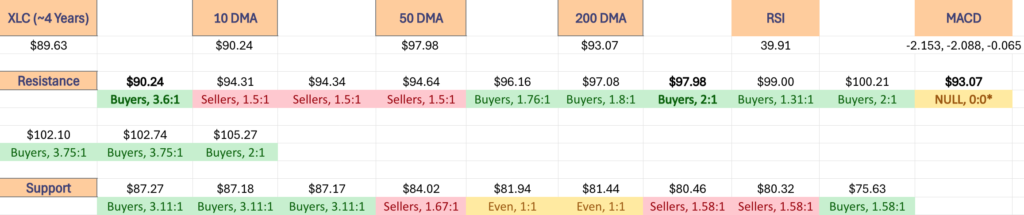
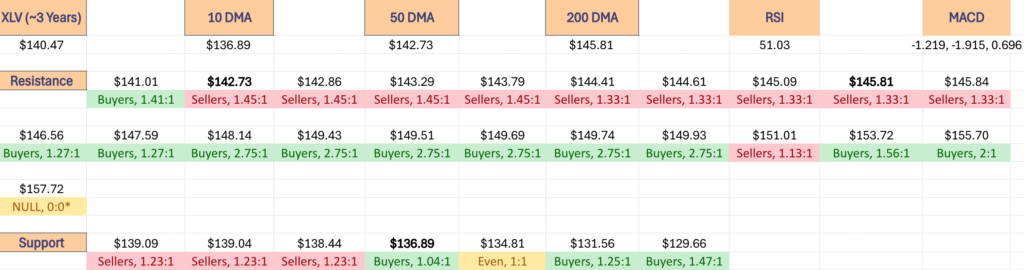
The top table below shows the support & resistance levels of XLV from the past year’s chart, as well as their price level:volume sentiment at each from data covering the past ~3 years, using Wednesday 4/30/2025’s closing data for their price & moving averages/other technicals.
The 10, 50 & 200 day moving averages are denoted with bold.
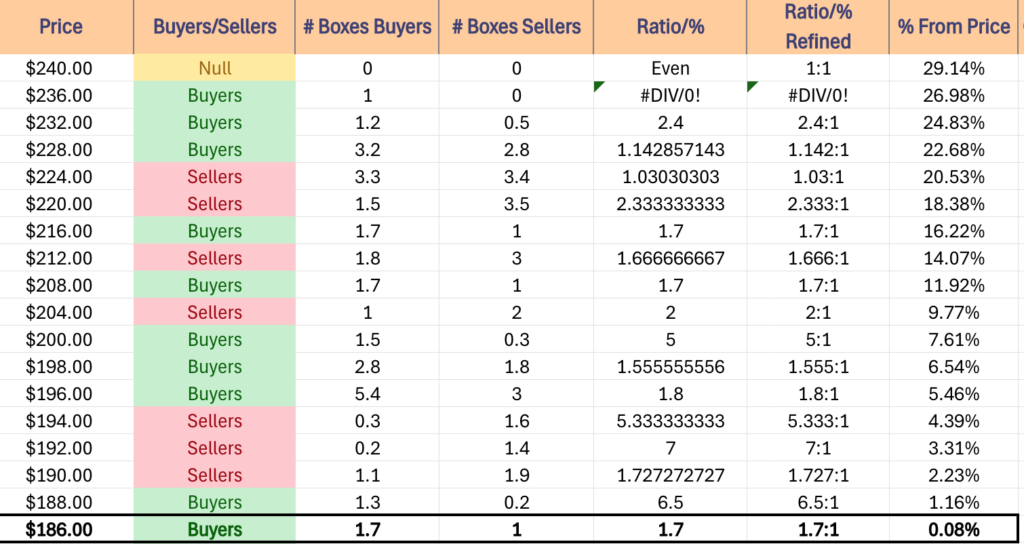
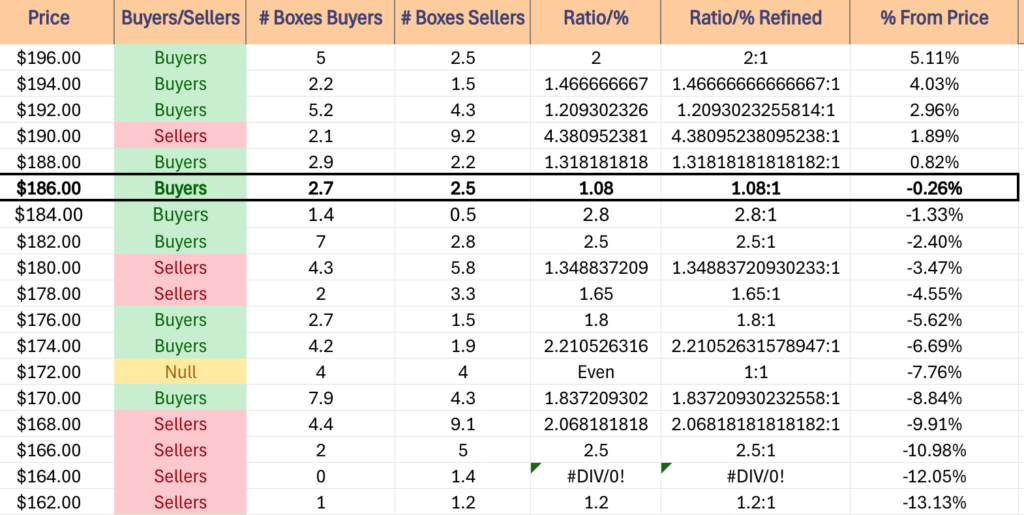
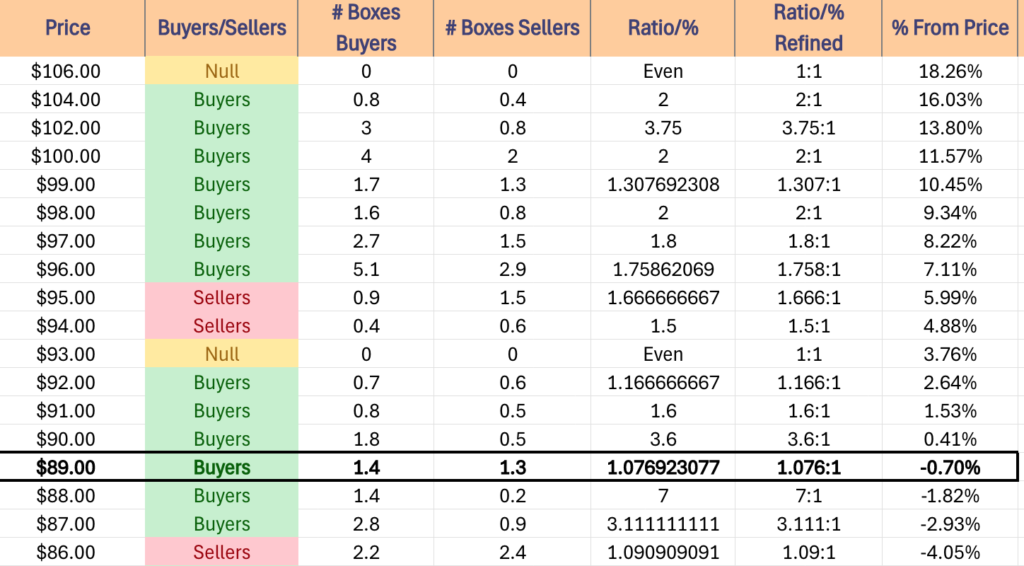
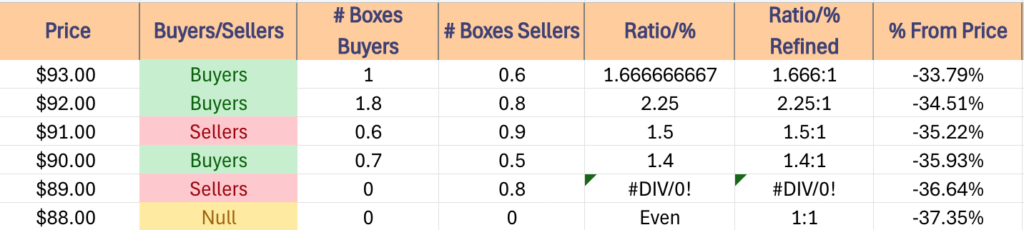
The next tables show the volume sentiment at each individual price level XLV has traded at over the past ~3 years.
Beneath them is a copy & pasteable list of the same data, where the support/resistance levels are denoted in bold.
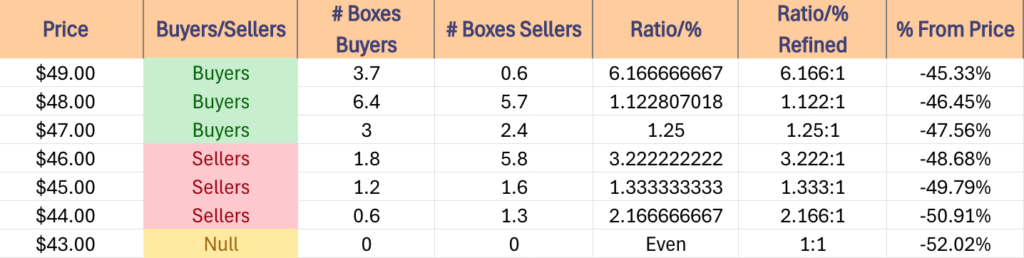
All ratios with “0” in the denominator are denoted with a “*”.
NULL values are price levels that had limited trading volume, whether it be due to gaps, quick advances or they are at price extremes; in the event that they are retested & there is more data they would have a distinct “Buyers”, “Sellers” or “Even” title.
This is not intended as financial advice, but rather another tool to consider when performing your own research & due diligence on XLV.
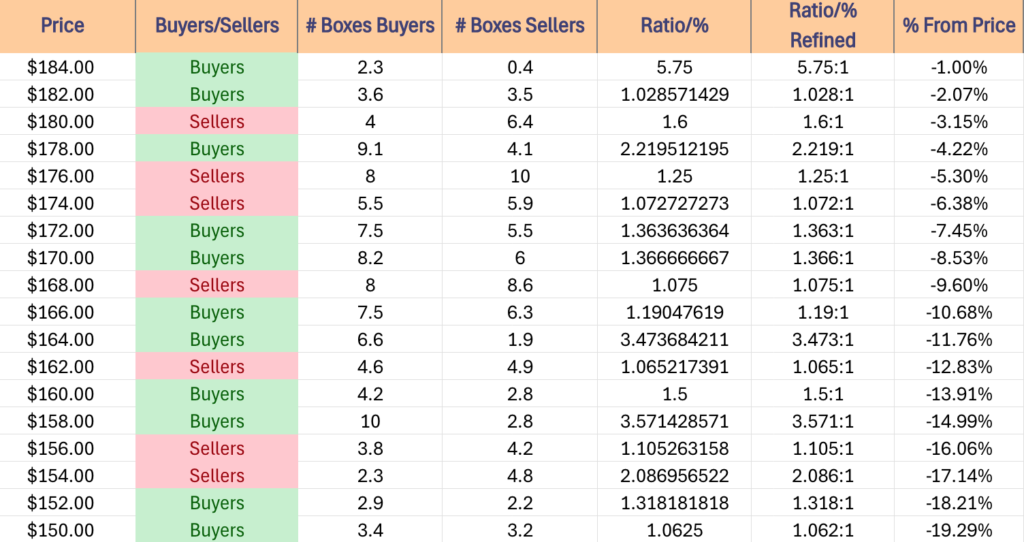
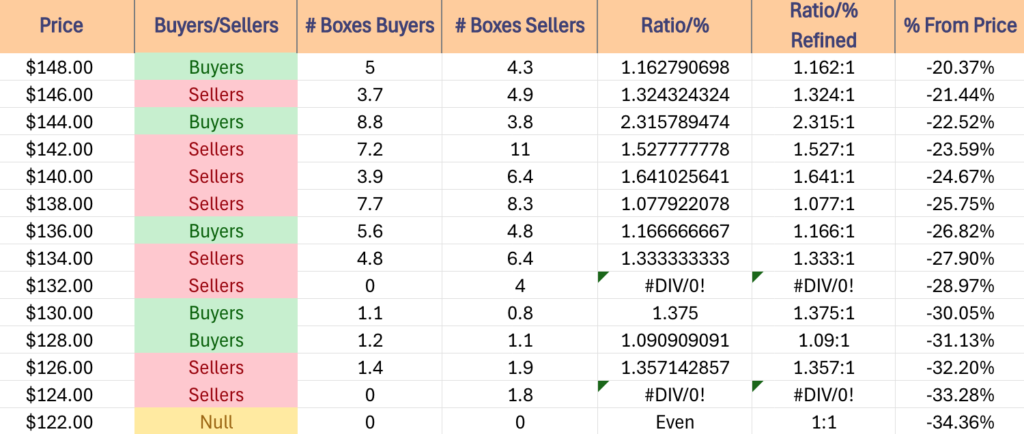
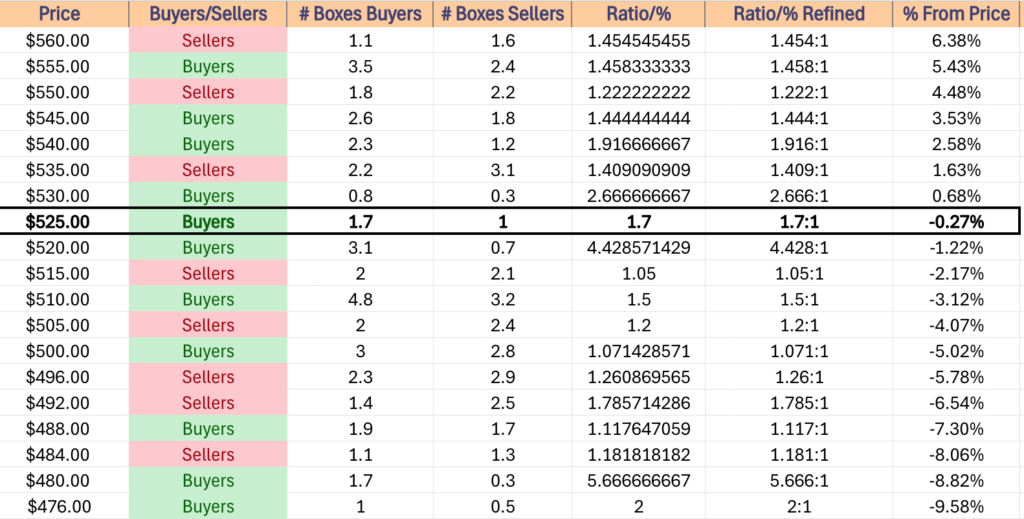
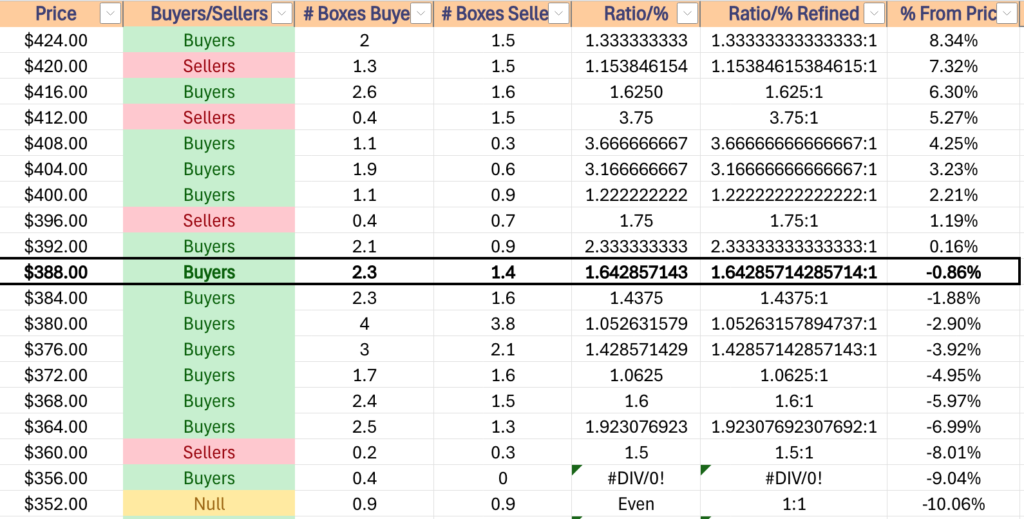
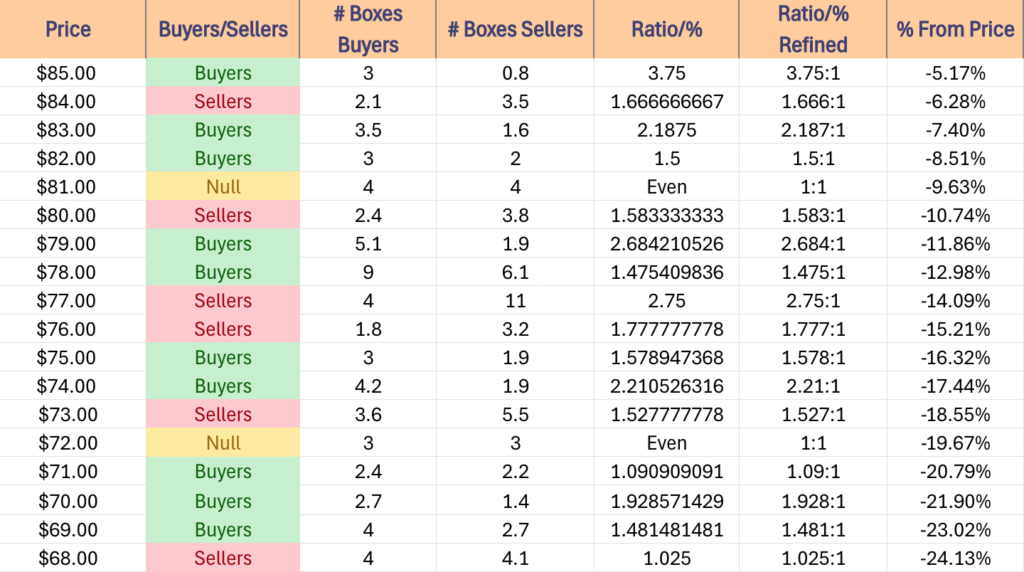
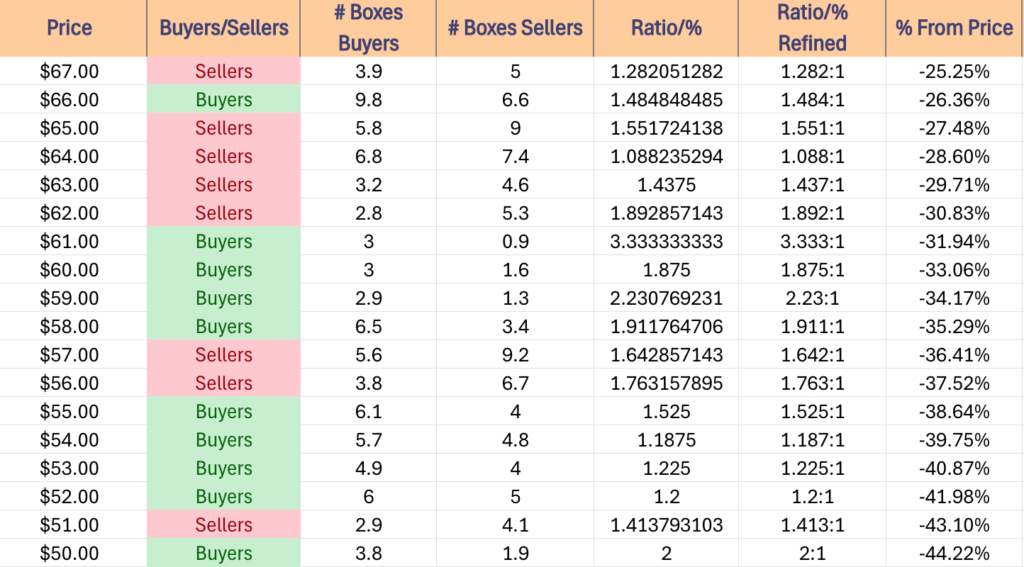
The following section lays out XLV’s one year support/resistance levels, as well as their Buyer:Seller (Seller:Buyer) ratios at each price level that they’ve traded at over the past ~3 years, which can be used as a barometer for estimating the expected strength/weakness of each of the support/resistance levels.
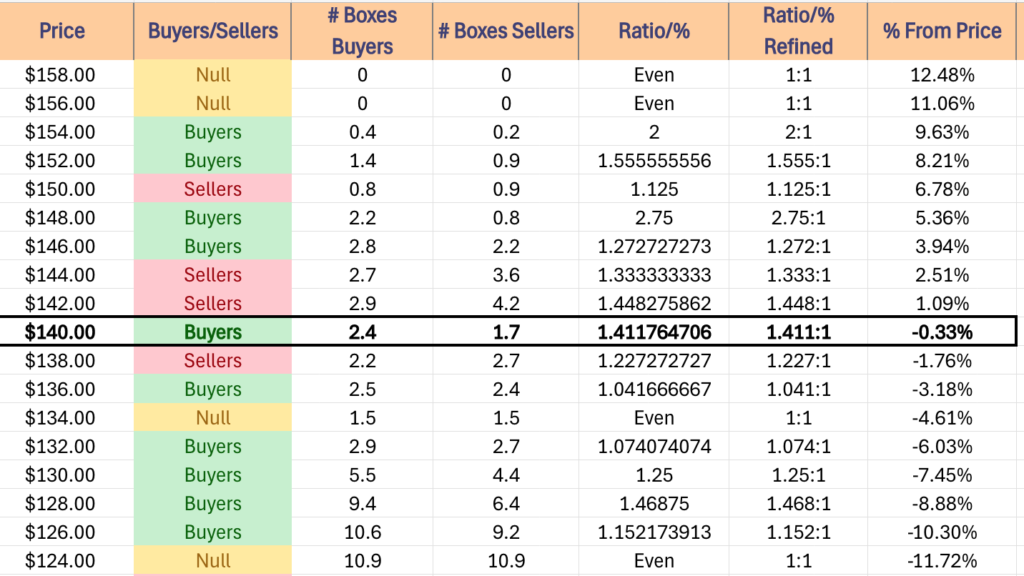

$158 – NULL – 0:0*, +12.48% From Current Price Level
$156 – NULL – 0:0*, +11.06% From Current Price Level
$154 – Buyers – 2:1, +9.63% From Current Price Level
$152 – Buyers – 1.56:1, +8.21% From Current Price Level
$150 – Sellers – 1.13:1, +6.78% From Current Price Level
$148 – Buyers – 2.75:1, +5.36% From Current Price Level
$146 – Buyers – 1.27:1, +3.94% From Current Price Level
$144 – Sellers – 1.33:1, +2.51% From Current Price Level – 200 Day Moving Average*
$142 – Sellers – 1.45:1, +1.09% From Current Price Level – 50 Day Moving Average*
$140 – Buyers – 1.41:1, -0.33% From Current Price Level – Current Price Level*
$138 – Sellers – 1.23:1, -1.76% From Current Price Level
$136 – Buyers – 1.04:1, -3.18% From Current Price Level – 10 Day Moving Average*
$134 – Even – 1:1, -4.61% From Current Price Level
$132 – Buyers – 1.07:1, -6.03% From Current Price Level
$130 – Buyers – 1.25:1, -7.45% From Current Price Level
$128 – Buyers – 1.47:1, -8.88% From Current Price Level
$126 – Buyers – 1.15:1, -10.3% From Current Price Level
$124 – Even – 1:1, -11.72% From Current Price Level
$122 – Sellers – 1.2:1, -13.15% From Current Price Level
$120 – Sellers – 1.13:1, -14.57% From Current Price Level
$118 – Sellers – 1.39:1, -16% From Current Price Level
$116 – Sellers – 1.24:1, -17.42% From Current Price Level
$114 – Buyers – 1.07:1, -18.84% From Current Price Level
$112 – Sellers – 3:1, -20.27% From Current Price Level
$110 – Buyers – 2.75:1, -21.69% From Current Price Level
$108 – Buyers – 2.89:1, -23.12% From Current Price Level
$106 – Sellers – 1.05:1, -24.54% From Current Price Level
$104 – Sellers – 1.31:1, -25.96% From Current Price Level
$102 – Buyers – 1.5:1, -27.39% From Current Price Level
$100 – Buyers – 1.4:1, -28.81% From Current Price Level
$99 – Even – 1:1, -29.52% From Current Price Level
$98 – Sellers – 1.82:1, -30.23% From Current Price Level
$97 – Sellers – 1.33:1, -30.95% From Current Price Level
$96 – Buyers – 1.17:1, -31.66% From Current Price Level
$95 – Buyers – 2.5:1, -32.37% From Current Price Level
$94 – Sellers – 1.2:1, -33.08% From Current Price Level
$93 – Buyers – 1.67:1, -33.79% From Current Price Level
$92 – Buyers – 2.25:1, -34.51% From Current Price Level
$91 – Sellers – 1.5:1, -35.22% From Current Price Level
$90 – Buyers – 1.4:1, -35.93% From Current Price Level
$89 – Sellers – 0.8:0*, -36.64% From Current Price Level
$88 – NULL – 0:0*, -37.35% From Current Price Level
*** I DO NOT OWN SHARES OR OPTIONS CONTRACT POSITIONS IN XLV AT THE TIME OF PUBLISHING THIS ARTICLE ***