The VIX closed at 26.15, indicating an implied one day move range of +/-1.65% & an implied one month move range of +/-7.56% for the S&P 500.
Highest Technical Rated S&P 500 Components Per 3/23/2026’s Close:
1 – SNDK
2 – LITE
3 – CIEN
4 – WDC
5 – APA
6 – TER
7 – COHR
8 – MU
9 – TPL
10 – FIX
Lowest Technical Rated S&P 500 Components Per 3/23/2026’s Close:
1 – SMCI
2 – TTD
3 – CSGP
4 – FICO
5 – FISV
6 – PSKY
7 – HOOD
8 – BLDR
9 – ARES
10 – CPB
Highest Volume Rated S&P 500 Components Per 3/23/2026’s Close:
1 – SMCI
2 – NWS
3 – EL
4 – CF
5 – IEX
6 – BR
7 – APA
8 – PCG
9 – EXE
10 – PPG
Lowest Volume Rated S&P 500 Components Per 3/23/2026’s Close:
1 – NDSN
2 – JCI
3 – AIG
4 – IR
5 – MRNA
6 – WTW
7 – AXON
8 – NDAQ
9 – CHRW
10 – TYL
Highest Technical Rated ETFs Per 3/23/2026’s Close:
1 – BWET
2 – MUU
3 – KORU
4 – MULL
5 – VTRL
6 – GUSH
7 – UCO
8 – XOMX
9 – ERX
10 – DIG
Lowest Technical Rated ETFs Per 3/23/2026’s Close:
1 – SMCX
2 – SMCL
3 – DJTU
4 – HIMZ
5 – QBTX
6 – RGTX
7 – RBLU
8 – XXRP
9 – NVOX
10 – HOOX
Highest Volume Rated ETFs Per 3/23/2026’s Close:
1 – AUGZ
2 – BHYB
3 – NXUS
4 – FLJJ
5 – AZTD
6 – MUND
7 – JDOC
8 – EAFG
9 – LRGC
10 – SPCT
Lowest Volume Rated ETFs Per 3/23/2026’s Close:
1 – KLMN
2 – PCS
3 – ERNZ
4 – PRSD
5 – XHYC
6 – LRND
7 – RNTY
8 – PQJA
9 – QBSF
10 – FEIG
Highest Technical Rated General Stocks Per 3/23/2026’s Close:
1 – AMPE
2 – AXTI
3 – EDSA
4 – BNAI
5 – BATL
6 – SNAX
7 – FSLY
8 – TLYS
9 – ANTX
10 – BIAF
Lowest Technical Rated General Stocks Per 3/23/2026’s Close:
1 – CMCT
2 – HKIT
3 – HUBC
4 – WNW
5 – ZNB
6 – LBGJ
7 – UCAR
8 – ELPW
9 – YYGH
10 – LNKS
Highest Volume Rated General Stocks Per 3/23/2026’s Close:
1 – SLG
2 – UGRO
3 – XRN
4 – HKIT
5 – AHMA
6 – ZYBT
7 – PTLE
8 – BGM
9 – GMEX
10 – GV
Lowest Volume Rated General Stocks Per 3/23/2026’s Close:
1 – AWHL
2 – RPMT
3 – CUEN
4 – ATPC
5 – ZVSA
6 – LFS
7 – MIMI
8 – FEBO
9 – ADMT
10 – RAASY
*** THE LIST ABOVE IS STRICTLY FOR INFORMATIONAL PURPOSES – I MAY OR MAY NOT HAVE OR INITIATE A LONG, SHORT, OR LONG/SHORT POSITION IN ANY NAME ABOVE AT ANY TIME ***
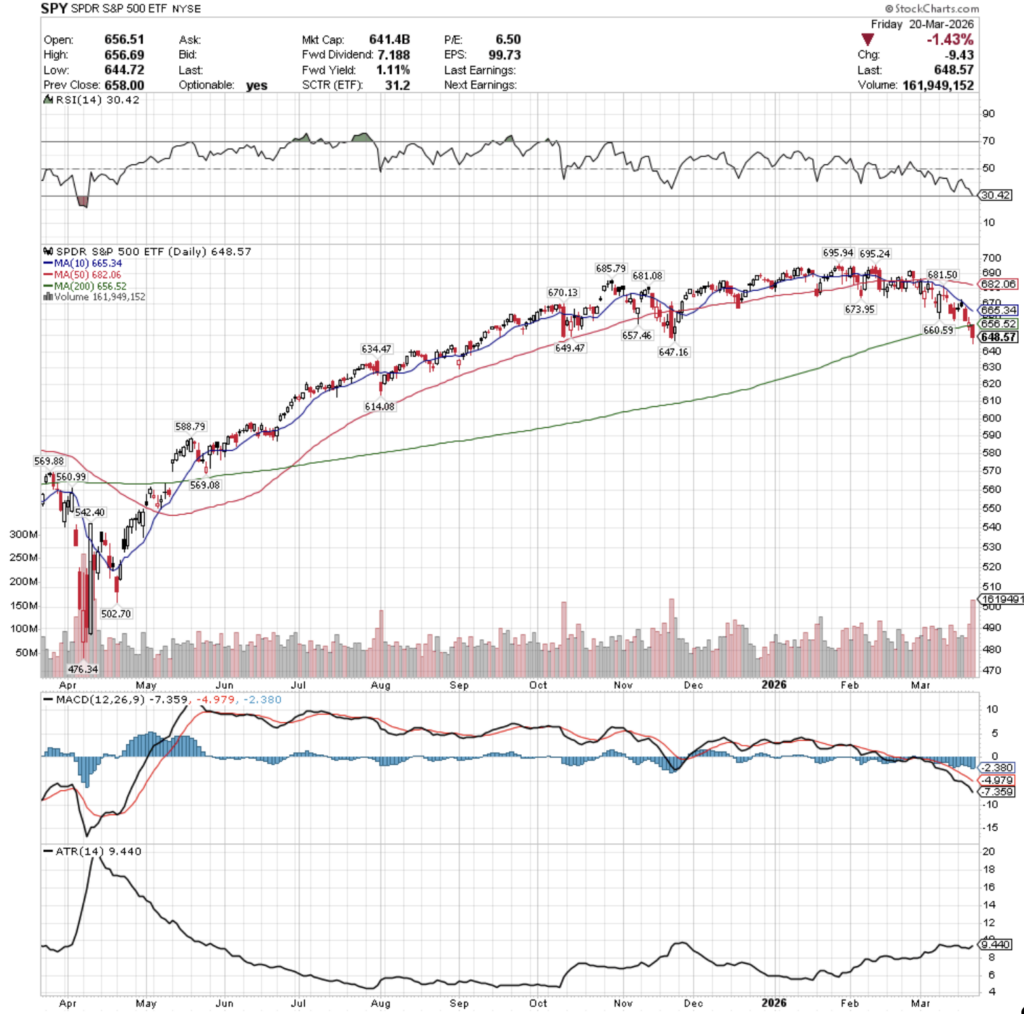
SPY, the SPDR S&P 500 ETF fell -2.07%, while the VIX closed the week at 26.78, indicating an implied one day move of +/-1.69% & an implied one month move of +/-7.74%.
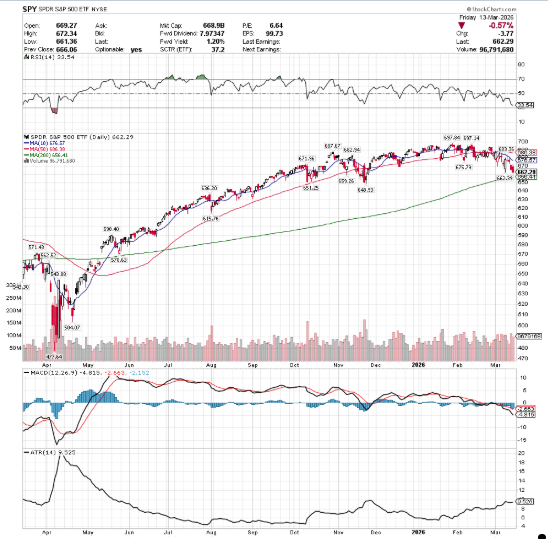
SPY ETF – SPDR S&P 500 ETF’s Technical Performance Over The Past Year
Their RSI is trending down & approaching the oversold 30-mark, currently at 30.42, as well as an MACD that continues to be bearish, like it has for the overwhelming amount of time since mid-January 2026.
Volumes were +32.92% higher than the prior year’s average (105,220,000 vs. 79,160,359), which is rather chilling when you consider that each session of the week declined from its opening price.
Monday opened higher, made a run at the 10 day moving average’s resistance, but ultimately sunk lower throughout the session on low volume, closing the day as a skinny spinning top, indicating that there was a bit of hesitency among market participants.
Tuesday was similar, where a gap up open ran at the 10 DMA’s resistance, temporarily broke through it, but ultimately sunk lower to close below its opening price on slightly higher volume than Monday.
Wednesday the cracks became exposed and the fear market participants were feeling came into plain view, as a gap down open made one lasts attempt at the resistance of the short-term trendline, only to decline -1.4% on the day, bringing the support of the 200 day moving average into play.
Thursday the quiet part was said aloud, as SPY opened in-line with the 200 DMA, sunk lower, but managed to rally higher, temporarily retracing into Wednesday’s range, before closing -0.25% and signaling that there was limited faith in the long-term trendline.
Friday opened lower, again in-line with the 200 day moving average, and risk-off sentiment carried SPY to its first close below the 200 DMA since 5/21/2026 on the week’s highest volume, signaling that there was a bit of fear & loss of confidence in the S&P 500.
Heading into a new week there will be a few things to be mindful of.
Firstly, the lower shadow on Friday’s candle signals that there is still downside appetite, but that some bulls stepped in thinking they’d found a buying opportunity.
Secondly, the 10 DMA is quickly approaching the 200 DMA bearishly, which will likely result in a death-cross by EOW.
Third, the volume sentiment numbers below show support levels to be sparse and with Selling pressure still near the closing price of Friday’s session
The upside case revolves around SPY gaining traction with advancing volume that enables an uptrend, but based on last week’s volume trends there appears to be reluctance towards that at the moment, particularly with the moving 10 & 50 DMA’s coming down on the 200 DMA.
There also is a Seller zone that houses SPY’s first resistance test, so that adds to the difficulty of a significant breakout taking place immediately following last week’s declines.
The consolidation view figures oscillations around the 200 DMA until the 10 DMA draws nearer, which likely then leads to more near-term declines.
In the declining case things get interesting, as the next two support levels are in historic Seller zones, leaving SPY to look for footing at their third support levels, $634.47.
Should the footing not be found, a proper -10% from SPY’s all-time high in January 2026 would be ~$626.35, bringing that fourth levels below of $614.08 into play potentially.
$614.08 becomes the gatekeeper to the unfilled gaps of last May & June as well, which means there could be further breakdowns if it doesn’t hold strong.
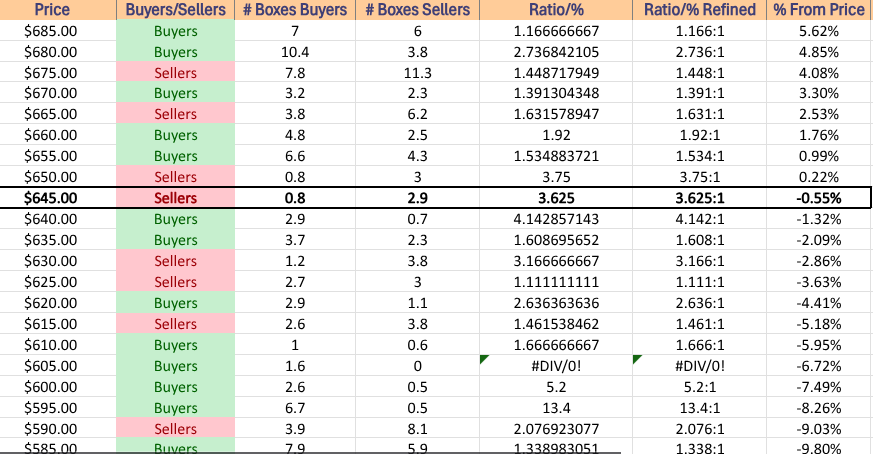
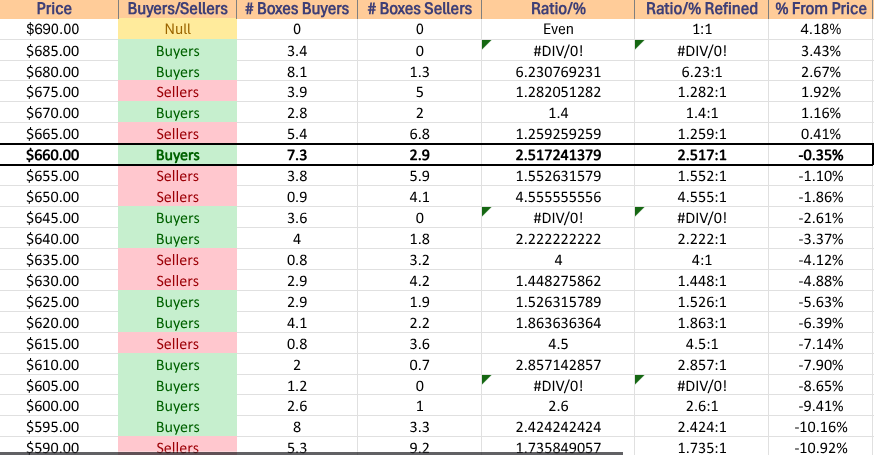
Use the table below to identify strength/weakness of support/resistance levels.
SPY has support at the $647.16 (Volume Sentiment: Sellers, 3.63:1 ((updated volume numbers used in this article, will be published in Volume-centric post by mid-week))), $634.47 (Volume Sentiment: Sellers, 3.17:1), $614.08 (Volume Sentiment: Buyers, 1.67:1) & $588.79/share (Volume Sentiment: Buyers, 1.34:1) price levels, with resistance at the $649.47 (Volume Sentiment: Sellers, 3.63:1), $656.52 (200 Day Moving Average, Volume Sentiment: Buyers, 1.54:1), $657.46 (Volume Sentiment: Buyers, 1.54:1) & $660.59/share (Volume Sentiment: Buyers, 1.92:1) price levels.
SPY ETF’s Price Level:Volume Sentiment Over The Past ~1-2 Years
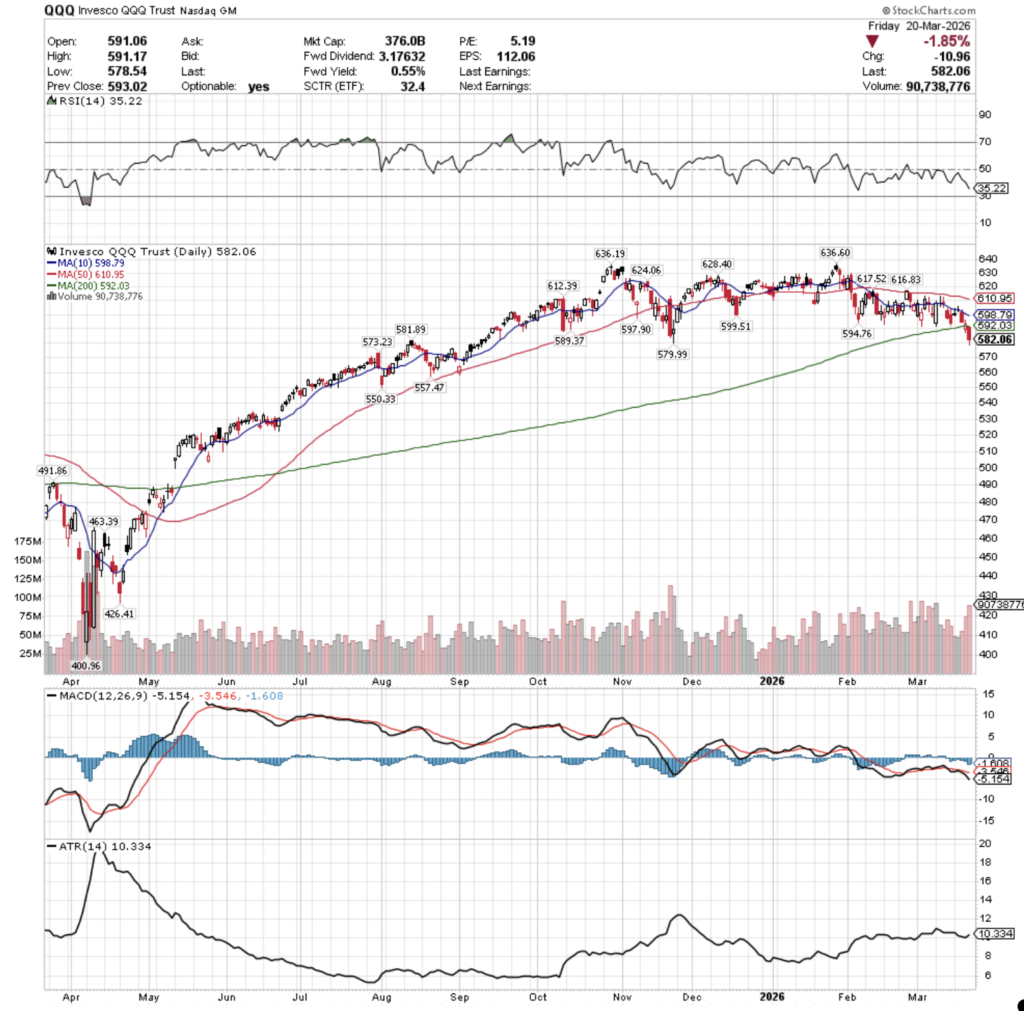
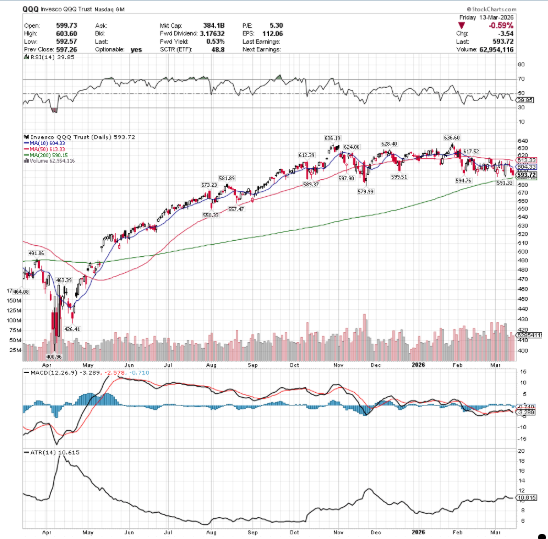
QQQ ETF – Invesco QQQ Trust ETF’s Technical Performance Over The Past Year
Their RSI is trending bearishly towards the neutral 30-mark, currently at 35.22, with an MACD that is bearish & breaking off more bearishly per its histogram.
Volumes were +17.42% higher than the prior year’s average (63,976,000 vs. 54,485,139), which has bearish implications for the same reasons cited above for SPY, all sessions ended lower than they opened & the top three volume sessions were outright declines.
Monday opened higher, tested higher to get rejected by the 10 day moving average’s resistance, before closing lower on the day as a skinny spinning top on low volume, indicating hesitency & uncertainty.
Tuesday opened on a gap up in-line with the 10 DMA, broke above temporarily, then dipped below it, ultimately closing as a doji in-line with it on the week’s lowest volume, which did not project any signals of confidence among market participants.
Wednesday opened on a gap lower, and proceeded to decline -1.39% and volume perked up above the levels of the week’s first two sessions.
Thursday opened on another gap lower below the 200 day moving average, signaling that the tech-heavy index had broken down the long-term trend, but after briefly declining more bulls stepped in to push its close higher than the open, on the second highest volume of the week.
This volume spike is attributed to both the original gap down selling, as well as the buying pressure that it took to push back to close above the 200 DMA.
Friday opened lower, in-line with the 200 DMA & sunk throughout the session in a selloff into the weekend, as nobody wanted to take risk home with them given the current international/war environment.
Heading into the new week, the upside case relies around breaking out above the 200 day moving average’s resistance & then breaking out above the 10 DMA, which along with the 50 DMA are approaching the 200 DMA bearishly with the 10 DMA looking to death cross by Wednesday.
The consolidation case sees QQQ oscillating around the 200 DMA awaiting an upside or downside catalyst (else the arrival of the moving averages mentioned above).
The downside case gets intersting, as the first support level is in a Seller zone, the next two are in Buyer zones & the fourth is in a Seller zone.
Should we see those passed through all eyes should go to the gatekeeper support levels of $550.33, as should that break down the gaps of last May & June look likely to fill to the downside.
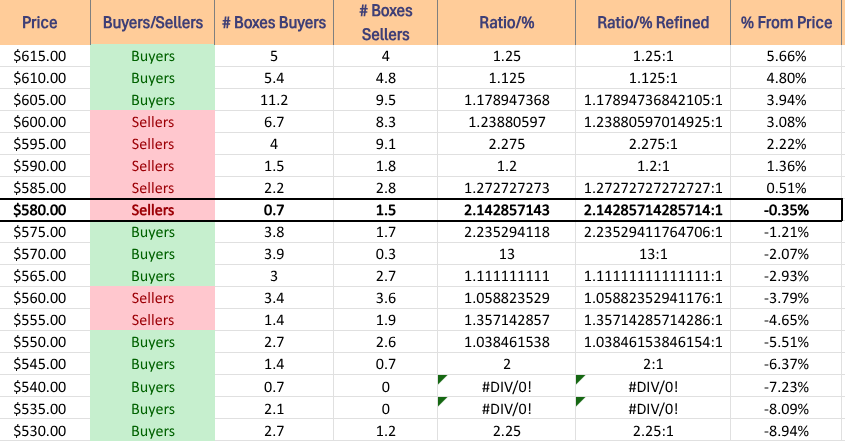
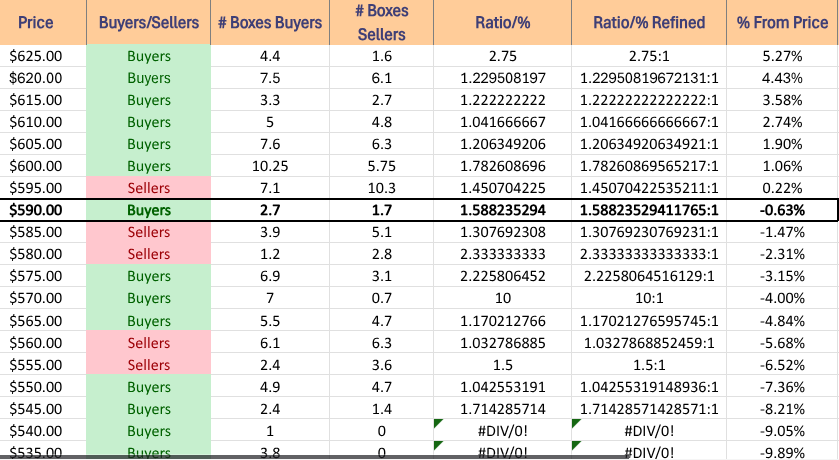
QQQ has support at the $581.89 (Volume Sentiment: Sellers, 2.14:1), $579.99 (Volume Sentiment: Buyers, 2.24:1), $573.23 (Volume Sentiment: Buyers, 13:1) & $557.47/share (Volume Sentiment: Sellers, 1.36:1) price levels, with resistance at the $589.37 (Volume Sentiment: Sellers, 1.27:1), $592.03 (200 Day Moving Average, Volume Sentiment: Sellers, 1.2:1), $594.76 (Volume Sentiment: Sellers, 1.2:1) & $597.90/share (Volume Sentiment: Sellers, 2.28:1) price levels.
QQQ ETF’s Price Level:Volume Sentiment Over The Past ~1-2 Years
IWM, the iShares Russell 2000 ETF lost -1.77% for the week, as the small cap index had the strongest week of the four major index ETFs.
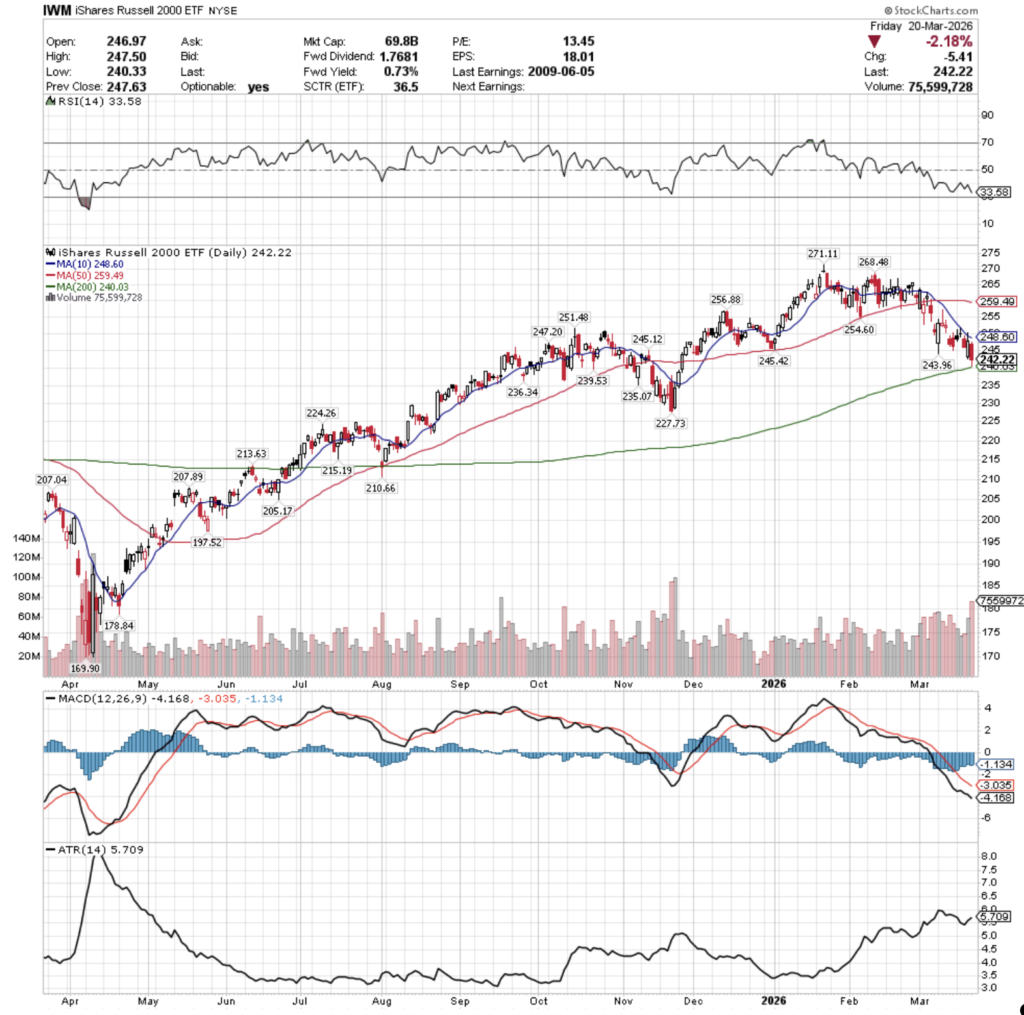
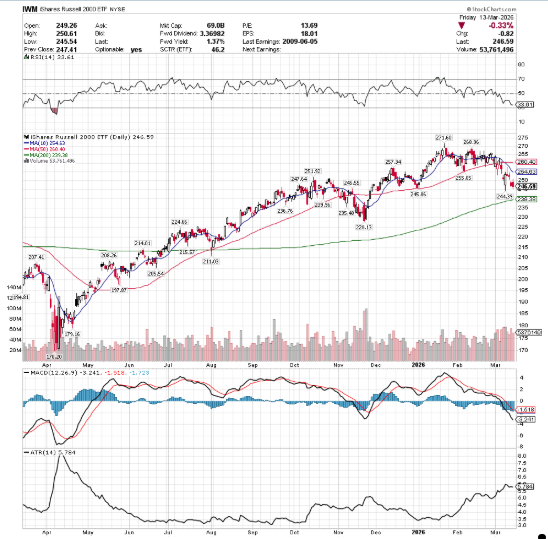
IWM ETF – iShares Russell 2000 ETF’s Technical Performance Over The Past Year
Their RSI is trending bearishly towards the oversold 30 level & is currently at 33.58, while their MACD is still bearish, as it has since late January 27, 2026.
Volumes were +38.6% higher than the prior year’s average (53,712,000 vs. 38,752,390), which should catch some eyeballs given there was only one true advancing session throughout the week.
Monday opened on a gap higher, made a run at the 10 day moving average’s resistance, but was stopped short & sunk to close lower on the day on the week’s third highest volume.
Tuesday opened on a gap higher, ran up & through the resistance of the 10 DMA, before slumping back down to test lower & ultimately close as a doji +0.63% on the day on weak volume, indicating that there was uneasiness in the air.
Wednesday showed a gap down, that attempted to run higher, but ultimately sunk throughout the session.
Thursday opened on a gap lower, tested lower, before powering higher to temporarily break above the 10 DMA’s resistance, but settled lower to post daily gains of +0.65% on the week’s second highest volume.
Friday opened lower, made a brief attempt higher, before risk came off the table & IWM sunk-2.18% on the week’s highest volume heading into the weekend, while also temporarily breaking down below the 200 day moving average.
Heading into the new week, the upside case revolves around breaking out and staying above the 10 day moving average’s resistance, as the short-term trend has remained sustainable& sturdy for the better part of since mid-January.
This will require a lot of increased advancing volume to accomplish, as you can see it has either held resilient, or been sticky with IWM oscillating around it for the majority of that period.
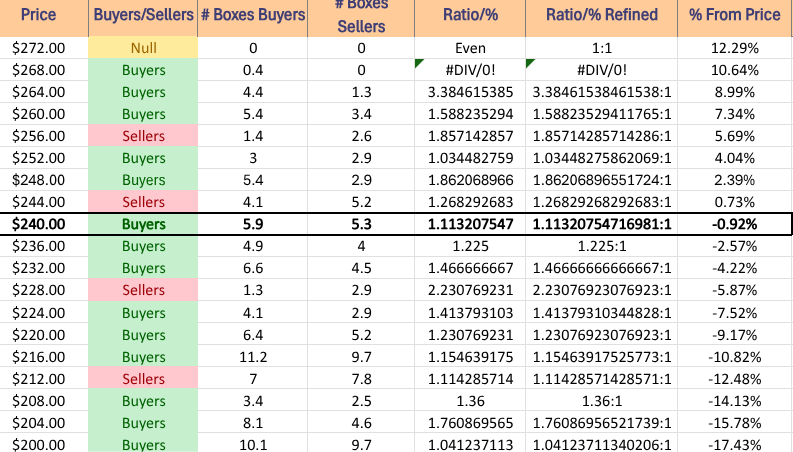
IWM has support at the $240.03 (200 Day Moving Average, Volume Sentiment: Buyers, 1.11:1), $239.53 (Volume Sentiment: Buyers, 1.23:1), $236.34 (Volume Sentiment: Buyers, 1.23:1) & $235.07/share (Volume Sentiment: Buyers, 1.47:1) price levels, with resistance at the $243.96 (Volume Sentiment: Buyers, 1.11:1), $245.12 (Volume Sentiment: Sellers, 1.27:1), $245.42 (Volume Sentiment: Sellers, 1.27:1) & $247.20/share (Volume Sentiment: Sellers, 1.27:1) price levels.
IWM ETF’s Price Level:Volume Sentiment Over The Past ~2-3 Years
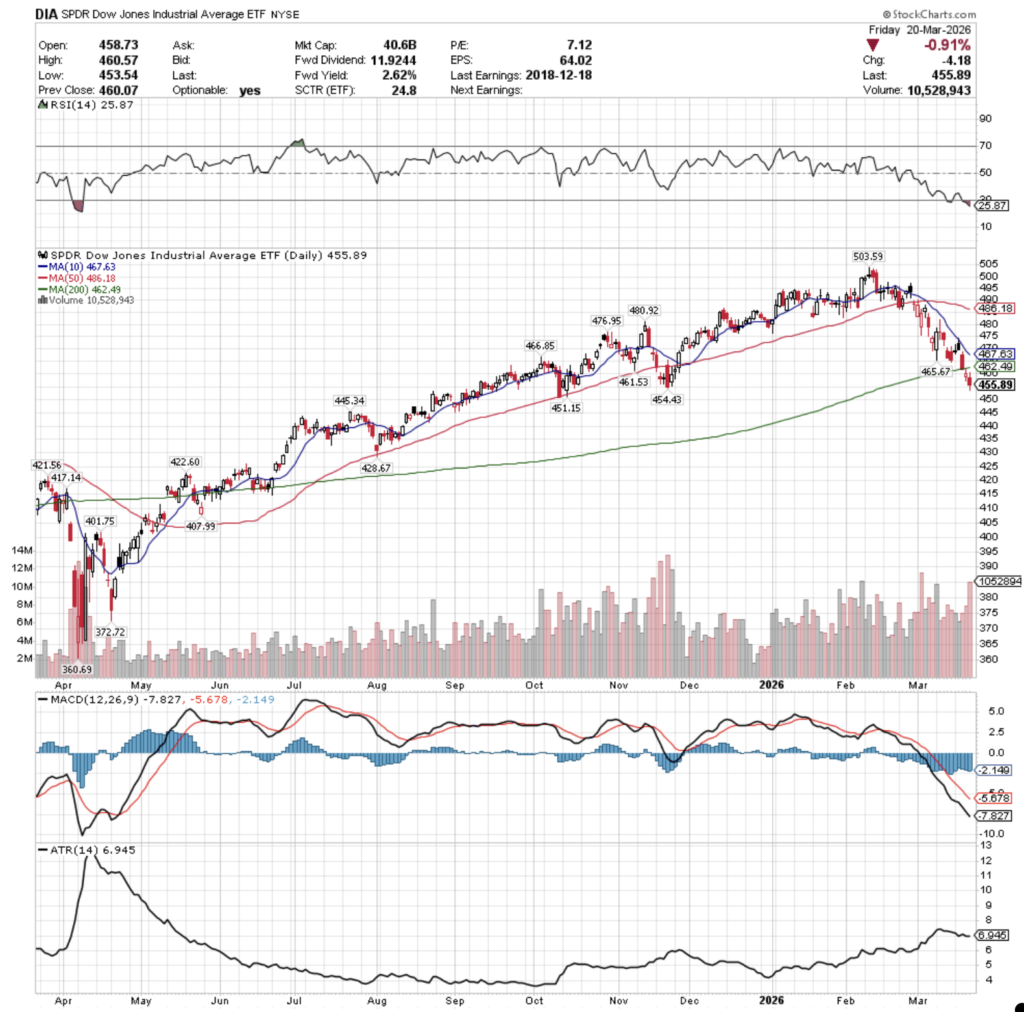
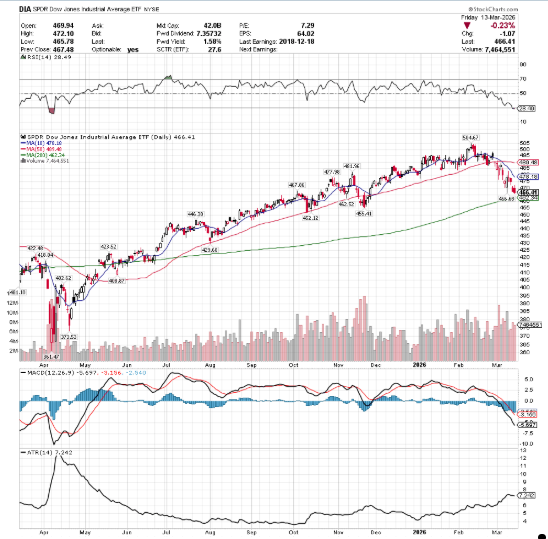
DIA ETF – SPDR Dow Jones Industrial Average ETF’s Technical Performance Over The Past Year
Their RSI is in oversold territory, currently at 25.87, while their MACD is bearish, as it has been for the majority of the past month and a half.
Volumes were +49.21% higher than the prior year’s average levels (7,752,000 vs. 5,195,299), which paints quite a risk-off story for the blue chip index, especially after its resilience through times where other indexes saw volatility.
Monday opened on a gap up, fell short of reaching the 10 DMA’s resistance & ultimately closed the session as a doji on the week’s second lowest volume, not inspiring confidence & showing that there was not much bullishness or enthusiasm to be found anywhere.
Tuesday opened on a gap up just below the 10 DMA, temporarily poked its upper shadow through it, but then declined throughout the rest of the session to close below its opening price.
Wednesday opened on a gap down & continued lower to close just below the 200 day moving average, as even the long-term trend of the blue chipswasn’t spared.
Thursday opened on a gap lower below the 200 DMA, but managed to run higher and close down for the day but above its opening price as a spinning top candle that never breached the resistance of the 200 DMA, signaling bearish indecision.
Friday also opened on a gap lower, temporarily breaking above the $400/share mark, but ultimately sank -0.91% on the day.
Heading into the new week the upside case revolves around being able to break out above the 200 DMA with strong advancing volume.
Without that volume mentioned there will not be much strength of support behind the move & it should be viewed with skepticism.
The consolidation case revolves around staying within the range of Thursday & Friday’s candles while awaiting an upside or downside catalyst as the 10 DMA crosses below the 200 DMA bearishly to catch up to price.
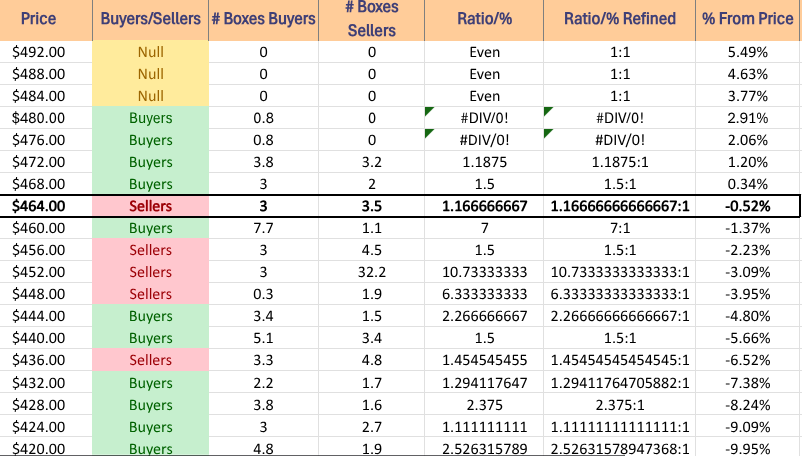
The downside case shows the next two support levels are in Seller zones, while the following two are in Buyer zones.
The fourth support level is the gatekeeper to the gap ups of May & June of 2025, which will make it a key area to watch in the event of a decline.
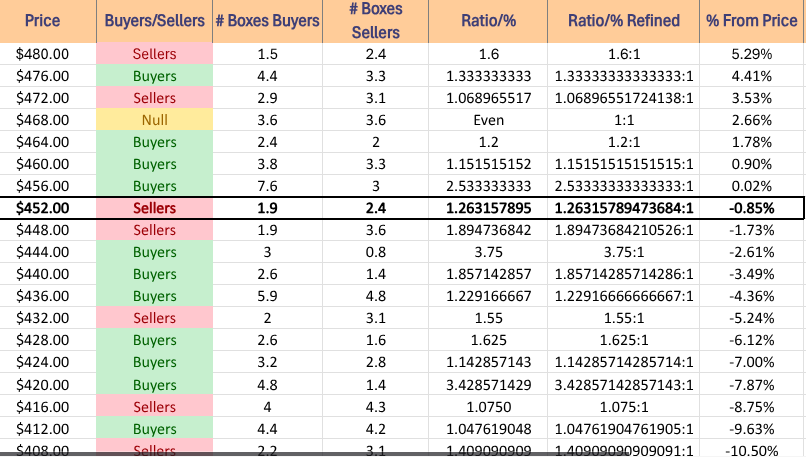
DIA has support at the $454.43 (Volume Sentiment: Sellers, 1.26:1), $451.15 (Volume Sentiment: Sellers, 1.9:1), $445.34 (Volume Sentiment: Buyers, 3.75:1) & $428.67/share (Volume Sentiment: Buyers, 1.63:1) price levels, with resistance at the $461.53 (Volume Sentiment: Buyers, 1.15:1), $462.49 (200 Day Moving Average, Volume Sentiment: Buyers, 1.15:1), $465.67 (Volume Sentiment: Buyers, 1.2:1) & $466.85/share (Volume Sentiment: Buyers, 1.2:1) price levels.
DIA ETF’s Price Level:Volume Sentiment Over The Past ~3-4 Years
The Week Ahead
Monday the week begins with Construction Spending (Delayed Report*) data at 10 am & there are no major earnings reports scheduled for release.
U.S. Productivity (Revision) data is released Tuesday at 8:30 am, before S&P Flash U.S. Services PMI & S&P Flash U.S. Manufacturing PMI data comes out at 9:45 am & Fed Governor Barr speaks at 6:30 pm.
Tuesday’s earnings reports start off with Concentrix, Core & Main and Smithfield Foods before the opening bell, followed by AAR Corp., Braze, KB Home & Worthington Enterprises after the session’s close.
Wednesday features Import Price Index & Import Price Index minus Fuel data at 8:30 am, followed by Fed Governor Miran speaking at 4:10 pm.
Chewy reports earnings Wednesday morning, along with Cintas, Kingsoft Cloud, Paychex & Winnebego, followed by Enerpac Tool Group, H.B. Fuller, JBS SA, Jefferies, Karman Space & Defense, MillerKnoll, Navan & Worthington Steel after the session’s close.
Initial Jobless Claims data comes out Thursday at 8:30 am, followed by Fed Governor Cook speaking at 4pm, Fed Governor Miran speaking at 6:30 pm, Fed Vice Chair Jefferson speaking at 7pm & Fed Governor Barr speaking at 7:10 pm.
Thursday morning’s earnings reports include BRP Inc., Commercial Metals, Lovesac & Shoe Carnival, before Argan, BitGo Holdings & Oxford Industries after the closing bell.
Friday the week winds down with Consumer Sentiment (final) data at 10 am.
Carnival & Legence Corp. report earnings before Friday’s opening bell.
See you back here next week!
*** I DO NOT OWN SHARES OR OPTIONS CONTRACT POSITIONS IN SPY, QQQ, IWM OR DIA AT THE TIME OF PUBLISHING THIS ARTICLE ***
The VIX closed at 26.78, indicating an implied one day move range of +/-1.69% & an implied one month move range of +/-7.74% for the S&P 500.
Highest Technical Rated S&P 500 Components Per 3/20/2026’s Close:
1 – SNDK
2 – CIEN
3 – WDC
4 – APA
5 – MU
6 – TER
7 – STX
8 – TPL
9 – MRNA
10 – LYB
Lowest Technical Rated S&P 500 Components Per 3/20/2026’s Close:
1 – SMCI
2 – TTD
3 – CSGP
4 – FISV
5 – BLDR
6 – HOOD
7 – PSKY
8 – ARES
9 – WDAY
10 – IT
Highest Volume Rated S&P 500 Components Per 3/20/2026’s Close:
1 – MTCH
2 – LW
3 – PAYC
4 – ABT
5 – AMCR
6 – SMCI
7 – QCOM
8 – MOH
9 – CMCSA
10 – ACN
Lowest Volume Rated S&P 500 Components Per 3/20/2026’s Close:
1 – CRL
2 – CVNA
3 – KVUE
4 – APP
5 – HSIC
6 – TSCO
7 – FISV
8 – EW
9 – PLTR
10 – TMO
Highest Technical Rated ETFs Per 3/20/2026’s Close:
1 – BWET
2 – MUU
3 – MULL
4 – UCO
5 – BNO
6 – VRTL
7 – SMCZ
8 – GUSH
9 – USO
10 – UGA
Lowest Technical Rated ETFs Per 3/20/2026’s Close:
1 – SMCX
2 – SMCL
3 – DJTU
4 – QBTX
5 – RGTX
6 – HIMZ
7 – IONX
8 – IONL
9 – MST
10 – HOOX
Highest Volume Rated ETFs Per 3/20/2026’s Close:
1 – EFFI
2 – PSCU
3 – IGCB
4 – DDTO
5 – QMID
6 – UBEW
7 – FLDZ
8 – TMAR
9 – XJUL
10 – MSFW
Lowest Volume Rated ETFs Per 3/20/2026’s Close:
1 – KLMN
2 – GSWO
3 – EUHY
4 – NHYB
5 – PCS
6 – NZAC
7 – BLUI
8 – PHYD
9 – ERNZ
10 – ACLO
Highest Technical Rated General Stocks Per 3/20/2026’s Close:
1 – AMPE
2 – BATL
3 – AXTI
4 – BNAI
5 – EDSA
6 – SNAX
7 – ANTX
8 – ROMA
9 – BW
10 – ERAS
Lowest Technical Rated General Stocks Per 3/20/2026’s Close:
1 – CMCT
2 – CTHRQ
3 – ZNB
4 – HUBC
5 – AREB
6 – WNW
7 – LBGJ
8 – ELPW
9 – CRKN
10 – SMX
Highest Volume Rated General Stocks Per 3/20/2026’s Close:
1 – CMCT
2 – TWO
3 – OUT
4 – RPT
5 – ADAM
6 – AREB
7 – SLG
8 – ANNA
9 – NSA
10 – AZTR
Lowest Volume Rated General Stocks Per 3/20/2026’s Close:
1 – OMQS
2 – MB
3 – KARX
4 – MIMI
5 – ZBAO
6 – NROM
7 – CTHRQ
8 – ADMT
9 – BIYA
10 – ATPC
*** THE LIST ABOVE IS STRICTLY FOR INFORMATIONAL PURPOSES – I MAY OR MAY NOT HAVE OR INITIATE A LONG, SHORT, OR LONG/SHORT POSITION IN ANY NAME ABOVE AT ANY TIME ***
The VIX closed at 24.06, indicating an implied one day move range of +/-1.52% & an implied one month move range of +/-6.95% for the S&P 500.
Highest Technical Rated S&P 500 Components Per 3/19/2026’s Close:
1 – SNDK
2 – CIEN
3 – WDC
4 – MU
5 – STX
6 – APA
7 – TER
8 – FIX
9 – TPL
10 – MRNA
Lowest Technical Rated S&P 500 Components Per 3/19/2026’s Close:
1 – TTD
2 – CSGP
3 – FISV
4 – PSKY
5 – WDAY
6 – IT
7 – FICO
8 – GDDY
9 – BLDR
10 – HUM
Highest Volume Rated S&P 500 Components Per 3/19/2026’s Close:
1 – NEM
2 – EXE
3 – FDX
4 – OTIS
5 – COR
6 – DRI
7 – DVN
8 – MU
9 – ES
10 – ACN
Lowest Volume Rated S&P 500 Components Per 3/19/2026’s Close:
1 – MRNA
2 – HPE
3 – AXON
4 – ELV
5 – CCI
6 – PAYC
7 – WYNN
8 – LYV
9 – ANET
10 – ARE
Highest Technical Rated ETFs Per 3/19/2026’s Close:
1 – MSTX
2 – BWET
3 – MUU
4 – MULL
5 – VRTL
6 – KORU
7 – UCO
8 – BNO
9 – GUSH
10 – DBE
Lowest Technical Rated ETFs Per 3/19/2026’s Close:
1 – DJTU
2 – QBTX
3 – RGTX
4 – SOLT
5 – IONX
6 – IONL
7 – RBLU
8 – MST
9 – XXRP
10 – NVOX
Highest Volume Rated ETFs Per 3/19/2026’s Close:
1 – ORO
2 – WTMY
3 – QCAP
4 – PSQO
5 – EMCR
6 – EPIN
7 – CARK
8 – MDAA
9 – IBGL
10 – QSPT
Lowest Volume Rated ETFs Per 3/19/2026’s Close:
1 – KLMN
2 – WTV
3 – JHLN
4 – NXUS
5 – JDVL
6 – OOSP
7 – NHYB
8 – IQSM
9 – FTKI
10 – TOAK
Highest Technical Rated General Stocks Per 3/19/2026’s Close:
1 – AXTI
2 – BATL
3 – BNAI
4 – EDSA
5 – BW
6 – ANTX
7 – SNDK
8 – ERAS
9 – AAOI
10 – LITE
Lowest Technical Rated General Stocks Per 3/19/2026’s Close:
1 – UOKA
2 – CMCT
3 – WNW
4 – ZNB
5 – HUBC
6 – LBGJ
7 – ELPW
8 – PAVS
9 – UCAR
10 – MI
Highest Volume Rated General Stocks Per 3/19/2026’s Close:
1 – TWO
2 – WETO
3 – CHNR
4 – DLTH
5 – SER
6 – GOAI
7 – LNKS
8 – AZTR
9 – OPTEY
10 – HUBC
Lowest Volume Rated General Stocks Per 3/19/2026’s Close:
1 – CTGL
2 – FMCB
3 – IVFH
4 – ELTK
5 – DXYN
6 – MLEC
7 – HNOI
8 – CRE
9 – ZBAO
10 – CDTG
*** THE LIST ABOVE IS STRICTLY FOR INFORMATIONAL PURPOSES – I MAY OR MAY NOT HAVE OR INITIATE A LONG, SHORT, OR LONG/SHORT POSITION IN ANY NAME ABOVE AT ANY TIME ***
SPY, the SPDR S&P 500 ETF fell -1.5% last week, while the VIX closed the week at 27.19, indicating an implied one day move range of +/-1.71% & an implied one month move range of +/-7.86%.
SPY ETF – SPDR S&P 500 ETF’s Technical Performance Over The Past Year
Their RSI is trending down, approaching the oversold 30-mark at 33.54, while their MACD is bearish, as it has been for most of 2026 so far.
Volumes were +13.29% higher than the prior year’s average (88,696,000 vs. 78,290,000), indicating that there is more of a risk-off sentiment creeping into the market.
Monday opened the week off with a bullish engulfing pattern formation on solid volume, likely baiting smaller fish into buying into the market.
Tuesday confirmed this when the session opened lower, climbed above Monday’s high, only to decline in a high wave gravestone doji, indicating that there was still bearish sentiment left among market participants.
Wednesday this theme continued, with a lower open and another doji candle indicating uncertainty & complacency at once, on the week’s lowest volume (Tuesday had the second lowest).
Something of note here is that the 10 day moving average has been signaling that there is no faith in the short-term trend & has held up robustly as a resistance level.
Thursday opened on a gap down that broke down the lower Bollinger Band on the highest volume of the week signaling that there was a bit of panic spreading & that folks were moving towards the exit.
Friday opened higher, but slumped throughout the day as there was a risk-off heading into the weekend sentiment, indicated by the second highest volume of the week.
Heading into the new week keep an eye on how high prices can break out above the short-term trendline or if it holds staunch & forces price lower, particularly if there is a break made towards the 200 day moving average which is now within <1% of the week’s closing price level for SPY.
This is particularly interesting as it is currently in a Seller dominated price zone that sits atop another Seller zone, which may show us the breakdown of the 200 DMA as support levels are spread rather thin, as outlined below.
SPY has support at the $659.26 (Volume Sentiment: Sellers, 1.55:1), $656.41 (200 Day Moving Average, Volume Sentiment: Sellers, 1.55:1), $651.25 (Volume Sentiment: Sellers, 4.56:1) & $648.93/share (Volume Sentiment: Buyers, 3.6:0*) price levels, with resistance at the $662.39 (Volume Sentiment: Buyers, 2.52:1), $671.96 (Volume Sentiment: Buyers, 1.4:1), $675.79 (Volume Sentiment: Sellers, 1.28:1) & $676.57/share (10 Day Moving Average, Volume Sentiment: Sellers, 1.28:1) price levels
SPY ETF’s Price Level:Volume Sentiment Over The Past ~3 Years
QQQ, the Invesco QQQ Trust ETF dipped -1.01% for the week, as the tech-heavy index fared the best of thefour major index ETFs.
QQQ ETF – Invesco QQQ Trust ETF’s Technical Performance Over The Past Year
Their RSI is trending down, currently at 39.85, while their MACD crossed over bearishly towards the end of the week.
Volumes were +29.62% higher than the prior year’s average (70,054,000 vs. 54,047,720), as investors hopped into the tech heavy index on Monday & Tuesday in droves, before rug pulling their money out by week’s end.
Monday opened lower, but like SPY managed to power higher to form a bullish engulfing pattern with Friday’s candle on the highest volume of the week for QQQ.
Tuesday opened higher, ran up towards the upper Bollinger Band, but ultimately sank down for a slight advance, but forming a gravestone doji which signaled that pessimism was strong.
Wednesday is when the cracks began to show, as a bearish engulfing doji emerged that closed in-line with the 10 day moving average, signaling that there was a problem for the short-term trendline.
Thursday opened on a gap down that ultimately sank lower to touch the lower Bollinger Band, indicating that there was trouble in the air for the tech-heavy index, particularly as it was the second highest volume session of the week.
Friday the trend continued and was confirmed, with a higher open that ran up to test the resistance of the 10 day moving average, only to be rejected & sink back down to close below the lower Bollinger Band on comparable volume to Thursday’s sell off.
This week shares a similar outlook to SPY, the 10 DMA will be an area to watch as it will either walk QQQ down further, or a breakout may occur, but the former seems the more likely case.
Below is a list of the Buyer:Seller sentiment for QQQ.
QQQ has support at the $591.33 (Volume Sentiment: Buyers, 1.59:1), $590.15 (200 Day Moving Average, Volume Sentiment: Buyers, 1.59:1), $589.37 (Volume Sentiment: Sellers, 1.31:1) & $581.89/share (Volume Sentiment: Sellers, 2.33:1) price levels, with resistance at the $594.76 (Volume Sentiment: Buyers, 1.59:1), $597.90 (Volume Sentiment: Sellers, 1.45:1), $599.51 (Volume Sentiment: Sellers, 1.45:1) & $604.33/share (10 Day Moving Average, Volume Sentiment: Buyers, 1.78:1) price levels
QQQ ETF’s Price Level:Volume Sentiment Over The Past ~1 Year
IWM ETF – iShares Russell 2000 ETF’s Technical Performance Over The Past Year
Their RSI is bearish at 33.61, while their MACD is continuing a bearish streak that began on January 27, 2026.
Volumes were +49.56% higher than the prior year’s average (57,218,000 vs. 38,256,360), as there was clearly a risk-off sentiment for the small cap index.
Monday was exactly like SPY & QQQ in that IWM opened lower, but managed to trudge higher throughout the session to form a bullish engulfing pattern on the highest volume of the week.
Tuesday opened lower than Monday’s closing price, ran higher to test the 10 DMA but was rejected & ultimately sank lower to close higher than its open, but signaling weakness.
Wednesday was similar, except the run up did not make it to test the 10 DMA, but ultimately straddled the lower Bollinger Band & closed above the opening price, but still down on the day.
Thursday the fun began, as the second highest volume session of the week resulted in a gap down that continued lower to close below the lower Bollinger Band.
Friday saw this trend continue, as IWM opened higher, but ultimately sank down to form a bearish engulfing pattern on the week’s third highest volume, indicating severe uncertainty heading into the weekend.
Much like SPY & QQQ, IWM’s week will be focused on whether or not the resistance of the 10 day moving average holds up or not.
Should it, expect further declines & a meeting with the 200 day moving average, but if it breaks out above expect a consolidation while the 20 DMA approaches the 10 DMA.
IWM has support at the $245.86 (Volume Sentiment: Buyers, 1.32:1), $244.39 (Volume Sentiment: Buyers, 1.32:1), $239.96 (Volume Sentiment: Buyers, 1.57:1) & $239.38/share (200 Day Moving Average, Volume Sentiment: Buyers, 1.57:1) price levels, with resistance at the $247.65 (Volume Sentiment: Buyers, 1.32:1), $251.92 (Volume Sentiment: Buyers, 4.67:1), $254.63 (10 Day Moving Average, Volume Sentiment: NULL, 0:0*) & $255.05/share (Volume Sentiment: NULL, 0:0*) price levels
IWM ETF’s Price Level:Volume Sentiment Over The Past ~2 Years
DIA ETF – SPDR Dow Jones Industrial Average ETF’s Technical Performance Over The Past Year
Their RSI is in oversold territory at 28.49, while their MACD is looking similar to IWM’s in terms of prolonged bearishness (minus 4 sessions in February 2026).
Volumes were +51.93% higher than the prior year’saverage (7,734,000 vs. 5,090,480), as the buy & hold blue chip index had market participants spooked.
DIA also started the week with a bullish engulfing pattern, which notably opened below the lower Bollinger Band, continued lower, before powering back higher to close in-line with it; not a great sentiment indicated.
Tuesday showed a gravestone high wave doji, signaling that the wheels were coming off of the truck.
Wednesday opened lower and continued so, but managed to close near the lower Bollinger Band after temporarily dipping beneath it.
Thursday opened on a gap lower & the second highest volume session of the week showed more selling and closed below the lower Bollinger Band.
Friday followed suit, opening slightly higher, only to sink back down to the lower Bollinger Band on the week’s third highest volume.
Heading into the new week, reference the data below with a keen eye on the 10 DMA to see if there’s a breakout to the upside.
DIA has support at the $462.52 (Volume Sentiment: Buyers, 7:1), $462.34 (200 Day Moving Average, Volume Sentiment: Buyers, 7:1), $455.41 (Volume Sentiment: Sellers, 10.73:1) & $452.12/share (Volume Sentiment: Sellers, 10.73:1) price levels, with resistance at the $466.68 (Volume Sentiment: Sellers, 1.17:1), $467.86 (Volume Sentiment: Sellers, 1.17:1), $477.98 (Volume Sentiment: Buyers, 0.8:0*) & $478.18/share (10 Day Moving Average, Volume Sentiment: Buyers, 0.8:0*) price levels
DIA ETF’s Price Level:Volume Sentiment Over The Past ~2-3 Years
The Week Ahead
Monday the week begins with Empire State Manufacturing Survey data at 8:30 am, before Industrial Production & Capacity Utilization data comes out at 9:15 am.
Dollar Tree, KE Holdings & Science Applications announce earnings Monday morning before the opening bell, followed by Getty Images & Semtech after the closing bell.
Pneding Home Sales & Home Builder Confidence Index data comes out Tuesday at 10 am.
Tuesday morning features earnings reports from Academy SPorts + Outdoors, HUYA & Tencent Music, before Oklo, DocuSign, Kestra Medical Technologies, Lululemon athletica, Titan America & ZTO Express after the closing bell.
Wednesday delivers the highly anticipated Producer Price Index, Core PPI, PPI Year-over-Year & Core PPI Year-over-Year data at 8:30 am, followed by Factory Orders data at 10 am, the FOMC Interest-Rate Decision announcement at 2pm & Fed Chair Powell’s Press Conference at 2:30 pm.
Almonty Industries, General Mills, Hello Group, Jabil, Macy’s, Sail point, Weibo & Williams-Sonoma report earnings Wednesday before the session’s open, with Micron Technology, dLocal, Five Below & Heartflow reporting after the session’s closing bell.
Initial Jobless Claims & Philadelphia Fed Manufacturing Survey data come out Thursday at 8:30 am, before Wholesale Inventories & New Home Sales data at 10 am.
Thursday morning features earnings reports from Accelerant Holdings, Accenture, Alibaba, Arcos Dorados, Caleres, Canadian Solar, Darden Restaurants & Signet Jewelers with earnings from FedEx & Planet Labs after the closing bell.
Friday has no major economic data nor earnings reports scheduled for release.
See you back here next week!
*** I DO NOT OWN SHARES OR OPTIONS CONTRACT POSITIONS IN SPY, QQQ, IWM OR DIA AT THE TIME OF PUBLISHING THIS ARTICLE ***
The VIX closed at 23.51, indicating an implied one day move range of +/-1.48% & an implied one month move range of +/-6.79% for the S&P 500.
Highest Technical Rated S&P 500 Components Per 3/16/2026’s Close:
1 – SNDK
2 – CIEN
3 – WDC
4 – MU
5 – TER
6 – MRNA
7 – TPL
8 – FIX
9 – STX
10 – GLW
Lowest Technical Rated S&P 500 Components Per 3/16/2026’s Close:
1 – ARES
2 – CSGP
3 – FISV
4 – TTD
5 – WDAY
6 – GDDY
7 – IT
8 – PSKY
9 – KKR
10 – CPB
Highest Volume Rated S&P 500 Components Per 3/16/2026’s Close:
1 – ULTA
2 – PSA
3 – HOLX
4 – PAYC
5 – ADBE
6 – CF
7 – MOS
8 – DLTR
9 – DVN
10 – GPC
Lowest Volume Rated S&P 500 Components Per 3/16/2026’s Close:
1 – KVUE
2 – ALB
3 – WTW
4 – FSLR
5 – AIG
6 – BKNG
7 – ITW
8 – NDAQ
9 – REG
10 – GILD
Highest Technical Rated ETFs Per 3/16/2026’s Close:
1 – BWET
2 – MUU
3 – MULL
4 – VRTL
5 – KORU
6 – UCO
7 – CRCG
8 – CCUP
9 – CRCA
10 – BNO
Lowest Technical Rated ETFs Per 3/16/2026’s Close:
1 – RGTX
2 – DJTU
3 – QBTX
4 – RBLU
5 – IONX
6 – IONL
7 – HOOX
8 – HOOG
9 – NVOX
10 – ZSL
Highest Volume Rated ETFs Per 3/16/2026’s Close:
1 – TENJ
2 – TXUG
3 – DVRE
4 – RFCI
5 – LCAP
6 – EEV
7 – CORO
8 – SEPU
9 – PXJ
10 – MTGP
Lowest Volume Rated ETFs Per 3/16/2026’s Close:
1 – KLMN
2 – SPMB
3 – PCRB
4 – PHYD
5 – SIXP
6 – NXUS
7 – BCYIF
8 – WSML
9 – IMF
10 – SSFI
Highest Technical Rated General Stocks Per 3/16/2026’s Close:
1 – VSTTF
2 – BATL
3 – ANTX
4 – CRTG
5 – AXTI
6 – BNAI
7 – EONR
8 – VAXX
9 – SNDK
10 – BSXGF
Lowest Technical Rated General Stocks Per 3/16/2026’s Close:
1 – ZNB
2 – VCIG
3 – EJH
4 – SMX
5 – HUBC
6 – MI
7 – PAVS
8 – CMCT
9 – IBG
10 – KXIN
Highest Volume Rated General Stocks Per 3/16/2026’s Close:
1 – WNW
2 – HCWB
3 – NSRX
4 – OUT
5 – JZ
6 – TWAV
7 – UNIT
8 – CYCU
9 – AIRS
10 – YXT
Lowest Volume Rated General Stocks Per 3/16/2026’s Close:
1 – BARUF
2 – GRTX
3 – BCUFF
4 – SVBL
5 – INTI
6 – OCEA
7 – RKMSF
8 – VDOMF
9 – CARV
10 – CIAFF
*** THE LIST ABOVE IS STRICTLY FOR INFORMATIONAL PURPOSES – I MAY OR MAY NOT HAVE OR INITIATE A LONG, SHORT, OR LONG/SHORT POSITION IN ANY NAME ABOVE AT ANY TIME ***
The VIX closed at 27.19, indicating an implied one day move range of +/-1.71% & an implied one month move range of +/-7.86% for the S&P 500.
Highest Technical Rated S&P 500 Components Per 3/13/2026’s Close:
1 – SNDK
2 – CIEN
3 – MU
4 – WDC
5 – TPL
6 – MRNA
7 – CF
8 – TER
9 – APA
10 – FIX
Lowest Technical Rated S&P 500 Components Per 3/13/2026’s Close:
1 – ARES
2 – FISV
3 – CSGP
4 – GDDY
5 – WDAY
6 – TTD
7 – HUM
8 – FICO
9 – KKR
10 – FDS
Highest Volume Rated S&P 500 Components Per 3/13/2026’s Close:
1 – ULTA
2 – ADBE
3 – VTR
4 – IR
5 – MOS
6 – CF
7 – PODD
8 – FOX
9 – LW
10 – BKR
Lowest Volume Rated S&P 500 Components Per 3/13/2026’s Close:
1 – GRMN
2 – EXPE
3 – KVUE
4 – WTW
5 – TER
6 – DASH
7 – TXN
8 – TMUS
9 – FSLR
10 – MAA
Highest Technical Rated ETFs Per 3/13/2026’s Close:
1 – BWET
2 – MUU
3 – MULL
4 – UCO
5 – VRTL
6 – USO
7 – BNO
8 – DBO
9 – DBE
10 – GUSH
Lowest Technical Rated ETFs Per 3/13/2026’s Close:
1 – RBLU
2 – XXRP
3 – RGTX
4 – IONX
5 – SOLT
6 – XRPT
7 – DJTU
8 – QBTX
9 – HOOX
10 – IONL
Highest Volume Rated ETFs Per 3/13/2026’s Close:
1 – LSVD
2 – EPSV
3 – INRO
4 – BCUS
5 – EMSF
6 – DARP
7 – CORO
8 – CORP
9 – NDIA
10 – FLQL
Lowest Volume Rated ETFs Per 3/13/2026’s Close:
1 – KLMN
2 – NXUS
3 – BHYB
4 – PCS
5 – SPHY
6 – IQSM
7 – USCA
8 – PFUT
9 – SPEU
10 – LRND
Highest Technical Rated General Stocks Per 3/13/2026’s Close:
1 – BATL
2 – CRTG
3 – ANTX
4 – EONR
5 – AXTI
6 – ROYL
7 – BNAI
8 – NCI
9 – EDSA
10 – SNAX
Lowest Technical Rated General Stocks Per 3/13/2026’s Close:
1 – VCIG
2 – ZNB
3 – EJH
4 – HUBC
5 – SMX
6 – MI
7 – UOKA
8 – IBG
9 – AREB
10 – SXTC
Highest Volume Rated General Stocks Per 3/13/2026’s Close:
1 – XRN
2 – DEVS
3 – BIAF
4 – SOWG
5 – OUT
6 – IMMP
7 – CSTE
8 – ISPC
9 – DCMDF
10 – SVCO
Lowest Volume Rated General Stocks Per 3/13/2026’s Close:
1 – BLGVF
2 – RRDMF
3 – NBYCF
4 – ALPIB
5 – OPWEF
6 – BCUFF
7 – LNKS
8 – OMQS
9 – GRAN
10 – TMGEF
*** THE LIST ABOVE IS STRICTLY FOR INFORMATIONAL PURPOSES – I MAY OR MAY NOT HAVE OR INITIATE A LONG, SHORT, OR LONG/SHORT POSITION IN ANY NAME ABOVE AT ANY TIME ***
The VIX closed at 25.5, indicating an implied one day move range of +/-1.61% & an implied one month move range of +/-7.37% for the S&P 500.
Highest Technical Rated S&P 500 Components Per 3/9/2026’s Close:
1 – SNDK
2 – MRNA
3 – CIEN
4 – WDC
5 – TER
6 – TPL
7 – MU
8 – FIX
9 – GLW
10 – KEYS
Lowest Technical Rated S&P 500 Components Per 3/9/2026’s Close:
1 – ARES
2 – IT
3 – FISV
4 – TTD
5 – CSGP
6 – BX
7 – KKR
8 – HUM
9 – WDAY
10 – GDDY
Highest Volume Rated S&P 500 Components Per 3/9/2026’s Close:
1 – CF
2 – DAL
3 – UAL
4 – WYNN
5 – BLK
6 – CCL
7 – OXY
8 – LYV
9 – LYB
10 – DVN
Lowest Volume Rated S&P 500 Components Per 3/9/2026’s Close:
1 – KIM
2 – CBRE
3 – NDSN
4 – CARR
5 – CTVA
6 – VLTO
7 – JCI
8 – ITW
9 – TECH
10 – J
Highest Technical Rated ETFs Per 3/9/2026’s Close:
1 – BWET
2 – VRTL
3 – KORU
4 – MULL
5 – MUU
6 – UCO
7 – CCUP
8 – CRCG
9 – CRCA
10 – USO
Lowest Technical Rated ETFs Per 3/9/2026’s Close:
1 – XXRP
2 – SOLT
3 – ZSL
4 – MST
5 – ETHT
6 -ETHU
7 – DJTU
8 -MSTU
9 – MSTX
10 – RBLU
Highest Volume Rated ETFs Per 3/9/2026’s Close:
1 – PCS
2 – CGHY
3 – LQPE
4 – PMSE
5 – RBIL
6 – FRIZ
7 – CVXV
8 – NBCR
9 – SCO
10 – DVXE
Lowest Volume Rated ETFs Per 3/9/2026’s Close:
1 – EZA
2 – CGIC
3 – LVHI
4 – LMBS
5 – NBSD
6 – FDD
7 – FPEI
8 – RPV
9 – FRDM
10 – EDGF
Highest Technical Rated General Stocks Per 3/9/2026’s Close:
1 – BATL
2 – DLAPQ
3 – ANTX
4 – NCI
5 – EDSA
6 – BNAI
7 – TURB
8 – HGRAF
9 – AAOI
10 – ERAS
Lowest Technical Rated General Stocks Per 3/9/2026’s Close:
1 – ELPW
2 – QH
3 – VCIG
4 – LBGJ
5 – UOKA
6 – HCTI
7 – CRKN
8 – AREB
9 – SANW
10 – XTKG
Highest Volume Rated General Stocks Per 3/9/2026’s Close:
1 – AGH
2 – GSIW
3 – AZI
4 – OUT
5 – CIIT
6 – ANTX
7 – DEVS
8 – MDCX
9 – VMAR
10 – CAMP
Lowest Volume Rated General Stocks Per 3/9/2026’s Close:
1 – PMTS
2 – GNTA
3 – ANGI
4 – KBR
5 – DFIN
6 – KRC
7 -IDYA
8 – HTLD
9 – NVGS
10 – IVA
*** THE LIST ABOVE IS STRICTLY FOR INFORMATIONAL PURPOSES – I MAY OR MAY NOT HAVE OR INITIATE A LONG, SHORT, OR LONG/SHORT POSITION IN ANY NAME ABOVE AT ANY TIME ***
The VIX closed at 23.75, indicating an implied one day move range of +/-1.5% & an implied one month move range of +/-6.86% for the S&P 500.
Highest Technical Rated S&P 500 Components Per 3/5/2026’s Close:
1 – SNDK
2 – TER
3 – MRNA
4 – WDC
5 – MU
6 – CIEN
7 – TPL
8 – GLW
9 – FIX
10 – KEYS
Lowest Technical Rated S&P 500 Components Per 3/5/2026’s Close:
1 – IT
2 – CSGP
3 – ARES
4 – HUM
5 – FISV
6 – WDAY
7 – TTD
8 – GDDY
9 – BX
10 – BSX
Highest Volume Rated S&P 500 Components Per 3/5/2026’s Close:
1 – TTD
2 – CF
3 – EXPE
4 – LYB
5 – AME
6 – HOLX
7 – DAL
8 – CIEN
9 – KR
10 – FANG
Lowest Volume Rated S&P 500 Components Per 3/5/2026’s Close:
1 – KIM
2 – CBRE
3 – NDSN
4 – CARR
5 – CVTA
6 – VLTO
7 – JCI
8 – ITW
9 – TECH
10 – J
Highest Technical Rated ETFs Per 3/5/2026’s Close:
1 – SOXS
2 – JDST
3 – BWET
4 – MULL
5 – MUU
6 – VRTL
7 – KORU
8 – GUSH
9 – UCO
10 – CCUP
Lowest Technical Rated ETFs Per 3/5/2026’s Close:
1 – HIMZ
2 – XXRP
3 – SOLT
4 – ZSL
5 – MST
6 – RGTX
7 – MSTU
8 – ETHT
9 – NVOX
10 – MSTX
Highest Volume Rated ETFs Per 3/5/2026’s Close:
1 – JHLN
2 – EFFE
3 – SPYE
4 – APRB
5 – JDVL
6 – ITOL
7 – JEMB
8 – ACVT
9 – XOMZ
10 – GMUB
Lowest Volume Rated ETFs Per 3/5/2026’s Close:
1 – JMST
2 – CGGR
3 – DFAX
4 – FXTO
5 – DFUS
6 – JIRE
7 – DUHP
8 – RDVI
9 – GUNR
10 – CGUS
Highest Technical Rated General Stocks Per 3/5/2026’s Close:
1 – BATL
2 – NCI
3 – BNAI
4 – ONPH
5 – TMDE
6 – SNAX
7 – ERAS
8 – AXTI
9 – AAOI
10 – SRCGF
Lowest Technical Rated General Stocks Per 3/5/2026’s Close:
1 – BHLL
2 – QH
3 – ELPW
4 – BHAT
5 – PAIYY
6 – UOKA
7 – VCIG
8 – LBGJ
9 – HCTI
10 – KXIN
Highest Volume Rated General Stocks Per 3/5/2026’s Close:
1 – MTEK
2 – IBO
3 – OUT
4 – ELAB
5 – CMCT
6 – BTAI
7 – VMAR
8 – GBR
9 – BHLL
10 – VBIX
Lowest Volume Rated General Stocks Per 3/5/2026’s Close:
1 – XWEL
2 – HUBG
3 – NXPL
4 – KIM
5 – NEOG
6 – IVT
7 – KNX
8 – KMT
9 – SCHL
10 – CBLL
*** THE LIST ABOVE IS STRICTLY FOR INFORMATIONAL PURPOSES – I MAY OR MAY NOT HAVE OR INITIATE A LONG, SHORT, OR LONG/SHORT POSITION IN ANY NAME ABOVE AT ANY TIME ***
The VIX closed at 21.15, indicating an implied one day move range of +/-1.33% & an implied one month move range of +/-6.11% for the S&P 500.
Highest Technical Rated S&P 500 Components Per 3/4/2026’s Close:
1 – SNDK
2 – CIEN
3 – MRNA
4 – TER
5 – GLW
6 – WDC
7 – MU
8 – TPL
9 – FIX
10 – KEYS
Lowest Technical Rated S&P 500 Components Per 3/4/2026’s Close:
1 – TTD
2 – IT
3 – CSGP
4 – WDAY
5 – GDDY
6 – FISV
7 – ARES
8 – BX
9 – HUM
10 – KKR
Highest Volume Rated S&P 500 Components Per 3/4/2026’s Close:
1 – NRG
2 – ROST
3 – COIN
4 – CRWD
5 – MTD
6 – CPB
7 – MRNA
8 – UPS
9 – AES
10 – WYNN
Lowest Volume Rated S&P 500 Components Per 3/4/2026’s Close:
1 – KIM
2 – CBRE
3 – NDSN
4 – CARR
5 – CTVA
6 – VLTO
7 – JCI
8 – ITW
9 – TECH
10 – J
Highest Technical Rated ETFs Per 3/4/2026’s Close:
1 – BWET
2 – KORU
3 – MULL
4 – MUU
5 – VRTL
6 – JNUG
7 – NUGT
8 – CCUP
9 – SLVR
10 – CRCG
Lowest Technical Rated ETFs Per 3/4/2026’s Close:
1 – HIMZ
2 – ZSL
3 – XXRP
4 – NVOX
5 – SOLT
6 – MST
7 – QBTX
8 – ETHT
9 – JDST
10 – TEMT
Highest Volume Rated ETFs Per 3/4/2026’s Close:
1 – MUND
2 – EMES
3 – BITK
4 – MFSG
5 – CSTK
6 – EFFE
7 – PMMR
8 – DVXK
9 – MFSV
10 – NUMV
Lowest Volume Rated ETFs Per 3/4/2026’s Close:
1 – JMST
2 – CGCB
3 – DFAX
4 – FXTO
5 – CGCP
6 – DFUS
7 – VCRB
8 – EVTR
9 – GGLS
10 – IYE
Highest Technical Rated General Stocks Per 3/4/2026’s Close:
1 – BATL
2 – AMPE
3 – BNAI
4 – ONPH
5 – NCI
6 – AXTI
7 – ERAS
8 – HGRAF
9 – AAOI
10 – ALOY
Lowest Technical Rated General Stocks Per 3/4/2026’s Close:
1 – BHAT
2 – QH
3 – UOKA
4 – TIRX
5 – HCTI
6 – LBGJ
7 – XTKG
8 – AREB
9 – KXIN
10 – SXTC
Highest Volume Rated General Stocks Per 3/4/2026’s Close:
1 – AIFF
2 – DEA
3 – VCIG
4 – CANF
5 – ASNS
6 – PMNT
7 – OUT
8 – CDTG
9 – DXST
10 -ELAB
Lowest Volume Rated General Stocks Per 3/4/2026’s Close:
1 – BRTX
2 – CUBI
3 – APGE
4 – BRLS
5 – LEE
6 – KRT
7 – FOSL
8 – INV
9 – LKQ
10 – SATS
*** THE LIST ABOVE IS STRICTLY FOR INFORMATIONAL PURPOSES – I MAY OR MAY NOT HAVE OR INITIATE A LONG, SHORT, OR LONG/SHORT POSITION IN ANY NAME ABOVE AT ANY TIME ***