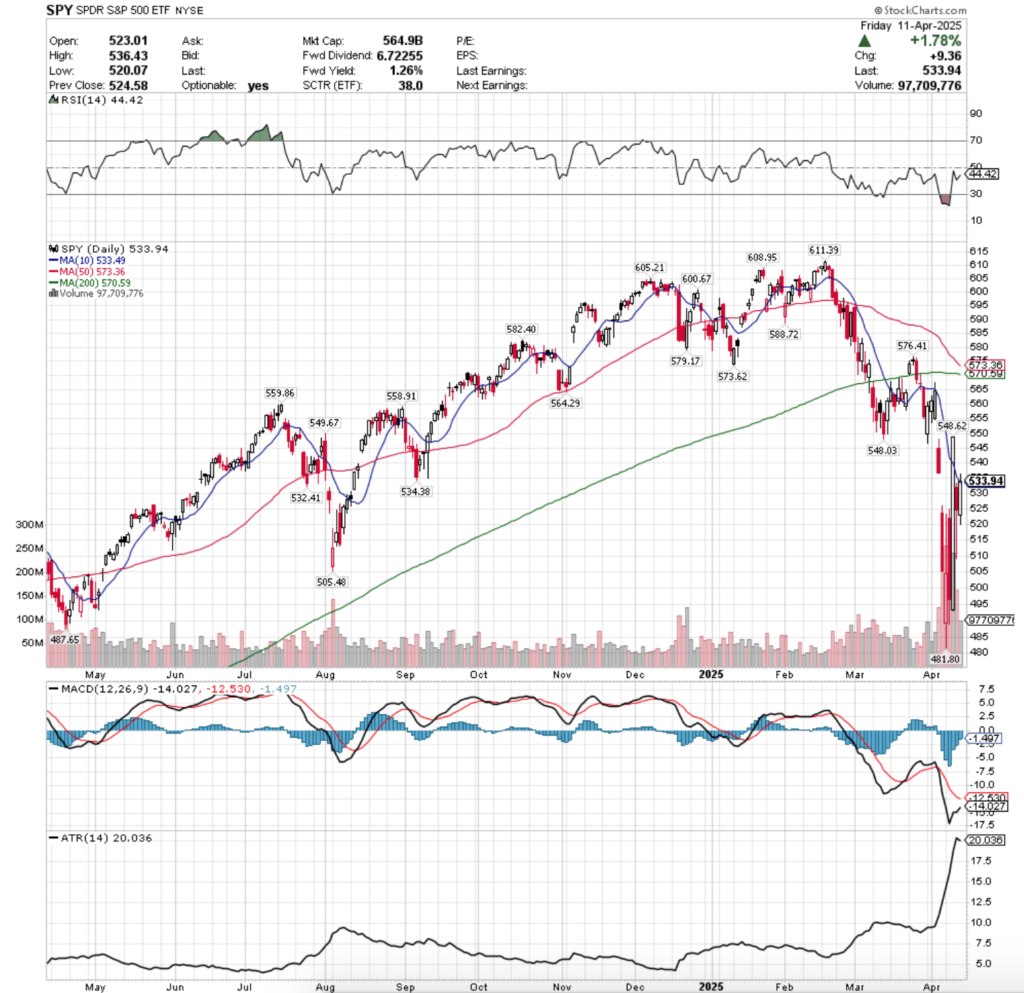
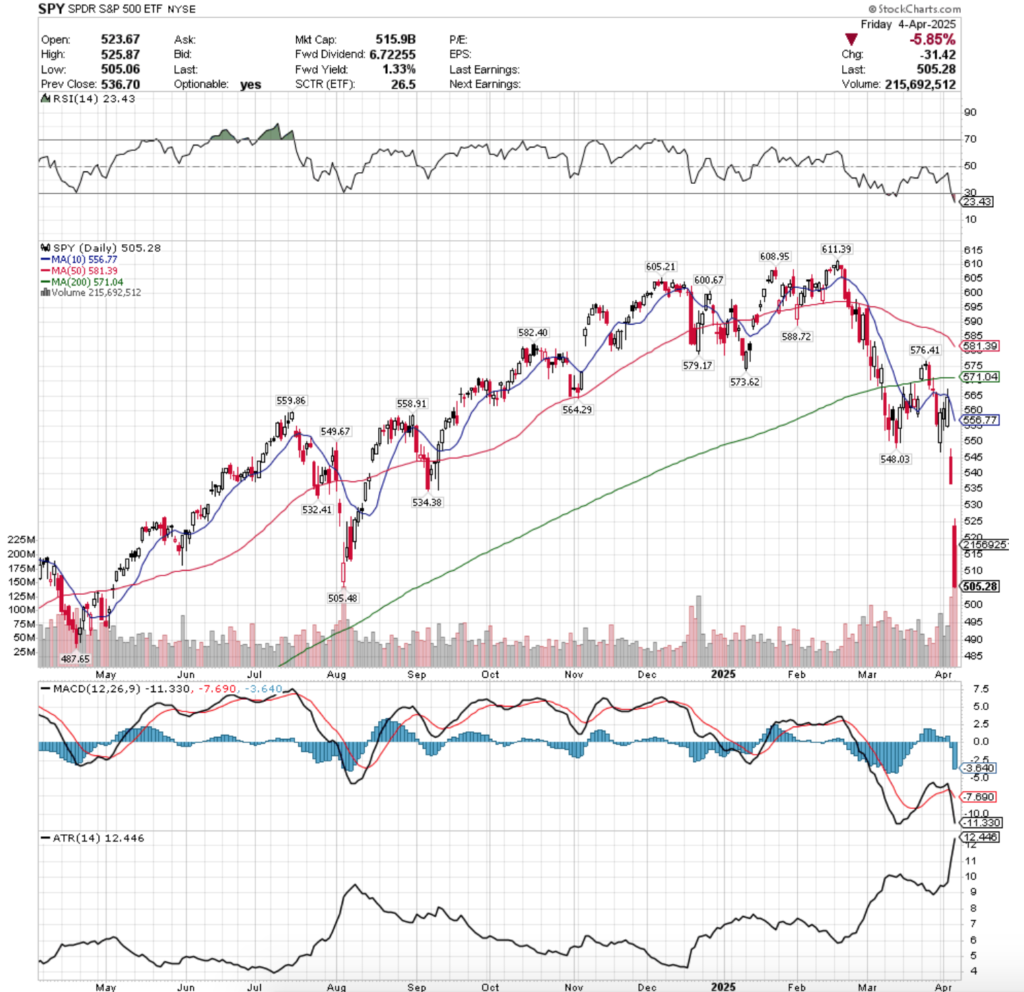
SPY, the SPDR S&P 500 ETF fell -1.41% last week, while the VIX closed the week at 29.65, indicating an implied one day move of +/-1.87% & a one month implied move of +/-8.57%.
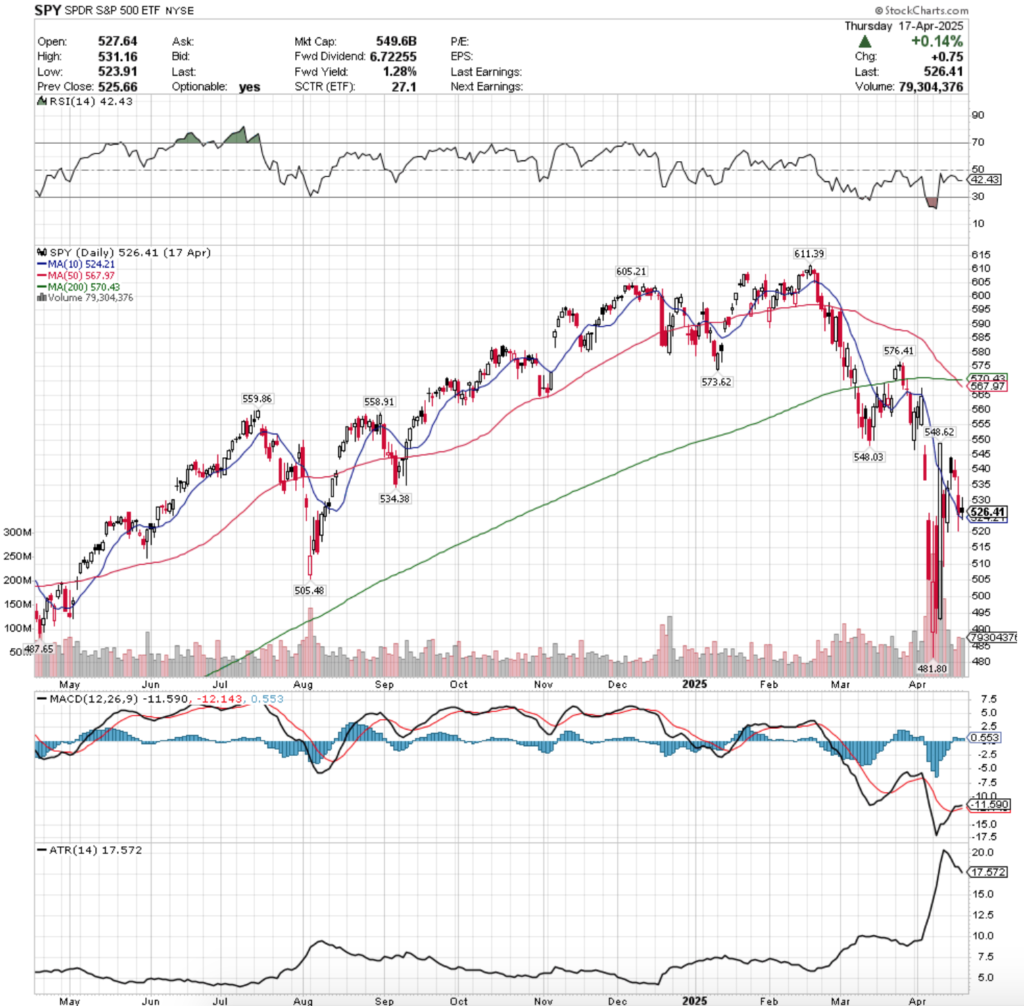
Their RSI is flat & currently at 42.43, while their MACD is dolphining & looks ready to cross back over bearishly in the coming day or two, as their histogram is waning.
Volumes were +29.18% above the prior year’s average (72,067,500 vs. 55,786,349), indicating that the mood is clearly still bearish, with a side of undecided.
Monday began on a gap up open above the 10 day moving average’s support, but it flashed some warning signs that set the tone for the rest of the week.
The gap up opened just below the $545/share price level, but declined into the day, at one point touching as low as $533.66/share, indicating that there was more downside appetite than upside.
SPY also closed lower than it opened on the day on the second lowest volume of the week, which was not a vote of confidence in the market.
Tuesday confirmed that there was not much excitement, nor bullish sentiment for SPY, as the session tried to advance early, but was unable to reach Monday’s high & the day went downhill from there.
Granted Tuesday had the lowest volume of the week, but it showed that market participants were not interested in the $545/share price level & set the stage for the declines of later in the week.
On Wednesday the floodgates opened, as SPY opened on a gap down, tested up towards Tuesday’s close, but was unable to & collapsed to form a high wave candle with a 3%+ range on the day that closed in-line with the 10 day moving average.
Thursday indicated that there would be further pain on the horizon, as it resulted in a bearish harami pattern, with a spinning top candle that closed lower than it opened; not exactly strong sentiment or a vote of confidence for the coming week.
While the day’s low managed to be supported by the 10 DMA, there was not much strength heading into Easter weekend.
Heading into the new week, the upside case remains the same as it’s been for past month or two; without a consistent uptick in advancing volume there will be no floor build for SPY to rally off of.
Even with a higher open, volume sentiment is not indicating that SPY’s next handful of price levels will be a cakewalk higher through, making it more imperative that a surge in advancing volume accompanies any move higher.
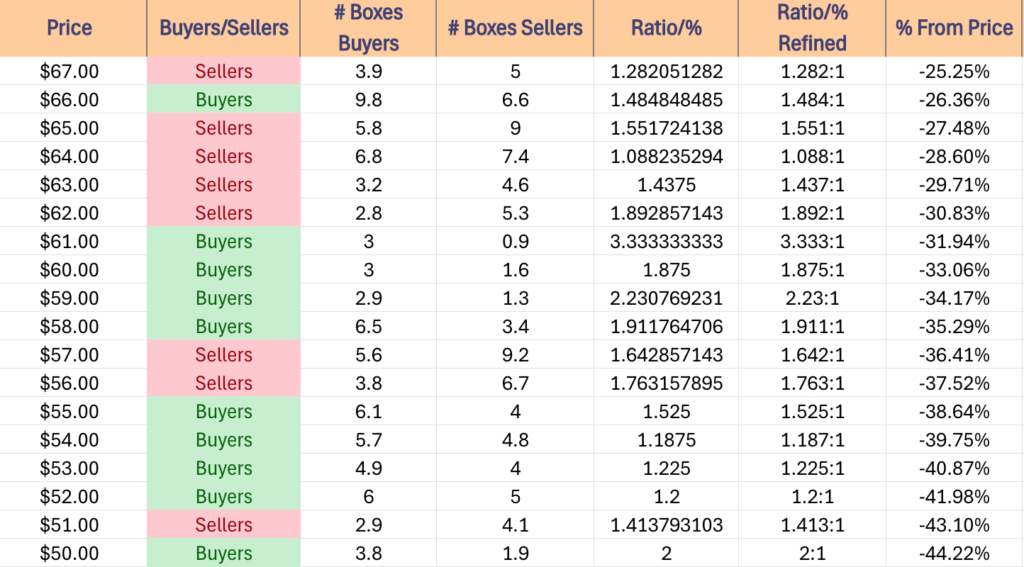
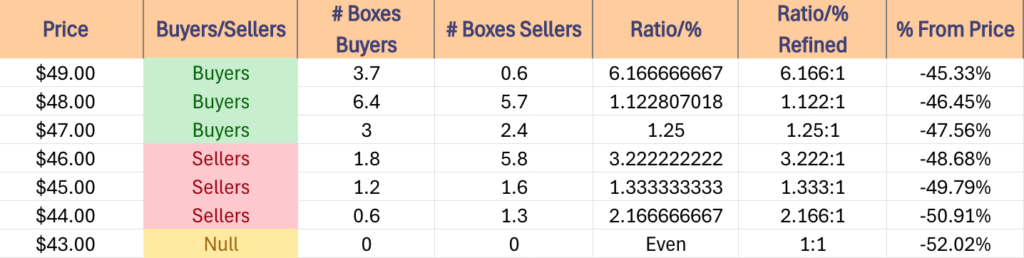
To the downside, things have become interesting after SPY set a new support level at $481.80/share last week, which happens to be the lowest level on their one year chart.
While the $520-524.99/share price level has strong Buyer oriented sentiment historically, should it be retested & broken through that $481.80/share mark is where to be looking next.
The base case for the coming week is to see SPY hug & oscillate around the 10 day moving average, until given a reason to break out one way or the other, which will likely come as a results of earnings reports (particularly the number of companies that pull guidance).
The should the low end of the range break below 4/9/2025’s low, that $481.80/share support level becomes the linchpin that keeps SPY from tumbling lower.
Even more troubling, there’s quite a bit of Seller dominated price zones between SPY’s current price & that level, so while that price level is a stronghold for Buyers at a rate of 5.67:1, it could very well break down & we see that strong ratio dilute given the amount of steam it has & amount of negative sentiment.
Again, this will likely come from earnings calls in the next week or two, else based on tariff news.
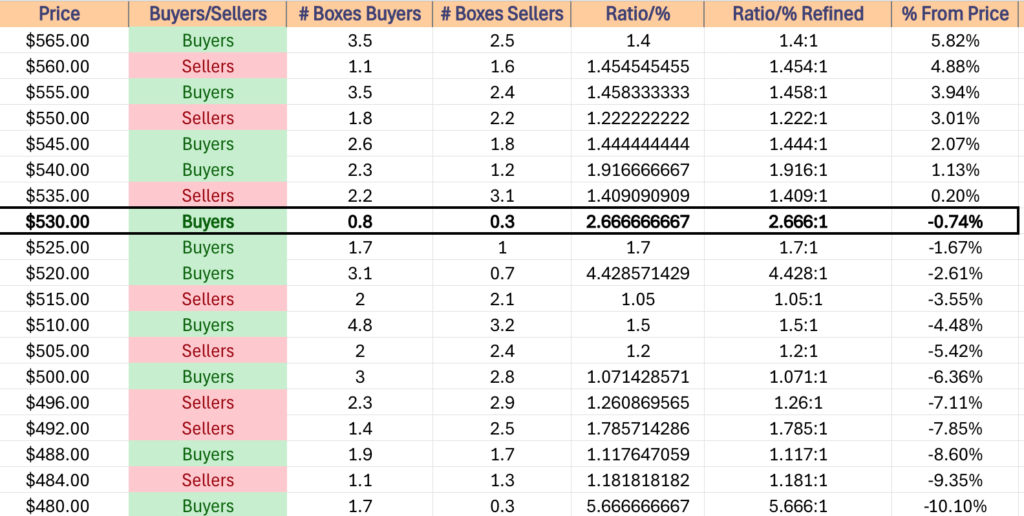
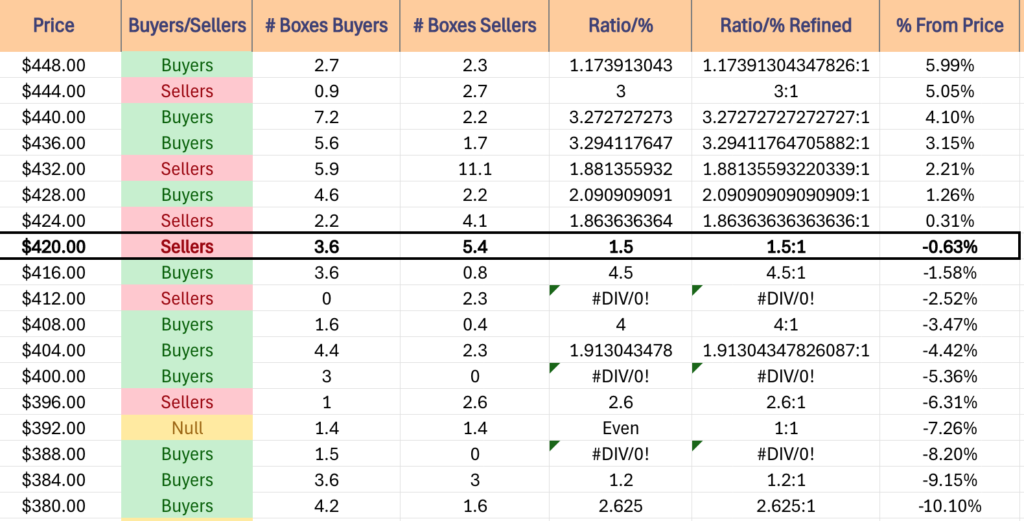
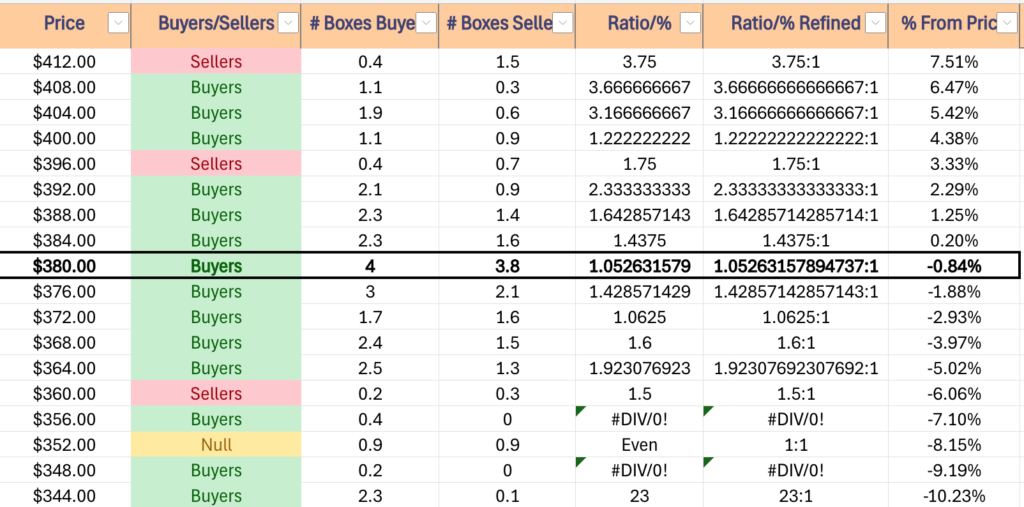
SPY has support at the $ 524.21(10 Day Moving Average, Volume Sentiment: Buyers, 4.43:1), $505.48 (Volume Sentiment: Sellers, 1.2:1), $487.65 (Volume Sentiment: ) & $481.80/share (Volume Sentiment: Buyers, 5.67:1) price levels, with resistance at the $534.38 (Volume Sentiment: Sellers, 1.41:1), $548.03 (Volume Sentiment: Buyers, 1.44:1), $548.62 (Volume Sentiment: Buyers, 1.44:1) & $558.91/share (Volume Sentiment: 1.46:1) price levels.
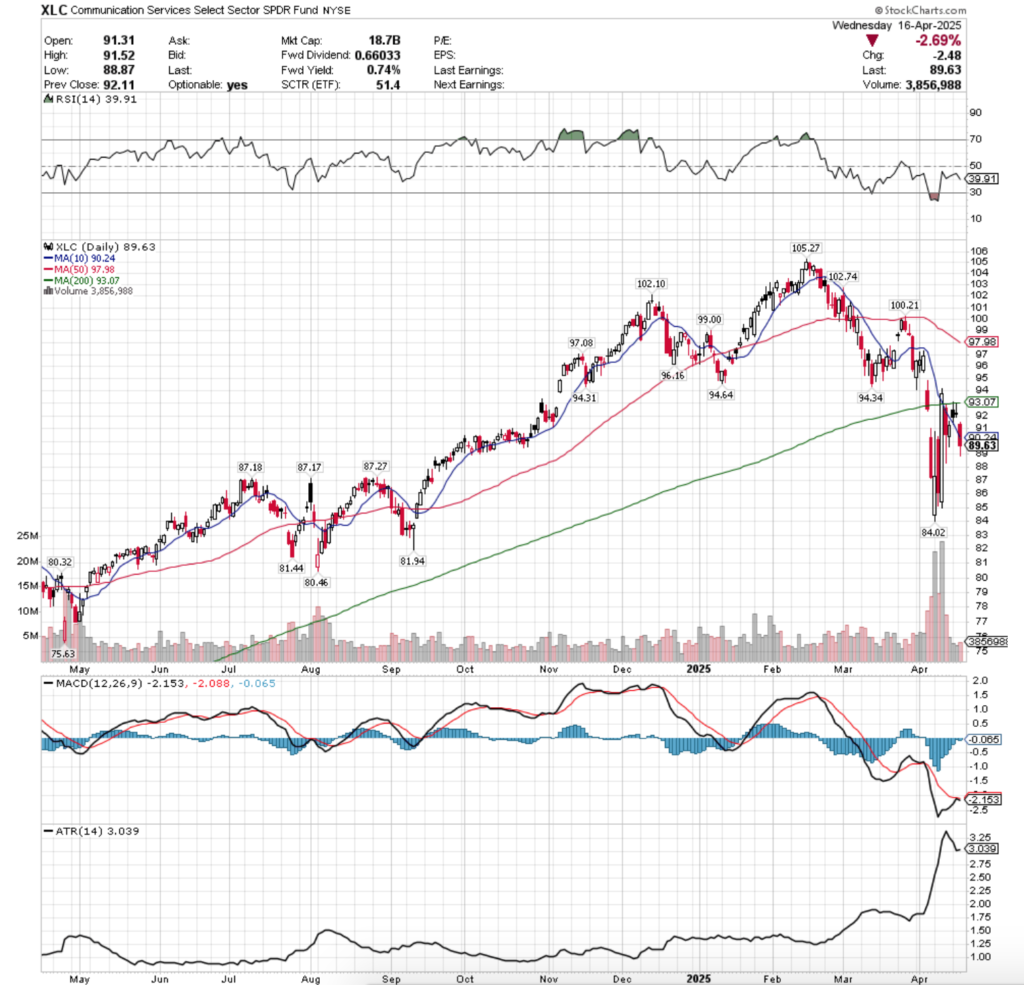
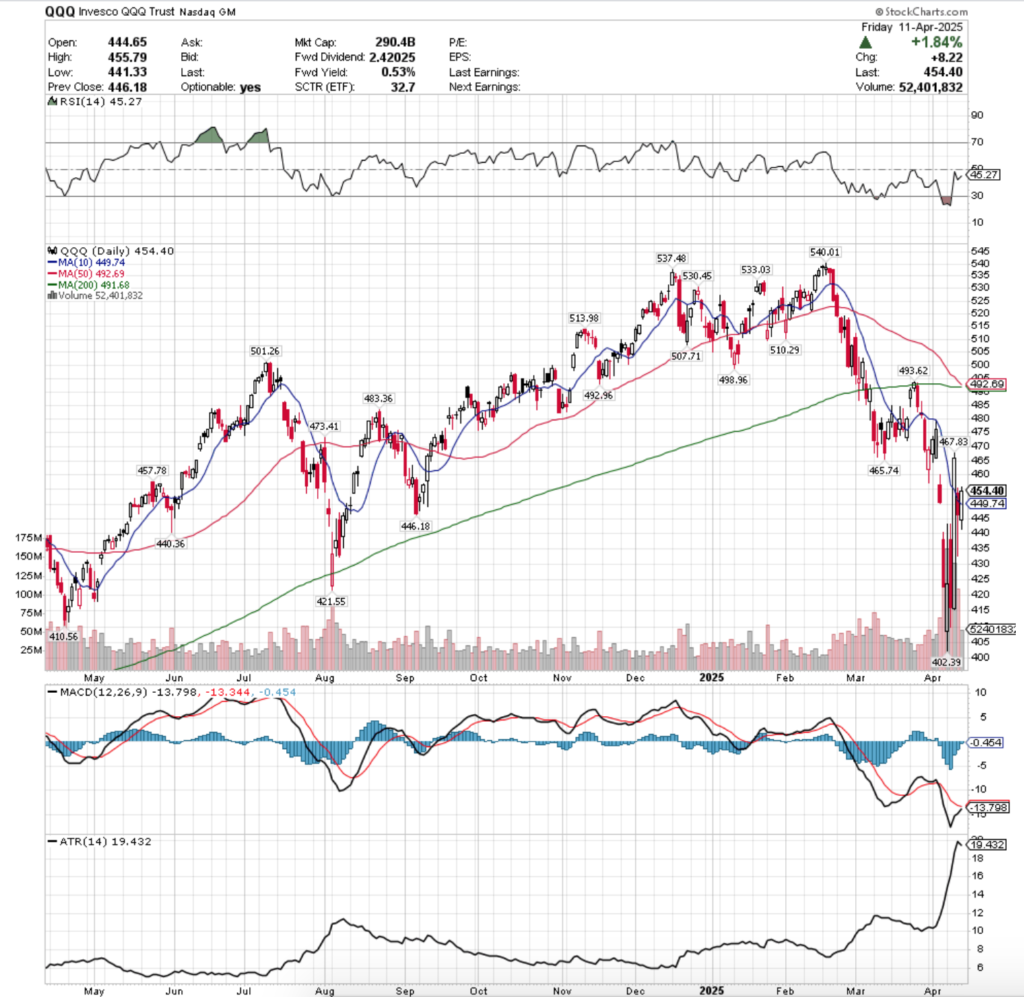
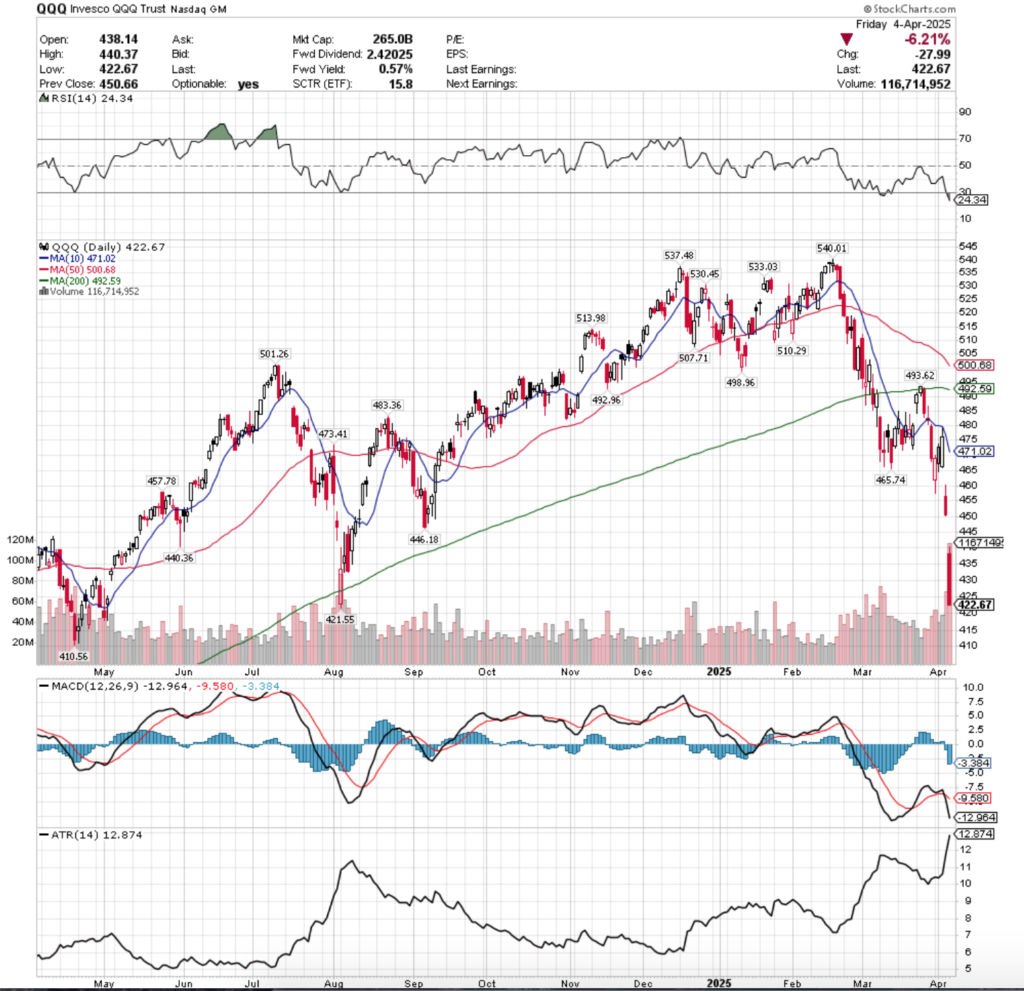
QQQ, the Invesco QQQ Trust ETF dipped -2.27%, as the tech-heavy index was not immune from the week’s declines heading into the holiday three day weekend.
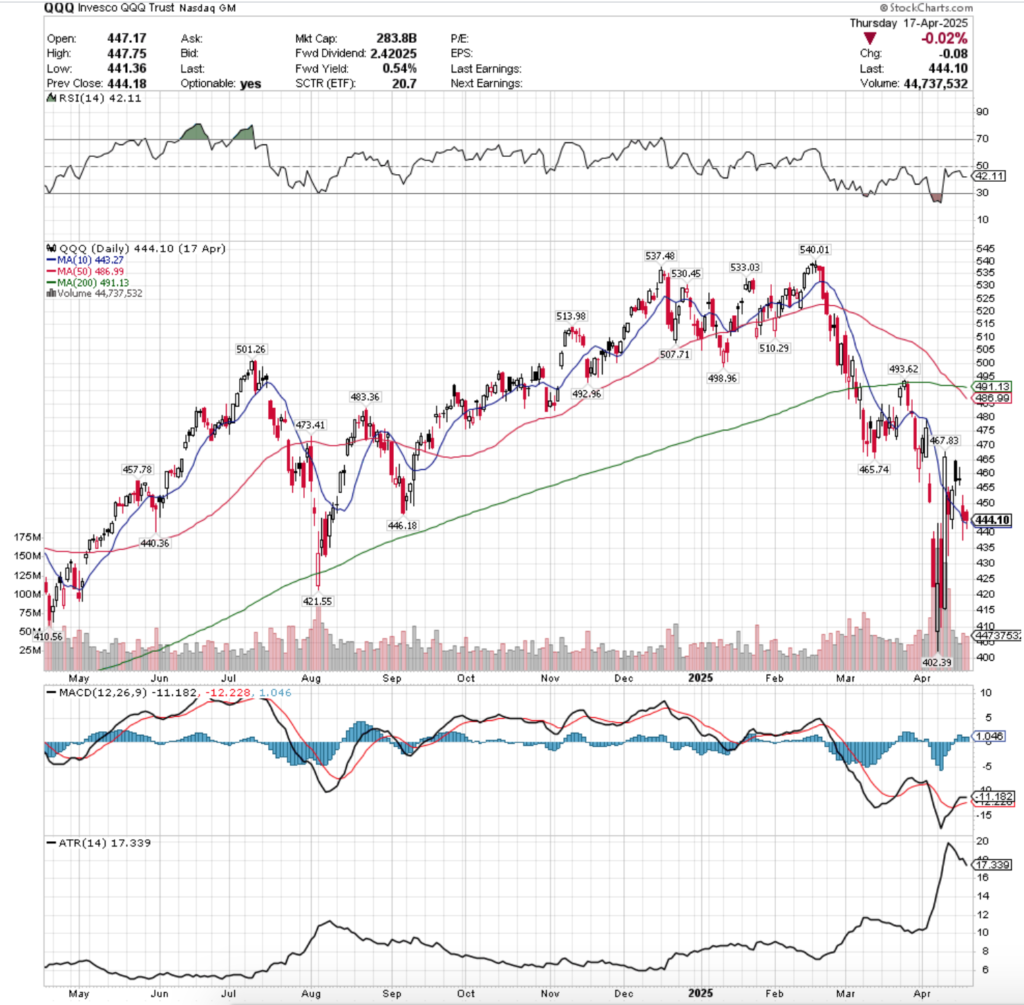
Their RSI is also flat at the 42.11 level, while their MACD has a waning histogram & is dolphining, looking primed to cross the signal line bearishly in the next couple of days.
Volumes were +17.34% higher than the previous year’s average levels (43,290,000 vs. 36,892,302), indicating that there is still quite a bit of bearish sentiment around QQQ’s component stocks & money looking to be taken out of the market.
QQQ’s Monday looked a lot like SPY’s, a gap higher to the $465/share level, followed by a retreat that brought it below $455 temporarily, before it was able to rally & close at $457.48/share.
Tuesday the diving board was set up, when a bearish harami pattern emerged from two advancing, but filled candles on weak volumes & the session closed as a doji.
This doji favored the lower end of the day’s range though, indicating that there would be difficult times heading into the end of the week.
Sure enough, Wednesday opened on a gap down, tested above the $450/share level, but was promptly sent lower & broke down below $440/share, which is now in play, and closed the day at $444.18/share, in-line with the 10 day moving average, on the week’s highest volume session.
Bearish confirmation arrived further on Thursday, when QQQ opened in the middle of Wednesday’s range, proceeded to break down through the 10 DMA’s support, before managing to close just above it.
Much like SPY, QQQ’s chart needs a major uplift in advancing volume before it will be able to build a sustainable base to spring up from.
In reality, the next week or two should have all eyes on the 10 day moving average, watching price oscillate around it in reaction to the earnings reports that we get & the Fed speakers this week.
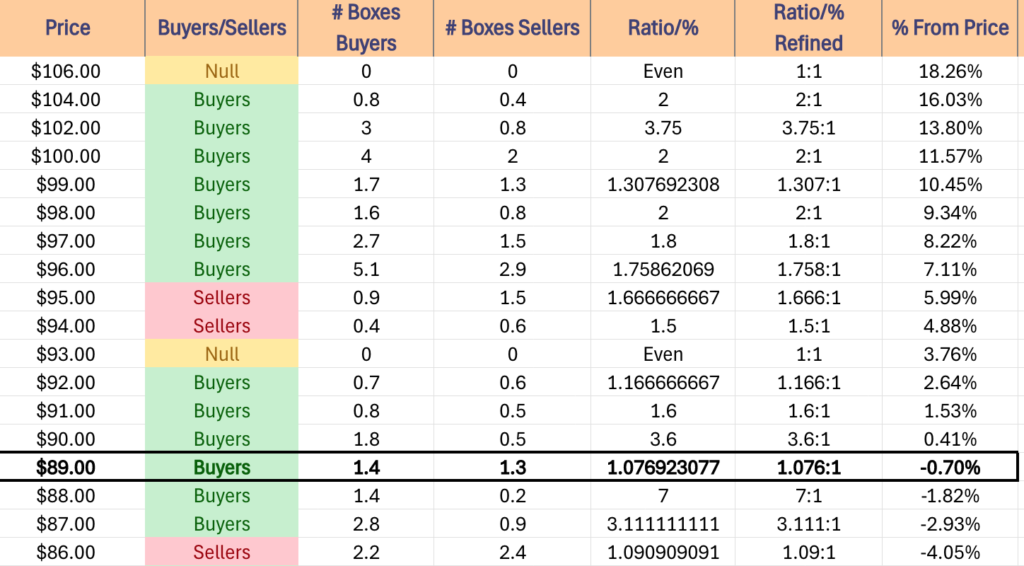
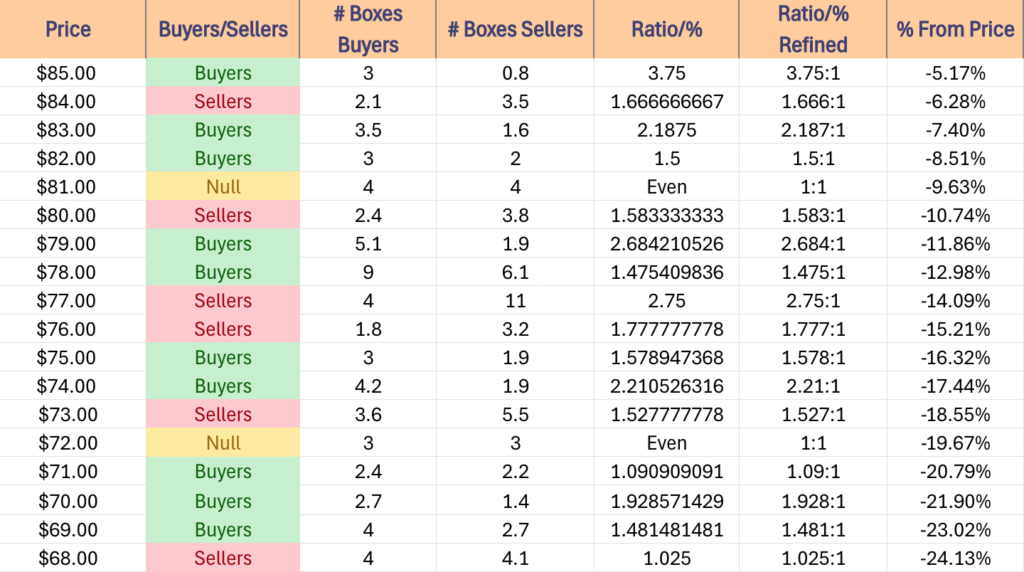
The $402.39/share mark is like SPY’s low water mark of $481.80/share, being the lowest 1 year chart support level & occurring on the same day.
In the event of a downside move of greater than- 1.82%, QQQ enters Seller territory & will have the momentum to carry it lower, where it will encounter a similar situation to SPY on the route to the low support level once it hits the $411.99/share level & we watch the high Buyer ratios potentially dilute.
The $400-403.99/share level is also going to be a questionable range, as there is limited Seller pressure at all over the past ~2 years.
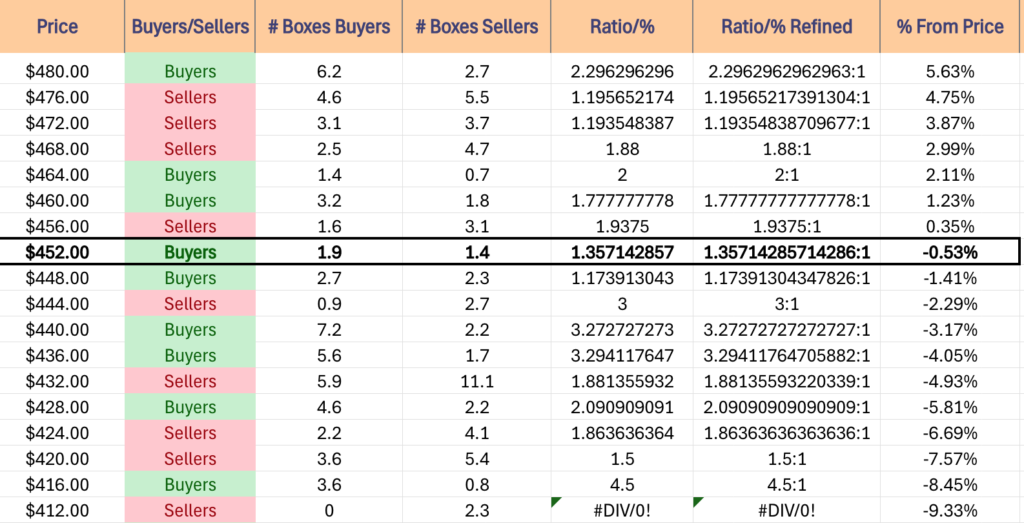
The chart below will help guide through volatility in QQQ & retests of support/resistance levels in the near-term.
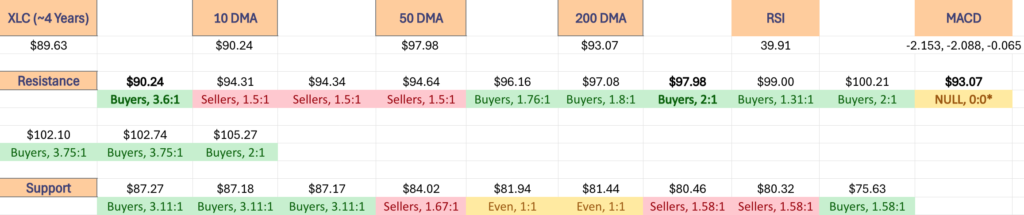
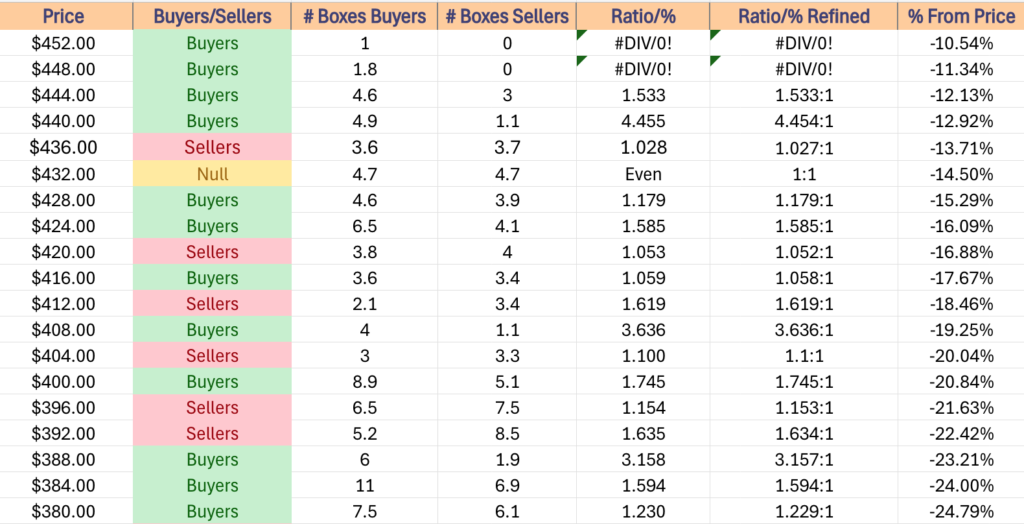
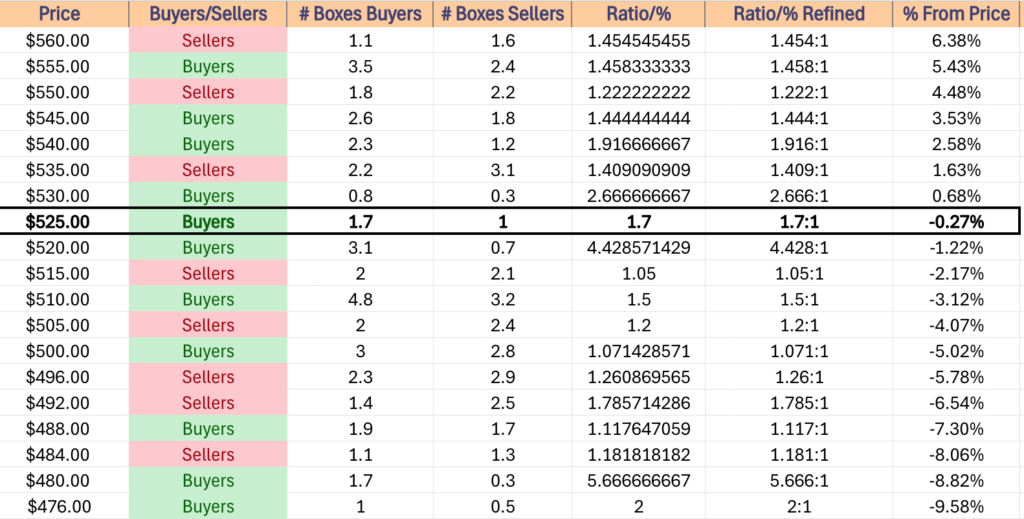
QQQ has support at the $443.27 (10 Day Moving Average, Volume Sentiment: Buyers, 3.27:1), $440.36 (Volume Sentiment: Buyers, 3.27:1), $421.55 (Volume Sentiment: Sellers, 1.5:1) & $410.56/share (Volume Sentiment: Buyers, 4:1) price levels, with resistance at the $446.18 (Volume Sentiment: Sellers, 3:1), $457.78 (Volume Sentiment: Sellers, 1.94:1), $465.74 (Volume Sentiment: Buyers, 2:1) & $467.83/share (Volume Sentiment: Buyers, 2:1) price levels.
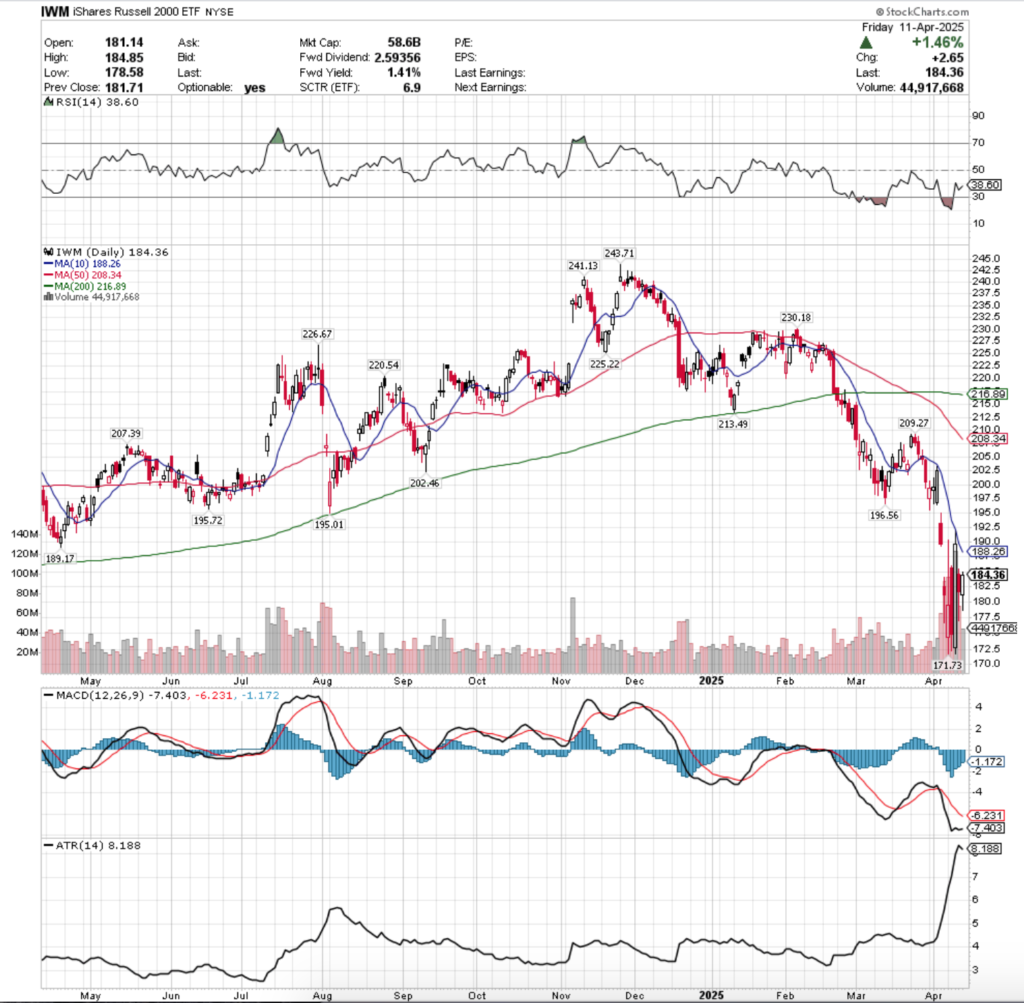
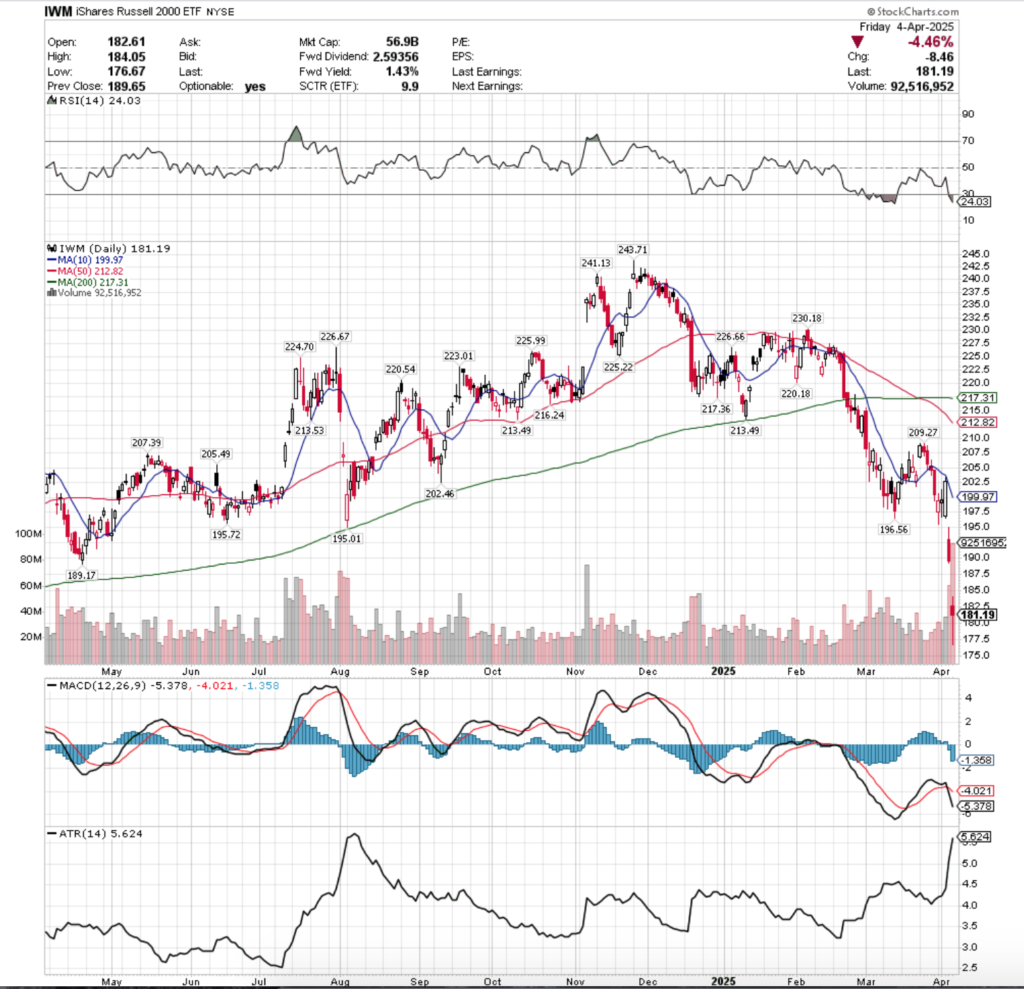
IWM, the iShares Russell 2000 ETF declined -2.81%, as small cap names had the worst week of the major four indexes.
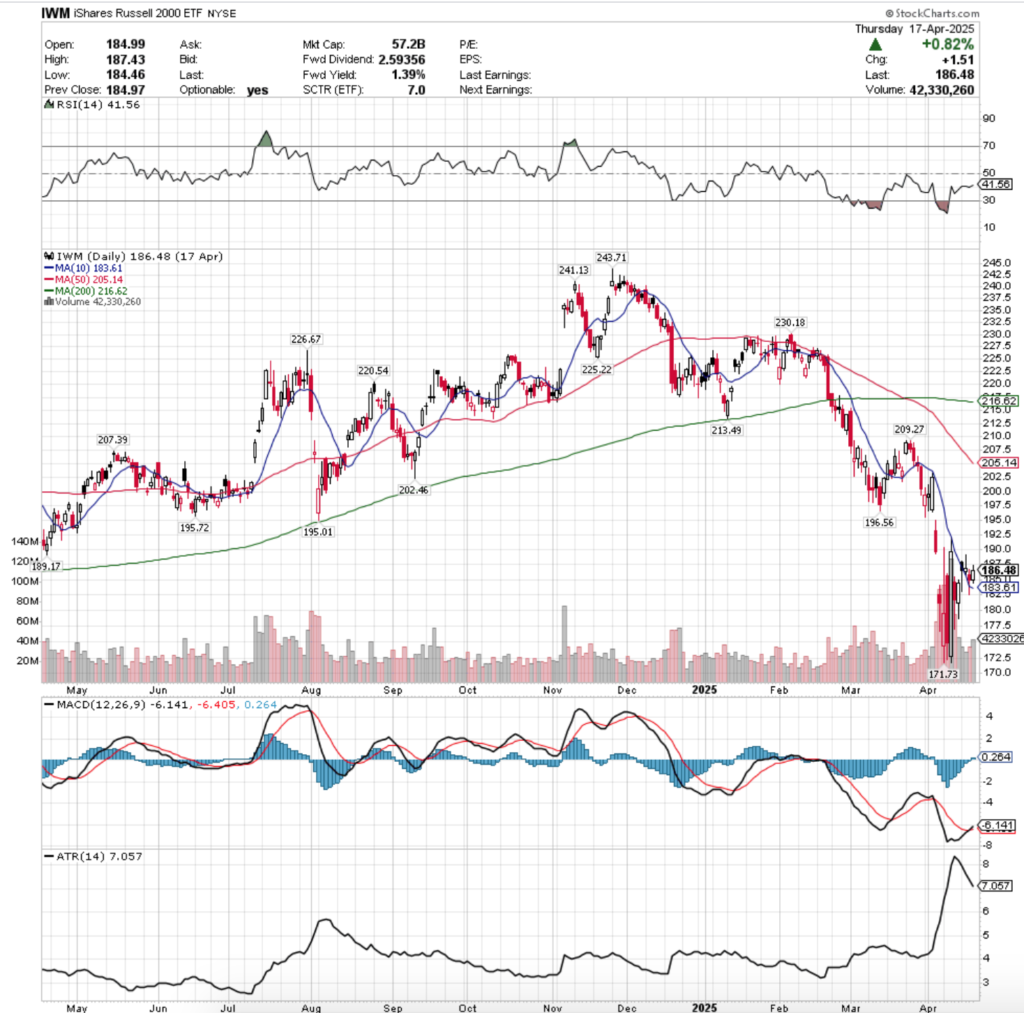
Their RSI is trending towards the neutral 50 mark after a brief flat period, while their MACD is dolphining & looking ready to cross back bearishly through the signal line by mid-week.
Volumes were +27.89% above the prior year’s average (38,262,500 vs. 29,917,778), indicating that small cap names are out of favor & that markets in general are beginning to look ready for further cooling down across the board.
IWM’s chart reads similar to SPY & QQQ’s, but duller & more committed to straddling the 10 DMA than the prior two indexes, in terms of last week’s performance.
Monday opened on a squeeze gap up in-line with the 10 DMA, before testing near to the $182.50/share level to the downside & closing above it, but lower than its open, setting the stage for a weak week.
The next day showed the oxygen was out of the room when a spinning top/shooting star emerged as Tuesday’s candle that opened lower, tested to $189/05, before settling at $186.76, but spreading the notion of uncertainty & fear being abound.
Sure enough, Wednesday opened lower, could not break above Tuesday’s close, but managed to break below the 10 DMA after the test & flirt with the $182.50/share mark before closing in-line with the 10 DMA’s support on the second highest volume of the week.
Thursday had the highest volume heading into the weekend on a +0.82% advancing day, but was capped out at $187.43/share at the day’s high, further indicating that there will likely not be many folks seeking refuge in small cap names anytime soon.
Heading into this week the upside case is the same as for SPY & QQQ; no major, consistent advancing volume inflows, no floor to build gains from.
Most likely case is to watch IWM flutter & oscillate nearby the 10 DMA, with all eyes on the $171.73/share level to see if & when that breaks down.
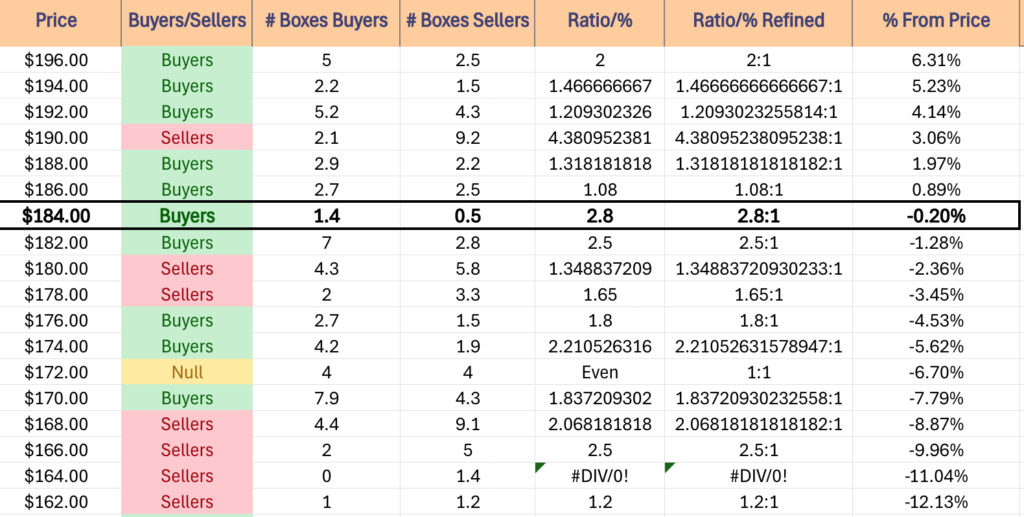
What’s unique here for IWM is that per the table below, once $173.99/share is broken down through, it passes through an “Even” Buyers:Sellers zone before one last attempt at support & then entertains breaking down below the lowest support level on a two year chart, based on Seller zones walking it down.
While Buyers may come out in droves to prevent this from happening, this event seems like something that would happen that would be more indicative of a broader market selloff/crash, so the way down may not be where market participants decide to find their footing on a two year chart support level.
Using the table below & our Volume Sentiment table from SPY’s link in the “Volume Sentiment” text above will help add guidance to navigating this scenario.
IWM has support at the $183.61 (10 Day Moving Average, Volume Sentiment: Buyers, 2.5:1), $171.73 (Volume Sentiment: Buyers, 1.84:1), $164.61 (2 Year Chart, Volume Sentiment: Sellers, 1.4:0*) & $158.85/share (Lowest Support On 2 Year Chart, Volume Sentiment: NULL, 0:0*) price levels, with resistance at the $189.17 (Volume Sentiment: Buyers, 1.32:1), $195.01 (Volume Sentiment: Buyers, 1.47:1), $195.72 (Volume Sentiment: Buyers, 1.47:1) & $196.56/share (Volume Sentiment: Buyers, 2:1) price levels.
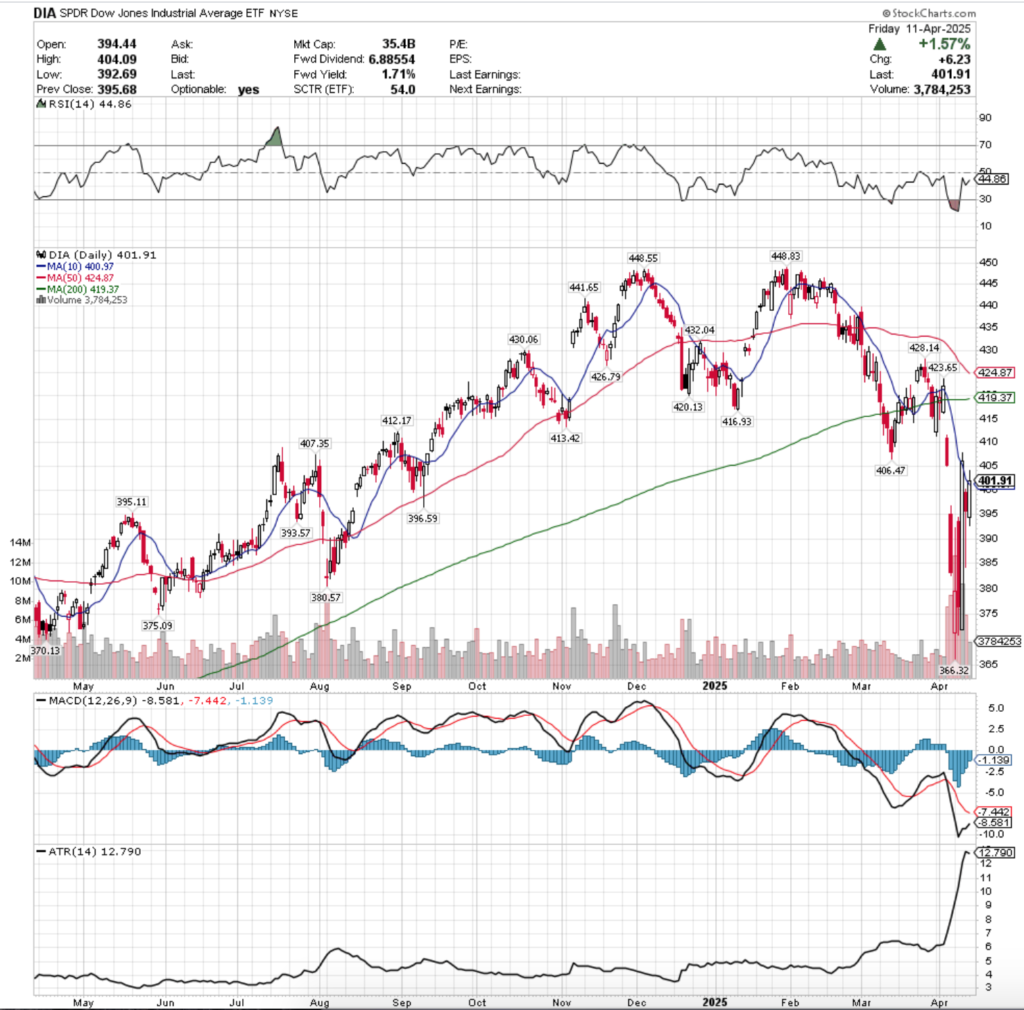
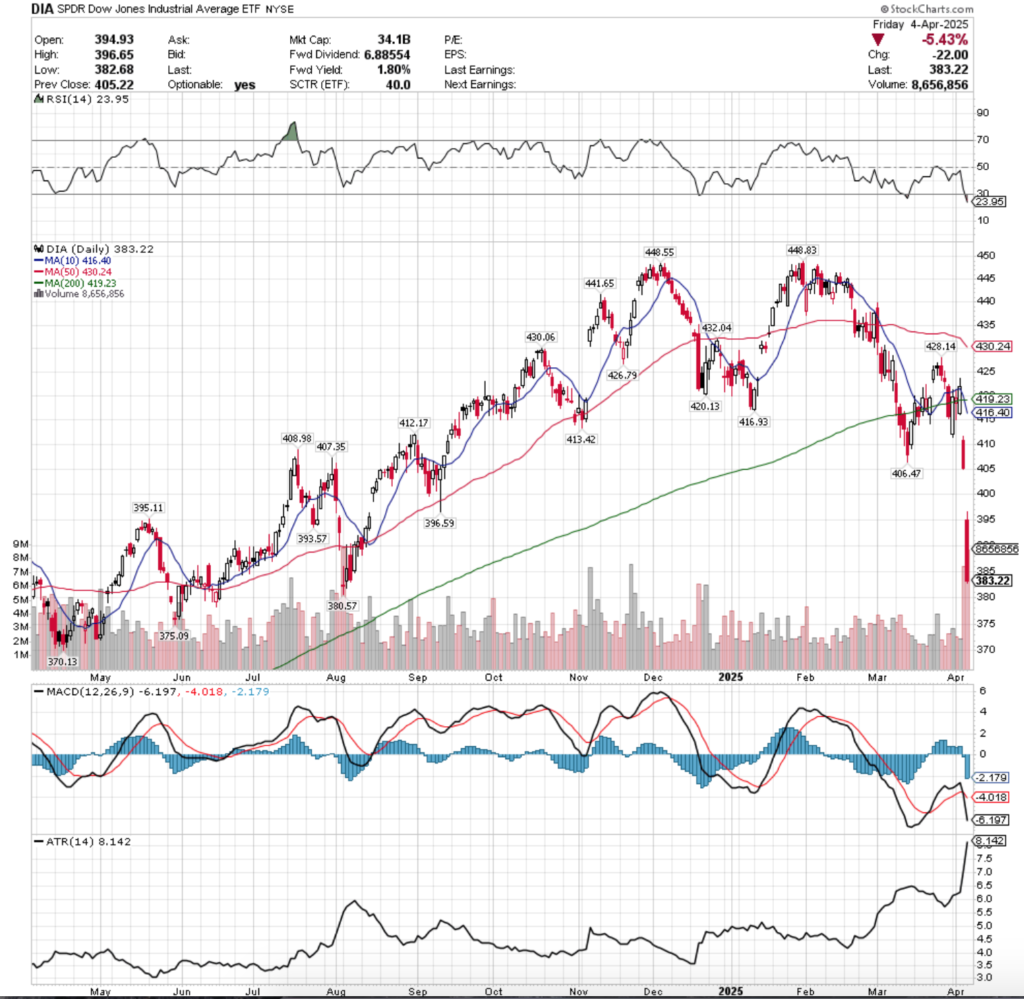
DIA, the SPDR Dow Jones Industrial Average ETF lost -2.62% last week, as the blue chip index has continued to signal that market participants are becoming heavily risk averse, after so much time being the “outperforming outlier” of the majors.
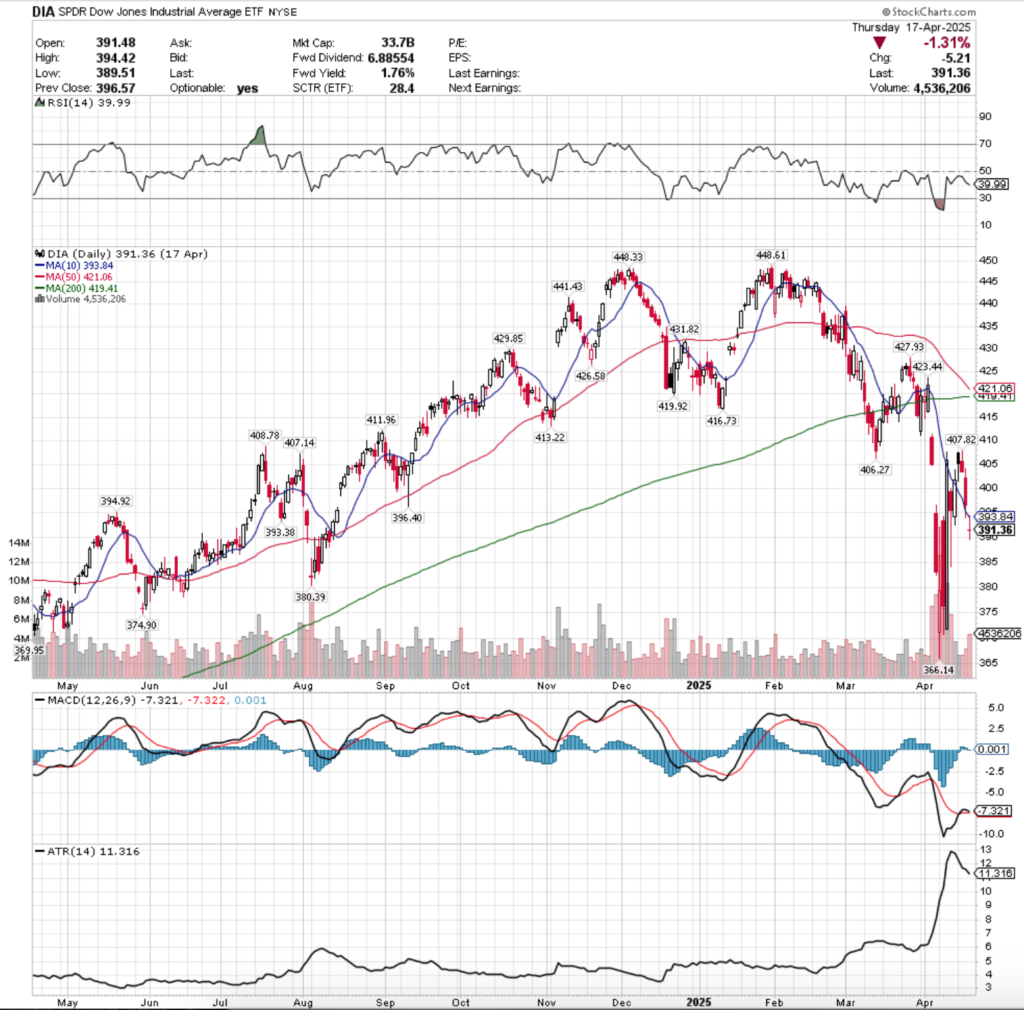
Their RSI is trending towards the oversold level, in a shift from the prior three indexes, while their MACD has just completed a dolphin, plunging back below the signal line after a brief jump above it for air.
Volumes were -6.39% lower than the previous year’s average level (3,055,000 vs. 3,263,452), which is expected, given how many DIA components are staples in people’s long-term portfolios.
Their week was far more risk off compared to the aforementioned three majors, in that Monday gapped up & closed lower with a clear “risk off” signal from its lower shadow, followed by a “shooting star” (bearish) of sorts candle & a breakdown of the 10 DMA’s support in the wake of Wednesday’s gap down session that closed in line with it.
Thursday the volume was cranked compared to the other days, and people were jumping out of the pool, resulting in a gap down open high wave candle that closed as a doji, implying that there may be a lot more downside movement in the near-term for all indexes, given the resilience of DIA.
Much like the indexes above, DIA should straddle/oscillate around its 10 day moving average moving into this week, barring any major earnings issues or anything bad from Fed speakers.
Upside isn’t really a talking point until it gets volume support on advancing sessions at this time, even for the most resilient index.
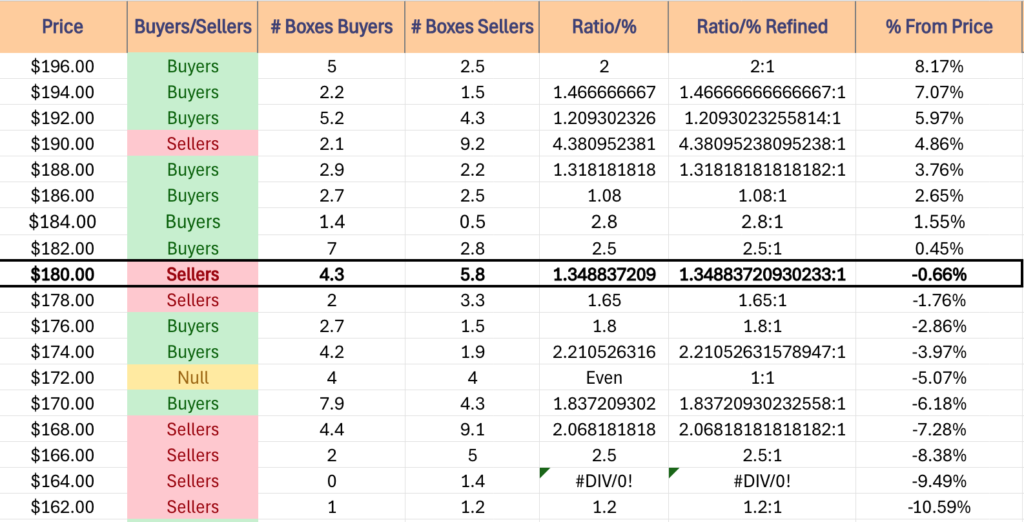
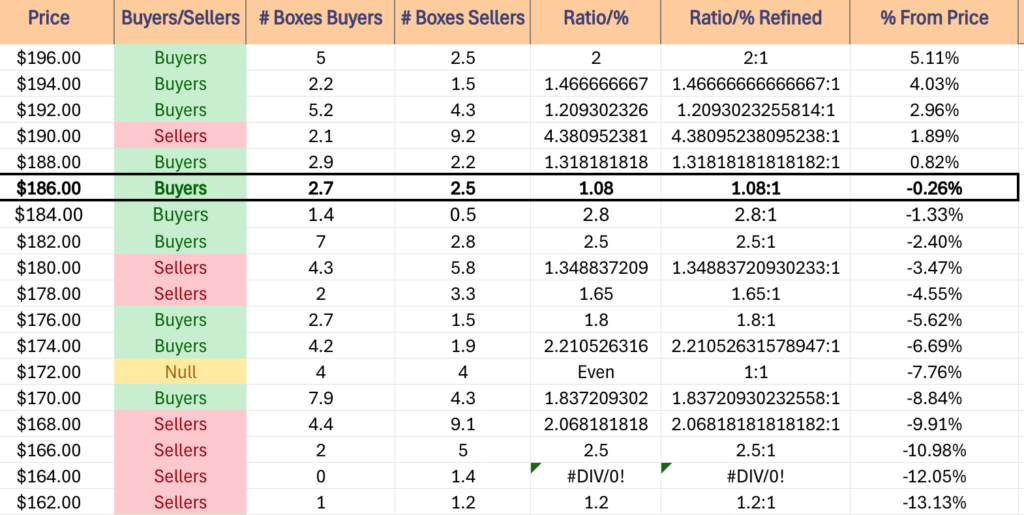
Their downside looks problematic, ad while this is a lot of support with Buyer Dominated volume, current sentiment suggests that if we retest the support levels listed below that we’re looking at a larger systemic issue, which would compound the losses for DIA given the resilience noted prior that it’s experience vs. other indexes.
Like the other indexes though, the $366.16/share support level fell on the same day as their most recent support level, which also happens to be the lowest on their chart, and will be a focal point on their chart in the coming weeks.
DIA has support at the $380.39 (Volume Sentiment: Buyers, 1.05:1), $374.90 (Volume Sentiment: Buyers, 1.06:1), $369.95 (Volume Sentiment: Buyers, 1.6:1) & $366.14/share (Volume Sentiment: Buyers, 1.92:1) price levels, with resistance at the $393.38 (Volume Sentiment: Buyers, 2.33:1), $393.84 (10 Day Moving Average, Volume Sentiment: Buyers, 2.33:1), $394.92 (Volume Sentiment: Buyers, 2.33:1) & $396.40/share (Volume Sentiment: Sellers, 1.75:1) price levels.
The Week Ahead
The week begins with U.S. Leading Economic Indicators on 10 am on Monday.
Monday morning’s earnings calls include Bank of Hawaii & Comerica, before AZZ, BOK Financial, Cadence Bank, Calix Networks, Cathay Bancorp, Equity Lifestyle Properties, Hexcel, Medpace, W.R. Berkley, Western Alliance Bancorp, Western Alliance Bancorp & Zions Bancorp report after the closing bell.
Tuesday morning Fed President Harker speaks at 9:30 am.
3M, Danaher, Elevance Health, Equifax, Forestar, GE Aerospace, Genuine Parts, Herc Holdings, Hope Bancorp, Invesco, Iridium Communications, Kimberly-Clark, Lockheed Martin, Moody’s, MSCI, Northern Trust, Northrop Grumman, Old National Bancorp, Pentair, PulteGroup, Quest Diagnostics, RTX, Synchrony Financial, United Community Banks, Valmont Industries & Verizon Communications all report earnings before Tuesday’s opening bell, followed by Tesla, Agree Realty, Baker Hughes, Capital One, Chubb, East West Bancorp, Enphase Energy, EQT Corp., Intuitive Surgical, Manhattan Associates, National Bank, Packaging Corp. of America, Pathward Financial, Pegasystems, PennyMac, Range Resources, Renasant, SAP SE, Steel Dynamics, Trustmark, Veritex Holdings & Zurn Elkay Water Solutions.
Fed President Goolsbee speaks on Wednesday at 9 am, before Fed Presidents Musalem & Waller speak at 9:30 am, S&P Flash U.S. Services PMI & S&P Flash U.S. Manufacturing PMI data comes out at 9:45 am, New Homes sales data is released at 10 am, the Fed Beige Book comes out at 2 pm & at 7:40 pm Fed President Bostic speaks.
Wednesday morning begins with earnings calls from Amphenol, AT&T, Avery Dennison, Boeing, Boston Scientific, Check Point Software, CME Group, First Hawaiian, GATX, GE Vernova, General Dynamics, Healthcare Services Group, Lennox International, Lithia Motors, M/I Homes, Masco, Mr. Cooper Group, New Oriental Education & Technology, NextEra Energy, Norfolk Southern, OFG Bancorp, Old Dominion, Otis Worldwide, Philip Morris International, Popular, PROG Holdings, Prosperity Bancshares, Ryder System, Stifel Financial, Taylor Morrison Home, TE Connectivity, Teledyne Tech, Thermo Fisher, Travel + Leisure Co, Vertiv, Virtu Financial, Wabtec & Watsco, followed by Chipotle Mexican Grill, Alaska Air, ASGN Inc, Banc of California, Bank of N.T. Butterfield & Son, CACI International, Carlisle Companies, Century Communities, Chemed, Churchill Downs, Community Health, Core Labs, Discover Financial Services, EastGroup, Edwards Lifesciences, Element Solutions, Essential Properties Realty Trust, First American Financial, FirstEnergy, Goosehead Insurance, Graco, International Business Machines, IMAX, Impinj, Kaiser Aluminum, Knight-Swift Transportation Holdings, Lam Research, Las Vegas Sands, Matador Resources, MaxLinear, Meritage Homes, Moelis, Molina Healthcare, Newmont Corp, O’Reilly Automotive, Oceaneering International, Penumbra, Plexus, QuantumScape, Raymond James, Reliance, RenaissanceRe, ResMed, ResMed, Robert Half, Rollins, SEI Investments, Selective Insurance, ServiceNow, Stewart Info, Texas Instruments, Tyler Technologies, United Rentals, Viking Therapeutics, Western Union & Whirlpool after the session’s close.
Thursday begins with Initial Jobless Claims, Durable-Goods Orders & Core Durable Orders (business investment) at 8:30 am.
ADT, Allegion, AllianceBernstein, American Airlines, Ameriprise Financial, Apogee Enterprises, Ardagh Metal Packaging, Atlantic Union Bankshares, Balchem, Berkshire Hills Bancorp, Bread Financial, Bristol Myers Squibb, Brunswick, Carpenter Technology, CBIZ, CBRE Group, CenterPoint Energy, CMS Energy, CNX Resources, Curbline Properties, Darling Ingredients, Dover, Dow, Euronet, First Bancorp, First Merchants, FirstCash, Fiserv, Freeport-McMoRan, FTI Consulting, Gentherm, Group 1 Auto, Hasbro, Helen of Troy, Integer Holdings, Interpublic, Keurig Dr Pepper, L3Harris, Ladder Capital, LKQ, MarineMax, Merck, Mobileye Global, NASDAQ, NovoCure, Old Republic, Pacific Premier, PepsiCo, PG&E, Pool, PROCEPT BioRobotics, Procter & Gamble, RPC, Sanofi, Sonic Automotive, Southwest Air, STMicroelectronics, Strategic Education, TechnipFMC, Textron, Tractor Supply, TransUnion, TRI Pointe Homes, Union Pacific, Valero Energy, Valley National, Visteon, Webster Financial, West Pharmaceutical Services, Willis Towers Watson, WNS & Xcel Energy all report earnings before Thursday’s opening bell, before Alphabet, AppFolio, Associated Banc-Corp, Boston Beer, Boyd Gaming, Columbia Banking, Coursera, Customers Bancorp, Digital Realty Trust, Eastman Chemical, Encompass Health, Federated Hermes, First Financial Bancorp, Gaming and Leisure Properties, Gilead Sciences, Glacier Bancorp, Hartford Financial, Healthpeak Properties, Intel, Kinsale Capital, Knowles, McGrath RentCorp, Merit Medical, Minerals Technologies, Phillips Edison, Principal Financial Group, Provident Financial Services, Republic Services, Sallie Mae, Seacoast Banking, Skechers USA, SkyWest, South State, SPS Commerce, SS&C Techs, T-Mobile US, VeriSign, Weyerhaeuser & WSFS Financial report after the closing bell.
Consumer Sentiment (final) is released at 10 am Friday.
AbbVie, Aon, AutoNation, Avantor, Centene, Charter Communications, Colgate-Palmolive, Flagstar Financial, Gentex, HCA, Hilltop Holdings, Lazard, LyondellBasell, Moog, Phillips 66, PHINIA, Portland General Electric, Saia, Sensient, SLB, Stellar Bank & TriNet Group are all scheduled to report earnings on Friday Morning.
See you back here next week!
*** I DO NOT OWN SHARES OR OPTIONS CONTRACT POSITIONS IN SPY, QQQ, IWM OR DIA AT THE TIME OF PUBLISHING THIS ARTICLE ***