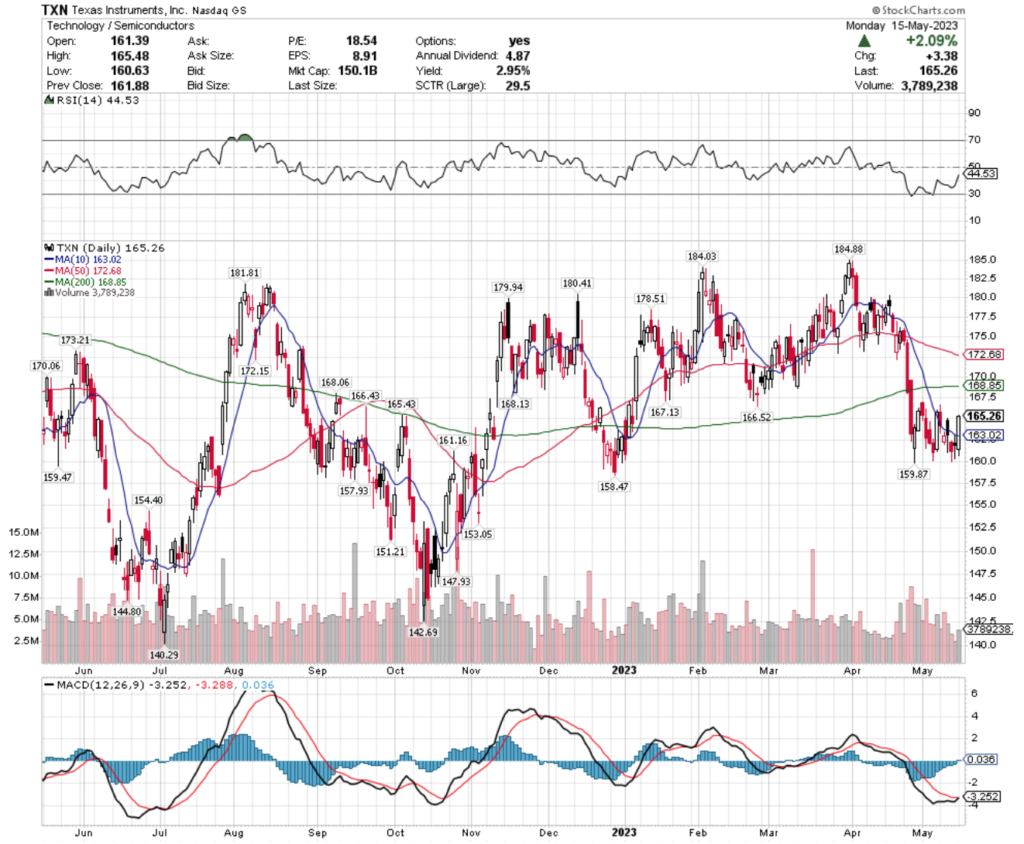
Texas Instruments, Inc. stock trades under the ticker TXN & has shown recent bullish behavior that traders & investors may want to look closer into for when market volatility has subsided.
TXN stock closed at $165.26/share on 5/15/2023.
Texas Instruments, Inc. TXN Stock’s Technical Performance Broken Down
Texas Instruments, Inc. TXN Stock’s Technical Performance Over The Past Year
TXN Stock Price: $165.26
10 Day Moving Average: $163.02
50 Day Moving Average: $172.68
200 Day Moving Average: $168.85
RSI: 44.53
MACD: -3.25
Yesterday, TXN stock completed a bullish MACD crossover, gaining +2.09% on the day’s session.
Their RSI is on the oversold end of neutral at 44.53, with recent trading volumes being below average compared to the year prior, signaling uncertainty among investors.
Traders & investors should begin to watch how TXN stock behaves around its support levels in the coming weeks ahead, in order to begin planning where to enter a position once the market becomes less volatile.
TXN stock has support at the $163.02 (10 day moving average), $161.16, $159.47 & $158.47/share price levels, with resistance at the $165.43, $166.43, $166.52 & $167.13/share price levels.
Texas Instruments, Inc. TXN Stock As A Long-Term Investment
Investors focused on longer time horizons will like TXN stock’s 18.61 P/E (ttm), but may find their 9.87 P/B (mrq) to be a bit too rich.
They recently reported -10.7% Quarterly Revenue Growth Y-o-Y, with -22.4% Quarterly Earnings Growth Y-o-Y, which investors may want to review further before entering a position.
Their balance sheet at first glance is much more appealing than many of their peers, with $9.54B of Total Cash (mrq) & $10.13B of Total Debt (mrq).
TXN stock pays a 2.95% dividend, which appears to be sustainable in the long-run, as their payout ratio is 53.7%.
87.6% of TXN stock’s outstanding share float is owned by institutional investors.
Texas Instruments, Inc. TXN Stock As A Short-Term Trade Using Options
Traders with shorter time horizons can trade options to profit from price movements in TXN stock’s price, while protecting their portfolios from broader market volatility.
I am looking at the contracts with the 6/16 expiration date.
The $155, $165 & $150 call options are all in-the-money, listed from highest to lowest level of open interest.
The $170, $175 & $180 puts are also all in-the-money, with the former being more liquid than the latter strike prices.
Tying It All Together
TXN stock has many interesting characteristics that traders & investors will find appealing.
Investors will like their dividend yield, as well as their balance sheet when compared to their peers.
Traders will like their recent technical performance, as well as how liquid their options are.
Overall, it is worth taking a closer look into how TXN stock fits into your portfolio strategy.
*** I DO NOT OWN SHARES OR OPTIONS CONTRACT POSITIONS IN TXN STOCK AT THE TIME OF PUBLISHING THIS ARTICLE ***
On Friday afternoon I found myself at happy hour, pen in hand, modeling out volume data on some of my holdings & hedges.
I was mostly interested in seeing how the volume has been at their support & resistance levels, as well as at & around the strike prices of my options contracts, which led me to the idea of doing the same exercise (in Excel this time) for ETFs that track the major stock indexes.
The methodology is relatively simple (feel free to skip ahead to the data in the next heading section if this portion is not of interest); first, look at the Point & Figure charts’ time horizons & match the candlestick charts to the closest time period (based on my account permissions), then find the resistance & support levels on the candlestick charts for said time period.
After, using the Volume By Price layover data on the Point & Figure charts, I looked at the Buyer vs. Seller Volume at each price level & recorded the volume trends for each price level’s relevant box as a ratio & applied the data to the individual support/resistance/strike prices (my notebook exercise had more layers of relevant detail & indicators to my specific trades, but this is what is being used in the following article).
Those ETFs were chosen due to their coverage of the major U.S. market indexes, but the methodology can be applied to other securities as well, with further customizations.
The data & tables presented below are meant to serve as a reference guide to trader/investor sentiment for each price level being presented.
Please note that some of the observed data may not be complete/was unable to be accounted for (most likely due to sampling), leading to some ratio figures that are unconventional, which are all marked with a “*” & can be referenced in any of the images that accompany each section.
The following is meant to serve as a reference to how market participants have behaved historically at these price levels & is neither investment advice nor recommendations of any kind.
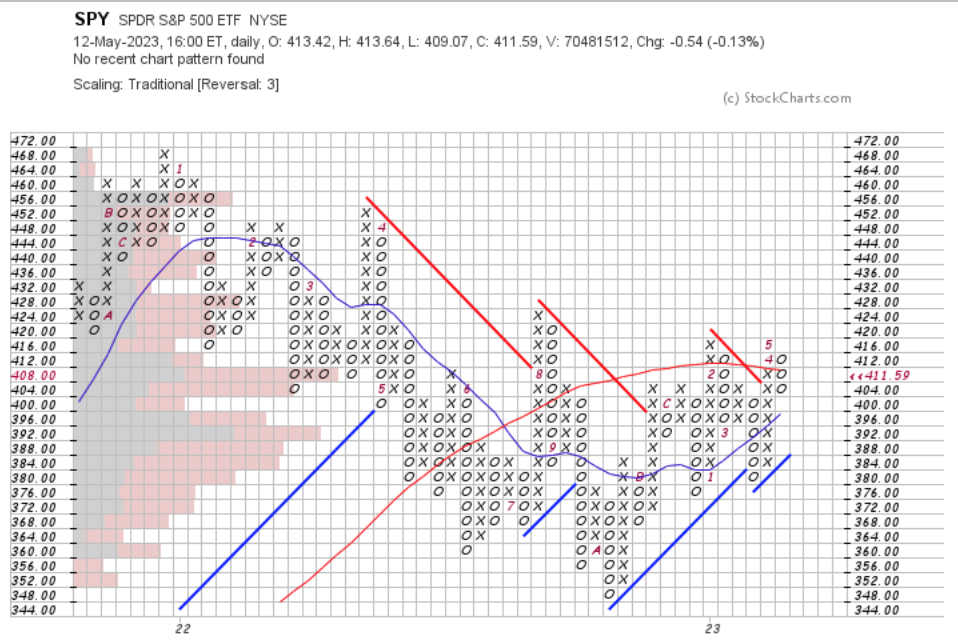
SPY, The S&P 500 ETF’s Volume Analysis At Support & Resistance Points
SPY, the ETF that is most often referred to for tracking the returns of the S&P 500’s Point & Figure Chart is below, showing the volume overlays along with the 10 & 50 day moving averages & support lines for a period of roughly the past 2 years.
SPY ETF – SPDR S&P 500 ETF Point & Figure Chart
As the chart goes back ~2 years, I selected the 2 year SPY candlestick chart as well to make them match as closest as possible, given the limitations of the toolset that I was using, where we are able to see the support & resistance levels for that time period, as well as the moving averages & other indicator data.
SPY ETF – SPDR S&P 500’s Technical Performance Over The Past Two Years
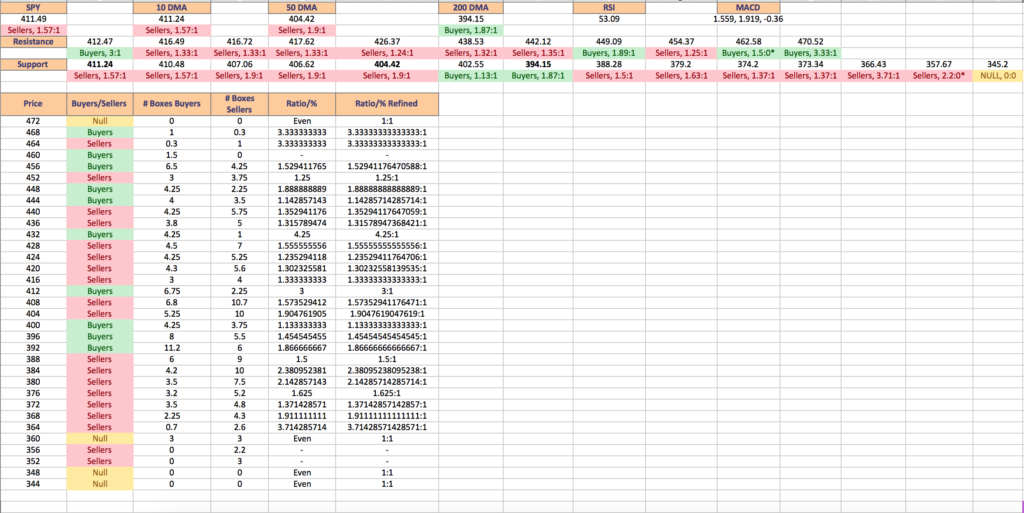
SPY closed on Friday 5/12/2023 at $411.49/share, which would place it in the Point & Figure percentage box range for the $408/share price level.
At $408/share over the past year, SPY’s volume has favored the Sellers by 1.57:1 (I counted the boxes by hand/estimated the fraction of boxes, this did not come from raw data).
The $412/share box covers all prices that go from $412.00-$415.99, where Buyers are dominating the volume 3:1, which is one of the 5 strongest price levels in terms of their ratio.
The $404/share box covers $404-$407.99 SPY prices, where the Sellers are favored 1.90:1, before from $400 down to $392 the Buyers are back in control historically for the time period covered (1.133:1, 1.45:1 & 1.87:1, respectively), before the Sellers take back over from $388 down until $364.
SPY ETF’s Volume By Price Level, Including At Support & Resistance Levels From The Past Two Years
SPY’s current closest Resistance Levels for the time period, as well as their volume ratings are below:
$412.47 – Buyers – 3:1
$416.49 – Sellers – 1.33:1
$416.72 – Sellers – 1.33:1
$417.62 – Sellers – 1.33:1
$426.37 – Sellers – 1.24:1
$438.53 – Sellers – 1.32:1
$442.12 – Sellers – 1.35:1
$449.09 – Buyers – 1.89:1
$454.37 – Sellers – 1.25:1
$462.58 – Buyers – 1.5:0*
$470.52 – Buyers – 3.33:1
SPY’s Support Levels within that time period are below (BOLD denotes a moving average):
$411.24 – Sellers – 1.57:1(10 DMA)
$410.48 – Sellers – 1.57:1
$407.06 – Sellers – 1.9:1
$406.62 – Sellers- 1.9:1
$404.42 – Sellers – 1.9:1 (50 DMA)
$402.55 – Buyers – 1.13:1
$394.15 – Buyers – 1.87:1 (200 DMA)
$388.28 – Sellers – 1.5:1
$379.20 – Sellers – 1.63:1
$374.20 – Sellers – 1.37:1
$373.34 – Sellers – 1.37:1
$366.43 – Sellers – 3.71:1
$357.67 – Sellers – 2.2:0*
$345.2 – NULL – 0:0*
SPY’s Point & Figure price levels are listed below, with their respective volume sentiment:
$472 – NULL – 1:1
$468 – Buyers – 3.33:1
$464 – Sellers – 3.33:1
$460 – Buyers – 1.5:0*
$456 – Buyers – 1.53:1
$452 – Sellers – 1.25:1
$448 – Buyers – 1.89:1
$444 – Buyers – 1.14:1
$440 – Sellers – 1.35:1
$436 – Sellers – 1.32:1
$432 – Buyers – 4.25:1
$428 – Sellers – 1.56:1
$424 – Sellers – 1.24:1
$420 – Sellers – 1.30:1
$416 – Sellers – 1.33:1
$412 – Buyers – 3:1
$408 – Sellers – 1.57:1
$404 – Sellers – 1.90:1
$400 – Buyers – 1.13:1
$396 – Buyers – 1.45:1
$392 – Buyers – 1.87:1
$388 – Sellers – 1.5:1
$384 – Sellers – 2.38:1
$372 – Sellers – 1.37:1
$380 – Sellers – 2.14:1
$376 – Sellers – 1.63:1
$368 – Sellers – 1.91:1
$364 – Sellers – 3.71:1
$360 – NULL – 3:3
$356 – Sellers – 2.2:0*
$352 – Sellers – 3:0*
$348 – NULL 0:0*
$344 – NULL – 0:0*
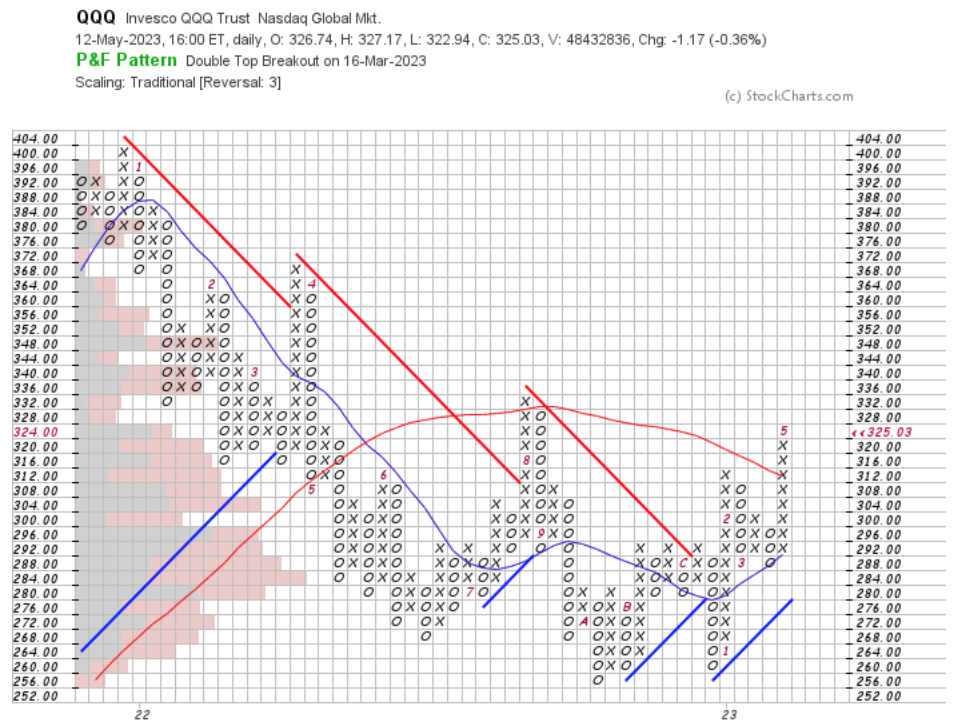
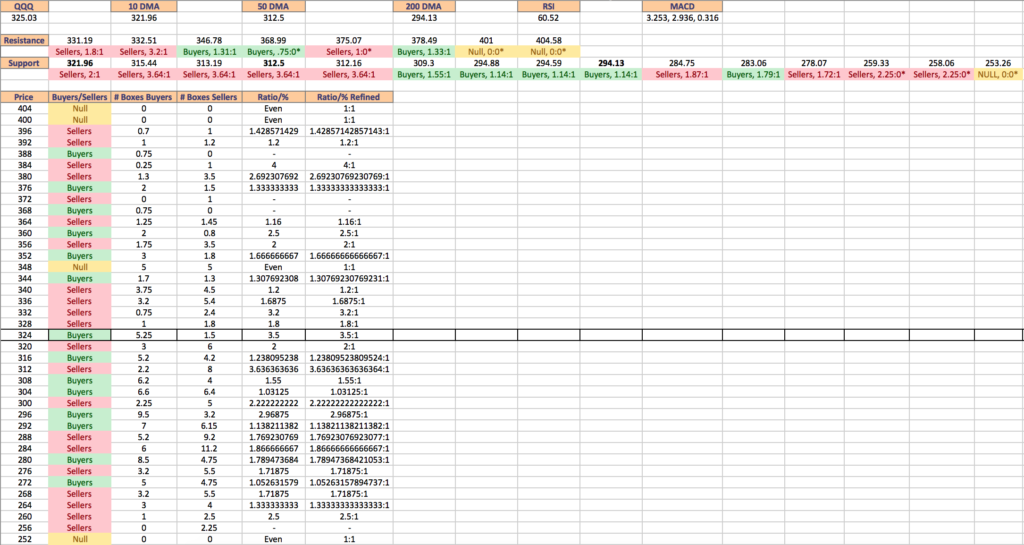
QQQ, the Invesco QQQ Trust, Tracking The NASDAQ ETF’s Volume Analysis At Support & Resistance Points
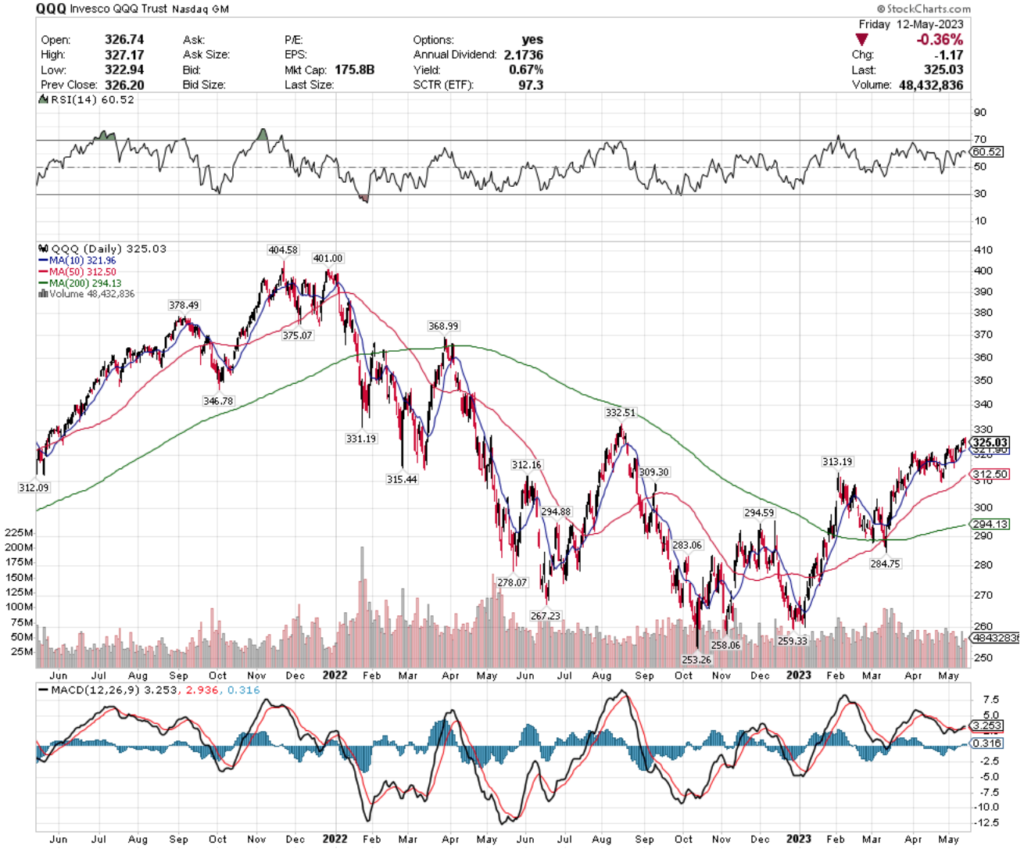
The QQQ ETF is often used as a proxy for the performance of the NASDAQ index & closed at $325.03/share on Friday 5/12/2023.
Their Point & Figure chart was closer to a year & a half, so a two year candlestick chart was selected in order to observe their support & resistance levels.
At $325.03, QQQ is currently in the $324/share box range, which for the past year & a half has been dominated by Buyers, at a rate of 5.3:1.
QQQ ETF – The Invesco QQQ Trust ETF’s Technical Performance Over The Past Two Years
The neighboring $328/share box is a Sellers range at 1.8:1, and the neighboring 3 higher levels have also been dominated by Sellers in this time period (3.2:1, 1.69:1 & 1.2:1), with the $320/share box also being a Sellers range at a rate of 2:1.
QQQ ETF’s Volume By Price Level, Including At Support & Resistance Levels From The Past Two Years
QQQ’s Resistance Levels For The Past Two Years & Their Volume Sentiment:
$331.19 – Sellers – 1.8:1
$332.51 – Sellers – 3.2:1
$346.78 – Buyers – 1.31:1
$368.99 – Buyers – 0.75:0*
$375.07 – Sellers – 1:0*
$378.49 – Buyers – 1.33:1
$401 – NULL – 0:0*
$404.58 – NULL – 0:0*
QQQ’s Support Levels for that time period are below (BOLD denotes moving average level):
$321.96 – Sellers – 2:1 (10 DMA)
$315.44 – Sellers – 3.64:1
$313.19 – Sellers – 3.64:1
$312.50 – Seller s- 3.64:1 (50 DMA)
$312.16 – Sellers – 3.64:1
$309.30 – Buyers – 1.55:1
$294.88 – Buyers – 1.14:1
$294.59 – Buyers – 1.14:1
$294.13 – Buyers – 1.14:1 (200 DMA)
$284.75 – Sellers – 1.87:1
$283.06 – Buyers – 1.79:1
$278.07 – Sellers – 1.72:1
$259.33 – Sellers – 2.25:0*
$258.06 – Sellers – 2.25:0*
$253.26 – NULL – 0:0*
QQQ’s Point & Figure price levels are listed below, with their respective volume sentiment:
$404 – NULL – 0:0*
$400 – NULL – 0:0*
$396 – Sellers – 1.43:1
$392 – Sellers – 1.2:1
$388 – Buyers – 0.75:0*
$384 – Sellers – 4:1
$380 – Sellers – 2.69:1
$376 – Buyers – 1.33:1
$372 – Sellers – 1:0*
$368 – Buyers – 0.75:0*
$364 – Sellers – 1.16:1
$360 – Buyers – 2.5:1
$356 – Sellers – 2:1
$352 – Buyers – 1.67:1
$348 – NULL – 1:1
$344 – Buyers – 1.31:1
$340 – Sellers – 1.2:1
$336 – Sellers – 1.69:1
$332 – Sellers – 3.2:1
$328 – Sellers – 1.8:1
$324 – Buyers – 3.5:1
$320 – Sellers – 2:1
$316 – Buyers – 1.24:1
$312 – Sellers – 3.64:1
$308 – Buyers – 1.55:1
$304 – Buyers – 1.03:1
$300 – Sellers – 2.22:1
$296 – Buyers – 2.97:1
$292 – Buyers – 1.14:1
$288 – Sellers – 1.77:1
$284 – Sellers – 1.87:1
$280 – Buyers – 1.79:1
$276 – Sellers – 1.72:1
$272 – Buyers – 1.05:1
$268 – Sellers – 1.72:1
$264 – 1.33:1
$260 – Sellers – 2.5:1
$256 – Sellers – 2.25:0*
$252 – NULL – 0:0*
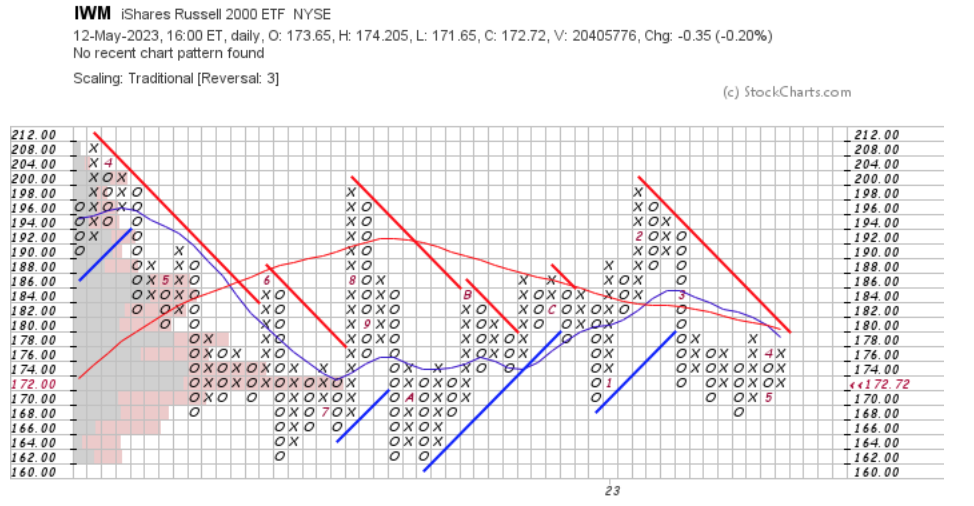
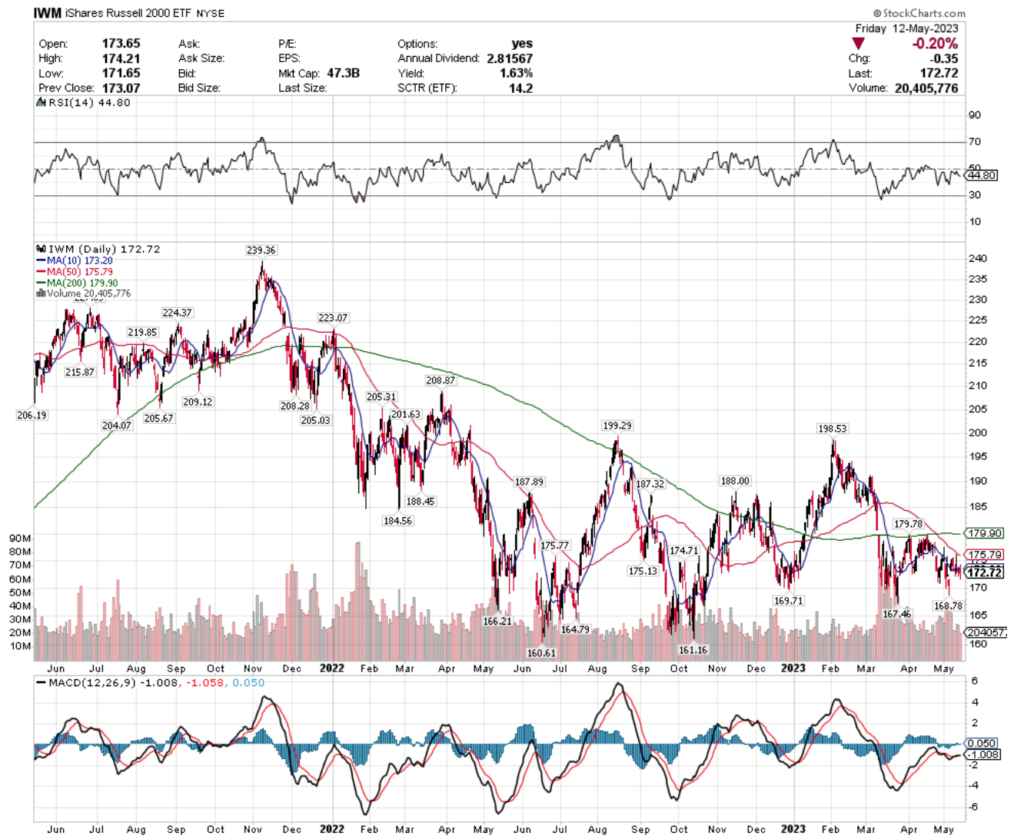
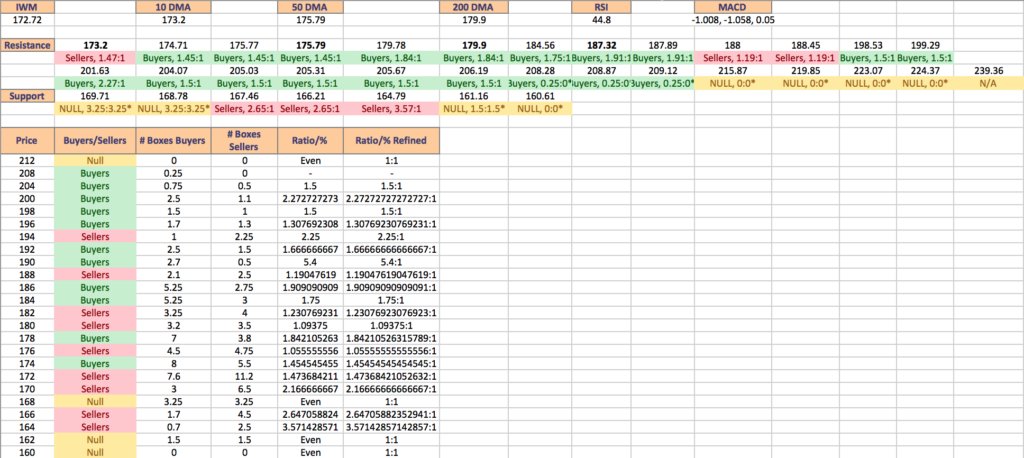
IWM, the iShares Russell 2000 ETF’s Volume Analysis At Support & Resistance Points
IWM, the ETF commonly used as a proxy for the performance of the Russell 2,000 small cap stocks had roughly a year & a half chart when I loaded their Point & Figure data, calling for a two year chart for the candlestick resources.
IWM ETF – iShares Russell 2000 ETF’s Point & Figure Chart
IWM closed at $172.72/share on Friday 5/12/2023, placing it in the $172/share box, which is currently dominated by the Sellers at a rate of 1.47:1.
IWM ETF – iShares Russell 2000 ETF’s Technical Performance Over The Past Two Years
The next box above IWM’s current price level is $174, which has been won by the Buyers at a rate of 1.45:1 over the past 2 years, with their next leg lower being the $170 range, which has also been a Seller dominated zone at a rate of 2.17:1 in that time period.
IWM ETF’s Volume By Price Level, Including At Support & Resistance Levels From The Past Two Years
IWM’s Resistance Levels For The Past Two Years & Their Volume Sentiment (BOLD denotes moving averages):
$173.20 – Sellers – 1.47:1 (10 DMA)
$174.71 – Buyers – 1.45:1
$175.77 – Buyers – 1.45:1
$175.79 – Buyers – 1.45:1 (50 DMA)
$179.78 – Buyers – 1.84:1
$179.90 – Buyers – 1.84:1 (200 DMA)
$184.56 – Buyers – 1.75:1
$187.32 – Buyers – 1.91:1
$187.89 – Buyers – 1.91:1
$188 – Sellers – 1.19:1
$188.45 – Sellers – 1.19:1
$198.53 – Buyers – 1.5:1
$199.29 – Buyers – 1.5:1
$201.63 – Buyers – 2.27:1
$204.07 – Buyers – 1.5:1
$205.03 – Buyers – 1.5:1
$205.31 – Buyers – 1.5:1
$205.67 – Buyers – 1.5:1
$206.19 – Buyers – 1.5:1
$208.28 – Buyers – 0.25:0*
$208.87 – Buyers – 0.25:0*
$209.12 – Buyers – 0.25:0*
$215.87 – NULL – 0:0*
$219.85 – NULL – 0:0*
$223.07 – NULL – 0:0*
$224.37 – NULL – 0:0*
$239.36 – N/A*
IWM’s Support Levels for that time period are below:
$169.71 – NULL – 1:1
$168.78 – NULL – 1:1
$167.46 – Sellers – 2.65:1
$166.21 – Sellers – 2.65:1
$164.79 – Sellers – 3.57:1
$161.16 – NULL – 1:1
$160.61 – NULL – 0:0*
IWM’s Point & Figure price levels are listed below, with their respective volume sentiment:
$212 – NULL – 0:0*
$208 – Buyers – 0.25:0*
$204 – Buyers – 1.5:1
$200 – Buyers – 2.27:1
$198 – Buyers – 1.5:1
$196 – Buyers – 1.31:1
$194 – Sellers – 2.25:1
$192 – Buyers – 1.67:1
$190 – Buyers – 5.4:1
$188 – Sellers – 1.19:1
$186 – Buyers – 1.91:1
$184 – Buyers – 1.75:1
$182 – Sellers – 1.23:1
$180 – Sellers – 1.09:1
$178 – Buyers – 1.84:1
$176 – Sellers – 1.06:1
$174 – Buyers – 1.45:1
$172 – Sellers – 1.47:1
$170 – Sellers – 2.17:1
$168 – NULL – 1:1
$166 – Sellers – 2.65:1
$164 – Sellers – 3.57:1
$162 – NULL – 1:1
$160 – NULL – 0:0*
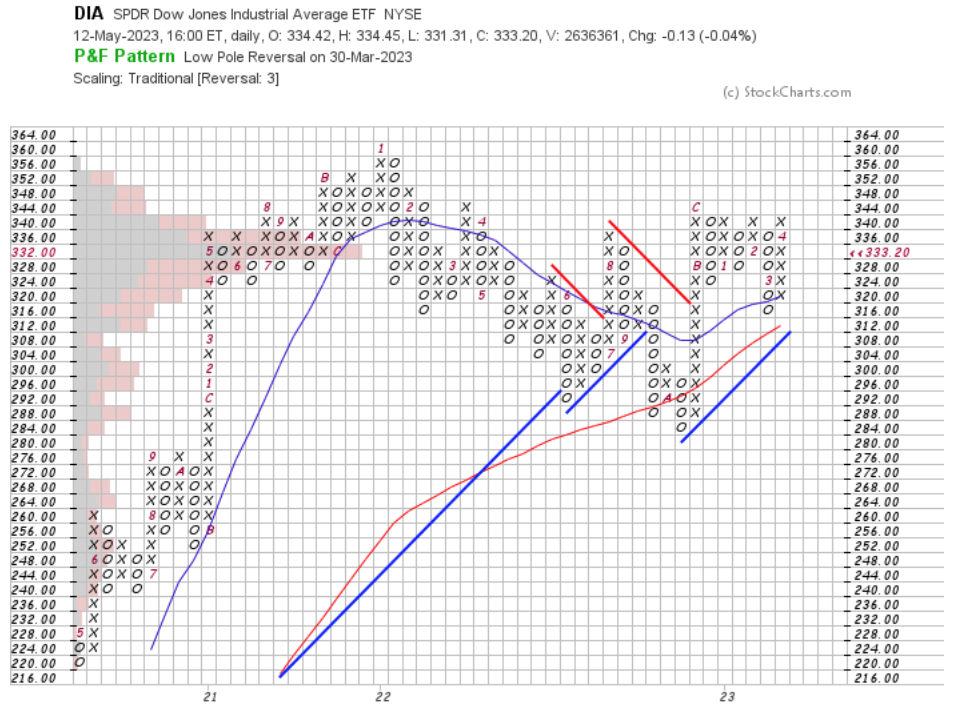
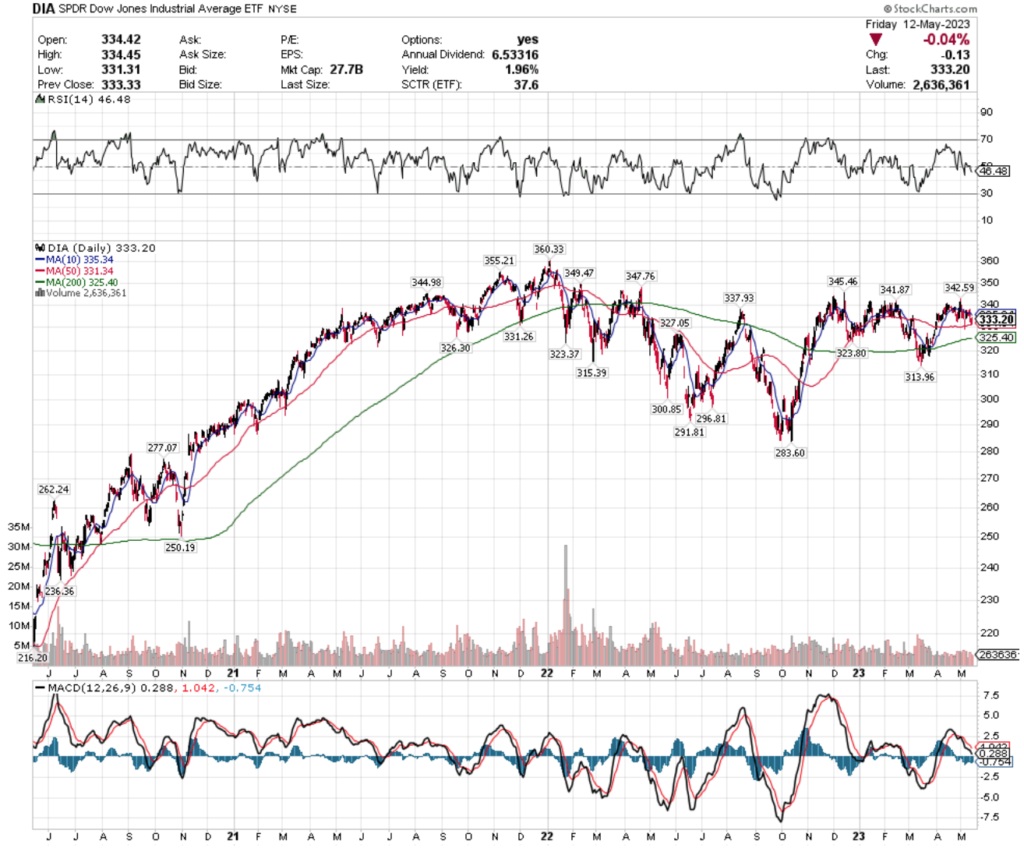
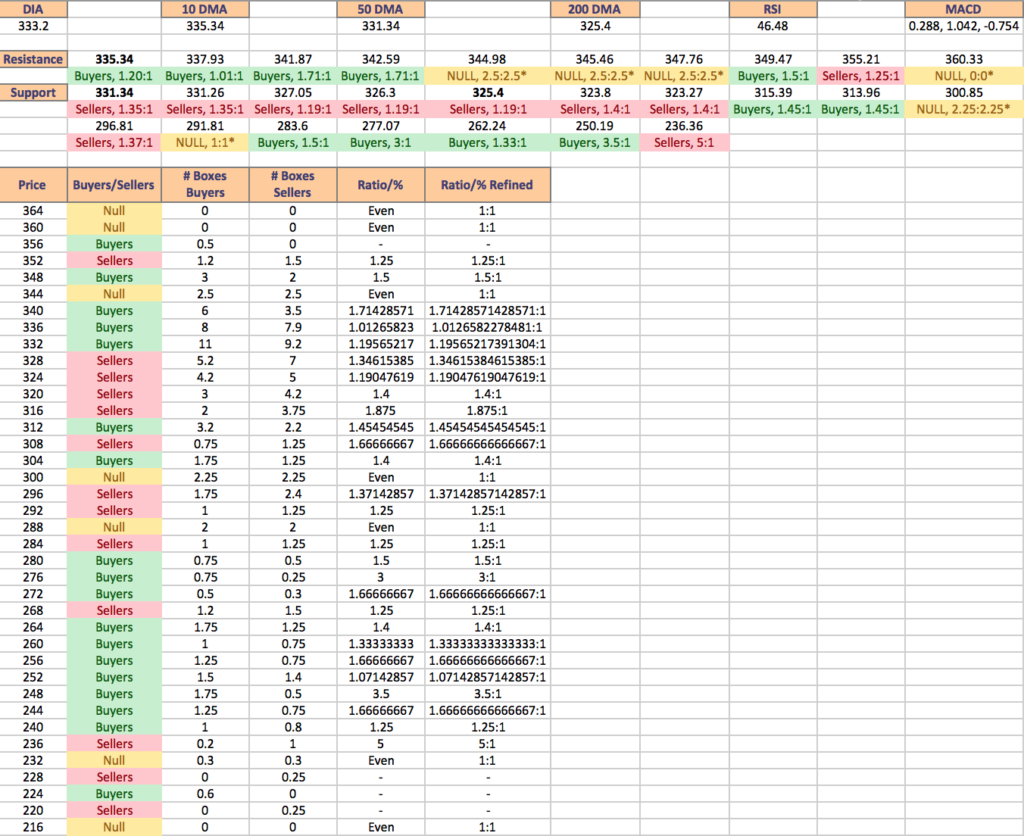
DIA, the SPDR Dow Jones Industrial Average ETF’s Volume Analysis At Support & Resistance Points
DIA is an ETF that is used to track the performance of the Dow Jones Industrial Average, whose Point & Figure Chart had closer to 3 year’s worth of data in the view, which called for using a 3 year candlestick chart for finding support & resistance levels.
DIA ETF – SPDR Dow Jones Industrial Average ETF’s Point & Figure Chart
DIA closed at $333.20/share on 5/12/2023, placing it in the $332 box in the data, which is currently favoring the Buyers 1.20:1.
DIA ETF – SPDR Dow Jones Industrial Average ETF’s Technical Performance Over The Past Two Years
The next 2 higher boxes are both in favor of the Buyers ($336 = 1.01:1 & $340 = 1.71:1), with the next 4 lower boxes being in favor of the Sellers ($328 = 1.35:1, $324 = 1.19:1, $320 = 1.4:1 & $316 = 1.88:1).
DIA ETF’s Volume By Price Level, Including At Support & Resistance Levels From The Past Three Years
DIA’s Resistance Levels For The Past Two Years & Their Volume Sentiment (BOLD denotes moving averages):
$335.34 – Buyers – 1.2:1 (10 DMA)
$337.93 – Buyers – 1.01:1
$341.87 – Buyers – 1.71:1
$342.59 – Buyers – 1.71:1
$344.98 – NULL – 1:1
$345.46 – NULL – 1:1
$347.76 – NULL – 1:1
$349.47 – Buyers – 1.5:1
$355.21 -Sellers – 1.25:1
$360.33 – NULL – 0:0*
DIA’s Support Levels for that time period are below (BOLD denotes moving average levels):
$331.34 – Sellers – 1.35:1 (50 DMA)
$331.26 – Buyers – 1.01:1
$327.05 – Sellers – 1.19:1
$326.30 – Sellers – 1.19:1
$325.40 – Sellers – 1.19:1 (200 DMA)
$323.80 – Sellers – 1.4:1
$323.27 – Sellers – 1.4:1
$315.39 – Buyers – 1.45:1
$313.96 – Buyers – 1.45:1
$300.85 – NULL – 1:1
$296.81 – Sellers – 1.37:1
$291.81 – NULL – 1:1
$283.60 – Buyers – 1.5:1
$277.07 – Buyers – 3:1
$262.24 – Buyers – 1.33:1
$250.19 – Buyers – 3.5:1
$236.36 – Sellers – 5:1
DIA’s Point & Figure price levels are listed below, with their respective volume sentiment:
$364 – NULL – 0:0*
$360 – NULL – 0:0*
$356 – Buyers – 0.5:0*
$352 – Sellers – 1.25:1
$348 – Buyers – 1.5:1
$344 – NULL – 1:1
$340 -Buyers – 1.71:1
$336 – Buyers – 1.01:1
$332 – Buyers – 1.20:1
$328 – Sellers – 1.35:1
$324 – Sellers – 1.19:1
$320 – Sellers – 1.4:1
$316 – Sellers – 1.88:1
$312 – Buyers – 1.45:1
$308 – Sellers – 1.67:1
$304 – Buyers – 1.4:1
$300 – NULL – 1:1
$296 – Sellers – 1.37:1
$292 – Sellers – 1.25:1
$288 – NULL – 1:1
$284 – Sellers – 1.25:1
$280 – Buyers – 1.5:1
$276 – Buyers – 3:1
$272 – Buyers – 1.67:1
$268 – Sellers – 1.25:1
$264 – Buyers – 1.4:1
$260 – Buyers – 1.33:1
$256 – Buyers – 1.67:1
$252 – Buyers – 1.07:1
$248 – Buyers – 3.5:1
$244 – Buyers – 3.5:1
$240 – Buyers – 1.25:1
$236 – Sellers – 5:1
$232 – NULL – 1:1
$228 – Sellers – 0.25:0*
$224 – Buyers – 0.6:0*
$220 – Sellers – 0.25:0*
$216 – NULL – 0:0*
Tying It All Together
Volume is one of the best indicators of investor sentiment that can be applied to any time frame, price level, or price range to help paint a better picture of the market’s behavior.
While it does not predict what will happen in the future as market conditions are ever changing & new variables may be of more importance now than they were when these volume levels were read, it can provide a reference as to how investors may behave when the same levels are approached again.
This document was intended to show investor sentiment at levels of support & resistance that are currently relevant to their price levels, while also providing more widespread data that can be used as prices move away from the levels of support & resistance mentioned above.
It can be combined with a current analysis of markets to give more clarity into how investors have historically behaved when prices have been in the price levels listed during the relevant time periods to provide additional detail to your analysis.
It is not intended to serve as investment recommendations or advice.
*** I DO NOT OWN SHARES OR OPTIONS CONTRACT POSITIONS IN SPY, QQQ, IWM or DIA AT THE TIME OF PUBLISHING THIS ARTICLE ***
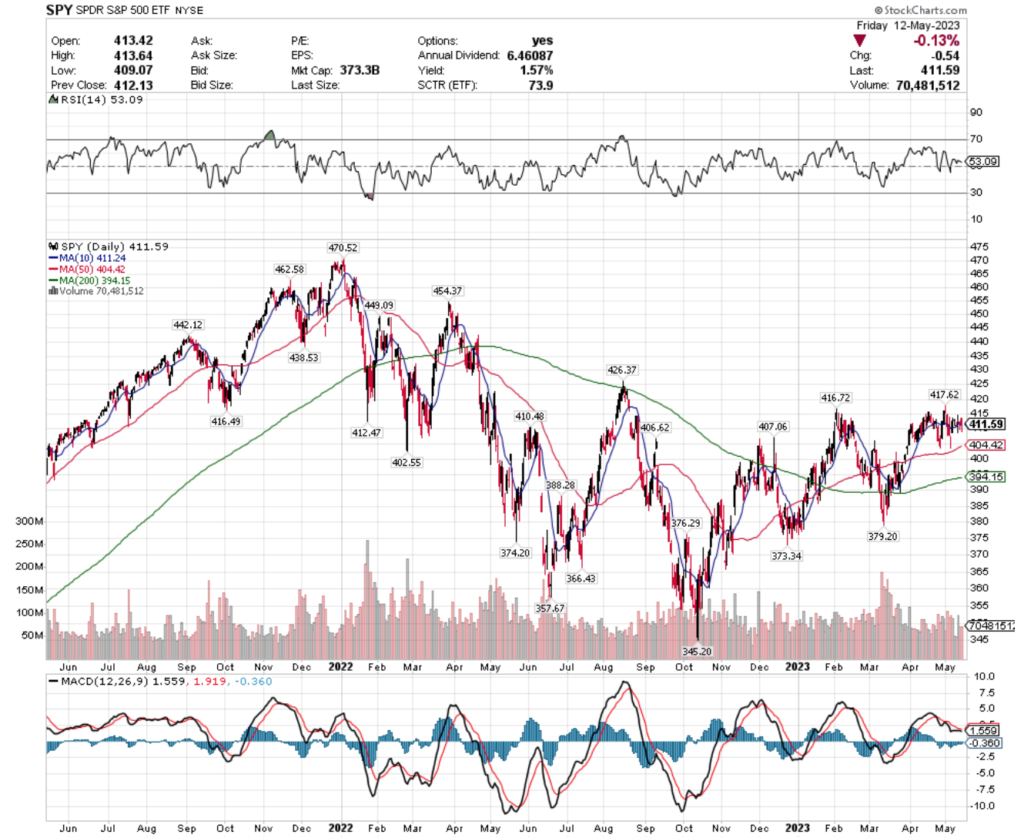
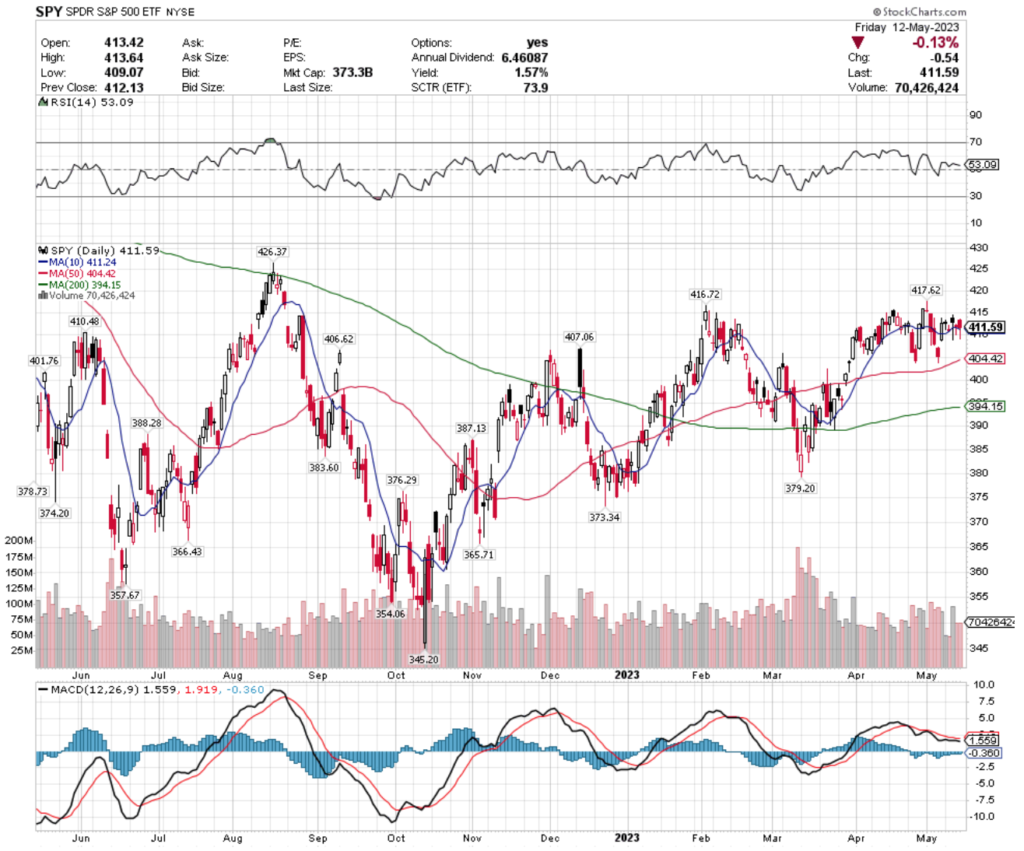
SPY, the SPDR S&P 500 ETF lost -0.25% over the past week & remained in the same range that it’s been in for the past month & a half.
SPY ETF – SPDR S&P 500 ETF’s Technical Performance Over The Past Year
Uncertainty is still in the air, as the last few days’ candlesticks could characterize the past week as “the week of the hanging man”.
SPY’s RSI is still neutral at 53, with volumes slightly dipping from the previous weeks, but remaining in-line with the year prior’s average volume range.
Their MACD is still bearish, but both lines are moving relatively flat as a result of the previous month’s trading range still being in tact.
SPY has support at the $411.24 (10 day moving average), $410.48, $407.06 & $406.62/share price levels, with resistance at the $416.49, $416.72, $417.62 & $426.37/share price levels.
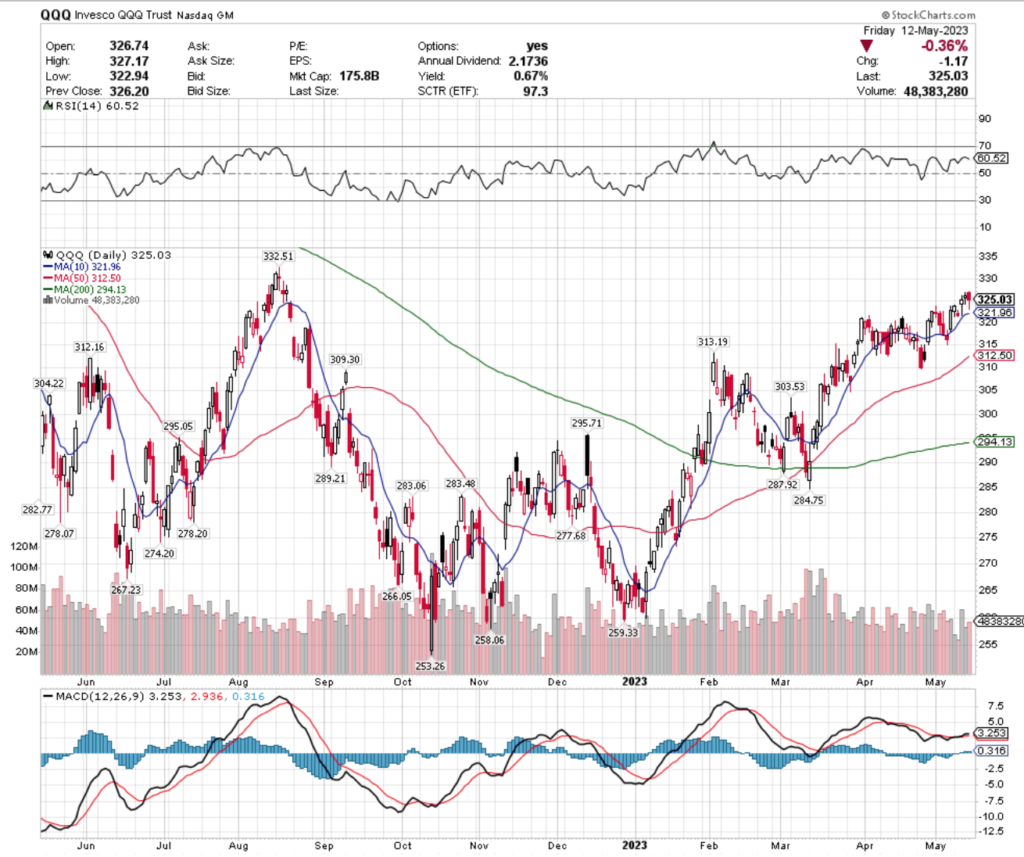
QQQ, the Invesco QQQ Trust ETF climbed +0.66% over the past week, after getting off to a slow start on Monday followed by an upside pivot on Wednesday.
QQQ ETF – Invesco QQQ Trust ETF’s Technical Performance Over The Past Year
Much like SPY, their past week is also marred with uncertainty when you look at the candles, with Wednesday & Friday being hanging men & Thursday being a spinning top, all of whom’s real bodies stayed relatively in-line with one another.
QQQ’s RSI is on the oversold end of neutral at 60.52, but their volume has waned a bit compared to the year prior’s average this past week.
Their MACD is also relatively flat, with both lines sitting atop one another waiting for the catalyst that will send it in one direction or another.
QQQ has support at the $321.96 (10 day moving average), $313.19, $312.96 (50 day moving average) & $312.16/share price levels, with resistance at the $331.19, $332.51, $346.78 & $368.99/share price levels (resistance levels required a 2 year chart view).
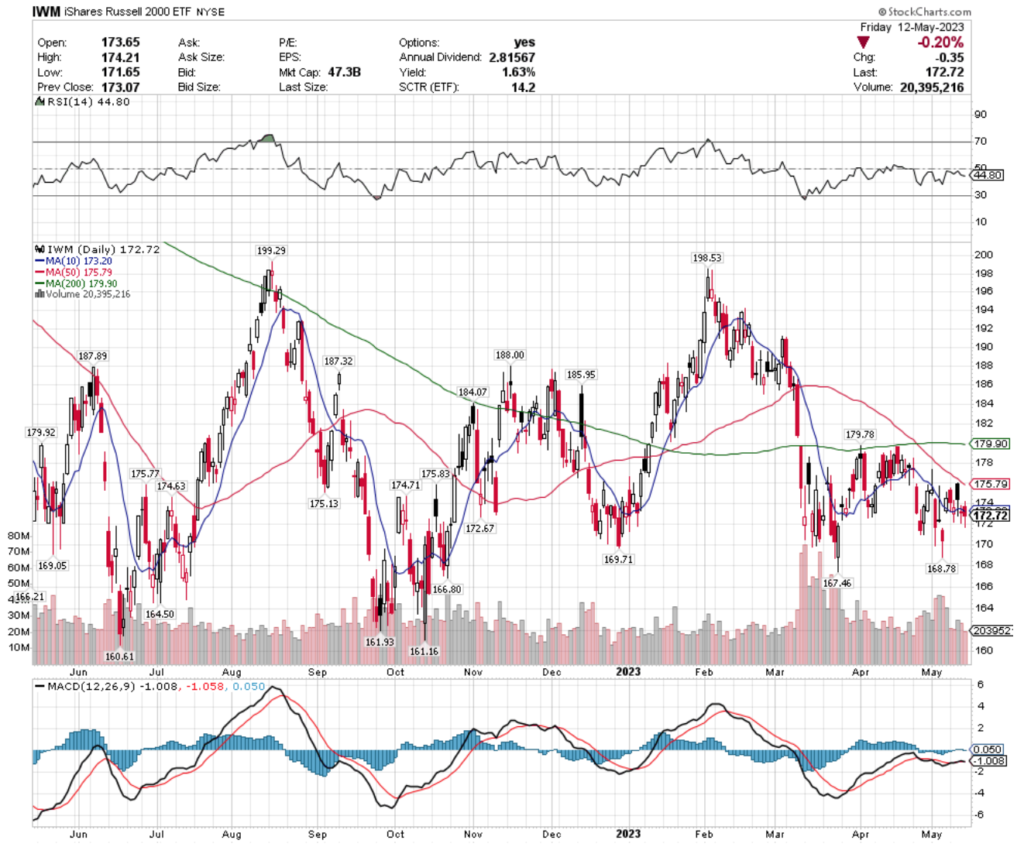
IWM, the iShares Russell 2000 ETF declined -0.99% over the past week, as investors fled from smaller cap names, mostly in favor of the larger NASDAQ components.
IWM ETF – iShares Russell 2000 ETF’s Technical Performance Over The Past Year
They too were not spared the uncertainty, with a week filled with hanging men & spinning top candlesticks as traders & investors await a signal as to which direction to move in.
Their RSI is on the more oversold end of neutral at 44.8, but trading volumes have remained relatively close to average compared to the year prior.
Their MACD is also in the same state of limbo as SPY’s & QQQ’s, although it is currently giving a slightly bullish reading.
IWM has support at the $172.67, $169.71, $169.05 & $168.78/share price levels, with resistance at the $173.20 (10 day moving average), 174.63, $174.71 & $175.13/share price levels.
Let’s dive into some of the best & worst performing market sectors & geo-locations based on this week’s technical analysis ratings!
Mexico (MEXX), U.S. Home Construction (ITB), Brazil Small Caps (BRF) & Global Gold Miners (RING) Are All Bullishly Leading The Market
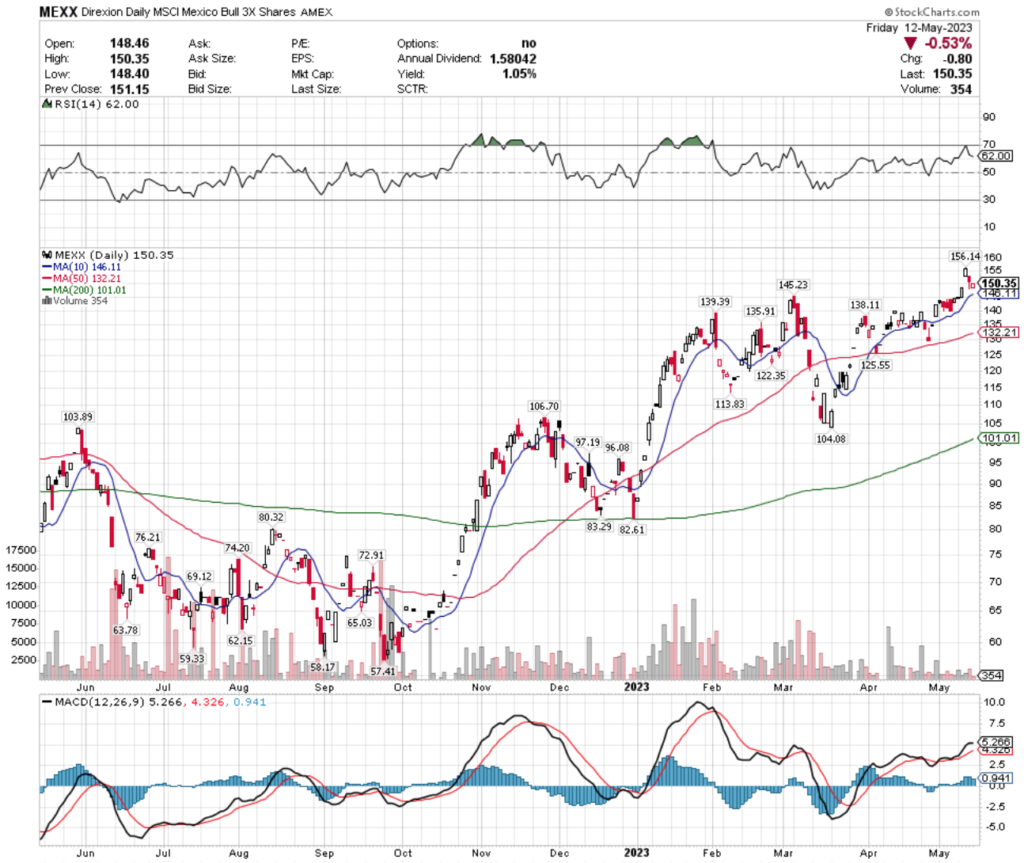
MEXX ETF – Direxion Daily MSCI Mexico Bull 3x Shares ETF’s Technical Performance Over The Past Year
After a year of explosive growth, MEXX’s volumes have declined to well below average compared to the year prior, signaling uncertainty in the near-term by investors.
Their RSI at 62 is on the overbought end of neutral & their MACD is beginning to show signs of a near-term bearish crossover, after two days of declines to fill the window following Wednesday’s gap up.
MEXX offers a 1.05% distribution yield to long-term holders, which will not provide much cushion against any impending consolidation or correction from their current high range for the past year.
This makes it important for investors to have a defensive options strategy in place for insurance such as buying puts or selling calls while they watch to see how MEXX behaves around support levels.
MEXX has support at the $146.11 (10 day moving average), $145.23, $139.39 & $138.11/share price levels, as they try to break out & above their $156.14, $159.55 & $162.16/share resistance levels (latter 2 are from 2019).
For investors who find too much risk in a 3x leveraged ETF, it is possible to get Mexico exposure via the EWW ETF, which was featured in our 4/23/2023 Weekly Notes.
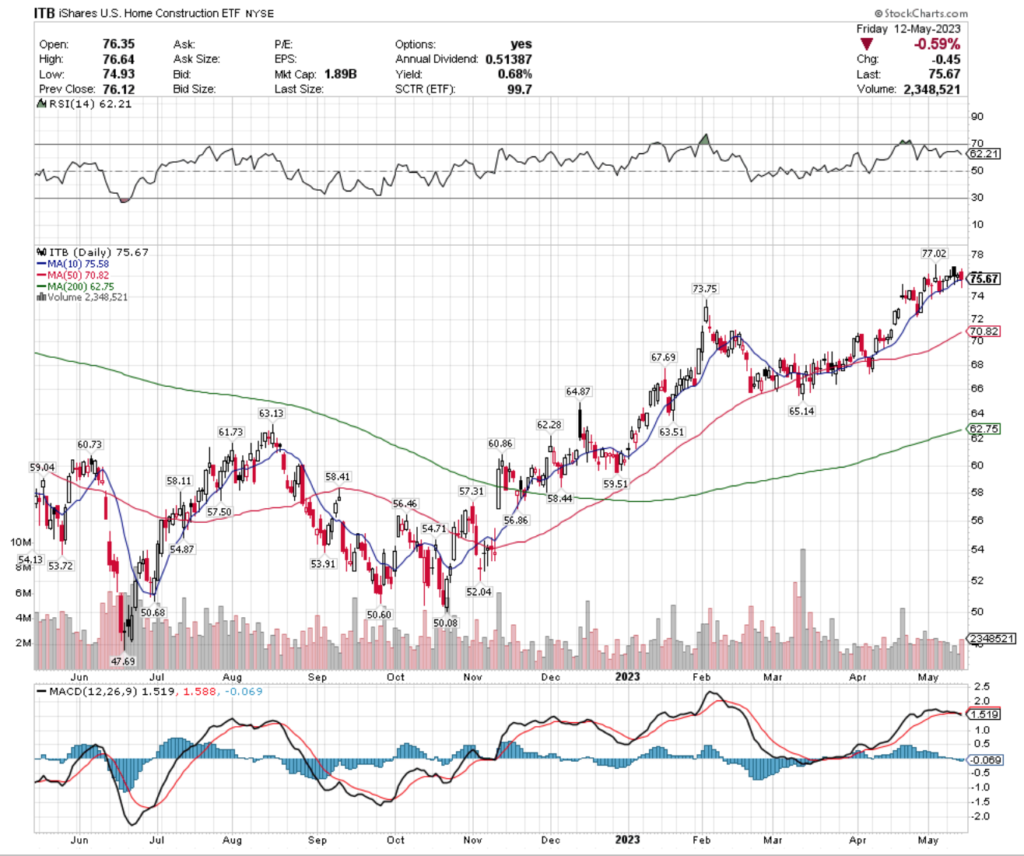
ITB ETF – iShares U.S. Home Construction ETF’s Technical Performance Over The Past Year
Much like MEXX, ITB & the U.S. Home Construction industry have been very bullish over the past year, but their volumes have waned less in recent days vs. MEXX & are much closer to average compared to the year prior’s levels.
This past week they remained relatively rangebound, with all of the real bodies of their candlesticks remaining at the same general price level, as traders & investors look for a catalyst to push them in one direction or another.
Their RSI is on the overbought end of neutral at 62, but their MACD has bearishly crossed over after spending the past week in a consolidation range.
With a modest 0.68% distribution yield for long-term holders there is limited cushion against losses from these steep price levels, making an insurance strategy against losses appealing while watching to see how they behave around their support levels in the near-term.
ITB has support at the $75.58 (10 day moving average), $73.75, $70.82 (50 day moving average) & $67.69, with resistance overhead at the $77.02, $77.51 & $82.52/share price levels (last 2 resistance levels are from 2021).
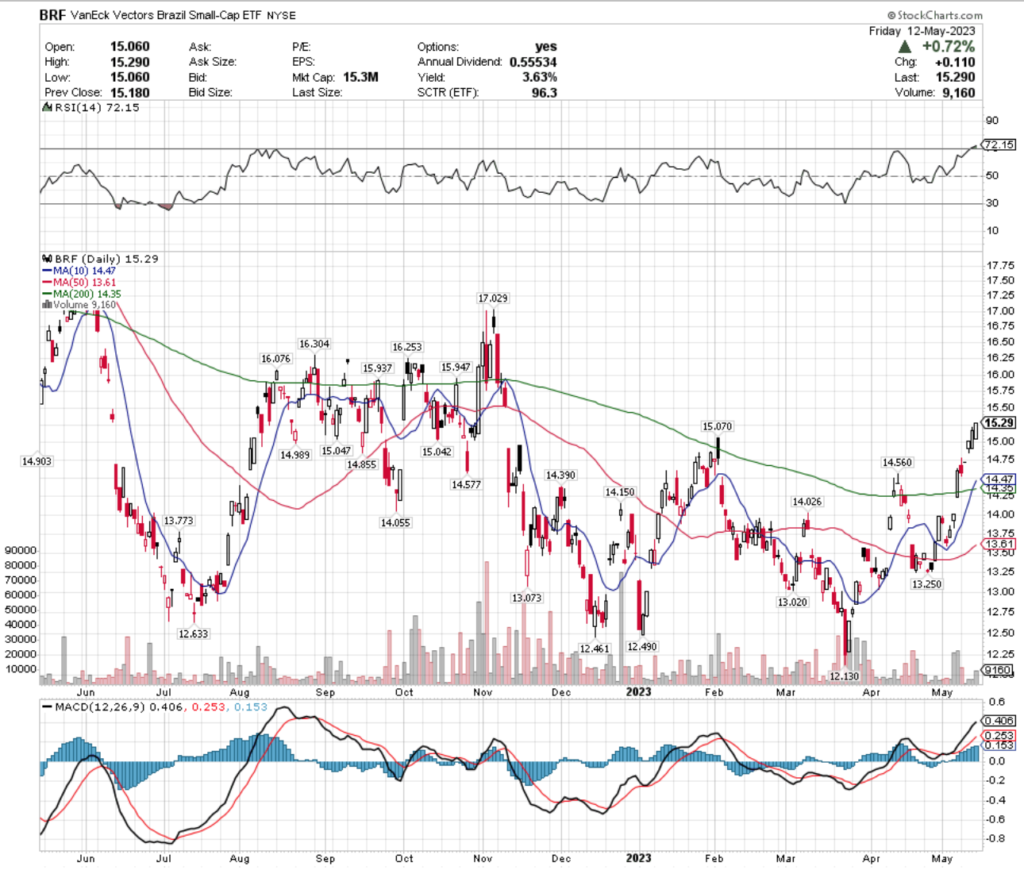
BRF ETF – VanEck Vectors Brazil Small-Cap ETF’s Technical Performance Over The Past Year
While they have fallen over the past year, their recent recovery in 2023 has shown strength compared to other ETFs, giving them a higher ranking in our system.
Their RSI is overbought currently at 72 after Wednesday’s gap up, but investor sentiment is signaling weakness in the past week as their volumes feel to below average compared to the year prior & their last three candlesticks all remained relatively closely aligned with one another’s real bodies.
Their MACD is still bullish & their 10 day moving average crossed through their 200 day moving average on Thursday of this past week.
With a 3.63% cushion against losses from their distribution yield for long-term shareholders, there is more protection against losses than some other names in this article, but a defensive options strategy would be wise to have as their RSI is signaling a near-term cooldown.
BRF has support at the $15.07, $15.05, $15.04 & $14.99/share price levels, as they try to resistance at the $15.94, $15.95, $16.08 & $16.25/share price levels.
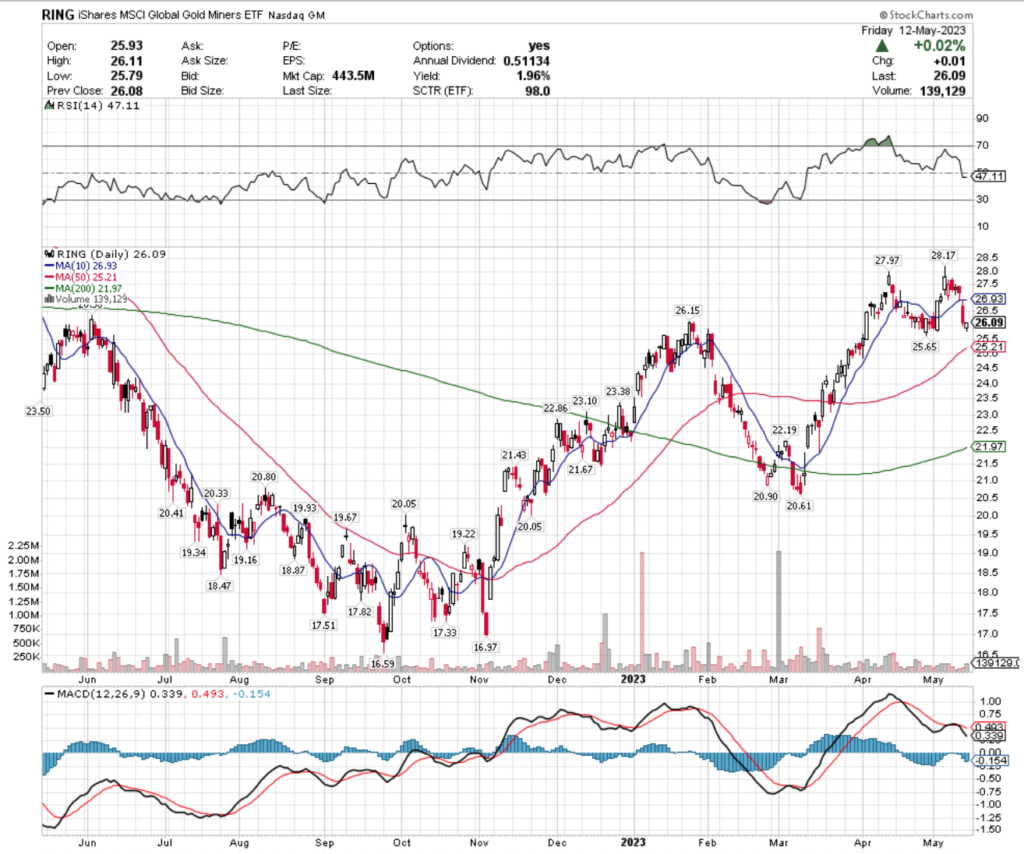
RING ETF – iShares MSCI Global Gold Miners ETF’s Technical Performance Over The Past Year
Their MACD has been in bearish decline over the past week, as their RSI dipped just under neutral to 47.
Recent volumes are showing indecisiveness in where investors value their shares, falling to below average levels for the year prior, with their past week’s candlesticks signaling an impending slide that was capped off with a hammer to close Friday’s session & temporarily slow their losses.
RING offers a 1.96% distribution yield, which provides a slight cushion for long-term holders, but like the other names mentioned above, they are best approached with a defensive options strategy while watching how they behave at their support levels in the near-term.
RING has support at the $25.65, $25.21 (50 day moving average), $23.50 & $23.38/share price level, with resistance at the $26.15, $26.36, $26.93 (10 day moving average) & $27.97/share price levels.
Cannabis (POTX), Oil Services (OIH), U.S. Aerospace & Defense (ITA) & Hong Kong (EWH) Are All Bearishly Lagging The Market
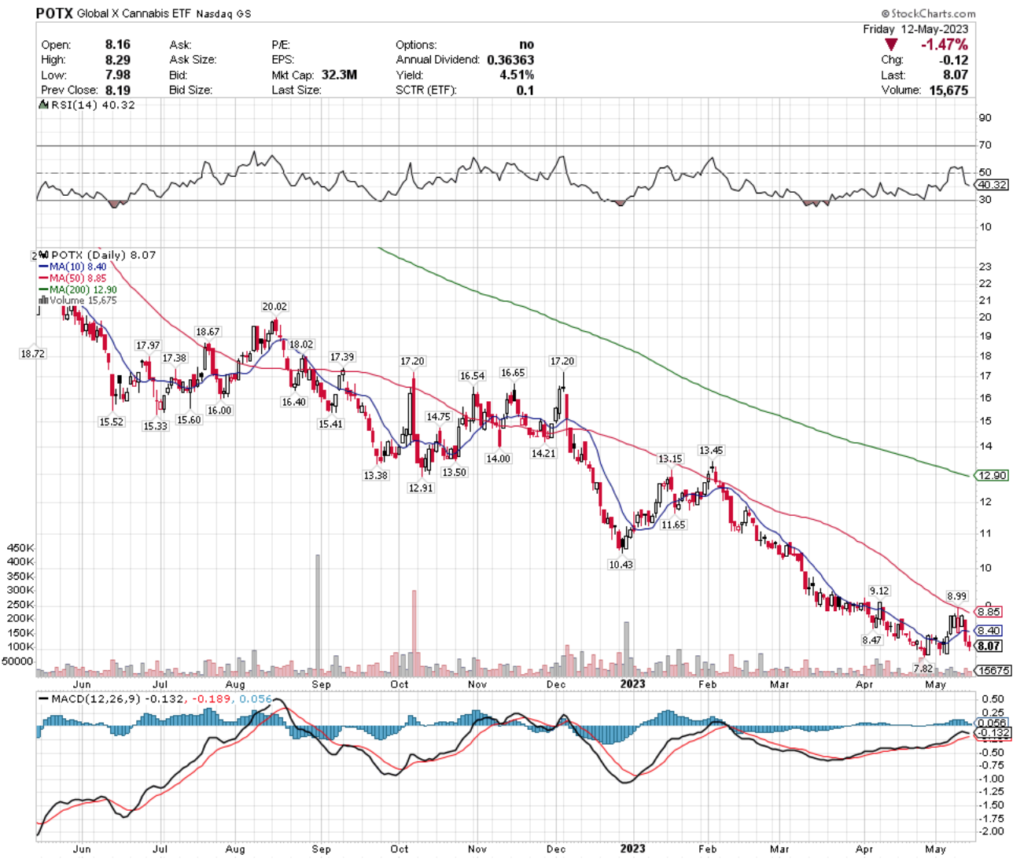
POTX, the Global X Cannabis ETF has fallen -62.09% over the past year, dropping -65.78% since their 52-week high in May of 2022, but recovering +3.2% since their 52-week low in April of 2023 (ex-distributions).
POTX ETF – Global X Cannabis ETF’s Technical Performance Over The Past Year
This year has been very bearish for the cannabis industry as a whole & POTX is looking to rebound off of their recent 52-week low.
Their RSI is on the oversold end of neutral at 40, but their MACD looks primed to cross bearishly in the coming trading sessions.
Volumes recently have been below average compared to the year prior, signaling uncertainty among investors.
POTX offers a 4.51% distribution yield for long-term holders, which can help protect against future losses, but in the near-term a defensive options strategy can generate profits for investors while they wait to see how POTX behaves at support levels.
POTX has support at the $7.82 (all time lowest since their inception in 2020), with resistance at the $8.40 (10 day moving average), $8.47, $8.85 (50 day moving average) & $8.99/share price levels.
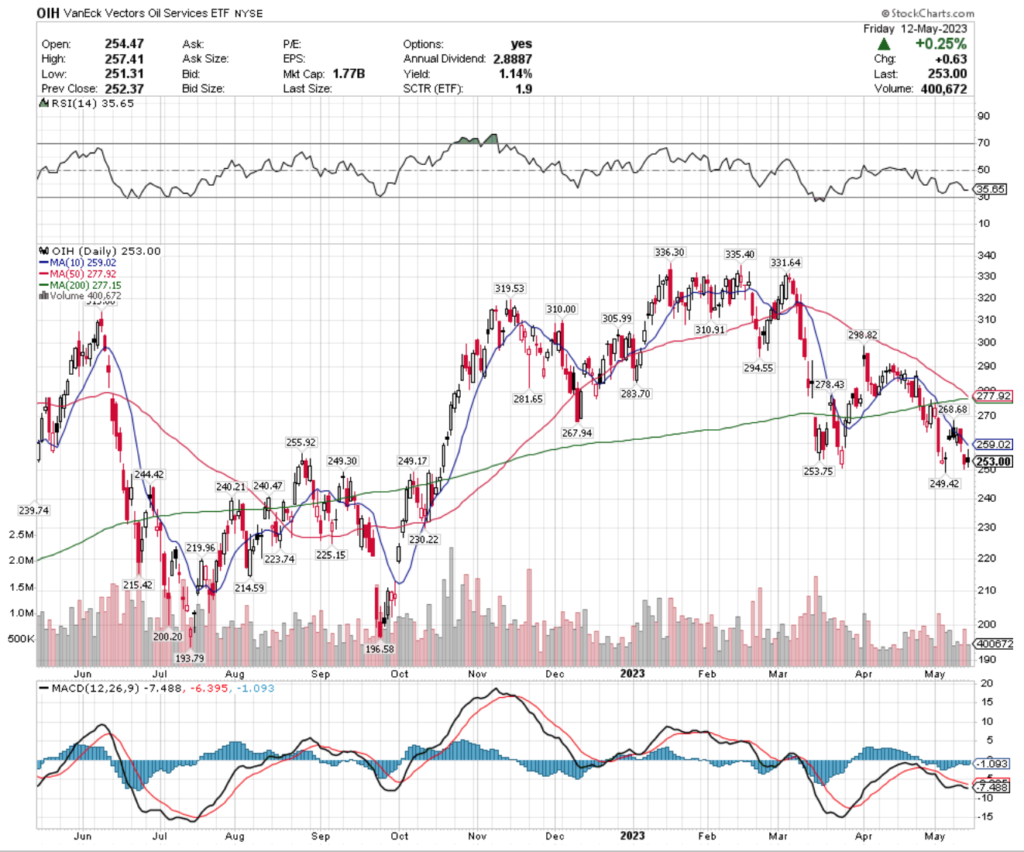
OIH, the VanEck Vectors Oil Services ETF has lost -2.61% over the past year, falling -24.77% since their 52-week high in January 2023, but has regained +29.23% since their 52-week low in July of 2022 (ex-distributions).
OIH ETF – VanEck Vectors Oil Services ETF’s Technical Performance Over The Past Year
Their RSI is closing in on oversold levels, which is supported by their impending death cross (bearish crossover of the 50 & 200 day moving average), which will add to the declines that began with Thursday’s gap down.
Their MACD is still bearish, but attempting to flatten out for a bullish crossover, but recent trading volumes are below average compared to the year prior, signaling weakness in the near-term as investors are not overly eager to buy shares at these price levels.
OIH offers a 1.14% distribution yield for long-term holders, but again, like everything else in this article, the best course of action currently is to wait & see their behavior around support levels, while employing a defensive strategy using options as an insurance policy.
OIH has support at the $249.42, $249.30, $249.17 & $244.42/share price levels, with resistance at the $253.75, $255.92, $259.02 (10 day moving average) & $267.94/share price levels.
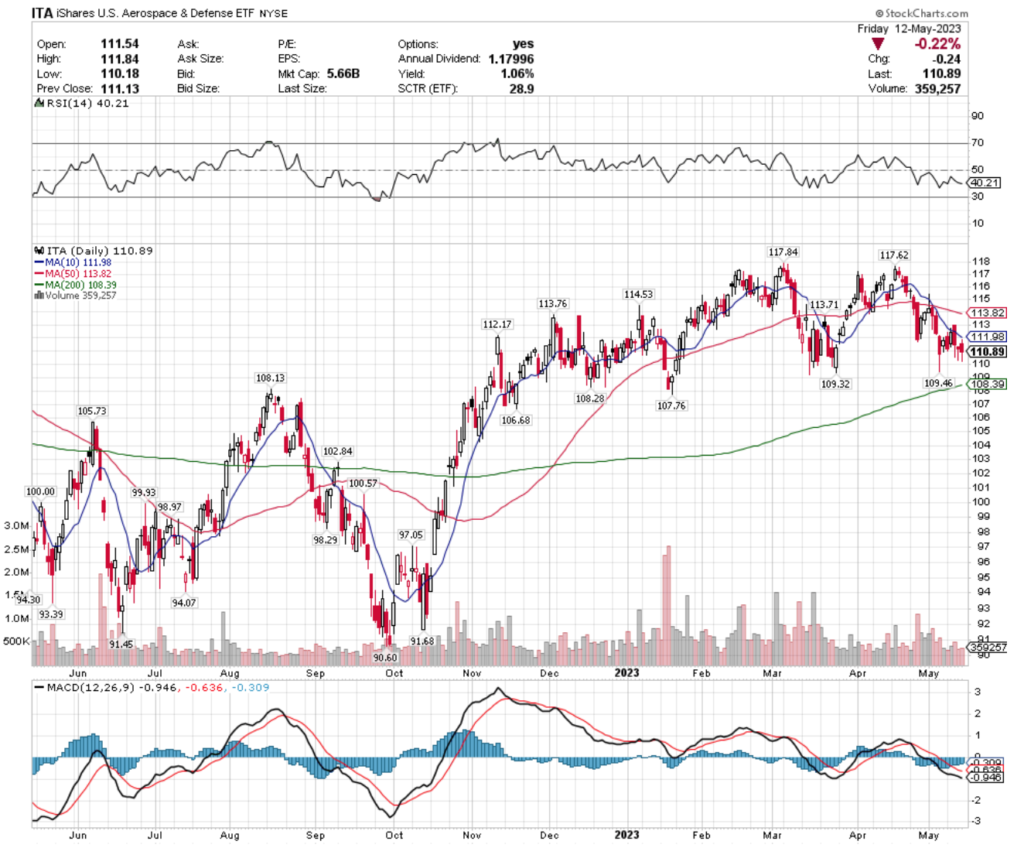
ITA, the iShares U.S. Aerospace & Defense ETF has gained +13.61% over the past year, losing -6.14% from their 52-week high in March of 2023 & improving +21.83% since their 52-week low in September of 2022 (ex-distributions).
ITA ETF – iShares U.S. Aerospace & Defense ETF’s Technical Performance Over The Past Year
Their MACD has been bearish for the past month, as their price has been in steady decline, with their RSI on the oversold end of neutral at 40.
Recent trading volumes are slightly below average compared to the year prior, signaling caution from investors.
ITA’s 1.06% distribution yield is not enough cushion to protect against any further near-term declines, making it wise to have a defensive strategy as insurance against losses, while watching their behavior around the near-term support levels.
ITA has support at the $109.46, $109.32, $108.28 & $108.13/share price levels, with resistance at the $111.98, $112.17, $113.71 & $113.76/share price levels.
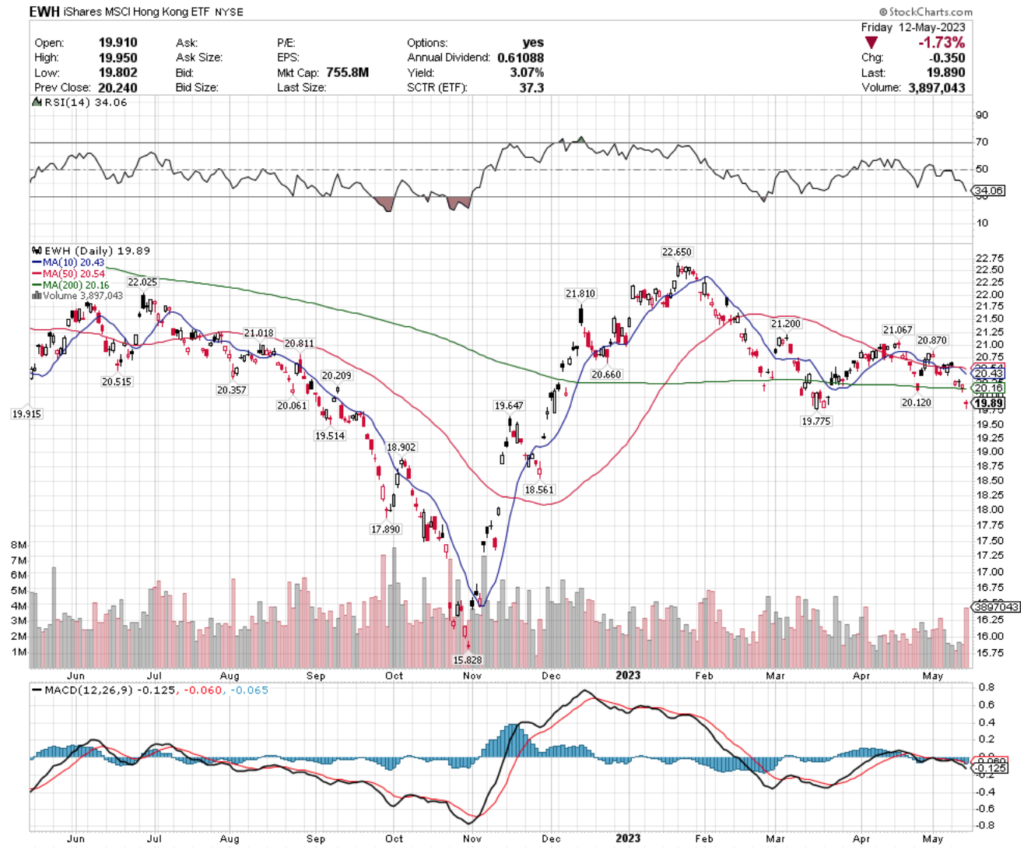
EWH, the iShares MSCI Hong Kong ETF has fallen -3.13% over the past year, dropping -12.19% since their 52-week high in January of 2023, but improving +24% since their 52-week low in October of 2022 (ex-distributions).
EWH ETF – iShares MSCI Hong Kong ETF’s Technical Performance Over The Past Year
Their RSI is very bearish & approaching oversold territory quickly, after 2 gap downs in the past week, which are setting the tone for the week ahead to be bearish at worst & at best finding them establishing a new, lower price range.
Their MACD is also bearish, and recent trading volumes have been relatively close to average compared to the year prior, signaling that there may be more losses incurred in the near-term.
With a 3.07% distribution yield for long-term holders, there is some protection against losses, but this is another instance where an insurance policy using options is the best idea in the near-term while watching their behavior at their support levels.
EWH has support at the $19.78, $19.65, $19.51 & $18.90/share price levels, with resistance at the $19.92, $20.12, $20.16 (200 day moving average) & $20.21/share price levels.
Tying It All Together
Next week’s data announcements kick off Monday morning at 8:30 am with the Empire Manufacturing Survey data & Chicago Fed President Goolsbee speaking on TV, followed by Minneapolis Fed President Kashkari speaking at 9:15 am.
Tuesday is a bit busier, beginning at 8:15 am with Cleveland Fed President Mester Speaking, U.S. Retail Sales & Retail Sales Minus Autos reported at 8:30 am, Industrial Production & Capacity Utilization at 9:15 am, and at 10 am Business Inventories, Home Builder Confidence Index data & Fed Chair Barr testifying.
Also on Tuesday at 10:30 am Richmond Fed President Barkin speaks, followed by New York Fed President Williams at 12:15 pm, Chicago Fed President Goolsbee on TV at 2:30 pm & Atlanta Fed President Bostic & Chicago Fed President Goolsbee speaking on a panel at 7pm.
Tuesday’s earnings calls include Home Depot, Baidu, Sea Limited, Tencent Music, Tupperware & others.
Wednesday has a slower pace on the data front, with Housing Starts & Building Permits data reported at 8:30 am.
Cisco Systems reports earnings on Wednesday, along with Bootbarn Holdings, Copart, Jack In the Box, Synopsys, Take-Two Interactive, Target, TJX, Trip.com Group, Wix.com & more.
On Thursday at 8:30 am the Philadelphia Fed Factory Survey & Initial Jobless Claims data are reported, followed by Fed Governor Philip Jefferson speaking at 9:15 am, Fed Vice Chair for Supervision Barr Testifying at 9:30 am, and at 10 am Existing Home Sales & U.S. Leading Economic Indicators data will be reported.
Walmart is set to report earnings on Thursday, as well as Alibaba Group Holding, Applied Materials, Bath & Body Works, Bilibili, Canada Goose, Deckers Outdoor, Dole, Ross Stores, The Children’s Place & many more.
Friday winds the week down with New York Fed President Williams speaking at 8:45 am & at 11 am Fed Chairman Powell & former Fed Chairman Bernanke will be speaking on a panel.
Friday’s bigger earnings reports include Deere & Footlocker.
See you back here next week!
*** I DO NOT OWN SHARES OR OPTIONS CONTRACT POSITIONS IN SPY, QQQ, IWM, MEXX, ITB, BRF, RING, POTX, OIH, ITA, or EWH AT THE TIME OF PUBLISHING THIS ARTICLE ***
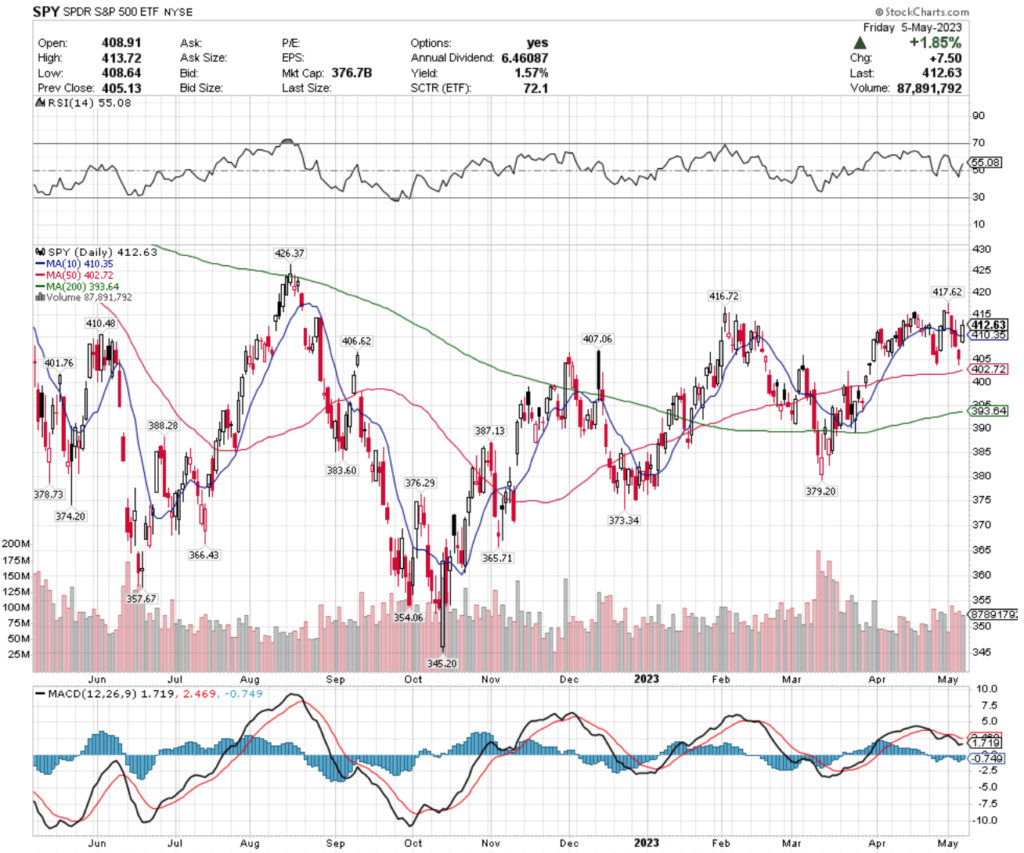
SPY, the SPDR S&P 500 ETF lost -0.79% over the past week, in a week filled with earnings reports, the Federal Reserve & ECB’s Interest Rate Decision & other data points flooding in.
Volumes were heavier than they’ve been for the prior month, but were still not as active as in March.
SPY’s MACD is trying to flatten out to cross bullishly, while their RSI remains in the neutral range, signaling that unless there is some positive momentum stemming from Friday’s +1.85% gap up it looks like the $405/share level will be tested again.
SPY has support at the $410.48, $410.35 (10 day moving average), $407.06 & $406.62/share price levels before the $405 mark that it has had difficulty crossing through, with resistance at the $416.49, $416.72, $417.62 & $426.37/share price levels.
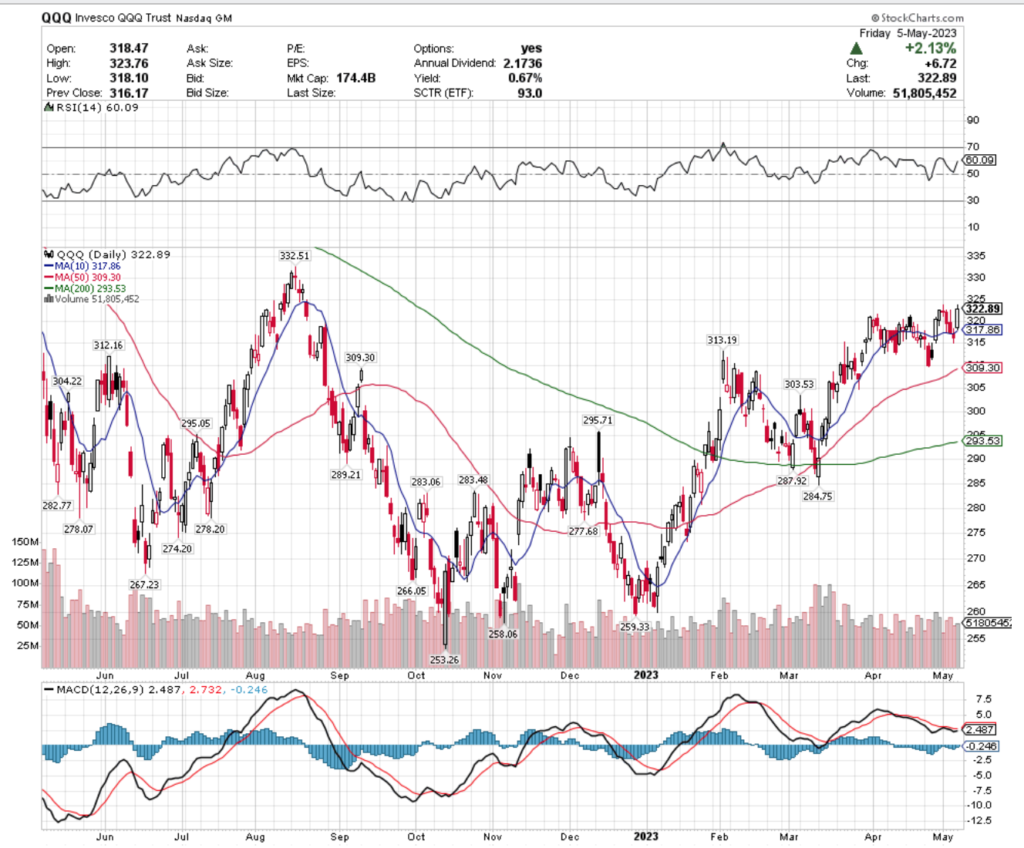
QQQ, the Invesco QQQ Trust ETF nudged forward 0.1% over the past week, fairing the best of the indexes we cover in this section for the week.
Their technicals are looking similar to SPY’s, with a bearish, but flattening MACD & an RSI that entered into the overbought end of neutral with Friday’s +2.13% gap up session.
Volumes have been consistent, but like SPY, if the momentum of Friday isn’t able to be carried into the new week, there looks to be a resumption of the rest of the week’s declines for QQQ.
QQQ has support at the $317.86 (10 day moving average), $313.19, $312.16 & $309.30/share price levels, with resistance at the $331.19, $332.51, $346.78 & $368.99/share price levels.
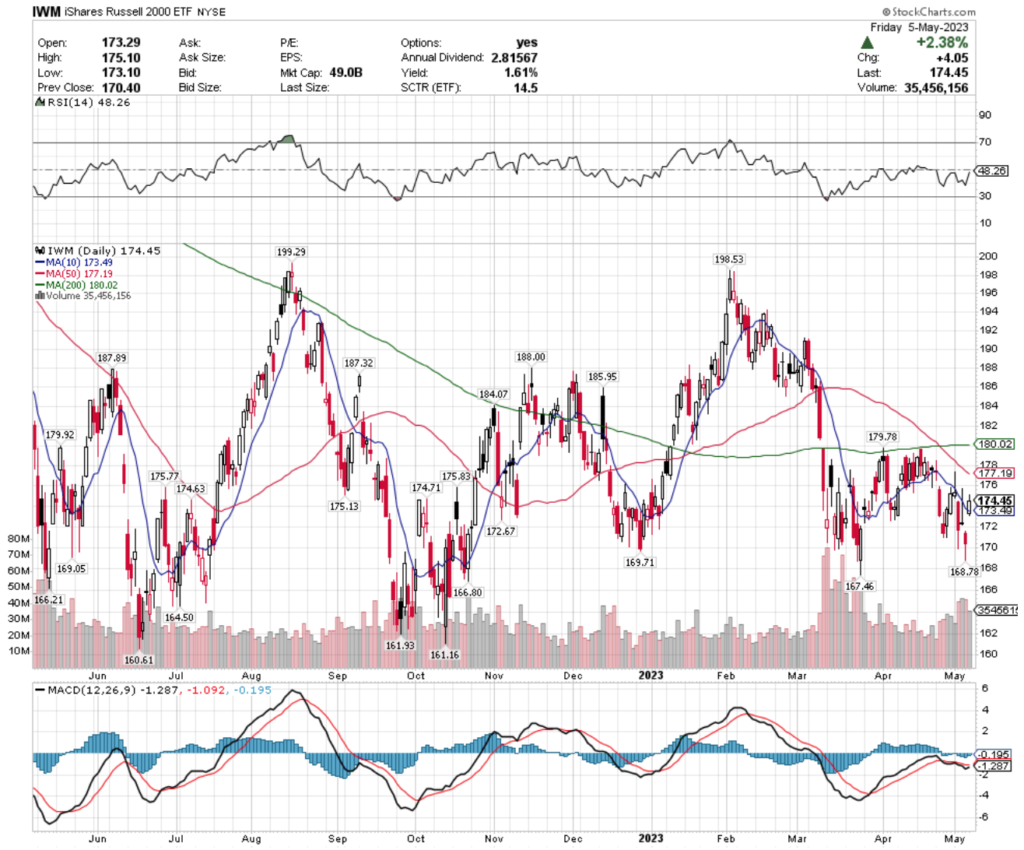
Their MACD is similar to SPY’s & QQQ’s after Friday’s +2.38% gap up session helped to flatten out a bearish trending indicator reading.
IWM’s RSI is neutral, with above average volume this past week compared to the year prior.
IWM has support at the $173.49 (10 day moving average), $172.67, $169.71 & $169.05/share price levels & resistance at the $174.63, $174.71, $175.13 & $175.77/share price levels.
Let’s dive into some of the best & worst performing sectors & geo-locations in the market, based on technical performance rankings!
Italy (EWI), Robotics & Artificial Intelligence (BOTZ), Sports & Gaming Betting (BETZ) & International Equities (SCHF) Are All Bullishly Leading The Market
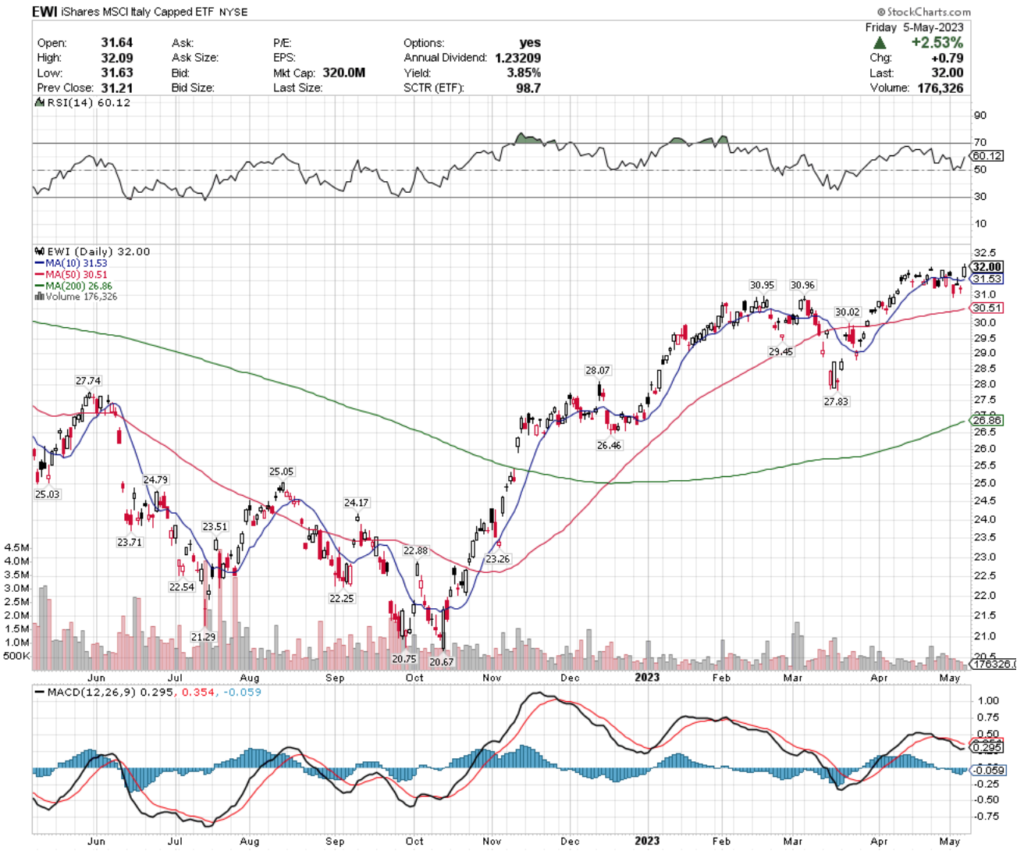
EWI, the iShares MSCI Italy Capped ETF has gained +23.9% over the past year, improving an impressive +52.45% since their 52-week low in October of 2022 (ex-distributions).
Their RSI is neutral at 50 & while their MACD is currently bearish, it is beginning to make a run at turning bullish after the past couple of weeks’ consolidation range & Friday’s +2.53% gap up.
Volume has been far below average compared to the year prior, signaling that investors are unsure of where they value the ETF.
While EWI offers a 3.85% distribution yield for long-term holders, a protective options strategy would provide better cushion against losses in the near-term, while watching how they behave at support levels before entering or adding to a position.
EWI has support at the $31.53 (10 day moving average), $30.96, $30.95 & $30.51/share (50 day moving average) price levels, with resistance overhead at the $32.02, $32.18, $32.46 & $32.47/share price levels (from 2022, viewing 2 year chart).
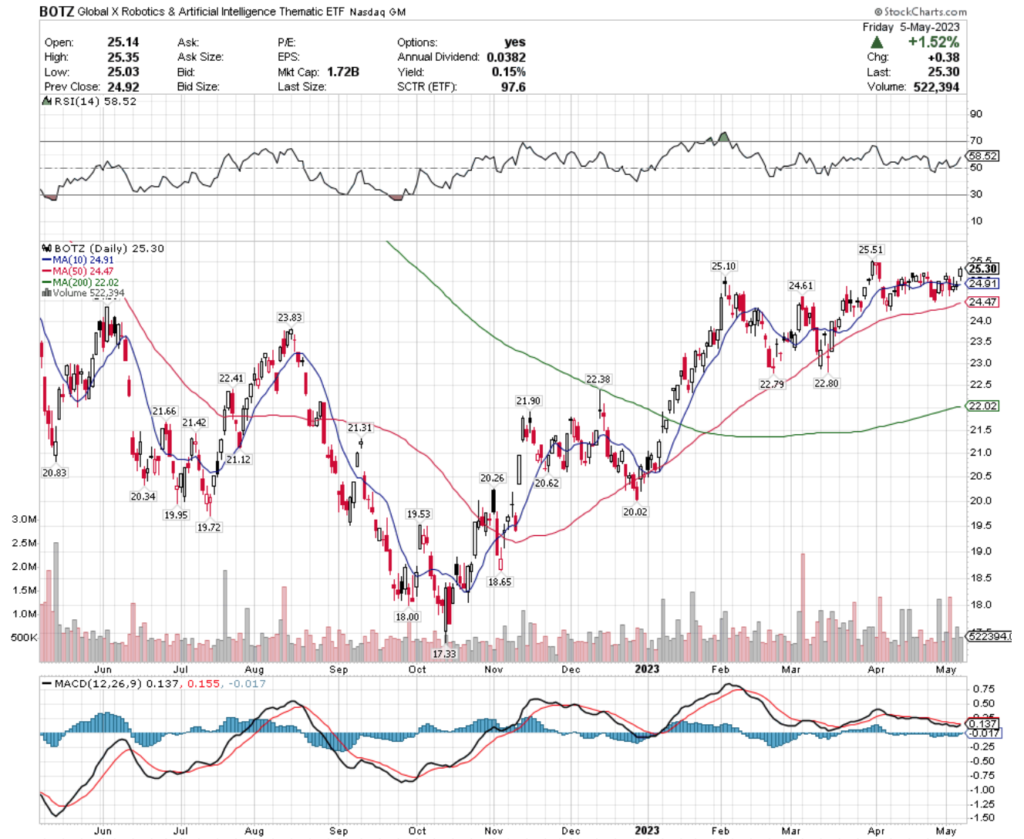
Their MACD is on the verge of bullishly crossing over, after spending much of April in a consolidated price range.
Their RSI is on the overbought end of neutral (in part due to Friday’s 1.52% gap up), with recent trading volumes being about average compared to the year prior.
With a tiny 0.15% distribution yield, there is no cushion against a price correction, making an options strategy the best near-term choice while waiting to see how they behave at key support levels.
BOTZ has support at the $25.10, $24.91 (10 day moving average), $24.61 & $24.47/share (50 day moving average) price levels, with resistance at the $25.51, $25.75, $26.53 & $27.39/share price levels (in 2022, using a 2 year chart).
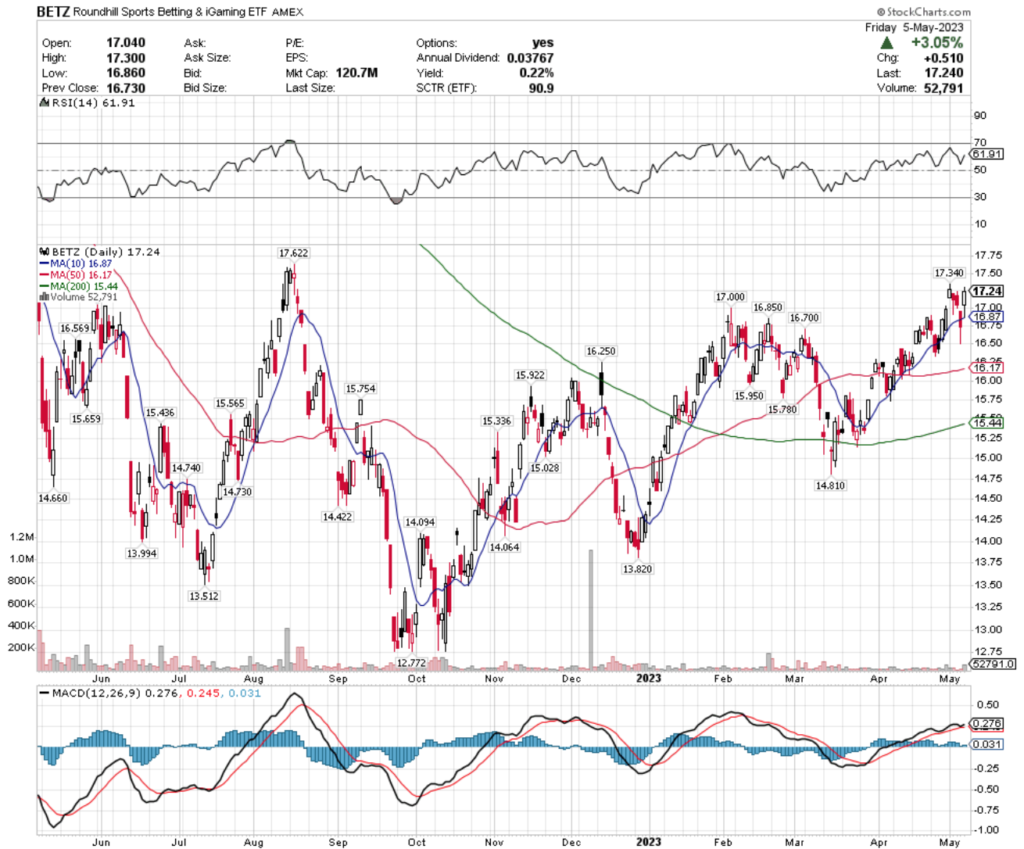
They too have an RSI that is on the overbought end of neutral at ~62, while investors show uncertainty & have been trading in low volume.
Their MACD lines are pressed right against one another & their modest 0.22% distribution yield for long-term shareholders will provide limited cushion against losses, making it important to have an insurance policy in place, whether it be through buying puts, selling calls or another strategy, while waiting to see how they behave at support levels.
BETZ has support at the $17, $16.87 (10 day moving average), $16.85 & $16.70/share price levels, with resistance at the $17.34, $17.62, $17.66 & $18.20/share price ranges.
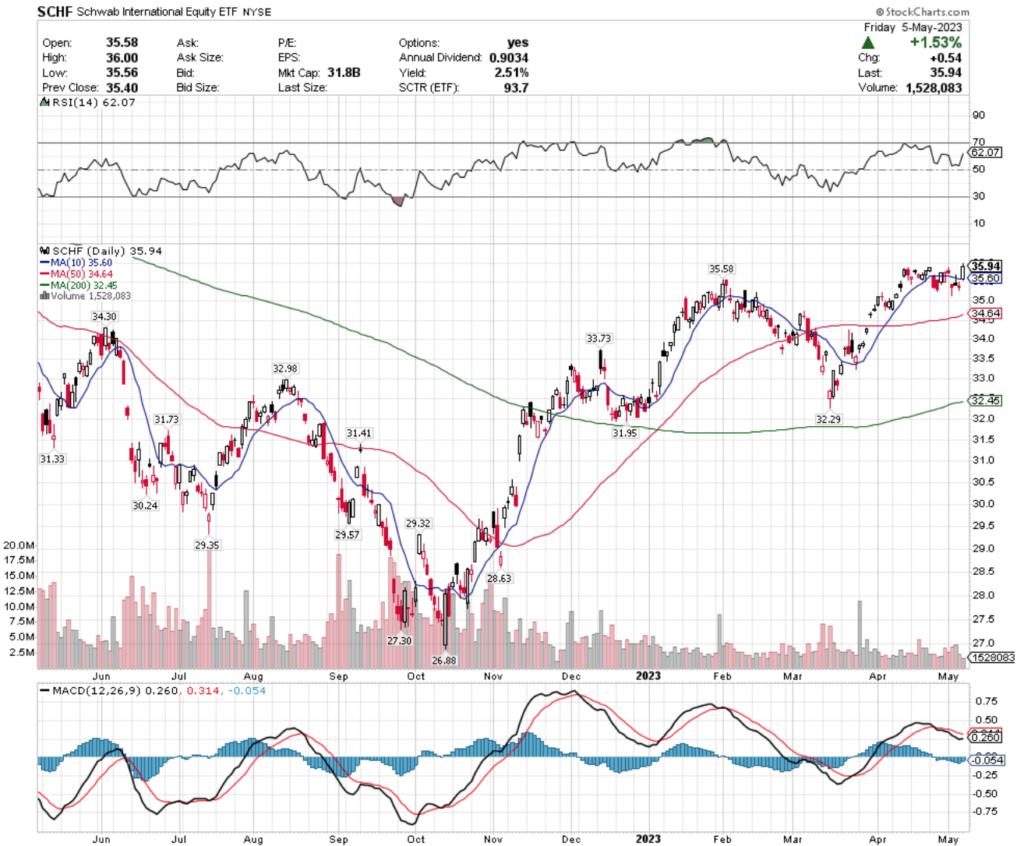
They too have an RSI in the low 60’s, signaling a rise towards overbought conditions, with very unconvincing low volume in 2023, compared to the year prior.
Their MACD is heading in the direction of a bullish crossover in the near-term, if the momentum from Friday’s +1.53% gap up is sustained in early next week.
While they offer a 2.51% cushion in terms of a distribution yield for long-term shareholders, a defensive options position would be better suited for while you wait to see how they behave around their support levels in the coming weeks.
SCHF has support at the $35.60 (10 day moving average), $35.58, $34.64 (50 day moving average) & $34.30/share price levels, with resistance at the $35.96, $36.04, $36.23 & $36.49/share price levels.
Diversified Commodity Strategy (PDBC), U.S. Broker Dealers & Securities Exchanges (IAI), U.S. Preferred Stocks (PFF) & Chinese Technology (CQQQ) Are All Bearishly Lagging The Market
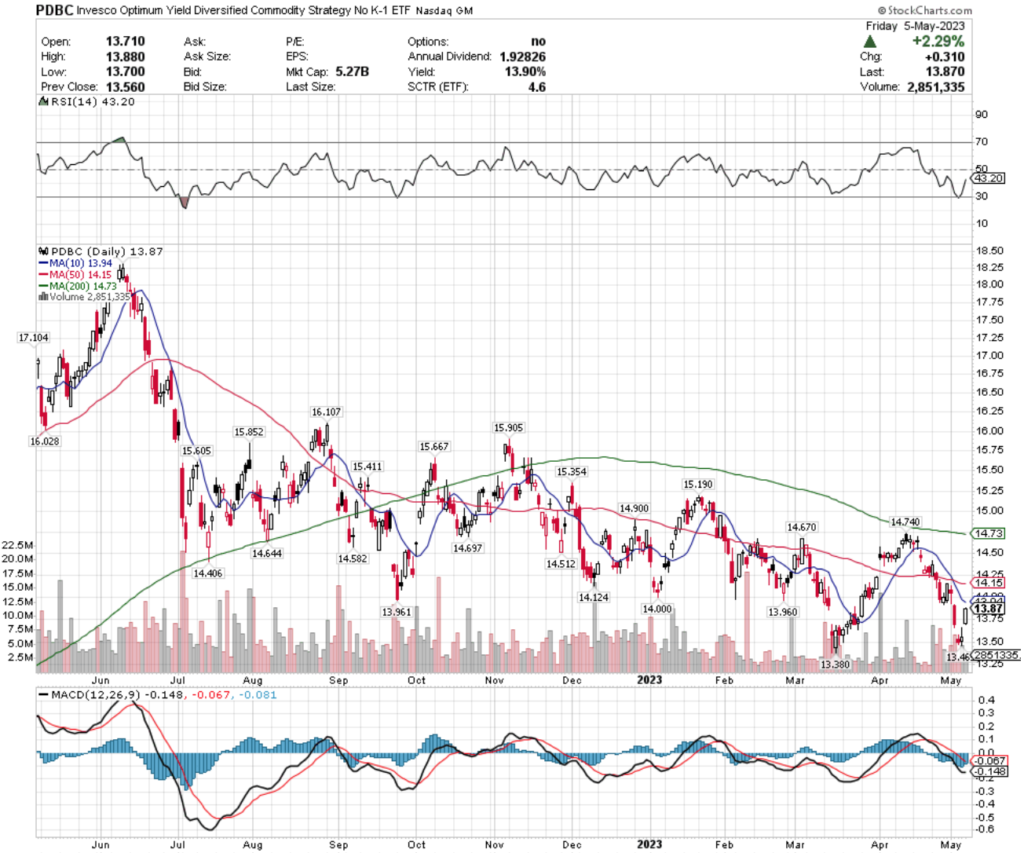
Friday’s +2.29% gap up helped to jolt their RSI from almost oversold levels up to the oversold end of neutral at 43.
Their MACD is beginning to move towards a bullish crossover in the near-term if they are able to maintain any momentum into the new week, but their weaker than average volumes cast doubt on that happening.
PDBC pays a 13.9% distribution year to long-term shareholders, which will provide a cushion against losses until the $11.94/share level, if the shares are held for a year or longer.
However, it would be wisest to wait & see how they behave against their support levels, or else to take a near-term approach with an options strategy while waiting to purchase shares at a less volatile time in the markets.
PDBC has support at the $13.47, $13.38, $13.02 & $11.74/share price levels (using a two year chart), with resistance at $13.94 (10 day moving average), $13.96, $14 & $14.12/share price levels.
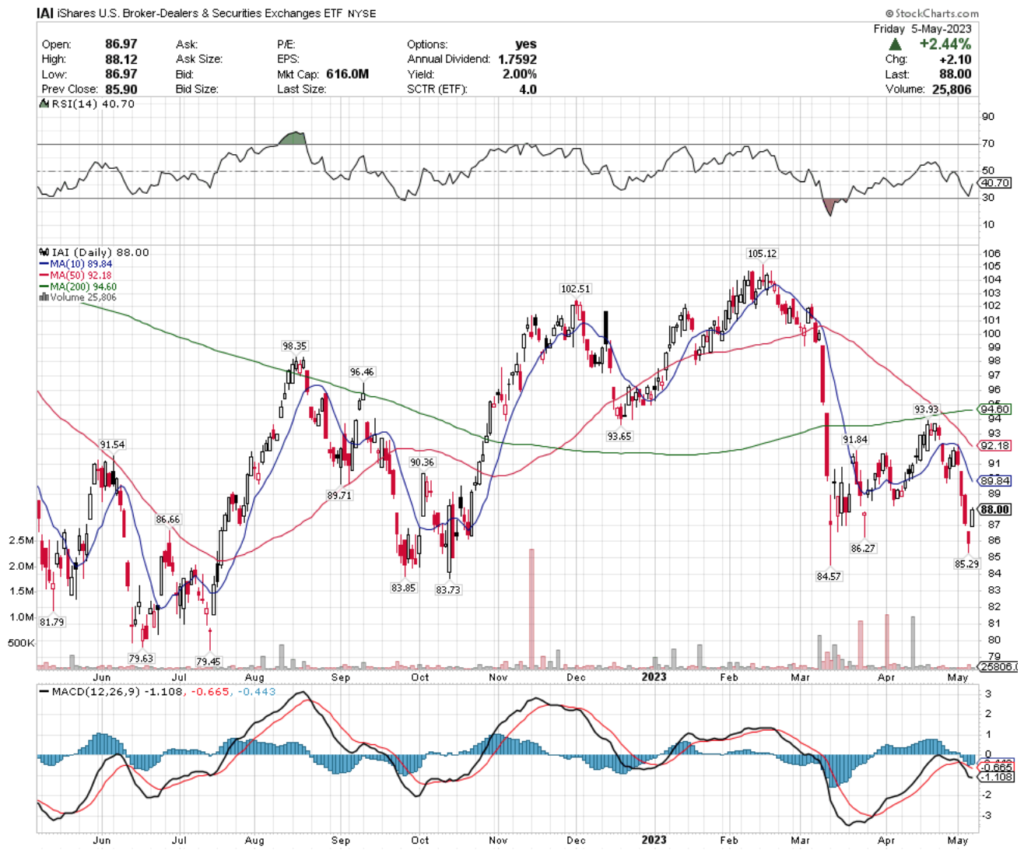
With similar technicals to PDBC, IAI’s RSI also rebounded nicely from near oversold territory to the oversold end of neutral at 40 due to Friday’s +2.44% gap up day.
They also are lacking in volume compared to the year prior, signaling uncertainty in where shareholders value their shares, with a MACD that could bullishly crossover this week, if there is some momentum carried over into the new week from Friday’s price action.
Unfortunately, IAI’s distribution yield for long-term holders is only 2%, providing much less cushion from losses, meaning it is best to play a defensive options strategy now, or wait to see how their support levels hold up in the near-term before entering a position.
IAI has support at the $86.66, $86.27, $85.29 & $84.57/share price limits, with resistance at the $89.71, $89.84 (10 day moving average), $90.36 & $91.54/share price levels.
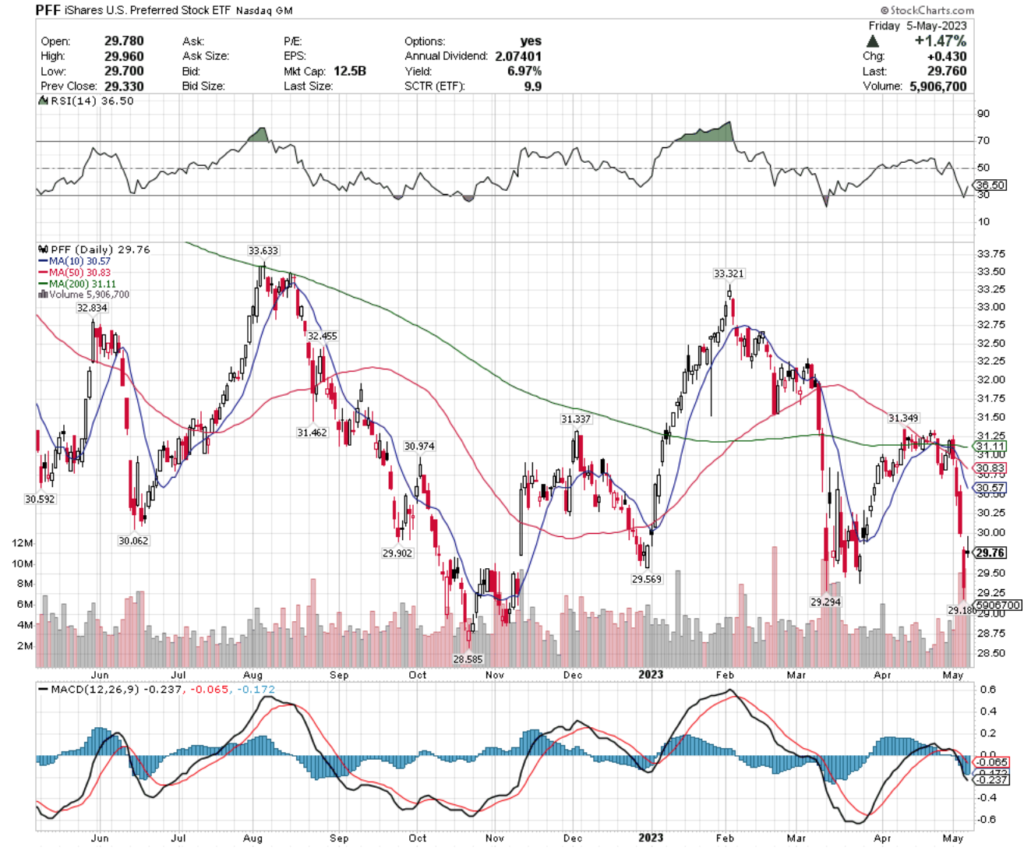
PFF, the iShares U.S. Preferred Stock ETF has shed -4.96% over the past year, falling -15.93% from their 52-week high in August of 2022 & only gaining +4.09% since their 52-week low in October of 2022 (ex-distributions).
The situation for PFF looks a bit more dire than the previous two names.
Their MACD is in bearish freefall, after 5 straight steep declining sessions before Friday’s +1.47% recovery.
Volumes have recently been above average & their RSI is still closer to oversold than neutral, signaling more future losses in the near-term.
PFF does pay a 6.97% distribution yield, which will cover some losses, but a defensive options strategy with a “wait & see” approach to long shares looks best in the near-term while we wait to see how it behaves at its support levels.
PFF has support at the $29.57, $29.29, $29.18 & $28.59/share price levels, with resistance at the $29.90, $30.06, $30.57 (10 day moving average) & $30.83/share (50 day moving average) price levels.
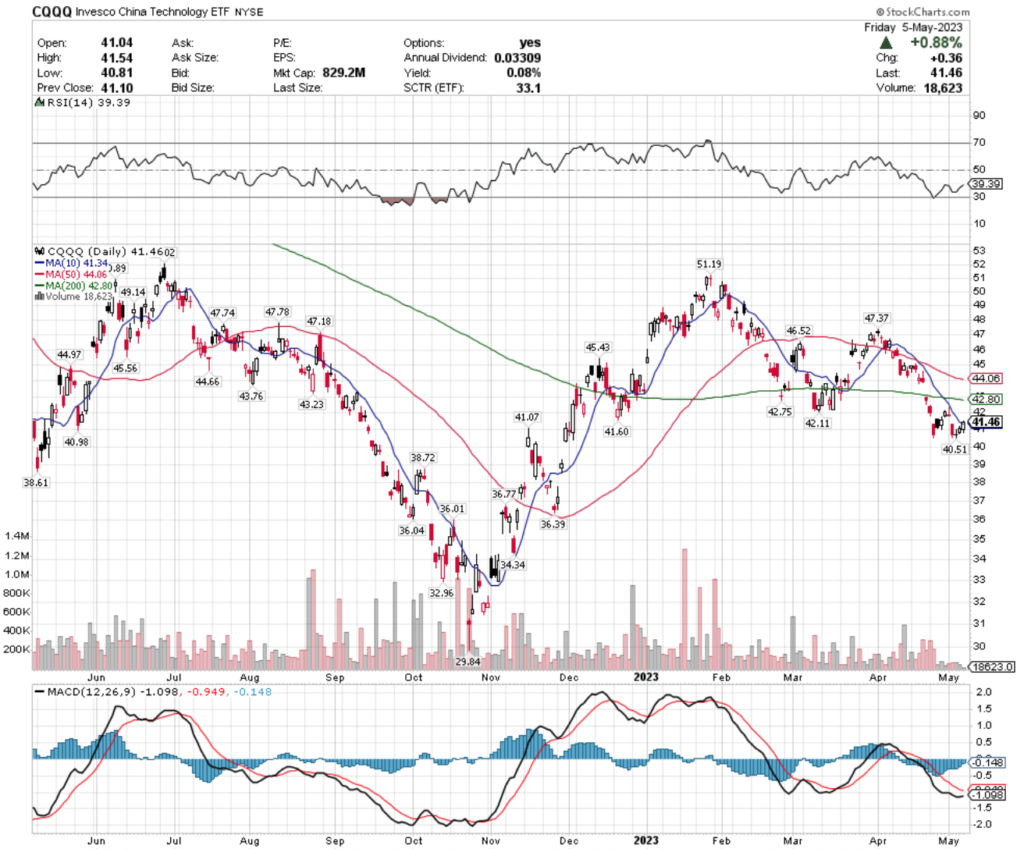
CQQQ, the Invesco China Technology ETF inched forward +2.27% over the past year, however they fell -20.36% from their 52-week high in June of 2022, but have improved +38.85% since their 52-week low in October of 2022 (ex-distributions).
CQQQ is beginning to show signs of an impending bullish MACD crossover, however their recent performance was on extremely light volume compared to the year’s average.
Their RSI is moving back towards the oversold end of neutral, but there appears to be a tough test in the form of a shooting star candle at the top of the window that they are trying to fill.
With such a small 0.08% distribution yield for long-term shareholders, this is another one in the “Wait & see” or trade options defensively around name until we see how its support levels hold up in the near-term.
CQQQ has support at the $41.34 (10 day moving average), $41.07, $40.98 & $40.51/share price levels, with resistance at the $41.60, $42.11, $42.75 & $42.80/share (200 day moving average) price levels.
Tying It All Together
Next week’s data kicks off with Wholesale Inventories reported at 10 am on Monday, followed by Fed Senior Loan Survey data at 2 pm.
We also continue quarterly earnings calls on Monday, featuring Paypal, Cabot, Devon Energy, KKR, Novavax, Six Flags, Skyworks Solutions, Tyson Foods & Western Digital, plus others.
Tuesday the NFIB Optimism Index data is released at 6 am.
AirBnb is the big earnings call on Tuesday, with reports from Affirm Holdings, Aramark, Fisker, FoxCorp, H&R Block, Hostess Brands, Mannkind, Occidental Petroleum, Rackspace Technology, Squarespace, Under Armour, WeWork, Wynn Resorts & more.
Much anticipated Consumer Price Index, Core CPI, CPI Y-o-Y & Core CPI Y-o-Y data will be reported at 8:30 am on Wednesday.
Wednesday’s earnings will feature Disney, Cheesecake Factory, Jazz Pharmaceuticals, Reynolds Consumer Products, Roblox, The Trade Desk, Traeger, Valvoline, Wendy’s, Wolverine World Wide & many other companies.
On Thursday the Producer Price Index, Core PPI, PPI Y-o-Y, Core PPI Y-o-Y, Initial Jobless Claims & Continuing Jobless Claims data are all released at 8:30 am.
Thursday’s earnings calls include CyberArk Software, Dillard’s, JD.com, Krispy Kreme, U.S. Foods, Utz Brands & more.
Friday wraps the week up with Import Price Index & Import Price Index Minus Fuel data at 8:30 am, followed by Consumer Sentiment (preliminary) at 10 am, with Embecta & Spectrum Brands reporting earnings.
See you back here next week!
*** I DO NOT OWN SHARES OR OPTIONS CONTRACT POSITIONS IN SPY, QQQ, IWM, EWI, BETZ, BOTZ, SCHF, PDBC, IAI, PFF, or CQQQ AT THE TIME OF PUBLISHING THIS ARTICLE ***
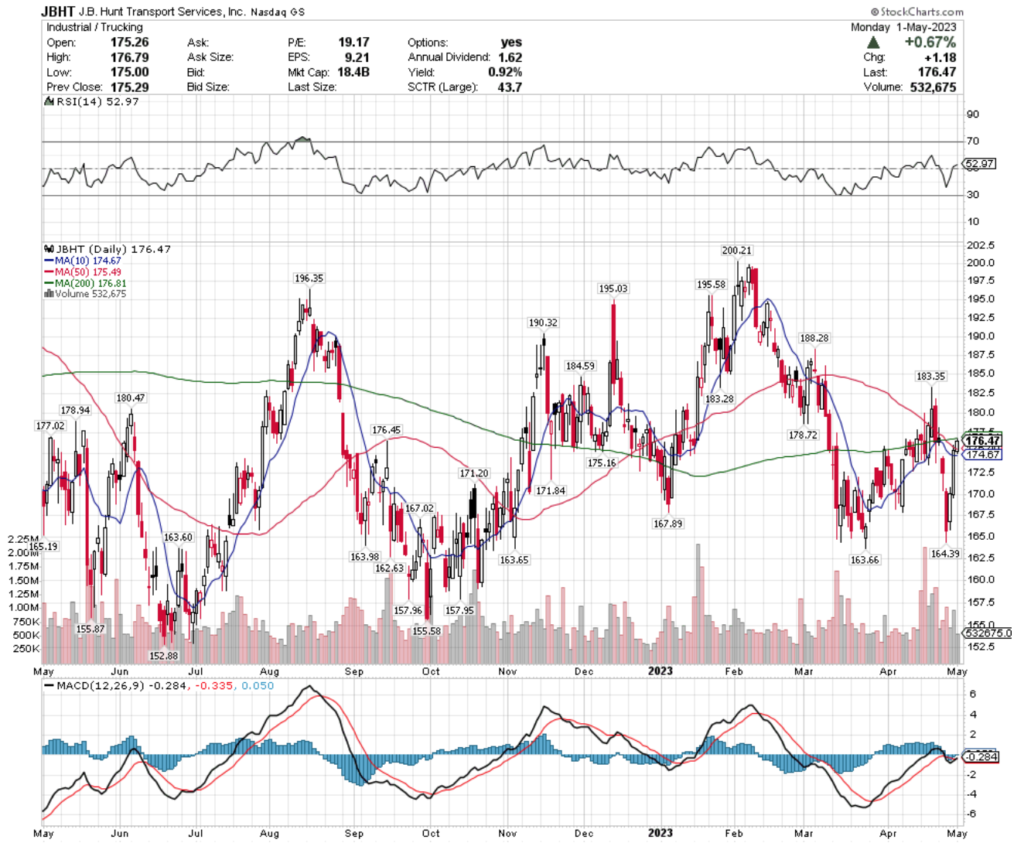
J.B. Hunt Transport Services, Inc. stock trades under the ticker JBHT & has shown recent bullishness that traders & investors should research further into for when market volatility has gone down.
JBHT stock closed at $176.47/share on 5/1/2023.
J.B. Hunt Transport Services, Inc. JBHT Stock’s Technical Performance Broken Down
J.B. Hunt Transport Services, Inc. JBHT Stock’s Technical Performance Over The Past Year
JBHT Stock Price: $176.47
10 Day Moving Average: $174.67
50 Day Moving Average: $175.49
200 Day Moving Average: $176.81
RSI: 52.97
MACD: -0.284
Yesterday, JBHT stock completed a bullish MACD crossover, climbing +0.67% on the day’s session.
Their RSI is neutral & recent trading volumes have been about average compared to the year prior.
Traders & investors should begin to watch how JBHT stock behaves around support levels to begin planning a time to enter a position once market volatility has gone down.
JBHT stock has support at the $176.45, $175.49 (50 day moving average), $175.16 & $174.67/share (10 day moving average), with resistance at the $176.81 (200 day moving average), $177.02, $178.72 & $178.94/share price levels.
J.B. Hunt Transport Services, Inc. JBHT Stock As A Long-Term Investment
Long-term oriented investors will like JBHT stock’s 20.05 P/E (ttm), but may find their 4.83 P/B (mrq) to be a bit too rich.
They recently reported -7.4% Quarterly Revenue Growth Y-o-Y, with -18.7% Quarterly Earnings Growth Y-o-Y, which investors will want to research further into.
Their balance sheet will also require a more thorough analysis, with $52.6M of Total Cash (mrq) & $1.24B of Total Debt (mrq).
JBHT pays a 0.92% dividend, which appears to be sustainable, as their payout ratio is 18.39%.
75.59% of JBHT stock’s outstanding share float is owned by institutional investors.
J.B. Hunt Transport Services, Inc. JBHT Stock As A Short-Term Trade Using Options
Traders with shorter time horizons can trade options to profit from price movements in JBHT stock, while protecting their portfolios from volatility.
I am looking at the contracts with the 5/19 expiration date.
The $175, $170 & $165 call options are all in-the-money, listed from highest to lowest level of open interest.
The $185, $180 & $195 puts are also all in-the-money, with the former being more liquid than the latter strikes.
Tying It All Together
JBHT stock has many interesting characteristics that traders & investors will find appealing.
Investors will like their dividend yield & P/E (ttm), but may want to look deeper into the makeup of their balance sheet.
Traders will like their recent technical performance among market volatility.
All-in-all, it is worth taking a closer look into JBHT stock to see how it fits into your portfolio strategy for when market volatility subsides.
*** I DO NOT OWN SHARES OR OPTIONS CONTRACT POSITIONS IN JBHT STOCK AT THE TIME OF PUBLISHING THIS ARTICLE ***
Last week earnings reports dominated the headlines, along with the continuing news about banks being in financial distress as a solution is worked out.
SPY, the SPDR S&P 500 ETF gained +0.9% over the past week, in a week that started off on a weak foot until Thursday & Friday’s sessions.
SPY ETF – SPDR S&P 500 ETF’s Technical Performance Over The Past Year
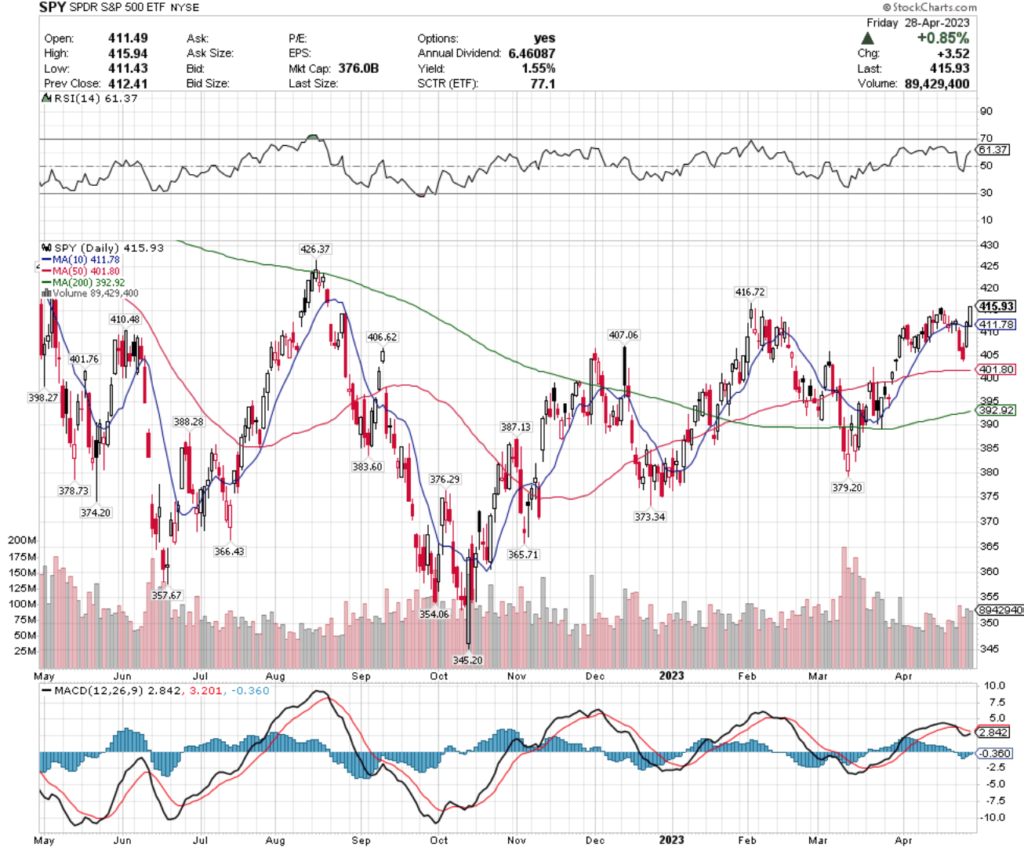
Volumes were more enthusiastic compared to the week prior, returning to about average compared to the year prior.
Their RSI is beginning to show signs of weakness as it approaches overbought conditions, but their MACD is approaching a bullish crossover, which signals there will be some volatility in the coming week.
SPY’s current moving averages, particularly the 10 day moving average are now all in positions to act as support, but they need to re-test the $416.72 resistance level.
SPY has support at the $411.78 (10 day moving average), $410.48, $407.06 & $406.62/share price levels, with resistance at the $416.72, $426.37, $438.53 & $442.12/share price levels.
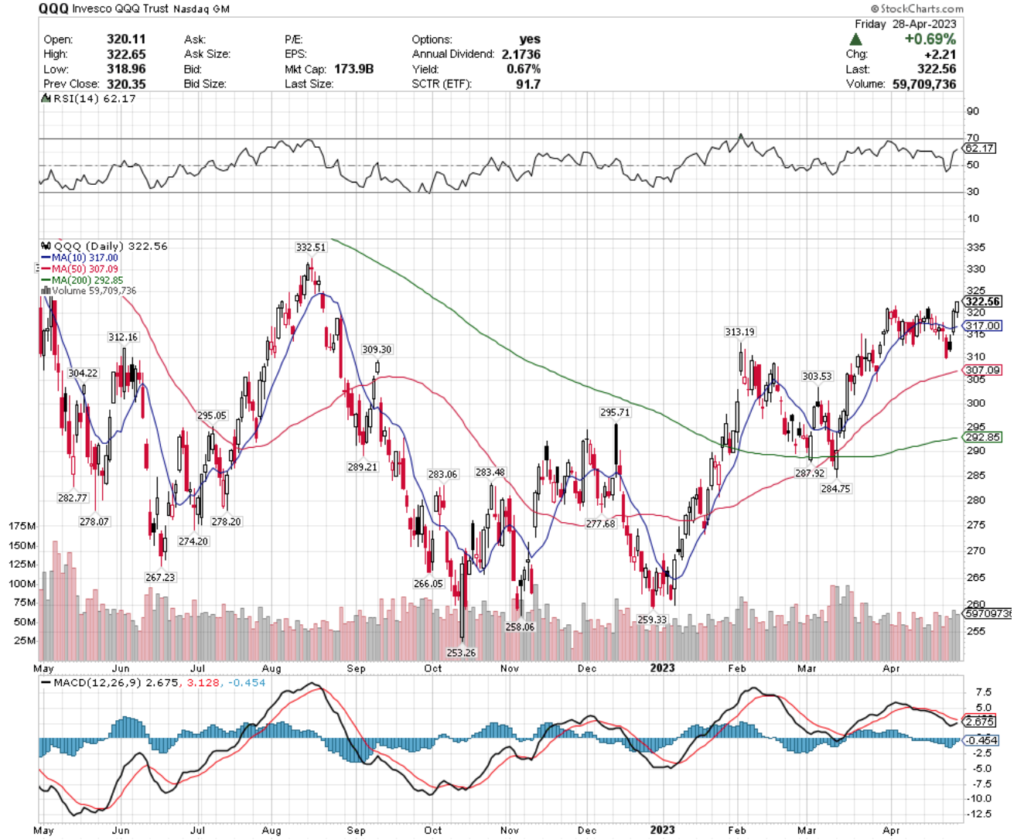
QQQ, the Invesco QQQ Trust ETF improved +1.88% over the past week, faring the best of the indexes, as investors cheered earnings reports & piled into stocks most impacted by interest rates in the week before the next rate announcement.
QQQ ETF – Invesco QQQ Trust ETF’s Technical Performance Over The Past Year
They too have an RSI approaching overbought, while their MACD is turning towards a bullish crossover, confirming the volatility SPY is also showing on the horizon.
Volumes for QQQ were also relatively in-line with average compared to the year prior, but Friday’s candlestick is signaling more uncertainty in the near-term, as it is not a hanging man due to the opening price being too low into the real-body:shadow, but is not entirely signaling bullishness either.
QQQ has support at the $317 (10 day moving average), $313.19, $312.16 & $309.30/share price levels, with resistance at the $331.19, $332.51, $338.56 & $346.78/share price levels.
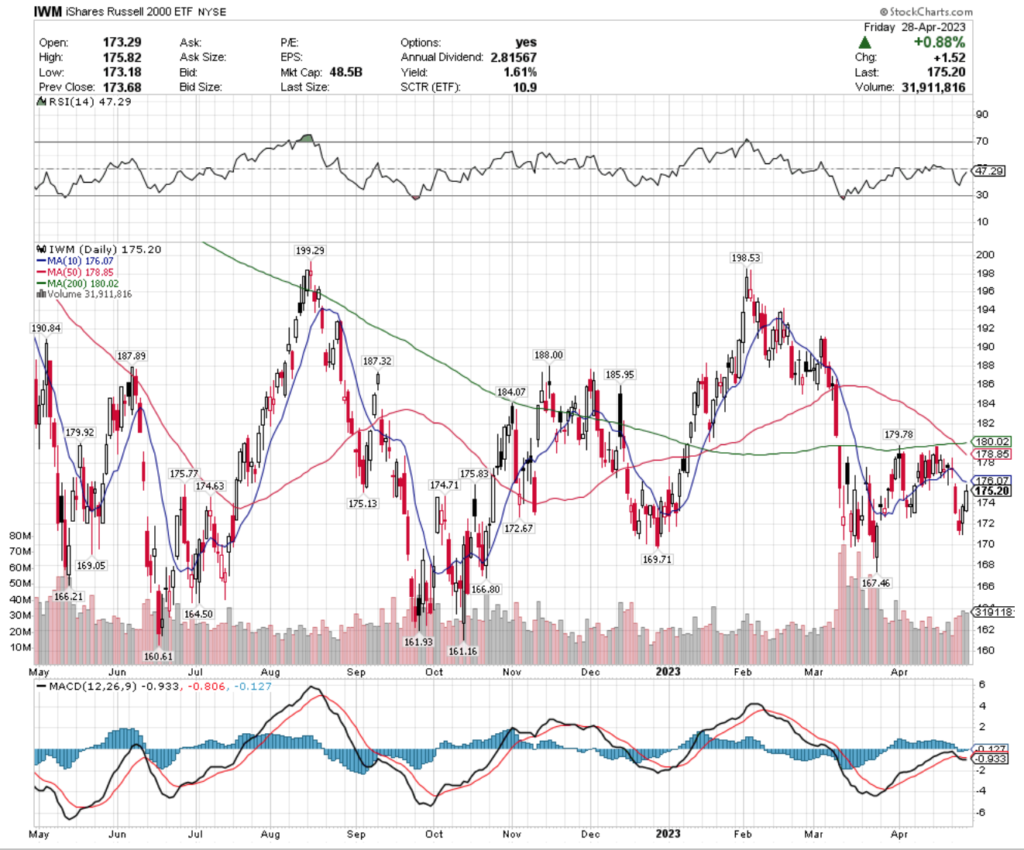
IWM, the iShares Russell 2000 ETF -1.33% 0ver the past week, has investors were moving away from smaller cap stocks & investments in favor of larger S&P 500 names & technology heavy NASDAQ names.
IWM ETF – iShares Russell 2000 ETF’s Technical Performance Over The Past Year
They ended the week trying to strengthen after falling out of a consolidation range earlier in the week, on above average volume compared to the year prior.
Their RSI is neutral, with their MACD fluttering around as Monday’s session will determine whether or not it settles in a bullish or bearish direction.
IWM has support at the $175.13, $174.71, $174.63 & $172.67/share price levels, with resistance at the $175.77, $175.83, $176.07 (10 day moving average) & $178.85/share (50 day moving average) price levels.
Let’s take a look into some of the best & worst performing sectors & geo-locations in the market, based on this week’s technical analysis!
Homebuilders (XHB), Greece (GREK), Indonesia (EIDO) & Emerging Markets Dividend Stocks (EDIV) Are All Bullishly Leading The Market
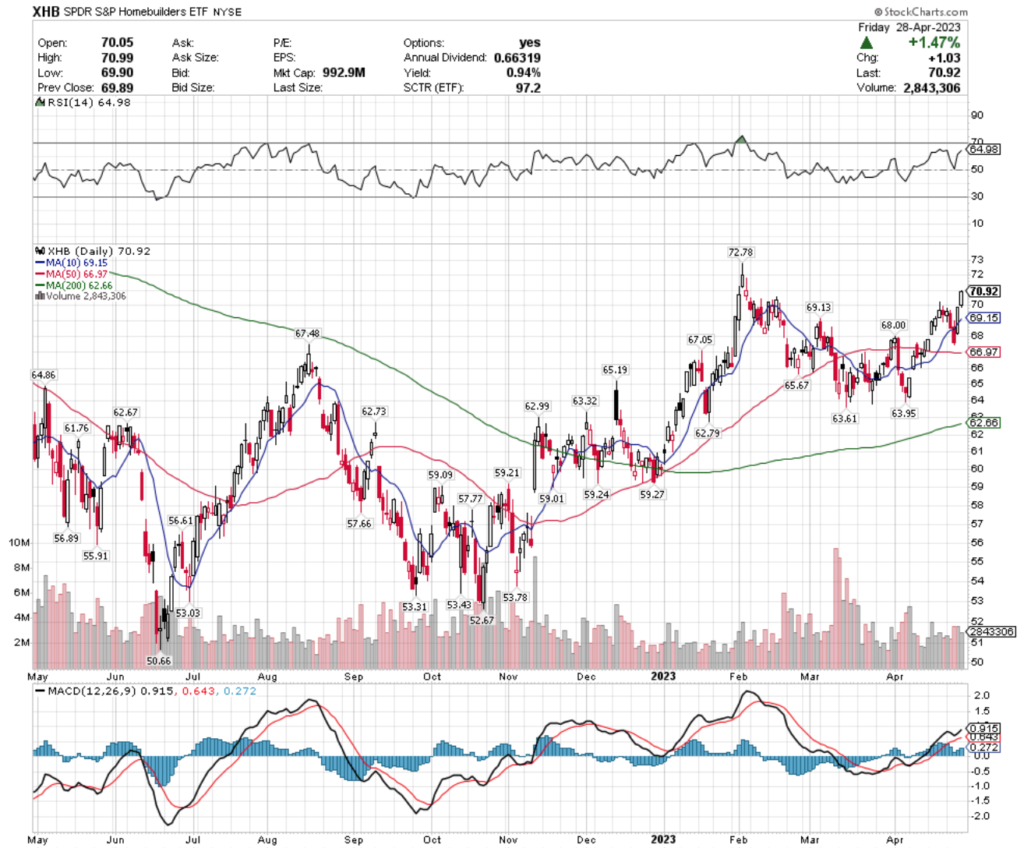
XHB, the SPDR S&P Homebuilders ETF has climbed +14.49% over the past year, gaining +38.43% since their 52 week low in June of 2022 (ex-distributions).
XHB ETF – SPDR S&P Homebuilders ETF’s Technical Performance Over The Past Year
Their RSI is approaching overbought, while their MACD is beginning to look exhausted & in need of a breather.
Last week’s below average volumes also confirm that XHB’s sentiment is waning in the near-term, and their distribution yield pays 0.94% to long-term holders throughout the year, leaving little protection from downside risks.
Investors should wait to see how they perform around support levels in the coming weeks to plan their entry, while employing an options strategy for additional protection & profits.
XHB has support at the $69.15 (10 day moving average), $69.13, $68 & $67.48/share price levels, with resistance at the $72.78, $73.31, $74.13 & $74.45/share price levels.
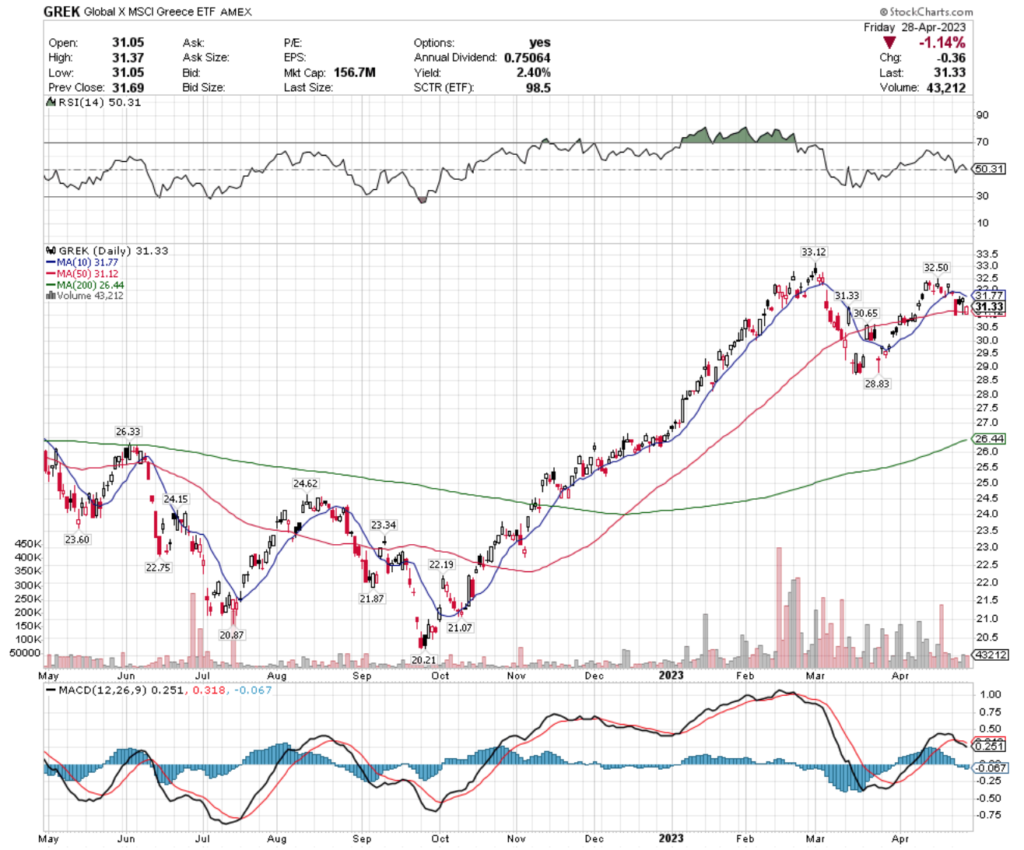
GREK, the Global X MSCI Greece ETF has gained +23.85% over the past year, improving 51.06% from their 52 week low in September of 2022 (ex-distributions).
GREK ETF – Global X MSCI Greece ETF’s Technical Performance Over The Past Year
They’ve already begun to cool off a bit recently throughout the month of March, after a steady near 6-month climb & their RSI is back to neutral.
Their MACD is already bearish, with volumes over the past two months being above average compared to the year prior.
While GREK offers a 2.4% distribution yield over the year to long-term holders, they too look best suited for a wait & see approach for long-term investors, with an options strategy such as selling calls or buying puts in place as well for protection from downside moves.
GREK has support at the $31.12 (50 day moving average), $30.65, $28.83 & $26.44/ share (200 day moving average) price levels, with resistance at the $31.77 (10 day moving average), $32.50 & $33.12/share price levels.
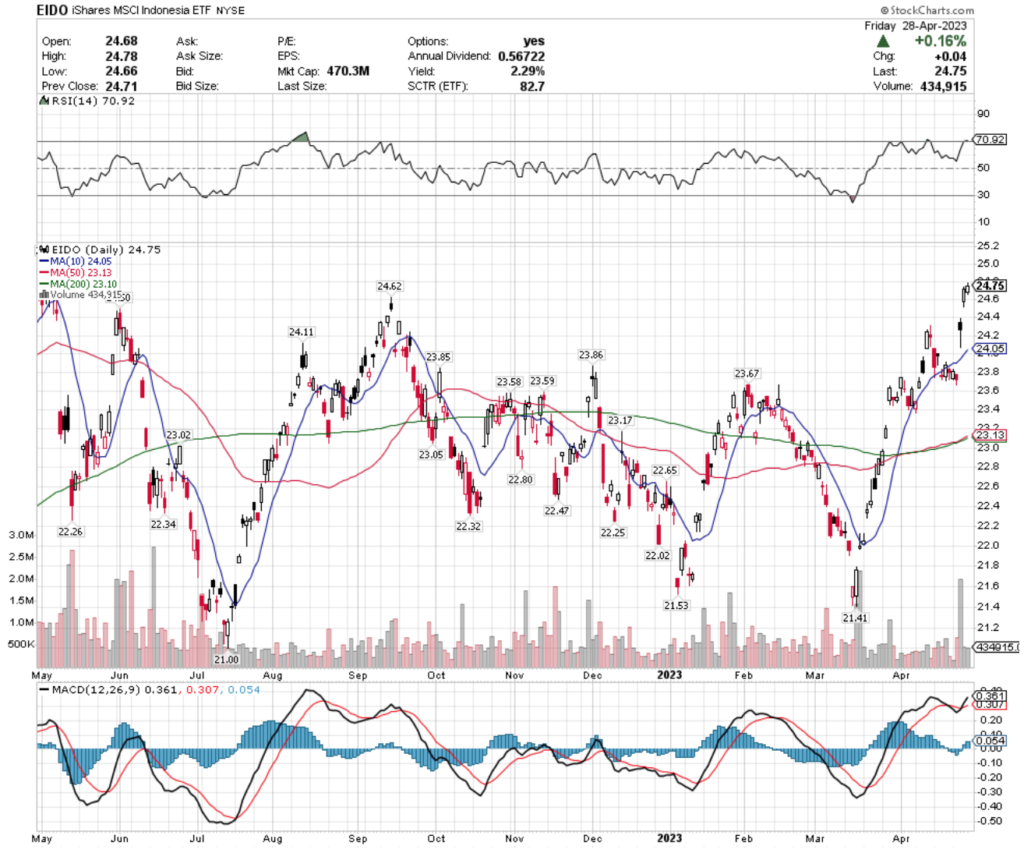
EIDO, the iShares MSCI Indonesia ETF has improved by 0.84% over the past year, while gaining +16.64% since their 52 week low in July of 2022 (ex-distributions).
EIDO ETF – iShares MSCI Indonesia ETF’s Technical Performance Over The Past Year
Their RSI is overbought after a couple of major gap up days last week, with volume only being particularly strong on Wednesday, which was a gap up hanging man candlestick session.
Investors & traders would be wise to see how they behave around the most recent gap, to see if they will go test Wednesday’s candlestick level, as that could avalanche into a closing of the window created by Wednesday’s gap up.
With a 2.29% distribution yield for long-term holders & so many signals of uncertainty, EIDO’s behavior at support levels will be critical in timing an entry to a position in this environment.
EIDO has support at the $24.62, $24.11, $24.05 (10 day moving average) & $23.86/share price levels, with resistance at the $25.01, $25.15, $25.27 & $25.79/share price levels.
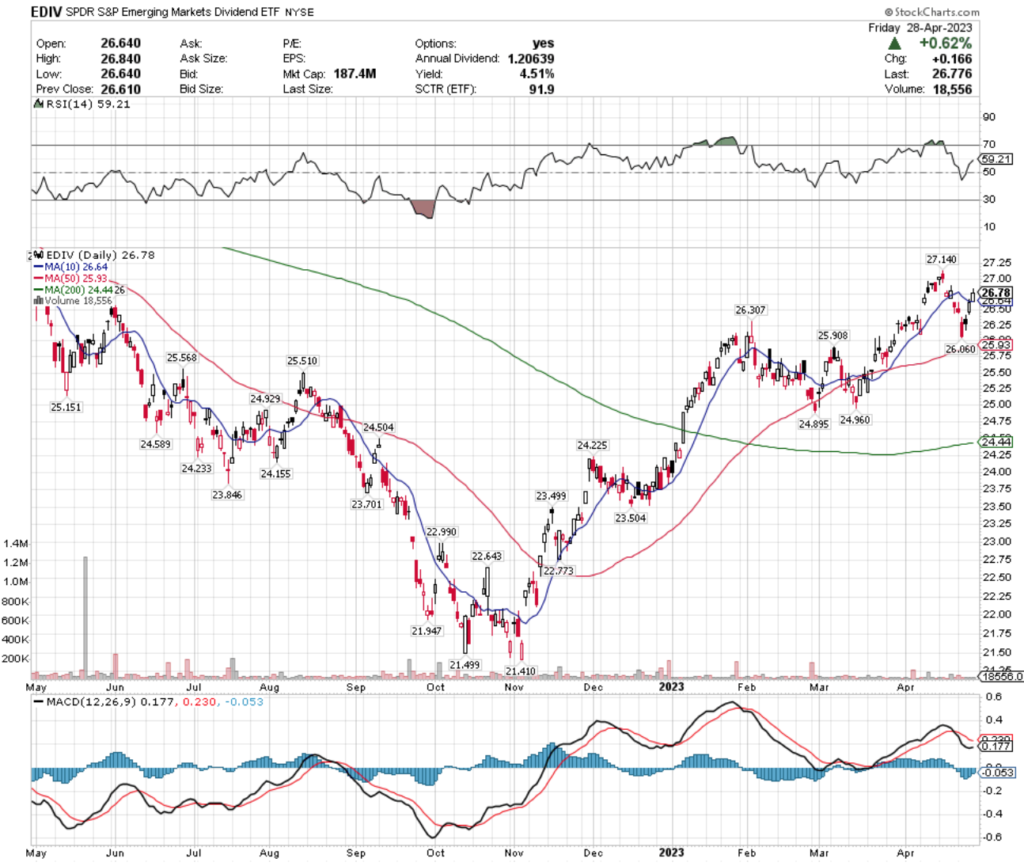
EDIV ETF – SPDR S&P Emerging Markets Dividend ETF’s Technical Performance Over The Past Year
They’re volume tends to be light, with the most recent trading sessions falling below average compared to the year prior & their RSI is on the overbought end of neutral.
While their MACD is bearish, it is beginning to point bearish, mostly due to the gap up day on Thursday of last week.
EDIV pays a 4.51% distribution yield to long-term investors throughout each year, which is a better cushion against losses than many of the other names outlined in this article, but using options for additional protection is advisable in the near-term.
EDIV has support at the $26.64 (10 day moving average), $26.31, $26.01 & $25.93/share (50 day moving average), with resistance at the $26.80, $26.89, $27.14 & $27.76/share price levels.
China Small Cap Stocks (ECNS), Small Cap Momentum Stocks (DWAS), Natural Gas (FCG) & Agribusiness (MOO) Are All Bearishly Lagging The Market
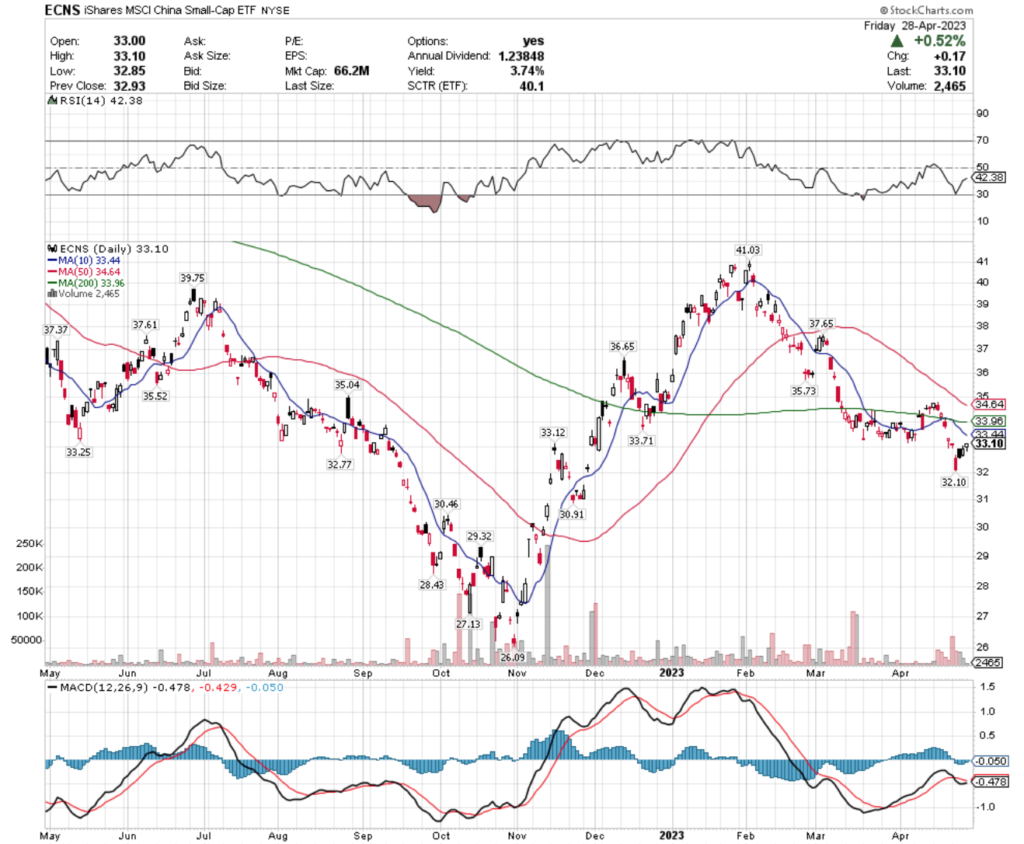
ECNS, the iShares MSCI China Small Cap ETF has fallen -9.03% over the past year, losing -19.33% since their 52 week high in February of 2022, but has rebounded +24.58% since their 52 week low in October of 2022 (ex-distributions).
ECNS ETF – iShares MSCI China Small Cap ETF’s Technical Performance Over The Past Year
Their MACD is about to crossover bullish, but weak volumes compared to the year prior don’t signal much strength in the near-term.
Their RSI is on the oversold end of neutral, with Friday’s session resulting in a hanging man candlestick, implying more volatility to come on the horizon.
With a 3.74% distribution yield paid to long-term holders throughout the year they do have some cushion against losses, but an options strategy for protection while waiting to see how they behave at support levels looks to be the best near-term course of action.
ECNS has support at the $32.77, $32.10, $30.91 & $30.46/share price levels, with resistance at the $33.25, $33.44 (10 day moving average), $33.71 & $33.96/share (200 day moving average) price levels.
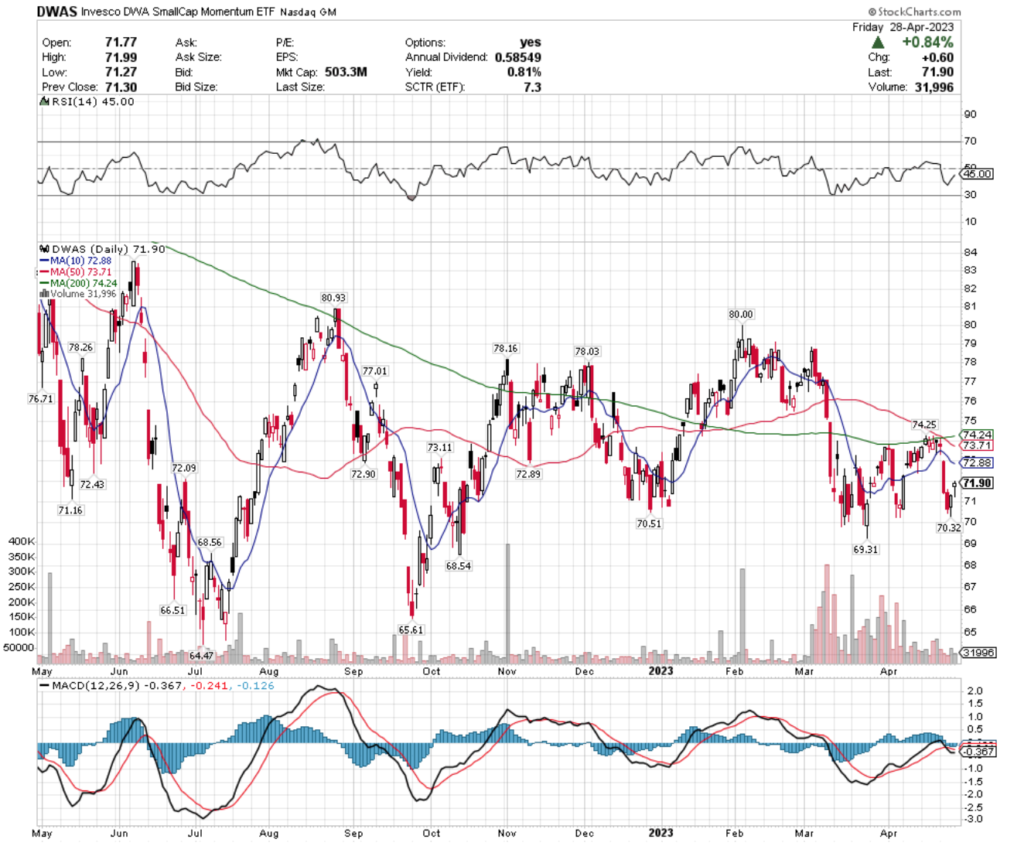
DWAS, the Invesco DWA Small Cap Momentum ETF has lost -8.52% over the past year, falling -14.61% since their 52 week low in June of 2022, but has bounced +10.84% since their 52 week low in July of 2022 (ex-distributions).
DWAS ETF – Invesco DWA Small Cap Momentum ETF’s Technical Performance Over The Past Year
Their RSI is heading back towards neutral after Friday’s gap up following a week of declines, with volumes being about neutral compared to the year prior.
Their MACD is bearish, but hinting at a chance of a near-term bullish crossover, but Friday’s hanging man candlestick signals a dampening of the chances of that.
With a modest 0.81% distribution yield for long-term holders, a protective strategy should be employed, while watching their behavior at support levels.
DWAS has support at the $71.16, $70.51, $70.32 & $69.31/share price levels, with resistance at the $72.09, $72.43, $72.88 (10 day moving average) & $72.89/share price levels.
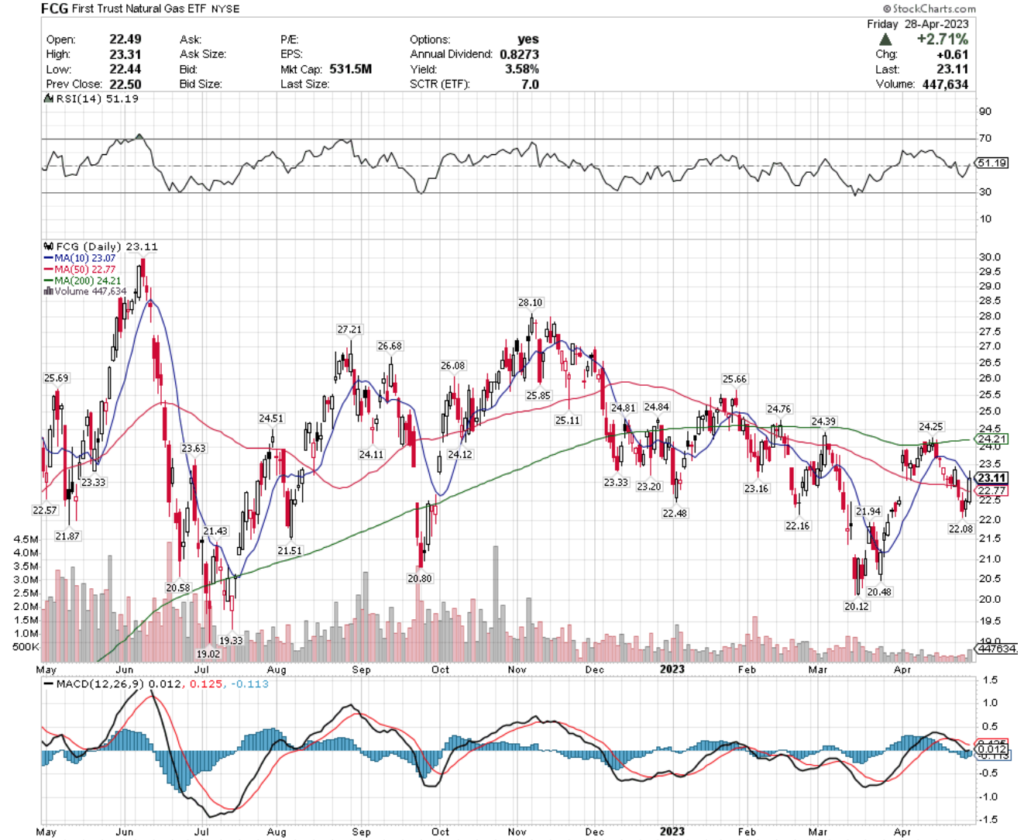
FCG, the First Trust Natural Gas ETF shed -0.65% over the past year, declining -25.62% from their 52 week high in June of 2022, but has rebounded +17.97% from their 52 week low in July of 2022 (ex-distributions).
FCG ETF – First Trust Natural Gas ETF’s Technical Performance Over The Past Year
Their RSI is neutral, with their MACD in a bearish decline on below average volume for the past couple of month’s trading sessions.
With a 3.58% distribution yield they offer some cushion against losses for long-term holders, but based on the indecisiveness behind their recent performance it appears best to wait to see how they behave at support levels in the near-term, with a defensive near-term trading strategy around them for protection & profits while waiting.
FCG has support at the $23.07 (10 day moving average), $22.77 (50 day moving average), $22.57 & $22.48/share price levels, with resistance at the $23.16, $23.20, $23.33 & $23.63/share price level.
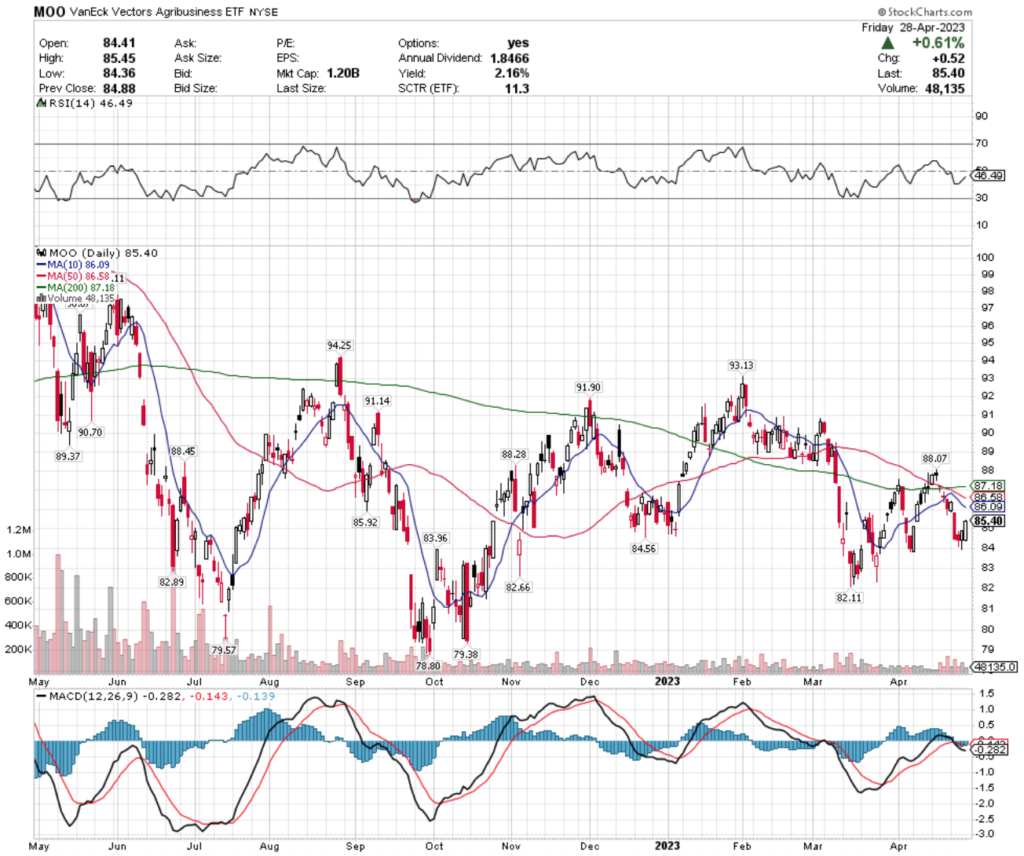
MOO, the VanEck Vectors Agribusiness ETF has lost -11.44% over the past year, losing -16% from their 52 week high in May of 2022, but reclaiming +6.09% since their 52 week low in September of 2022 (ex-distributions).
MOO ETF – VanEck Vectors Agribusiness ETF’s Technical Performance Over The Past Year
Thursday & Friday’s recovery sessions have helped push their RSI back towards neutral, but their MACD is still bearish.
Recent trading volumes have also signaled uncertainty, as they have been below average compared to the year prior, which when paired with their 2.16% distribution yield as a cushion against losses stresses the importance of taking a wait & see defensive approach to MOO.
MOO has support at the $84.56, $83.96, $82.89 & $82.66/share price levels, with resistance overhead at the $85.92, $86.09 (10 day moving average), $86.58 (50 day moving average) & $87.18/share (200 day moving average) price levels.
Tying It All Together
May kicks off with highly anticipated data being released, in addition to quarterly earnings calls continuing.
Monday at 9:45 am the S&P US Manufacturing PMI data will be released, followed by ISM Manufacturing & Construction Spending data at 10 am.
Tuesday we get U.S. Job Openings data reported & Factory Orders data at 10 am, with the m0st anticipated data release being Advanced Micro Devices & Pfizer’s earnings calls.
Other earnings being reported on Tuesday include ADT, BP, Cheniere Energy, Chesapeake Energy, Clorox, Cummins, DuPont, Ford Motor Company, Illinois Tool Works, Marriott, Molson Coors Brewing, Prudential, Simon Property Group, Starbucks, Sunoco, T. Rowe Price, Thomason Reuters, Uber Technologies & Western Union, with many more.
Wednesday will be very interesting, with ADP Employment data kicking off the dat at 8:15 am, S&P U.S. Services PMI data at 9:45 am, ISM Services data reported at 10 am & the highly anticipated Federal Reserve Interest Rate Statement at 2 pm & Fed Chair Powell’s Press Conference at 2:30 pm.
Albermarle, Allstate, Clean Harbors, Fresh Del Monte, Garmin, Hanesbrands, Kraft Heinz, Marathon Oil, MetLife, Phillips 66, Scotts Miracle Grow, Trip Advisor, Wingstop & Yum! Brands are some of Wednesday’s earnings reports.
Thursday morning at 8:30 am we hear U.S. Productivity, U.S. Trade Deficit, Initial Jobless Claims & Continuing Jobless claims data to start off the day.
Apple’s earnings call is Thursday, as well as American International Group, Anheuser-Busch InBev, Ball Corp., Block, ConocoPhillips, DISH Network, DraftKings, DropBox, Ferrari, GoDaddy, Huntington Ingalls, Hyatt Hotels, Kellogg, Lyft, Moderna, Monster Beverage, Peloton Interactive, Shake Shack, Starwood Property Trust, Wayfair, XPO, Yelp & more.
Friday winds down with the U.S. Employment Report, U.S. Unemployment Rate, U.S. Hourly Wages & Hour Wages Year Over Year reported at 8:30 am & Consumer Credit data coming in at 3pm.
Friday’s earnings reports include AMC Entertainment, CBOE Global Markets, Dominion Energy, Goodyear Tire, Johnson Controls, The Cigna Group & more.
See you back here next week!
*** I DO NOT OWN SHARES OR OPTIONS CONTRACT POSITIONS IN SPY, QQQ, IWM, XHB, GREK, EIDO, EDIV, ECNS, DWAS, FCG or MOO AT THE TIME OF PUBLISHING THIS ARTICLE ***
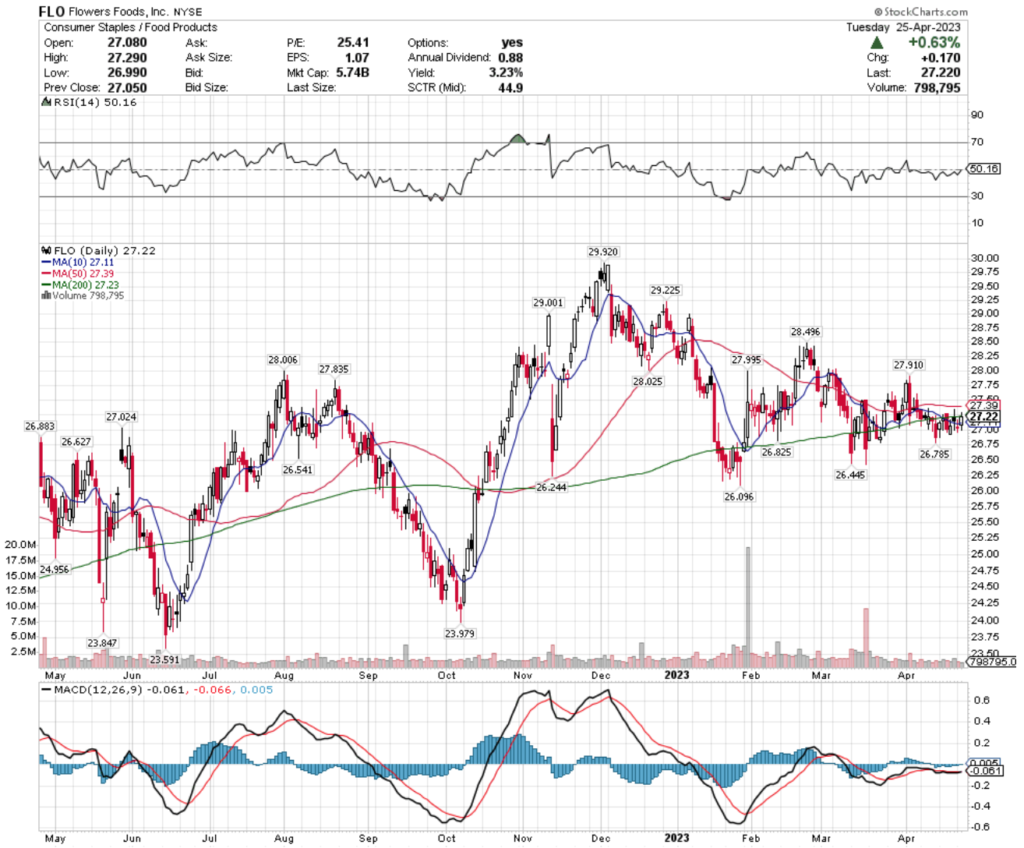
Flowers Foods, Inc. stock trades under the ticker FLO & has shown recent bullishness amidst market volatility that investors & traders should research further into for when volatility has subsided.
FLO stock closed at $27.22/share on 4/25/2023.
Flowers Foods, Inc. FLO Stock’s Technical Performance Broken Down
Flowers Foods, Inc. FLO Stock’s Technical Performance Over The Past Year
FLO Stock Price: $27.22
10 Day Moving Average: $27.11
50 Day Moving Average: $27.39
200 Day Moving Average: $27.23
RSI: 50.16
MACD: -0.061
Yesterday, FLO stock completed a bullish crossover, gaining +0.63% on the day’s session.
Their RSI is neutral & recent trading volumes have been below average compared to the year prior, signaling indecision on the part of investors in terms of where to value their share price.
Their stock price has remained in a consolidation area for the past month, as the market tries to figure out where their fair value is.
FLO has support at the $27.11 (10 day moving average), $27.02 & $26.88/share price levels, with resistance at the $27.39 (50 day moving average), $27.84 & $27.91/share price levels.
Flowers Foods, Inc. FLO Stock As A Long-Term Investment
Long-term oriented investors will like FLO stock’s 25.43 P/E (ttm), but may find their 3.99 P/B (mrq) to be a bit too rich.
They recently reported 10.10% Quarterly Revenue Growth Y-o-Y, with 23.6% Quarterly Earnings Growth Y-o-Y.
Their balance sheet is worth taking a closer look into, with $165.13M of Total Cash (mrq) & $1.19B of Total Debt (mrq).
FLO stock pays a 3.22% dividend, which may not be sustainable in the long-run, as their payout ratio is 81.31%.
84.31% of FLO stock’s outstanding share float is owned by institutional investors.
Flowers Foods, Inc. FLO Stock As A Short-Term Trade Using Options
Traders with shorter time horizons can trade options to profit from FLO stock’s price movements, while protecting their portfolios from volatility.
I am looking at the contracts with the 7/21 expiration date.
The $25 & $22.50 call options are in-the-money, with the former being more liquid than the latter strike price.
The $30 puts are also in-the-money, but there is open interest at $25, $22.50 & $20 should their share price fall in the meantime, which could make these appealing down the line.
Tying It All Together
FLO stock has many interesting attributes that traders & investors will find appealing.
Investors will like their P/E (ttm), but may want to look closer into their balance sheet to see if it provides clues as to how sustainable their dividend yield is in the long-run.
Traders will like their recent technical performance compared to the market, but will dislike how illiquid their options are.
Overall, it is worth taking a closer look to see how FLO stock fits into your portfolio strategy for when market volatility has subsided.
*** I DO NOT OWN SHARES OR OPTIONS CONTRACT POSITIONS IN FLO STOCK AT THE TIME OF PUBLISHING THIS ARTICLE ***
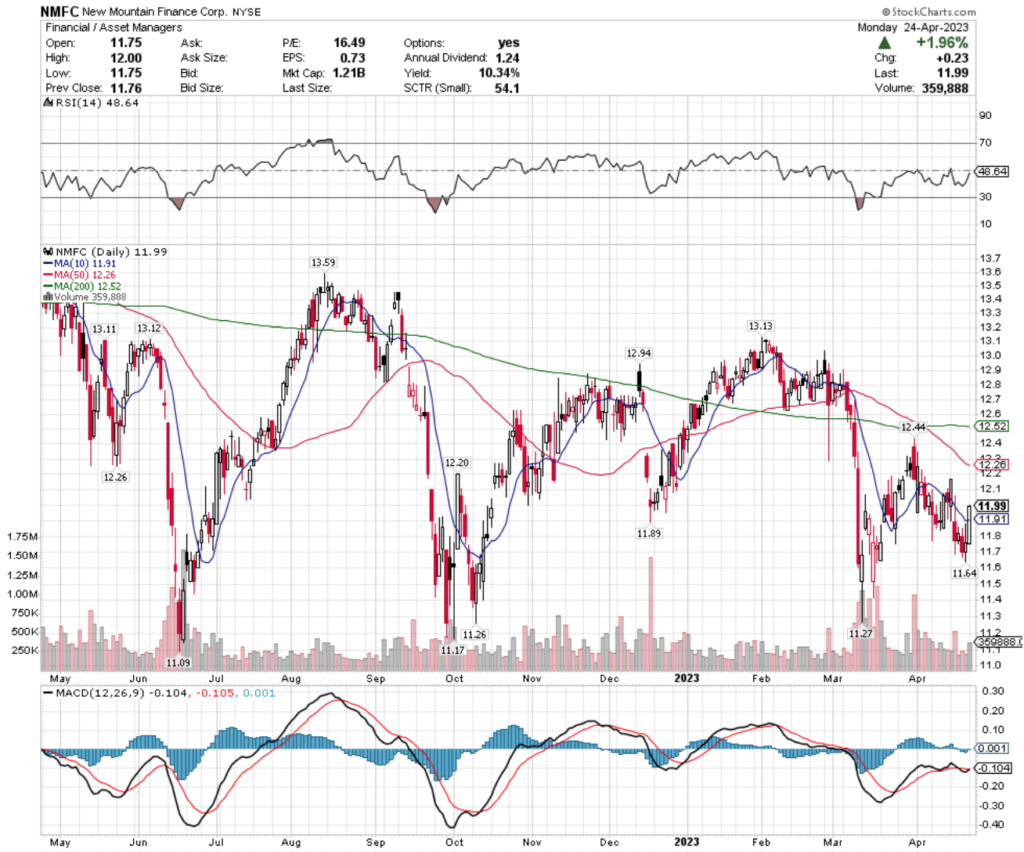
New Mountain Finance Corporation stock trades under the ticker NMFC & has shown recent bullishness that traders & investors should research further into for when market volatility has cooled off.
NMFC stock closed at $11.99/share on 4/24/2023.
New Mountain Finance Corporation (NMFC) Stock’s Technical Performance Broken Down
New Mountain Finance Corporation (NMFC) Stock’s Technical Performance Over The Past Year
NMFC Stock Price: $11.99
10 Day Moving Average: $11.91
50 Day Moving Average: $12.26
200 Day Moving Average: $12.52
RSI: 48.64
MACD: -0.104
Yesterday, NMFC stock completed a bullish MACD crossover, climbing 1.96% on the day’s session.
Recent trading volumes have been above average compared to the year prior & their RSI is neutral, as prices have been declining for the better part of the last two months & investors try to assess a proper valuation on their share price.
Due to broader market volatility in the coming weeks, it is wisest to watch how NMFC stock behaves around its support levels while planning a proper entry for a less volatile market environment.
NMFC has support at the $11.91, $11.89, $11.64 & $11.27/share price levels, with resistance at the $12.20, $12.26 (50 day moving average), $12.44 & $12.52/share (50 day moving average) price levels.
New Mountain Finance Corporation (NMFC) Stock As A Long-Term Investment
Long-term oriented investors will like NMFC stock’s valuation metrics, with a 16.05 P/E (ttm) & a 0.91 P/B (mrq).
They recently reported 8.6% Quarterly Revenue Growth Y-o-Y, with -71.5% Quarterly Earnings Growth Y-0-Y.
Their balance sheet will require a more thorough review, with $71.19M of Total Cash (mrq) & $1.98B of Total Debt (mrq).
NMFC stock pays a 10.37% dividend yield, which does not look sustainable in the long-run, as their payout ratio is >100.
44.24% of NMFC stock’s outstanding share float is owned by institutional investors.
New Mountain Finance Corporation (NMFC) Stock As A Short-Term Trade Using Options
Traders with shorter time horizons can trade options to profit from NMFC stock’s price movements, while protecting their portfolios from volatility.
I am looking at the contracts with the 5/19 expiration date.
There are no call options with open interest that are in-the-money, but there is open interest at the $12.50 strike price, 4% out-of-the-money.
The $12.50 puts are the only strike price with liquidity that is in-the-money.
Tying It All Together
NMFC stock has many interesting attributes that traders & investors will find appealing for when market volatility has subsided.
Investors will like their valuation metrics, but may want to look into their balance sheet & how sustainable their dividend is in the long-run.
Traders will like their recent technical performance, but will be disappointed by how liquid their options are.
Overall, it is worth taking a closer look into NMFC stock to see how it fits into your portfolio strategy.
*** I DO NOT OWN SHARES OR OPTIONS CONTRACT POSITIONS IN NMFC STOCK AT THE TIME OF PUBLISHING THIS ARTICLE ***
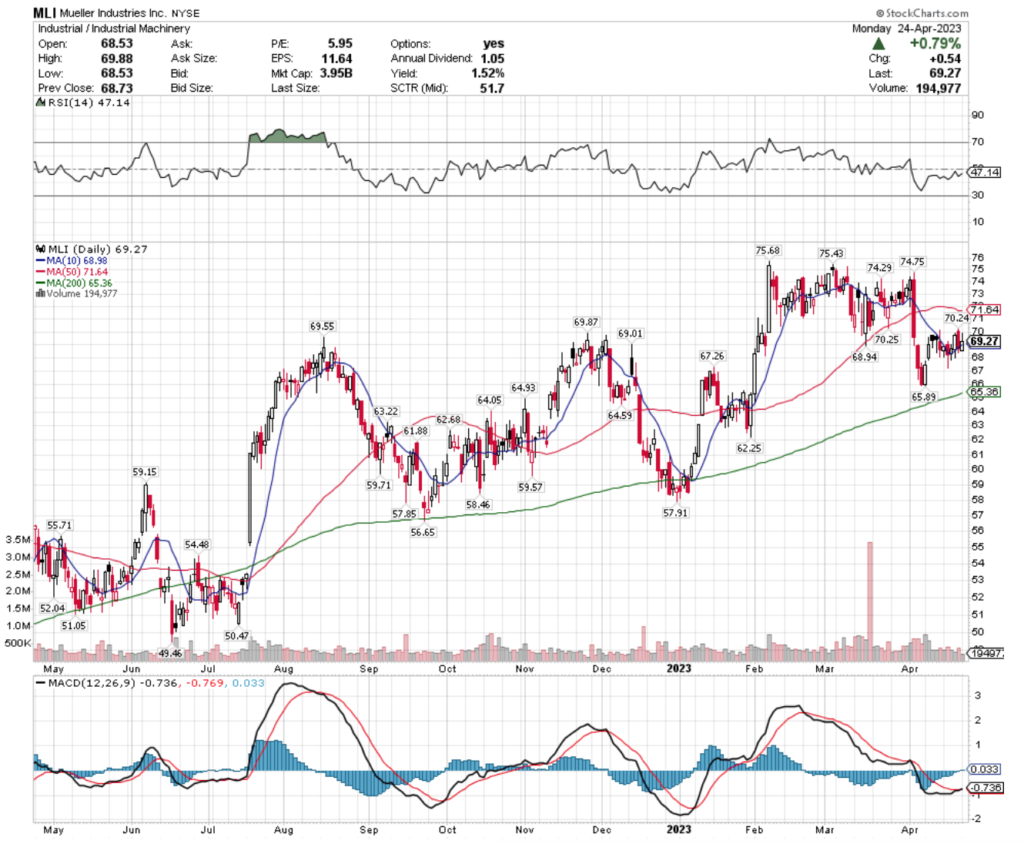
Mueller Industries Inc. stock trades under the ticker MLI & has shown recent bullishness that traders & investors should look into for when market volatility has cooled down.
MLI stock closed at $69.27/share on 4/24/2023.
Mueller Industries Inc. MLI Stock’s Technical Performance Broken Down
Mueller Industries Inc. MLI Stock’s Technical Performance Over The Past Year
MLI Stock Price: $69.27
10 Day Moving Average: $68.98
50 Day Moving Average: $71.64
200 Day Moving Average: $65.36
RSI: 47.14
MACD: -0.736
Yesterday, MLI stock completed a bullish MACD crossover, gaining +0.79% on the day’s session.
Recent trading volumes have been about average compared to the year prior & their RSI is neutral, as they have spent the better part of April consolidating in the $68-70/share range.
As markets are expected to remain volatile for the coming weeks, it would be wise to watch how MLI behaves around its support levels, so that a target entry level can be identified for smoother markets.
MLI has support at the $69.01, $68.98 (10 day moving average), $68.94 & $67.26/share price levels, with resistance at the $69.55, $69.87, $70.24 & $70.25/share price levels.
Mueller Industries Inc. MLI Stock As A Long-Term Investment
Long-term oriented investors will like MLI stock’s 5.93 P/E (ttm), as well as their 2.2 P/B (mrq).
They recently reported -8.2% Quarterly Revenue Growth Y-o-Y, with 10.6% Quarterly Earnings Growth Y-o-Y.
Their balance sheet looks appealing, with $678.88M of Total Cash (mrq) & $23.85M of Total Debt (mrq).
MLI pays a 1.45% dividend, which appears to be sustainable in the long-run, as their payout ratio is 8.59%.
92.27% of MLI stock’s outstanding share float is owned by institutional investors.
Mueller Industries Inc. MLI Stock As A Short-Term Trade Using Options
Traders with shorter time horizons can trade options to profit from movements in MLI stock’s price, while protecting their portfolios from volatility.
I am looking at the contracts with the 5/19 expiration date.
The $60 & $65 call options are in-the-money, with the former being more liquid than the latter strike price.
The $70, $75 & $80 puts are also in-the-money, listed from highest to lowest level of open interest.
Tying It All Together
MLI stock has many interesting characteristics that traders & investors will find appealing.
Investors will like their dividend yield, balance sheet & valuation metrics.
Traders will like their recent technical performance, but may wish their options were more liquid.
All-in-all, it is worth taking a closer look into MLI stock to see how it fits into your portfolio strategy once market volatility subsides.
*** I DO NOT OWN SHARES OR OPTIONS CONTRACT POSITIONS IN MLI STOCK AT THE TIME OF PUBLISHING THIS ARTICLE ***
SPY, the SPDR S&P 500 ETF closed the week mostly flat, falling -0.06%, as we began receiving more earnings data from companies, while hearing a number of Federal Reserve speakers throughout the week.
SPY ETF – SPDR S&P 500 ETF’s Technical Performance Over The Past Year
Their MACD is about to bearishly crossover, which looks particularly troubling, as with an RSI of 60 (overbought end of neutral), there is more room to fall before algorithms will be tripped into buying again.
Volume in April has been lower than March, but relatively average compared to the rest of the year prior, and last week’s assortment of candlesticks show a rejection of the $415 price level, followed by uncertainty floating between $410-$415/share.
SPY has support at the $411.97 (10 day moving average), $410.48, $407.06 & $406.62/share price levels, with resistance at the $415.72, $416.72, $426.37 & $438.52/share price levels.
QQQ, the Invesco QQQ Trust ETF fared a bit worse than SPY, dropping -0.62% during the course of last week, as investors moved away from the technology-heavy index.
QQQ ETF – Invesco QQQ Trust ETF’s Technical Performance Over The Past Year
Their MACD has already completed a bearish crossover in April, as they’ve hovered around a consolidation range for most of the month, with their RSI at 56.
Volumes have been about average/just below average compared to the year prior throughout that time & Friday’s hanging man candle after Thursday’s shooting star candlestick signals more uncertainty & consolidation are on the horizon.
QQQ has support at the $313.19, $312.16, $309.30 & $305.86/share (50 day moving average) price levels, with resistance at the $317.38, $321.63, $331.19 & $332.51/share price levels.
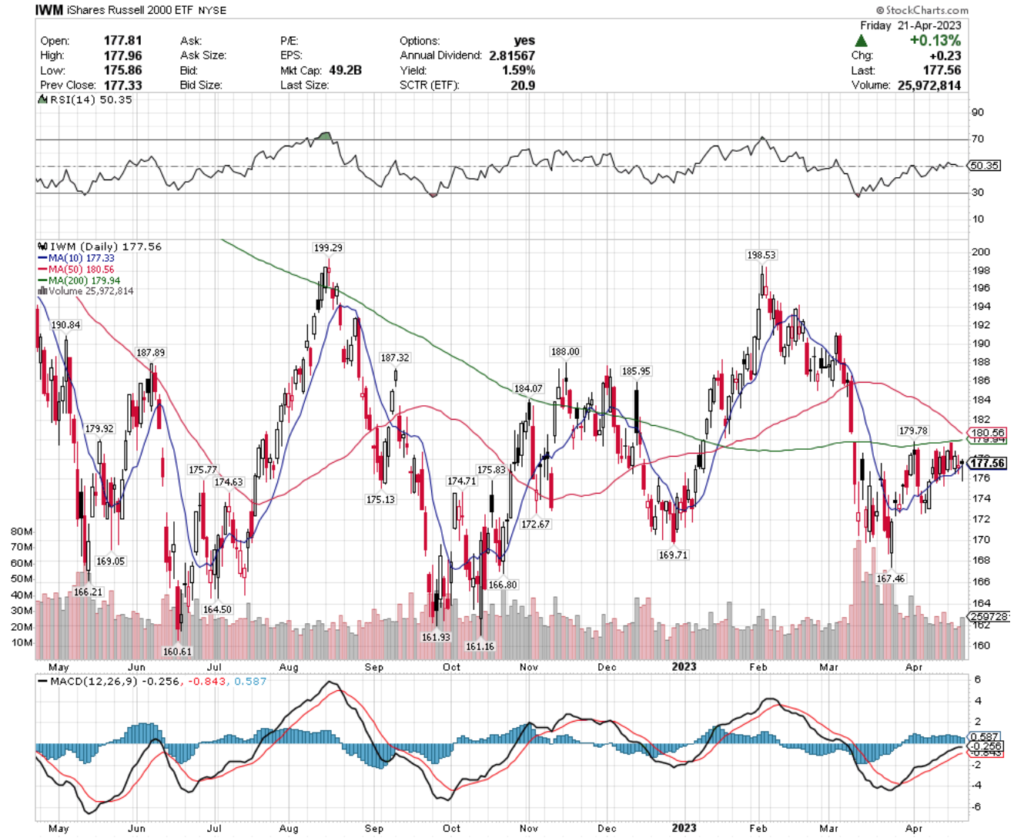
IWM, the iShares Russell 2000 ETF proved small caps were the haven of choice this week among market participants, gaining +0.59% over the course of the week.
IWM ETF – iShares Russell 2000 ETF’s Technical Performance Over The Past Year
Their RSI is neutral at 50, and their MACD is beginning to show signs of a near-term bearish crossover on the horizon in the next couple of trading sessions.
Volumes have settled down relative to March’s above average volume & are still about average compared to the year prior.
Much like SPY & QQQ, IWM has been in a consolidation range for the month of April so far, with Thursday & Friday’s candlesticks looking very similar to their larger index counterparts’ as well.
IWM has support at the $177.33 (10 day moving average), $175.83, $175.77 & $175.13/share price levels, with resistance overhead at the $179.78, $179.92, $179.94 (200 day moving average) & $180.56/share (50 day moving average) price levels.
Let’s dive into some of the best & worst sectors & geo-locations in the market based on this week’s technical analysis ratings for their respective ETF’s!
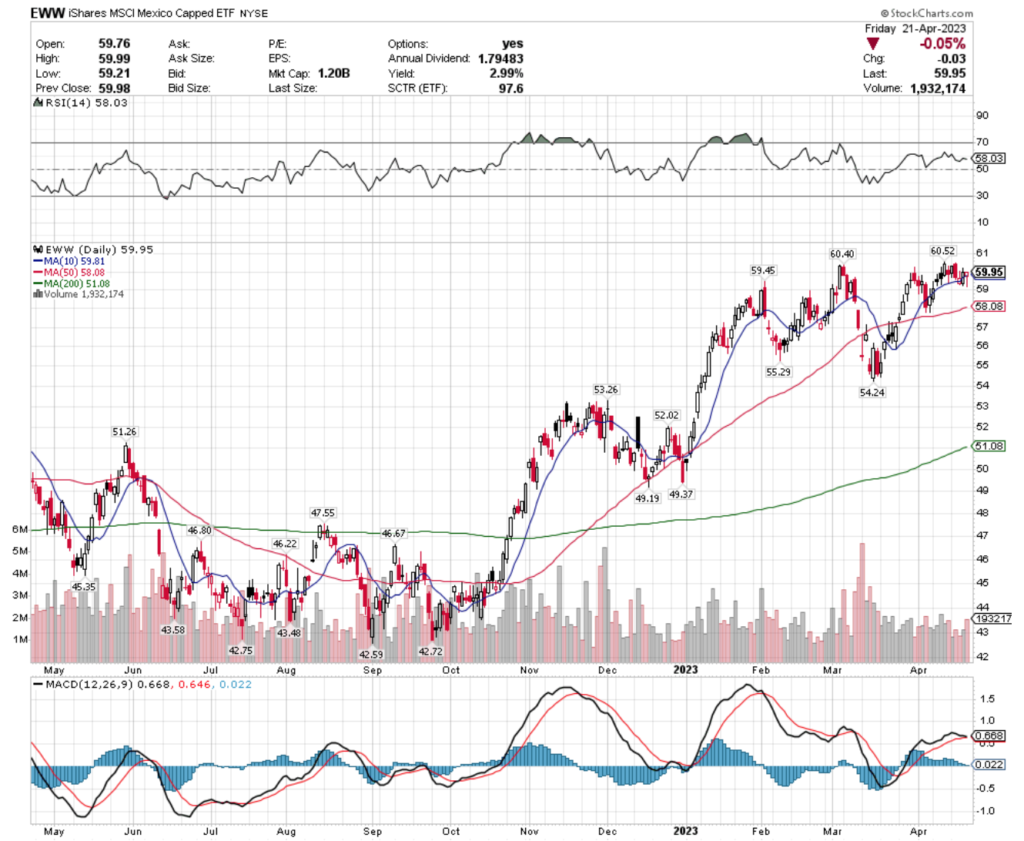
Mexico (EWW), Switzerland (EWL), Semiconductors (SMH) & European SmallCap Dividend Investments (DFE) Are All Bullishly Leading The Market
EWW, the iShares MSCI Mexico Capped ETF has gained +20.64% over the past year, climbing +37.34% from their 52 week low in September of 2022 (ex-distributions).
EWW ETF – iShares MSCI Mexico Capped ETF’s Technical Performance Over The Past Year
Their MACD is beginning to send signals of an impending cool off period, which is further supported by Friday’s hanging man candlestick.
Their RSI is on the oversold end of neutral at 58, with recent volumes being a bit lower than average compared to the year prior, signaling slowing enthusiasm in the near-term.
EWW pays a 2.99% distribution to long-term holders, which can provide some protection from a downfall, but otherwise it would be wisest to use an options strategy for protection (selling calls/buying puts), while eying its behavior at support levels in the coming weeks.
EWW has support at the $59.81 (10 day moving average), $59.45, $58.08 (50 day moving average) & $55.29/share price levels, with resistance at the $60.40 & $60.52/share price levels.
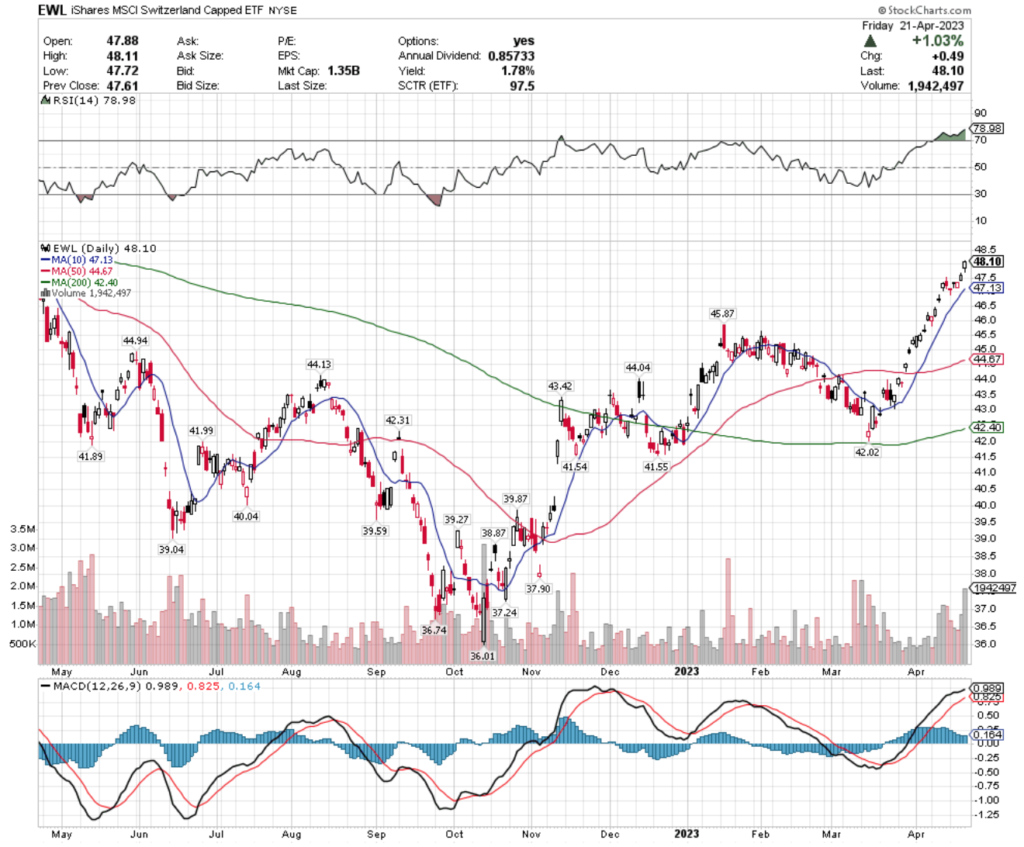
EWL ETF – iShares MSCI Switzerland Capped ETF’s Technical Performance Over The Past Year
Their RSI is well into overbought territory at 78.98, with their MACD beginning to signal a bearish rollover.
Friday’s hanging man candlestick on a +1% gap up with high volume will make for an interesting Monday/Tuesday session while we wait to see if the gap is filled or not.
EWL pays a 1.78% distribution to long-term shareholders, but that will not be enough protection when you factor in where their support levels, so other methods of insurance would be beneficial while watching where to make a better entry in less volatile market conditions.
EWL has support at the $47.13 (10 day moving average), $45.87, $44.94 & $44.67/share (50 day moving average) price levels, with resistance at the $49.27, $50.28 & $52.02/share price levels.
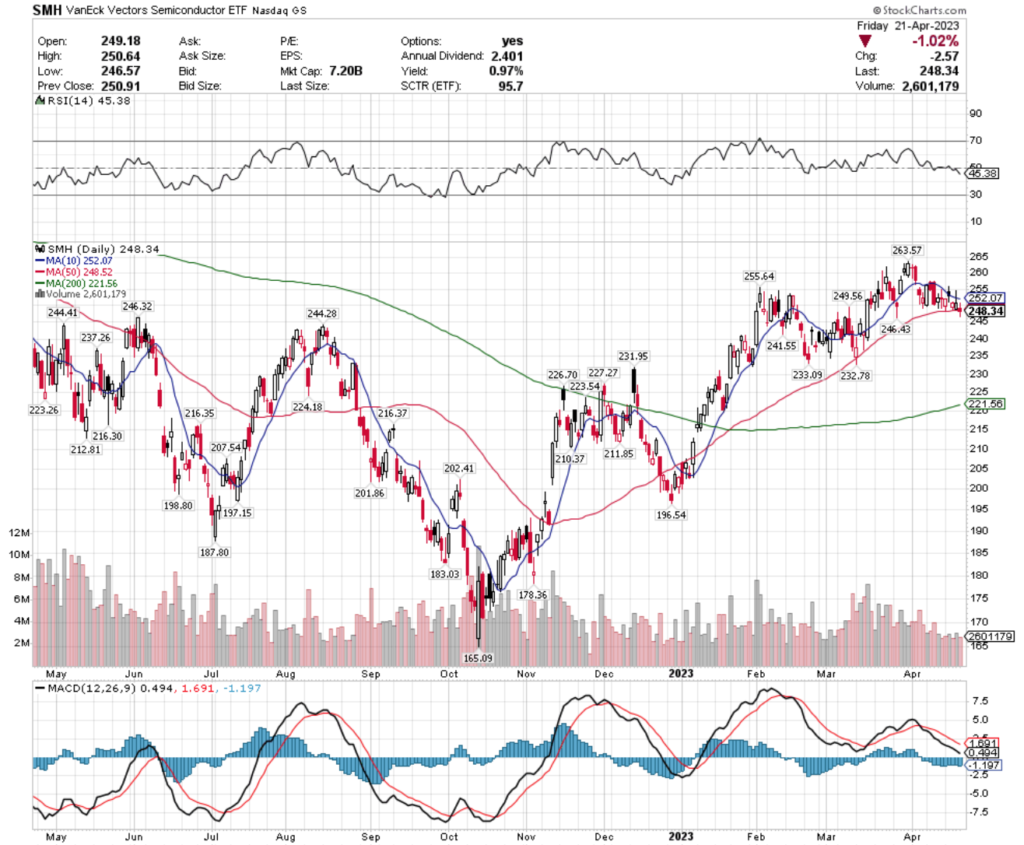
SMH ETF – VanEck Vectors Semiconductor ETF’s Technical Performance Over The Past Year
Their MACD has been bearish for a couple of weeks, but their RSI is relatively neutral (oversold side), after spending the past couple of weeks in a consolidation range.
Recent trading volumes have been below average, signaling indecision on the part of investors, which is validated by Friday’s doji candlestick.
SMH’s 0.97% distribution yield doesn’t offer much in the form of insurance against losses from volatility, making it important to have an options strategy as a hedge while eyeing how they behave at support levels to begin planning an entry.
SMH has support at the $246.43, $246.32, $244.41 & $244.28/share price levels, with resistance at the $248.52 (50 day moving average), $249.56, $252.07 (10 day moving average) & $255.64/share price levels.
DFE ETF – WisdomTree Europe SmallCap Dividend Fund’s Technical Performance Over The Past Year
Their MACD is beginning to signal a bearish crossover in the coming days, with their RSI showing room to cool off, as it is approaching the overbought end of neutral.
This is a lightly traded ETF throughout the year that sports a 5.91% distribution for long-term shareholders.
While eyeing their behavior at support levels, there may be opportunities using options to profit from a near-term strategy, but as the shares themselves as so illiquid, make sure open interest levels are liquid before trading them.
DFE has support at the $59.60 (10 day moving average), $58.41 (50 day moving average), $57.96 & $56.82/share price levels, with resistance at the $60.19, $60.49, $60.84 & $61.27/share price levels.
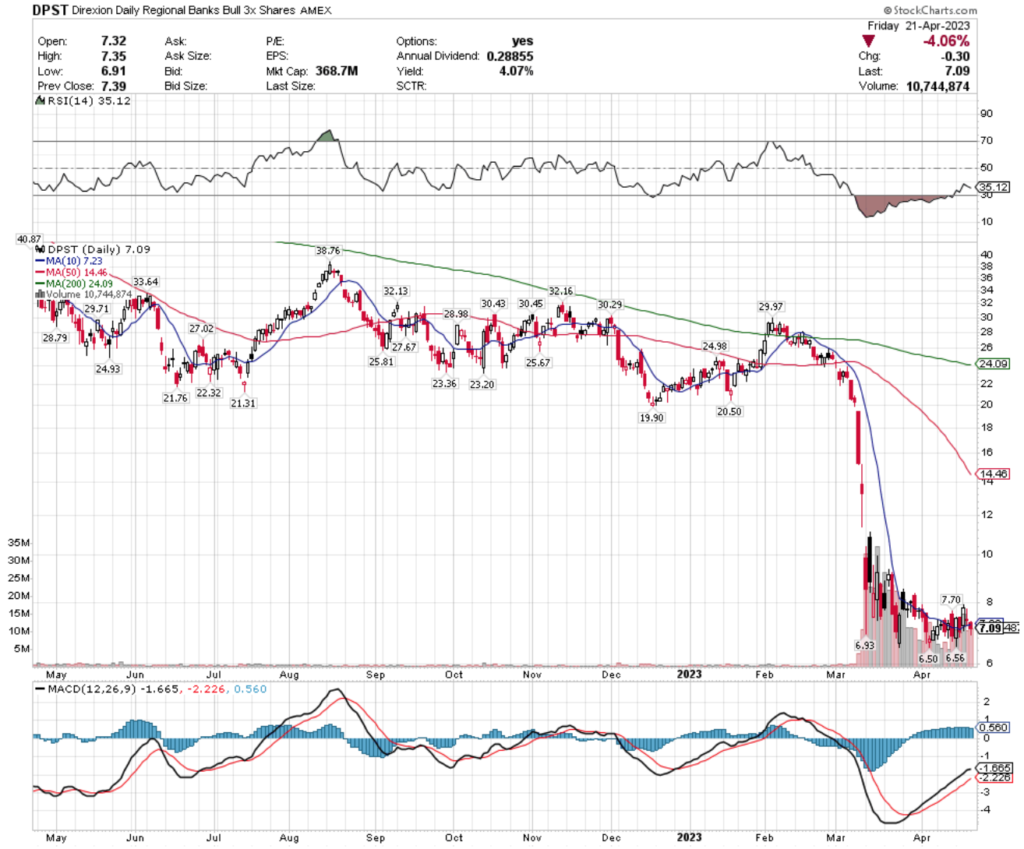
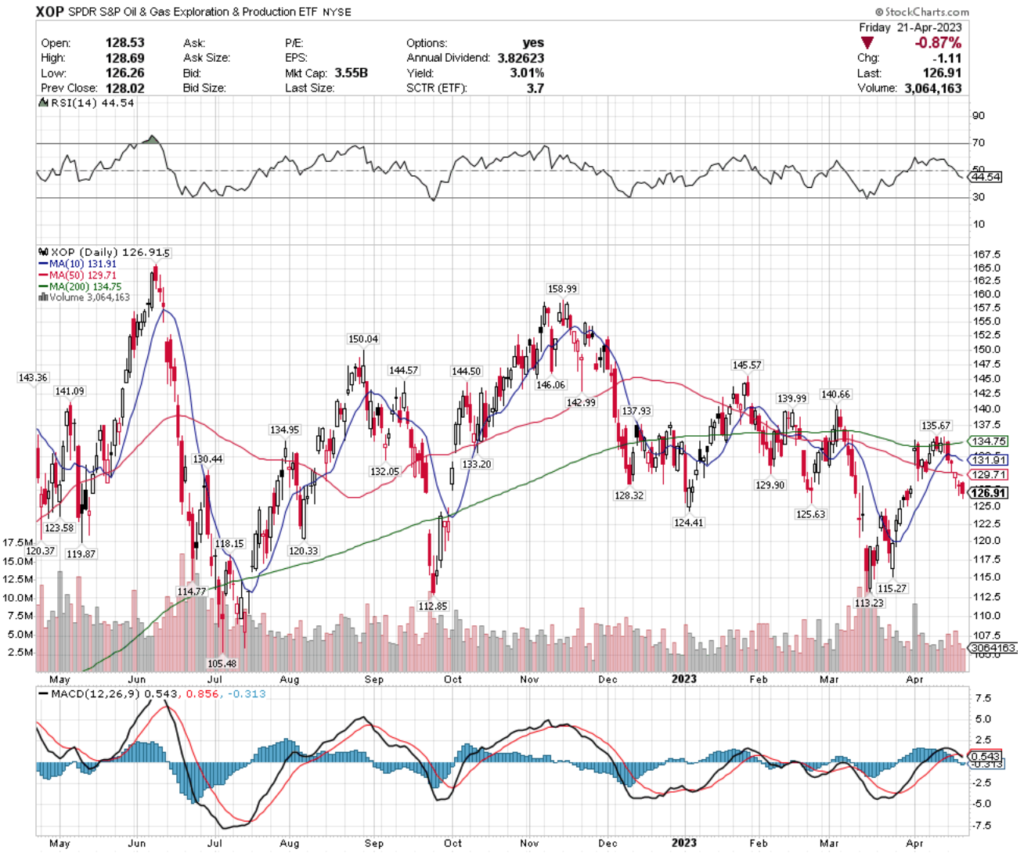
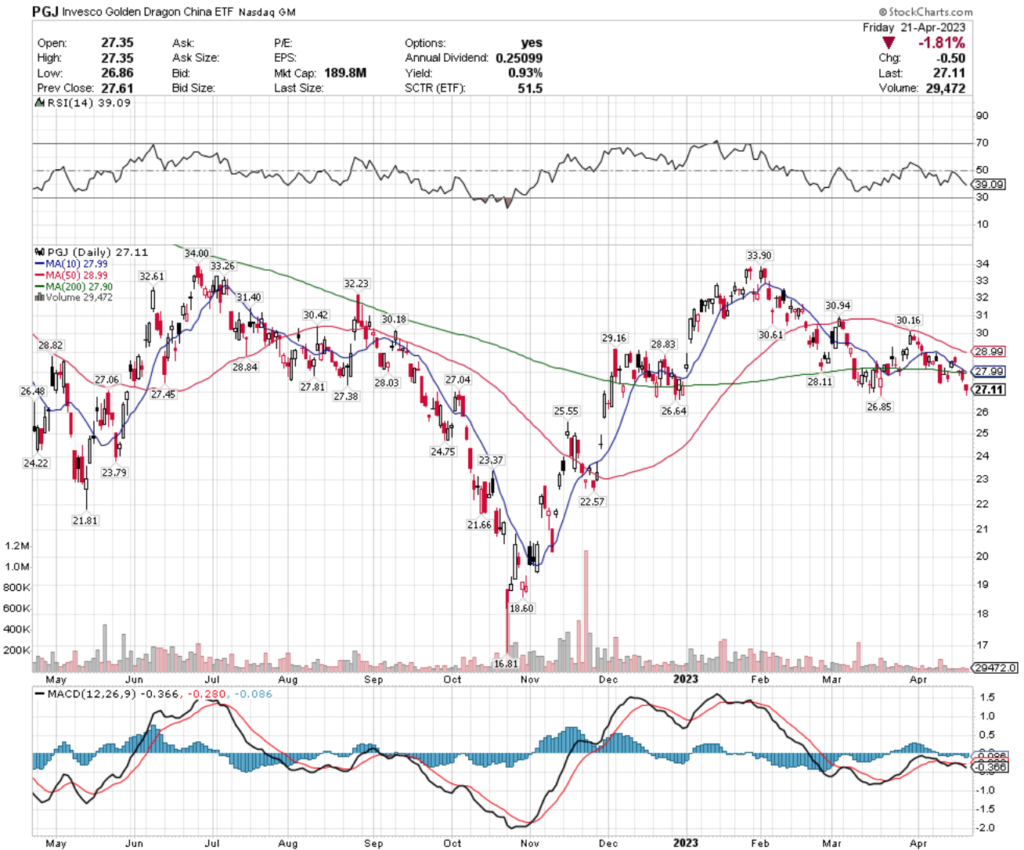
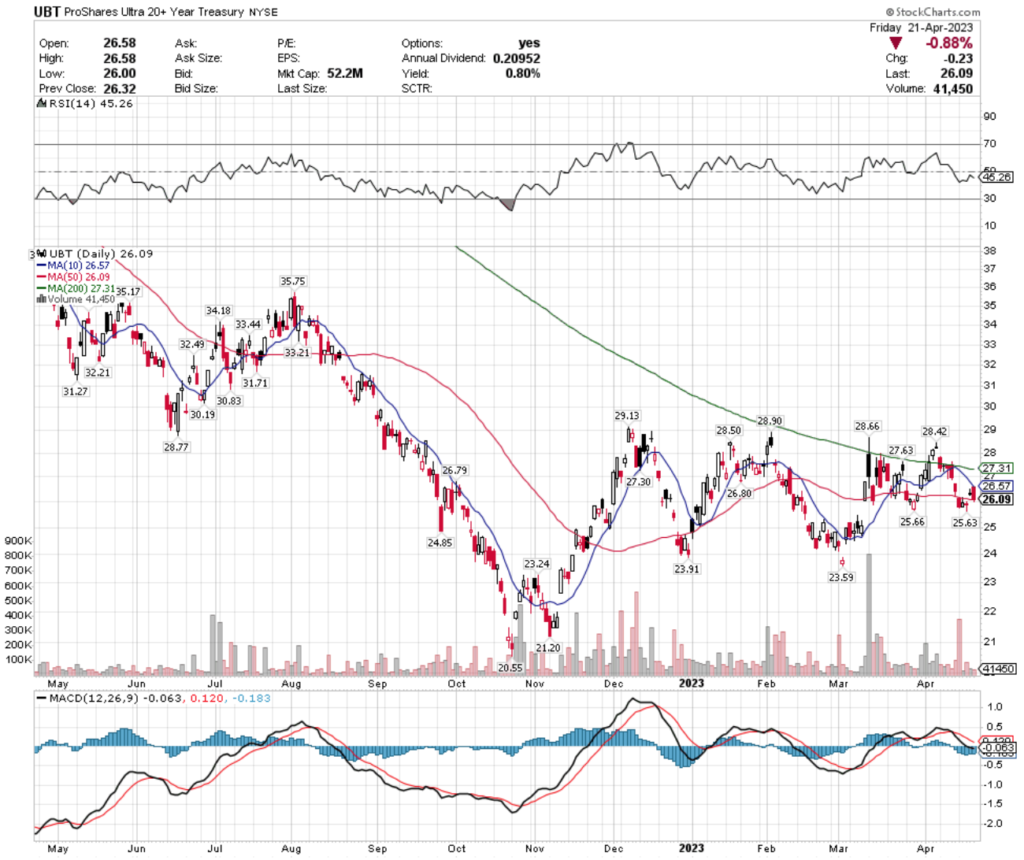
Regional Banks (DPST), Oil & Gas Exploration & Production (XOP), China (PGJ) & 20+ Year Treasuries (UBT) Are All Bearishly Lagging The Market
DPST, the Direxion Daily Regional Banks Bull 3x Shares ETF has fallen -79.46% over the past year, losing -81.9% from their 52 week high in August of 2022, but reclaiming +9.08% from their 52 week low in March of 2023 (ex-distributions).
DPST ETF – Direxion Daily Regional Banks Bull 3x Shares ETF’s Technical Performance Over The Past Year
Their MACD has been bullish since late March, but their RSI is bearishly trending back to oversold conditions after this most recent consolidation period.
Recent volumes have been above average compared to the year prior, with the past few days’ candlesticks signaling more uncertainty.
While they offer a 4.07% distribution yield to long-term holders, traders can profit in the meantime using options strategies while the market participants find an agreeable price range for DPST.
DPST has support at the $6.93, $6.56 & $6.50/share price levels, with resistance overhead at the $7.23 (10 day moving average), $7.70 & $14.46/share (50 day moving average) price levels.
XOP, the SPDR S&P Oil & Gas Exploration & Production ETF has shed -1.91% over the past year, losing 25.62% since their 52 week high of June of 2022, but gaining 17.51% since their 52 week low of July 2022 (ex-distributions).
XOP ETF – SPDR S&P Oil & Gas Exploration & Production ETF’s Technical Performance Over The Past Year
Their MACD recently completed a bearish crossover, but their recent volumes have been below average, signaling uncertainty, which is further confirmed by their mix of candlesticks from the past week, which include multiple bearish hanging man candles & a doji.
Their RSI is approaching the oversold end of neutral at 44, but with only 3.01% cushion for losses from their distribution yield (for long-term holders), unless using an options protection strategy, it would be wisest to wait & see at what level they begin trending upward again.
XOP has support at the $125.63, $124.41, $123.58 & $120.33/share price level, with resistance at the $128.32, $129.71 (50 day moving average), $129.90 & $130.44/share price levels.
PGJ, the Invesco Golden Dragon China ETF has gained 7.81% over the past year, losing -20.75% from their 52 week high in June of 2022, while rebounding +60.7% since their 52 week low in October of 2022 (ex-distributions).
PGJ ETF – Invesco Golden Dragon China ETF’s Technical Performance Over The Past Year
Their RSI is beginning to approach oversold conditions, but their MACD is trending downward.
Recent volumes have been extremely light & below average, confirming the negative sentiment that the 2 gap down days last week expressed.
With only 0.93% for longterm holders coming from distribution, this is another one to either trade around using options, or wait to see when it begins to find stable footing at one of its support levels.
PGJ has support at the $27.06, $27.04, $26.85 & $26.64/share price levels, with resistance at the $27.38, $27.45, $27.81 & $27.90/share (200 day moving average) price levels.
UBT, the ProShares Ultra 20+ Year Treasury ETF has lost -26.52% over the past year, losing 30.33% since their 52 week high in April of 2022, but regaining 25.98% since their 52 week low in October of 2022 (ex-distributions).
UBT ETF – ProShares Ultra 20+ Year Treasury ETF’s Technical Performance Over The Past Year
Their MACD is showing signs of a near-term bullish crossover, but they also run the risk of filling the gap from March of 2023 if there is broader market volatility.
With an RSI at 45 & trending downward, below average volume recently & a modest 0.80% distribution yield for protection, this one is best left alone until a new range is established to trend from.
UBT has support at the $25.66, $25.63, $24.85 & $23.91/share price level, with resistance at the $26.57 (10 day moving average), $26.79, $26.80 & $27.30/share price level.
Tying It All Together
In terms of data reporting, this week starts off quiet, with nothing to be announced on Monday, which will give more control over the market’s direction to the results of earnings reports.
Monday’s earnings reports include Bank of Hawaii, AGNC, Coca Cola, Cleveland-Cliffs, First Republic Bank & Whirlpool.
On Tuesday we get the S&P Case-Schiller Home Price Index (20 cities) & the FHFA Home Price Index data at 9 am, followed by New Home Sales & Consumer Confidence numbers at 10 am.
Also on Tuesday, Microsoft, Alphabet, Archer Daniels Midland, 3M, Biogen, Chubb, Chipotle Mexican Grill, Danaher, DOW, General Electric, General Motors, Halliburton, McDonald’s, Sherwin Williams, Raytheon Technologies, Texas Instruments, UPS, Verizon Communications, Visa & many other large names report their earnings.
Wednesday we get Durable Goods Orders, Durable Goods Minus Transportation, Advanced U.S. Trade Balance In Goods, Advanced Retail Inventories & Advanced Wholesale Inventories data, all at 8:30 am.
Wednesday’s earnings include Meta, Automatic Data, C.H. Robinson Worldwide, Churchill Downs, CME Group, Boeing, eBay, Meritage Homes, Lending Club, Humana, Norfolk Southern, Old Dominion, Otis Worldwide, Penske Auto, Ryder System, Steve Madden, Thermo Fisher, United Rentals, Waste Management, Wyndham Hotels & Resorts and many other names as well.
Thursday’s data kicks off with GDP, Initial Jobless Claims & Continuing Jobless Claims at 8:30 am, and Pending Home Sales at 10 am.
Thursday will also be a busy day of earnings calls, with Amazon, AbbVie, Activision Blizzard, Amgen, Bristol-Myers, Boston Beer Co. Caterpiller, Church & Dwight, Cloudflare, Comcast, Domino’s Pizza, Eli Lilly, Grainger, Harley Davidson, Hershey Foods, Honeywell, Mastercard, Merck, Mohawk Industries, Modelez International, Northrop Grumman, S&P Global, Southern, T-Mobile, Tractor Supply, U.S. Steel, Valero Energy, Xcel Energy & many other names.
Friday the week winds down with Employment Cost Index, Personal Income (nominal), Personal Spending (nominal), PCE Index, Core PCE Index, PCE (year-over-year) & Core PCE (year-over-year) at 8:30 am, the Chicago Business Barometer at 9:45 am & Final Consumer Sentiment numbers at 10 am.
Friday is more quiet on the earnings calls front, with Aon, Charter Communications, Colgate-Palmolive, Exxon Mobil, Newell Brands & Wisdom Tree, among others all reporting quarterly earnings.
Between the data being reported & the large amount of companies reporting earnings, this promises to be a volatile week.
See you back here next week!
*** I DO NOT OWN SHARES OR OPTIONS CONTRACT POSITIONS IN SPY, QQQ, IWM, EWW, EWL, SMH, DFE, DPST, XOP, PGJ or UBT AT THE TIME OF PUBLISHING THIS ARTICLE ***