Old Dominion Freight Line, Inc. stock trades under the ticker ODFL & has shown recent bullishness that traders & investors should research further into for when market volatility has subsided.
ODFL stock closed at $310.19/share on 5/25/2023.
Old Dominion Freight Line, Inc. ODFL Stock’s Technical Performance Broken Down
Old Dominion Freight Line, Inc. ODFL Stock’s Technical Performance Over The Past Year
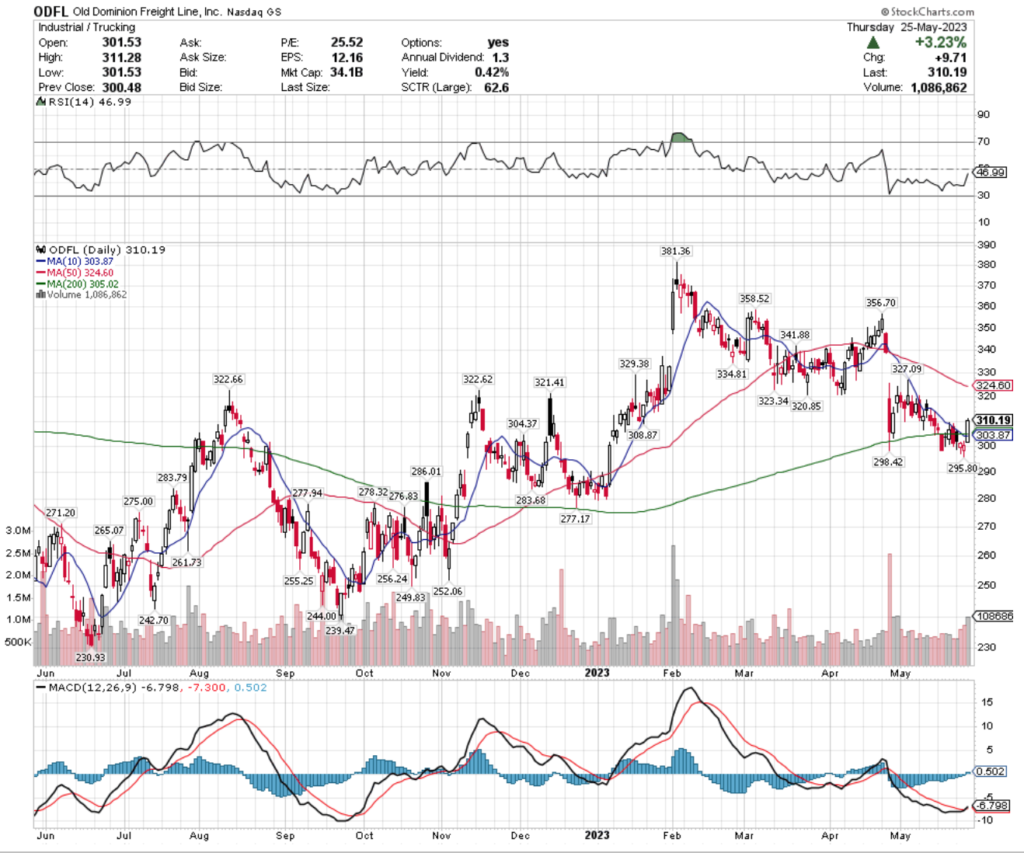
ODFL Stock Price: $310.19
10 Day Moving Average: $303.87
50 Day Moving Average: $324.60
200 Day Moving Average: $305.02
RSI: 46.99
MACD: -6.798, -7.300, 0.502
Yesterday, ODFL stock completed a bullish MACD crossover, gaining +3.23% on the day’s session.
Their RSI is returning back to neutral from being near over-sold levels, with recent trading levels being about average compared to the year prior.
Investors would be best suited to watch how ODFL behaves around support levels in the coming weeks in order to figure out where they may like to enter a position at a less volatile time.
ODFL has support at the $308.87, $305.02 (200 day moving average), $304.37 & $303.87/share (10 day moving average) price levels, with resistance at the $320.85, $321.41, $322.62 & $322.66/share price levels.
Old Dominion Freight Line, Inc. ODFL Stock As A Long-Term Investment
Investors with longer time horizons will like ODFL stock’s 25.08 P/E (ttm), but will find their 9.20 P/B (mrq) to be higher than they’d like to see.
They recently reported -3.7% Quarterly Revenue Growth Y-o-Y, with -4.9% Quarterly Earnings Growth Y-o-Y, which investors should look closer into as well before investing.
Their balance sheet looks appealing, with $232.43M of Total Cash (mrq) & $99.97M of Total Debt (mrq).
ODFL stock pays a modest 0.43% dividend, which appears to be sustainable in the long-run, as their payout ratio is 10.69%.
77.48% of ODFL stock’s outstanding share float is owned by institutional investors.
Old Dominion Freight Line, Inc. ODFL Stock As A Short-Term Trade Using Options
Traders with shorter time horizons can trade options to profit from price movements in ODFL stock, while protecting their portfolios from volatility.
I am looking at the contracts with the 6/16 expiration date.
The $310, $290 & $280 call options are all in-the-money, with the former being more liquid than the latter two strikes.
The $320, $330 & $340 puts are also all in-the-money, listed from highest to lowest level of open interest.
Tying It All Together
ODFL stock has many interesting characteristics that traders & investors will like.
Investors will like their balance sheet & modest, but sustainable dividend yield, but may want to look closer into their recent growth metrics before investing at a less volatile time.
Traders will like their recent technical performance, as well as how liquid their options are.
Overall, it is worth taking a closer look to see how ODFL stock fits into your portfolio strategy.
*** I DO NOT OWN SHARES OR OPTIONS CONTRACT POSITIONS IN ODFL STOCK AT THE TIME OF PUBLISHING THIS ARTICLE ***
Exxon Mobil Corp. stock trades under the ticker XOM & has shown recent bullishness that traders & investors should research further into for when market volatility has reduced.
XOM stock closed at $107.50/share on 5/24/2023.
Exxon Mobil Corp. XOM Stock’s Technical Performance Broken Down
Exxon Mobil Corp. XOM Stock’s Technical Performance Over The Past Year
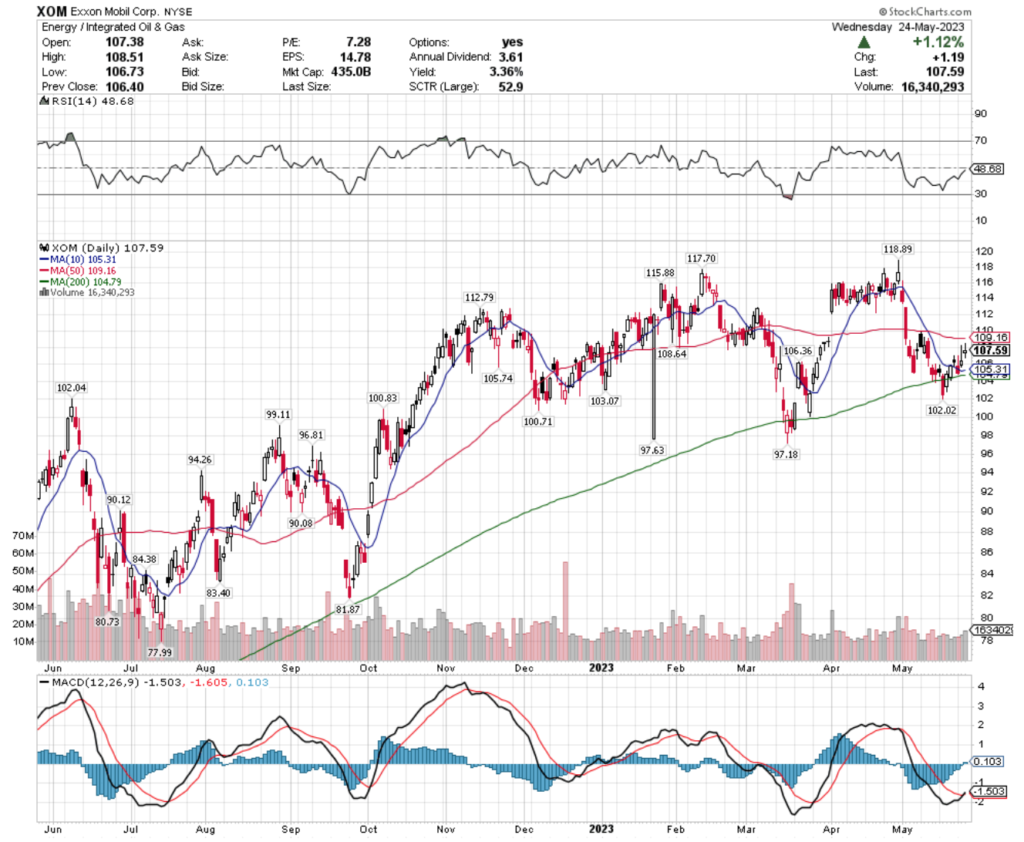
XOM Stock Price: $107.59
10 Day Moving Average: $105.31
50 Day Moving Average: $109.16
200 Day Moving Average: $104.79
RSI: 48.68
MACD: -1.503, -1.605, 0.103
Yesterday, XOM stock completed a bullish MACD crossover, gaining +1.12% on the day’s session.
Their RSI is about neutral at 48.68, but recent trading volumes have been below average compared to the year prior, signaling uncertainty by investors about XOM in the near-term.
Yesterday’s spinning top candlestick, along with the others of the past two weeks confirm that there is hesitance on investors’ part to buy XOM currently, making it best to look to see how they behave at support levels in the coming weeks.
XOM has support at the $106.36, $105.74, $105.31 (10 day moving average) & $104.79/share (200 day moving average) price levels, with resistance at the $108.64, $109.16 (50 day moving average), $112.79 & $115.88/share price levels.
Exxon Mobil Corp. XOM Stock As A Long-Term Investment
Long-term focused investors will like XOM stock’s valuation metrics, with a 7.31 P/E (ttm) & a 2.2 P/B (mrq).
They recently reported -4.3% Quarterly Revenue Growth Y-o-Y, with 108.6% Quarterly Earnings Growth Y-o-Y.
Their balance sheet should also be reviewed more thoroughly before investing, with $32.65B of Total Cash (mrq) & $41.45B of Total Debt (mrq).
XOM pays a 3.36% dividend, which appears to be sustainable in the long-run, as their payout ratio is 24.24%.
60.91% of XOM stock’s outstanding share float is owned by institutional investors.
Exxon Mobil Corp. XOM Stock As A Short-Term Trade Using Options
Traders with shorter time horizons can trade options to profit from price movements in XOM stock, while protecting their portfolios from broader market volatility.
I am looking at the contracts with the 6/16 expiration date.
The $105, $107 & $106 calls options are all in-the-money, listed from highest to lowest level of open interest.
The $110, $108 & $111 puts are also in-the-money, with the former being more liquid than the latter two strike prices.
Tying It All Together
XOM stock has many interesting attributes that traders & investors will find appealing.
Investors will like their stable dividend, along with their valuation metrics, but may want to look closer into their balance sheet & recent growth performance.
Traders will like their recent technical performance & liquid options.
All-in-all, it is worth taking a closer look at XOM stock to see how it fits into your portfolio strategy.
*** I DO NOT OWN SHARES OR OPTIONS CONTRACT POSITIONS IN XOM STOCK AT THE TIME OF PUBLISHING THIS ARTICLE ***
Archer Daniels Midland Co. stock trades under the ticker ADM & has shown recent bullish behavior that traders & investors should research further into for when market volatility has been reduced.
ADM stock closed at $75.05/share on 5/23/2023.
Archer Daniels Midland Co. ADM Stock’s Technical Performance Broken Down
Archer Daniels Midland Co. ADM Stock’s Technical Performance Over The Past Year
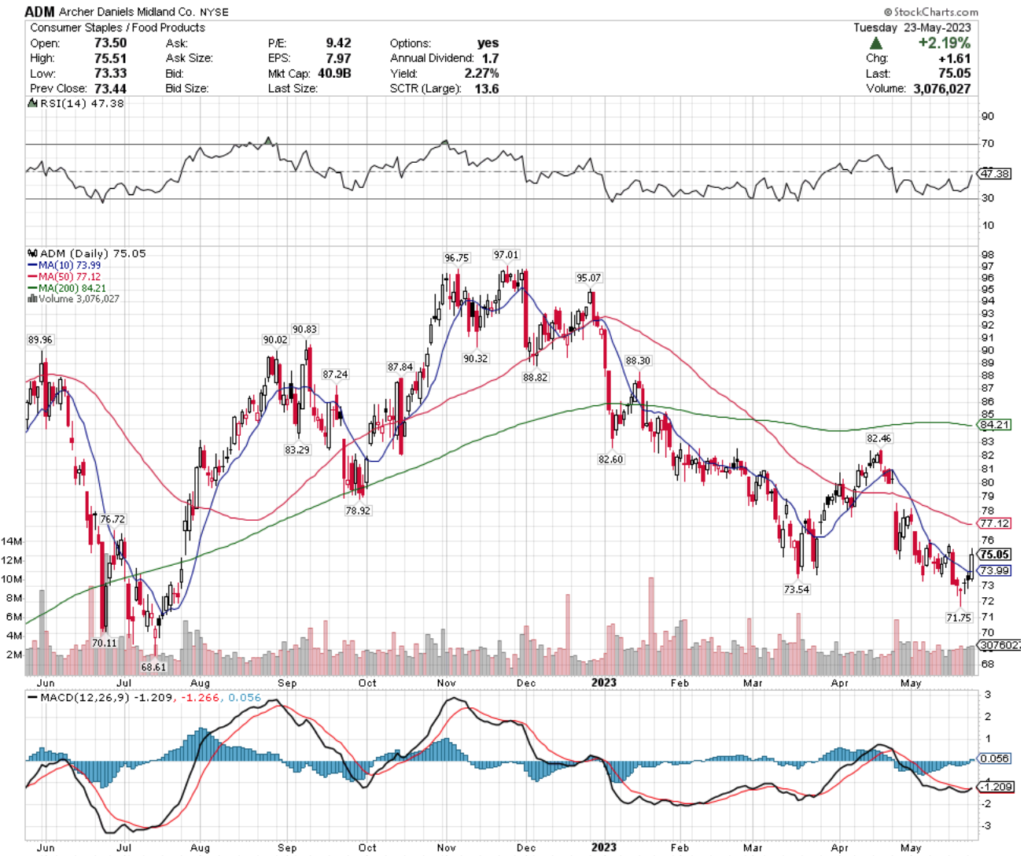
ADM Stock Price: $75.05
10 Day Moving Average: $73.99
50 Day Moving Average: $77.12
200 Day Moving Average: $84.21
RSI: 47.38
MACD: -1.209, -1.266, 0.056
Yesterday, ADM stock completed a bullish MACD crossover, closing the day +2.19%.
Their RSI is approaching neutral bullishly & recent trading volumes have been about average compared to the year prior.
Investors should be watching how ADM stock behaves around its support levels in the coming weeks to determine where they would like to enter a position once market volatility has calmed down.
ADM stock has support at the $73.99 (10 day moving average), $73.54, $71.75 & $70.11/share price levels, with resistance at the $76.72, $77.12 (50 day moving average), $78.92 & $82.46/share price levels.
Archer Daniels Midland Co. ADM Stock As A Long-Term Investment
Long-term focused investors will like ADM stock’s valuation metrics, with a 9.84 P/E (ttm) & a 1.71 P/B (mrq).
They recently reported +1.8% Quarterly Revenue Growth Y-o-Y, with +11% Quarterly Earnings Growth Y-o-Y.
ADM’s balance sheet will require a more thorough review, with $899M of Total Cash (mrq) & $11.55B of Total Debt (mrq).
ADM pays a 2.25% dividend, which appears to be sustainable as their payout ratio is 20.7%.
83.4% of ADM stock’s outstanding share float is owned by institutional investors.
Archer Daniels Midland Co. ADM Stock As A Short-Term Trade Using Options
Traders with shorter time horizons can trade options to profit from ADM stock’s price movements, while protecting their portfolios from volatility.
I am looking at the contracts with the 6/16 expiration date.
The $75, $72.50 & $74 call options are all in-the-money, listed from highest to lowest level of open interest.
The $77.50, $79 & $77 puts are also in-the-money, with the former being more liquid than the latter strikes.
Tying It All Together
ADM stock has many unique attributes that traders & investors will find appealing.
Investors will like their valuation metrics, as well as their sustainable dividend.
Traders will like their recent technical performance, as well as their liquid options.
Overall, it is worth taking a closer look at how ADM stock fits into your portfolio strategy.
*** I DO NOT OWN SHARES OR OPTIONS CONTRACT POSITIONS IN ADM STOCK AT THE TIME OF PUBLISHING THIS ARTICLE ***
Cummins Inc. stock trades under the ticker CMI & has shown recent bullishness that traders & investors should research further into for when market volatility has passed.
CMI stock closed at $215.98/share on 5/23/2023.
Cummins Inc. CMI Stock’s Technical Performance Broken Down
Cummins Inc. CMI Stock’s Technical Performance Over The Past Year
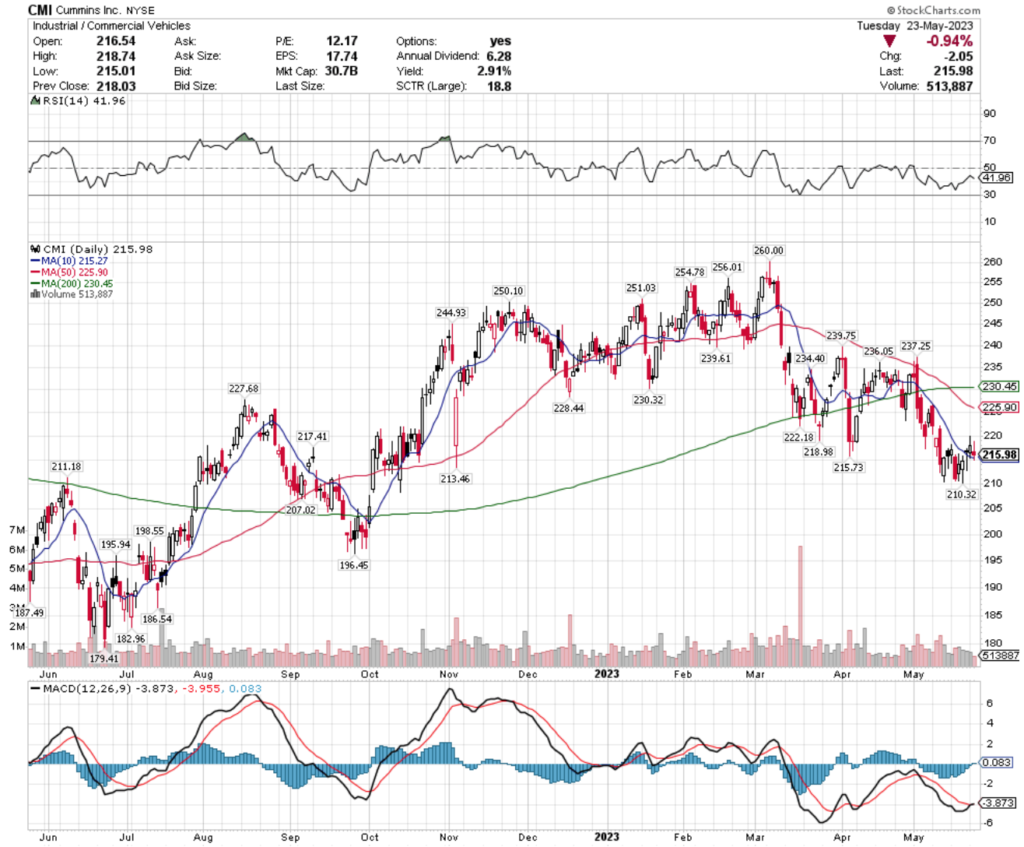
CMI Stock Price: $215.98
10 Day Moving Average: $215.27
50 Day Moving Average: $225.90
200 Day Moving Average: $230.45
RSI: 41.96
MACD: -3.873, -3.955, 0.083
Yesterday, CMI stock completed a bullish MACD crossover, despite losing -0.94% on the day’s session.
Their RSI is on the oversold end of neutral at 41.96, with recent trading volumes being below average compared to the year prior, signaling uncertainty among investors.
Investors should be watching to see how CMI behaves around its support levels to establish where they may want to enter a position once broader market volatility has subsided.
CMI stock has support at the $215.73, $215.27 (10 day moving average), $213.46 & $211.18/share price level, with resistance overhead at the $217.41, $218.98, $222.18 & $225.90/share (50 day moving average) price levels.
Cummins Inc. CMI Stock As A Long-Term Investment
Long-term oriented investors will like CMI stock’s 12.61 P/E (ttm), but may find their 3.29 P/B (mrq) to be a bit too rich.
They recently reported +32.4% Quarterly Revenue Growth Y-o-Y, with +89% Quarterly Earnings Growth Y-o-Y.
Their balance sheet may warrant a more thorough review, with $2.44B of Total Cash (mrq) & $8.37B of Total Debt (mrq).
CMI pays a 2.83% dividend, which appears to be sustainable in the long-run, as their payout ratio is 34.7%.
LyondellBasell Industries NV stock trades under the ticker LYB & has shown recent bullishness that traders & investors should research further into for when market volatility has subsided.
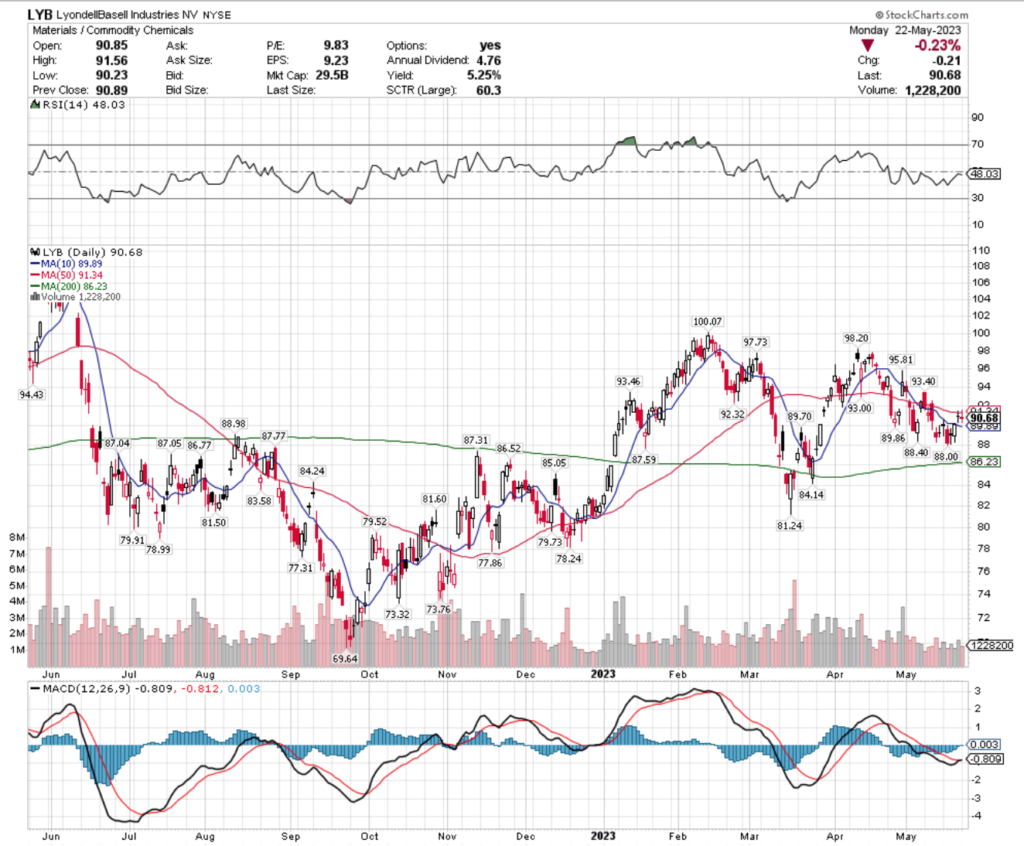
LYB stock closed at $90.68/share on 5/22/2023.
LyondellBasell Industries NV LYB Stock’s Technical Performance Broken Down
LyondellBasell Industries NV LYB Stock’s Technical Performance Over The Past Year
LYB Stock Price: $90.68
10 Day Moving Average: $89.89
50 Day Moving Average: $91.34
200 Day Moving Average: $86.23
RSI: 48.03
MACD: -0.809, -0.812, 0.003
Yesterday, LYB stock completed a bullish MACD crossover, despite losing -0.23% on the day’s session.
Their RSI is neutral at 48 & recent trading volumes have been below average compared with the year prior, which when combined with the spinning top candlesticks from 6 of the last 8 sessions, highlights uncertainty in LYB stock’s share value by investors.
As a result, market participants would be wise to watch how they behave at their key support levels in the near-term in order to target an entry for when market volatility has cooled down.
LYB stock has support at the $89.89 (10 day moving average), $89.86, $89.70 & $88.98/share price levels, with resistance at the $91.34 (50 day moving average), $92.32, $93 & $93.32/share price levels.
LyondellBasell Industries NV LYB Stock As A Long-Term Investment
Long-term oriented investors will like LYB stock’s valuation metrics, with a 10.09 P/E (ttm) & a 2.39 P/B (mrq).
They recently reported -22.10% Quarterly Revenue Growth Y-o-Y, with -64.2% Quarterly Earnings Growth Y-o-Y, which should be researched further into before investing.
Their balance sheet will also require a more thorough examination as well, with $1.82B of Total Cash (mrq) & $13.1B of Total Debt (mrq).
LYB stock pays a 5.24% dividend, which appears to be sustainable in the long-run, as their payout ratio is 51.35%.
72.06% of LYB stock’s outstanding share float is owned by institutional investors.
LyondellBasell Industries NV LYB Stock As A Short-Term Trade Using Options
Traders with shorter time horizons can trade options to profit from LYB stock’s price movements, while protecting their portfolios from volatility.
I am looking at the contracts with the 6/16 expiration date.
The $90, $85 & $80 call options are all in-the-money, listed from highest to lowest level of open interest.
The $95, $100 & $105 puts are also in-the-money, with the former being more liquid than the latter strikes.
Tying It All Together
LYB stock has many interesting attributes that traders & investors will find appealing.
Investors will like their dividend, as well as their valuation metrics, but may want to dig deeper into their recent growth woes, as well as their balance sheet.
Traders will like their recent technical performance, as well as their liquid options.
All-in-all, it is worth taking a closer look into how LYB stock fits into your portfolio strategy.
*** I DO NOT OWN SHARES OR OPTIONS CONTRACT POSITIONS IN LYB STOCK AT THE TIME OF PUBLISHING THIS ARTICLE ***
John Bean Technologies Corp. stock trades under the ticker JBT & has shown recent bullishness that traders & investors should research further into for when market volatility has calmed down.
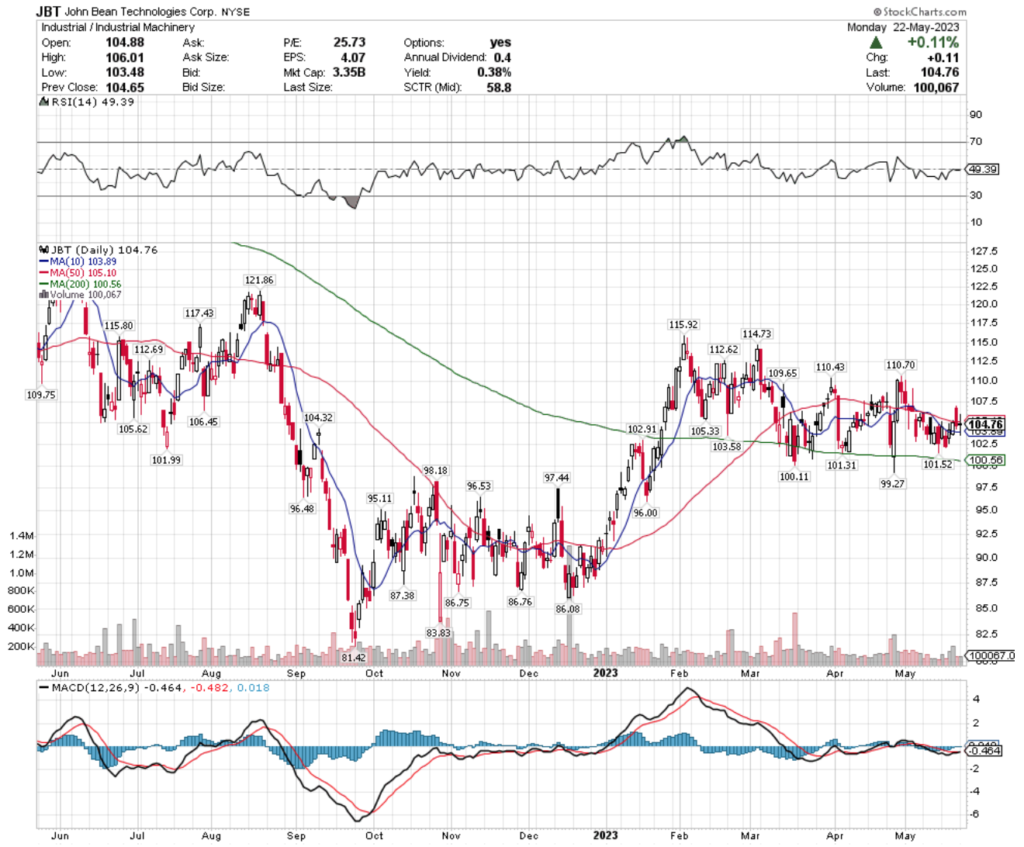
JBT stock closed at $104.76/share on 5/22/2023.
John Bean Technologies Corp. JBT Stock’s Technical Performance Broken Down
John Bean Technologies Corp. JBT Stock’s Technical Performance Over The Past Year
Yesterday, JBT stock completed a bullish MACD crossover, gaining+0.11% on the day’s session.
Their RSI is neutral at 49 & recent trading volumes have been below average compared to the year prior, indicating that investors are uncertain about where they value JBT’s shares currently.
Investors would be wise to watch how they behave at support levels in the coming weeks, in order to figure out what price level to enter at once market volatility has subsided a bit.
JBT stock has support at the $104.32, $103.89 (10 day moving average), $103.58 & $101.99/share price levels, with resistance at the $105.10 (50 day moving average), $105.33, $105.62 & $106.45/share price levels.
John Bean Technologies Corp. JBT Stock As A Long-Term Investment
Long-term oriented investors will like JBT stock’s 25.18 P/E (ttm), but may find their 3.78 P/B (mrq) to be a bit too rich.
Their balance sheet will require a more thorough review, with $45.7M of Total Cash (mrq) & $957.3M of Total Debt (mrq).
JBT stock pays a modest 0.38% dividend, which appears to be sustainable in the long-run, as their payout ratio is 9.83%.
99.34% of JBT stock’s outstanding share float is owned by institutional investors.
John Bean Technologies Corp. JBT Stock As A Short-Term Trade Using Options
Traders who has shorter time horizons can trade options to profit from JBT stock’s price movements, while protecting their portfolios from volatility.
Their options are pretty illiquid, with no in-the-money strike prices for calls in the coming expiration dates, but there are contracts at the $115 calls dated for 6/16, as well as $115, $110, $120 & $125 strikes for the 7/21 expiration date (in order of highest to lowest level of open interest)
The $110 puts with the 7/21 expiration date are in-the-money.
Tying It All Together
JBT stock has many interesting characteristics that traders & investors will find appealing.
Investors will like their P/E (ttm) & sustainable, yet modest dividend.
Traders will like their recent technical performance, but will be disappointed by how illiquid their options are.
Overall, it is worth taking a closer look to see how JBT stock fits into your portfolio strategy.
*** I DO NOT OWN SHARES OR OPTIONS CONTRACT POSITIONS IN JBT STOCK AT THE TIME OF PUBLISHING THIS ARTICLE ***
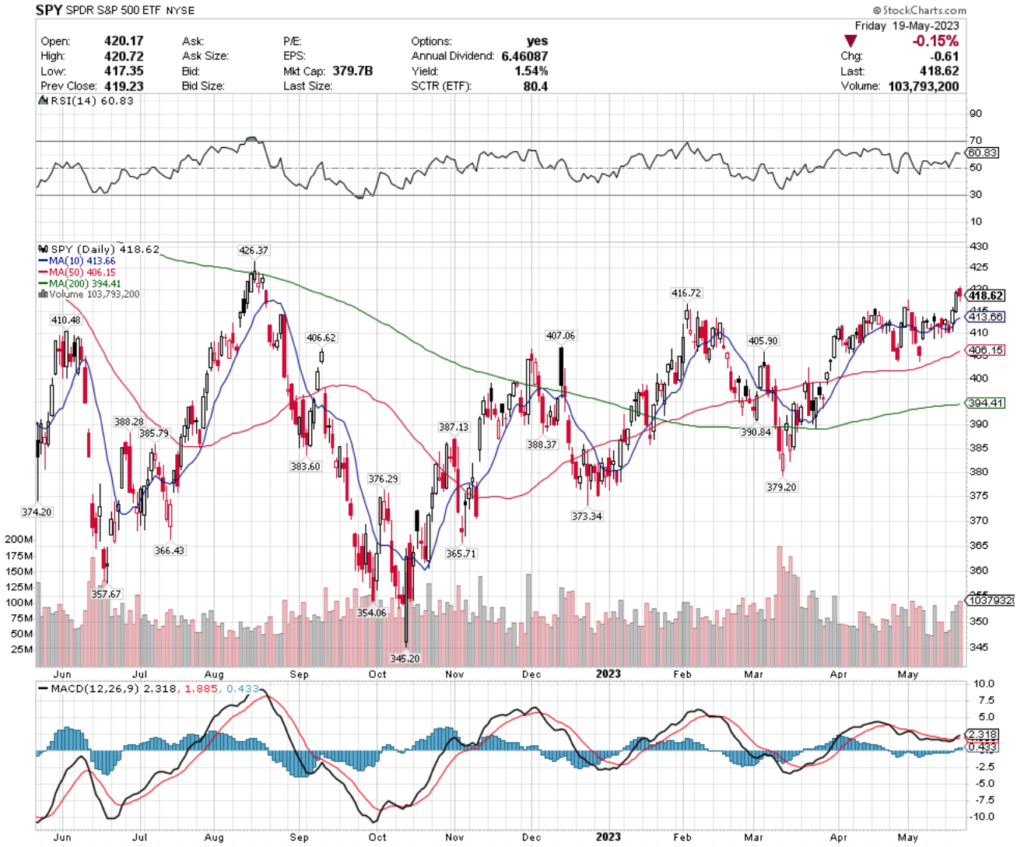
SPY, the SPDR S&P 500 ETF gained +1.71% over the past week, as investors tried to sort through the results of earnings calls, changes in companies’ guidance, the fallout of the bank failure issues, future inflation curbing measures from the Fed & the U.S. Debt Ceiling debacle.
SPY ETF – SPDR S&P 500 ETF’s Technical Performance Over The Past Year
After starting the week off in the same consolidation range as last week, Wednesday & Thursday’s sessions showed signs of optimism from investors, with Friday’s session bringing SPY back to reality a bit after two strong days.
Their RSI is on the overbought end of neutral at 60.83, with last week’s volumes starting off below average compared to the year prior, before increasing Wednesday through Friday.
Their MACD is currently bullish, but Monday’s session will provide more technical insights into which direction they are likely to go in for the next week, as Monday’s session has to the potential to create a Dark Cloud Cover pattern, which would be a bearish signal to kick off the week.
SPY has support at the $416.72 (Volume Sentiment: Sellers, 1.33:1), $413.66 (Volume Sentiment: Buyers, 3:1), $410.48 (Volume Sentiment: Sellers, 1.57:1) & $407.06/share (Volume Sentiment: Sellers, 1.9:1) price levels, with resistance at the $426.37 (Volume Sentiment: Sellers, 1.24:1), $438.53 (Volume Sentiment: Sellers, 1.32:1), $442.12 (Volume Sentiment: Sellers, 1.35:1) & $449.09/share (Volume Sentiment: Buyers, 1.89:1) price levels.
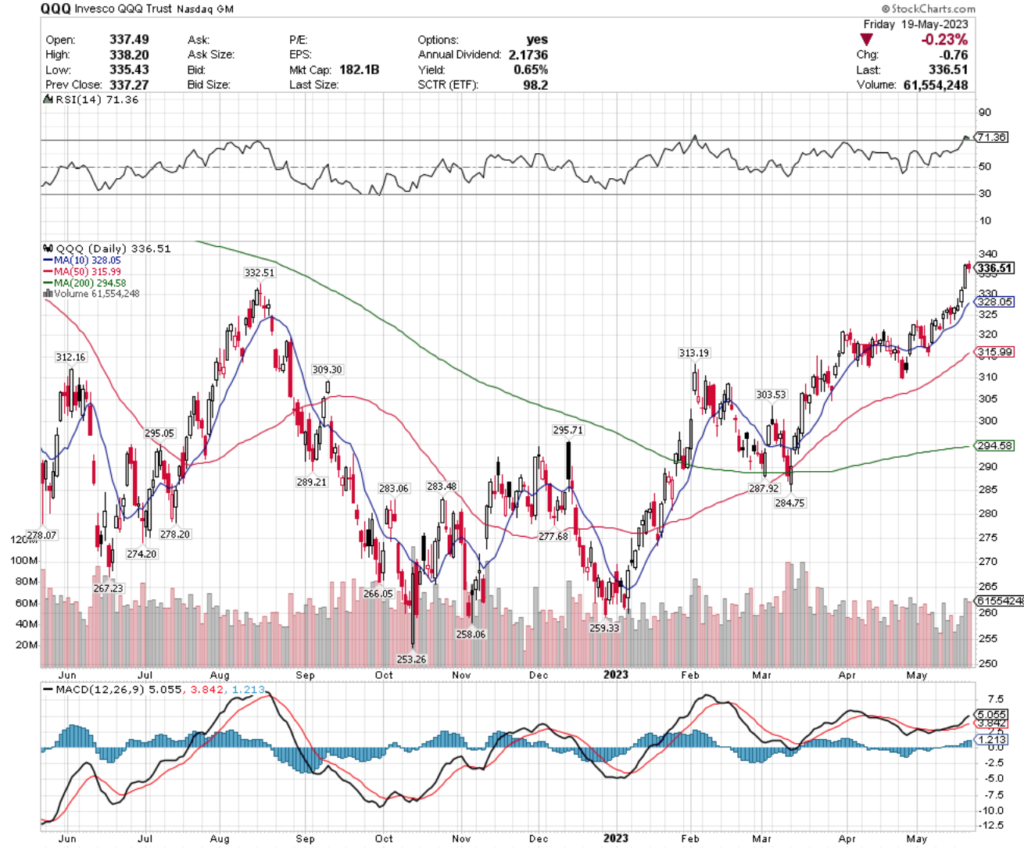
QQQ, the Invesco QQQ Trust ETF jumped +3.53% over the past week, as investors showed favor to the tech-heavy NASDAQ index vs. the S&P 500 & Russell 2000.
QQQ ETF – Invesco QQQ Trust ETF’s Technical Performance Over The Past Year
Their day-by-day results were quite similar to SPY’s, although Monday & Tuesday were both days of slight gains that remained in last week’s consolidation range, before Wednesday & Thursday’s major bullish sessions & Friday’s spinning top candlestick.
QQQ’s RSI is overbought at 71.36 & their past week’s volume followed a similar pattern to SPY’s.
Their MACD is also currently bullish, but beginning to show signals of rolling over bearishly in the coming days.
QQQ has support at the $332.51 (Volume Sentiment: Sellers, 3.2:1) , $328.05 (10 day moving average; Volume Sentiment: Sellers, 1.8:1), $315.99 (50 day moving average; Volume Sentiment: Sellers, 3.64:1) & $312.16/share (Volume Sentiment: Sellers, 3.64:1) price levels, with resistance at the $346.78 (Volume Sentiment: Buyers, 1.31:1), $368.99 (Volume Sentiment: Buyers, 0.75:0*), $375.07 (Volume Sentiment: Sellers, 1:0*) & $378.49/share (Volume Sentiment: Buyers, 1.33:1) price levels.
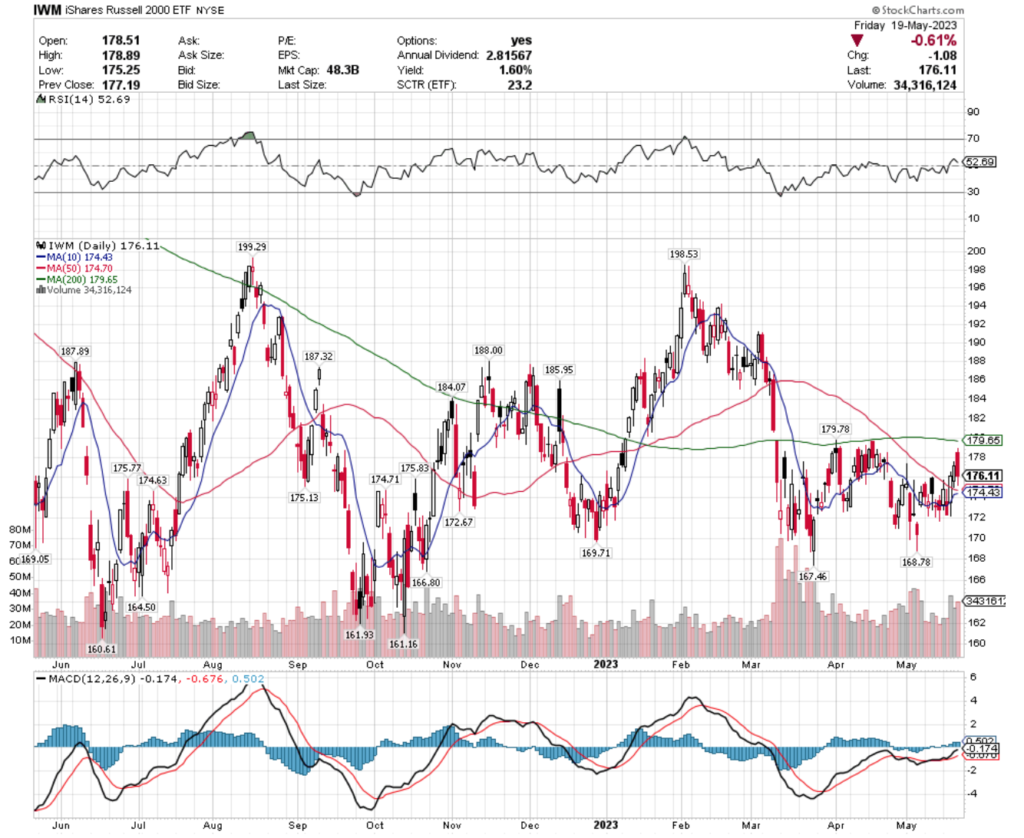
IWM, the iShares Russell 2000 ETF gained +1.96% over the past week, as investors showed more favor to smaller cap stocks than the S&P 500 index, but still were not able to perform as strongly as the NASDAQ names.
IWM ETF – iShares Russell 2000 ETF’s Technical Performance Over The Past Year
They too kicked off the first two days of the week in the same range as last week, before Wednesday & Thursday produced big gains, which were brought back to reality during Friday’s session.
Their RSI is neutral at 52.69, with volumes becoming above average compared to the year prior from Wednesday through Friday of this past week.
Their MACD is also bullish, but beginning to signal that it may roll over bearishly in the coming sessions.
IWM has support at the $175.83 (Volume Sentiment: Buyers, 1.45:1) , $175.77 (Volume Sentiment: Buyers, 1.45:1), $174.71 (Volume Sentiment: Buyers, 1.45:1) & $174.70/share (50 day moving average; Volume Sentiment: Buyers, 1.45:1 ) price levels, with resistance at the $179.65 (200 day moving average; Volume Sentiment: Buyers, 1.84:1), $179.78 (Volume Sentiment: Buyers, 1.84:1), $184.07 (Volume Sentiment: Buyers, 1.75:1) & $185.95/share (Volume Sentiment: Buyers, 1.75:1) price levels.
Let’s dive into some of the best & worst performing sectors, industries & geo-locations based on our technical analysis ratings of their relevant ETFs!
Semiconductors (SOXL), Argentina (ARGT), Germany (EWG) & Telecommunication Services (FCOM) Are All Bullishly Leading The Market
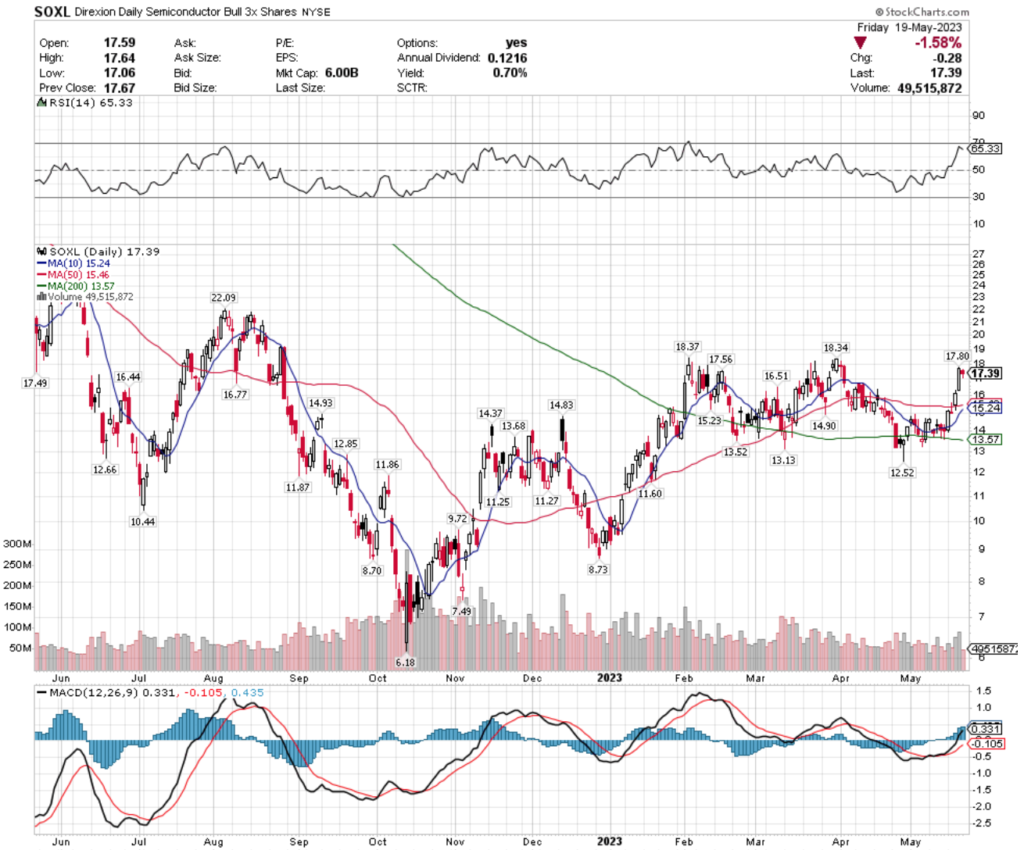
SOXL ETF – Direxion Daily Semiconductor Bull 3x Shares ETF’s Technical Performance Over The Past Year
They had a very strong week last week, climbing +23.33% during the course of the past five trading sessions.
Their RSI is nearing overbought at 65.33 & recent trading volumes have been below average compared to the year prior, signaling that investors & traders still are feeling uncertain as to where they value SOXL’s shares.
Their MACD is bullish, with their 10 day moving average poised to cross bullishly through their 50 day moving average in the next trading session.
Given their technicals & broader market volatility, it would be wisest to watch their behavior around their support levels, while using a defensive options strategy as insurance, as their 0.7% distribution yield for long-term holders does not provide much cushion against losses.
SOXL has support at the $16.77, $16.51, $16.44 & $15.46/share (50 day moving average) price levels, with resistance at the $17.49, $17.56, $17.80 & $18.34/share price levels.
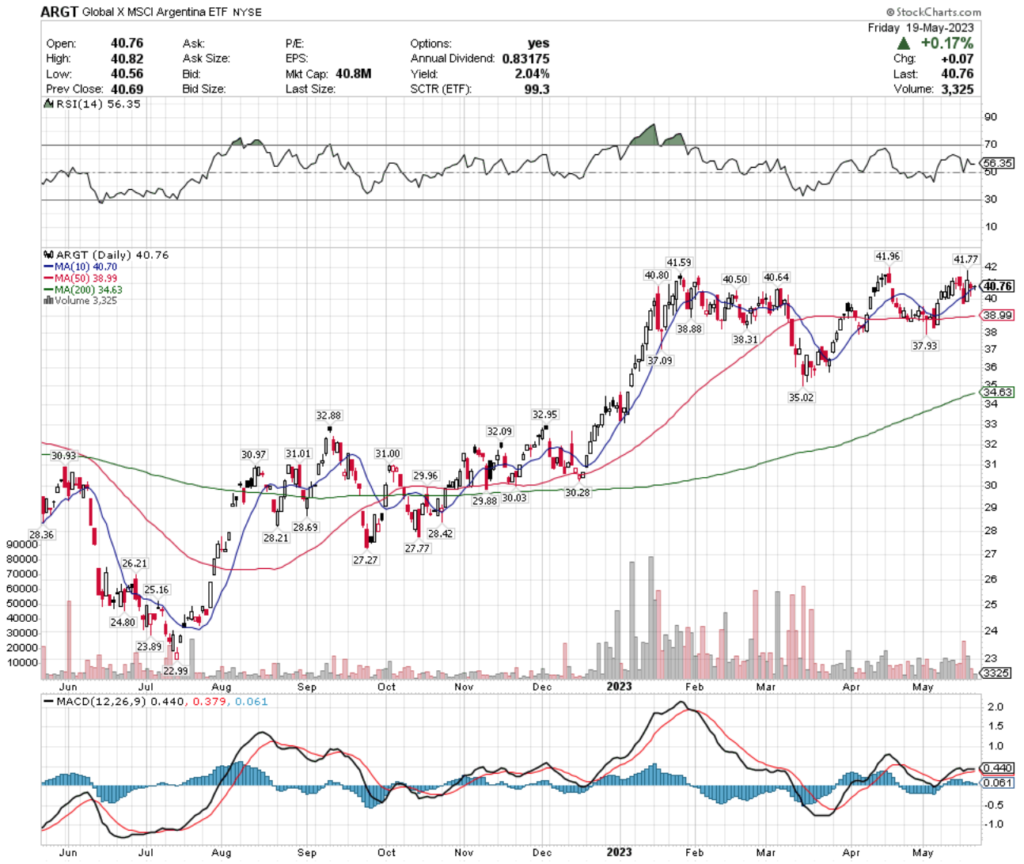
ARGT, the Global X MSCI Argentina ETF has gained +41.58% over the past year, posting a +75.01% gain since their 52-week low in July of 2022 (ex-distributions).
ARGT ETF – Global X MSCI Argentina ETF’s Technical Performance Over The Past Year
Their last two sessions have had hanging man/spinning top candlesticks, which is signaling a bearish near-term outlook for ARGT.
Their MACD is signaling a bearish crossover is imminent & their RSI is bearishly moving back towards the neutral point of 50.
Trading volumes for the first three sessions of the week looked above/about average compared to the year prior, but the last two sessions produced limited volume, signaling caution among investors on ARGT.
While they provide a 2.04% distribution yield for long-term holders, a defensive options strategy such as buying puts or selling calls would be wiser than entering a long position now, while waiting to see how their price behaves around their support levels in the near-term.
ARGT has support at the $40.70 (10 day moving average), $40.64, $40.50 & $38.99/share (50 day moving average) price levels, with resistance at the $40.80, $41.59, $41.77 & $41.96/share price levels.
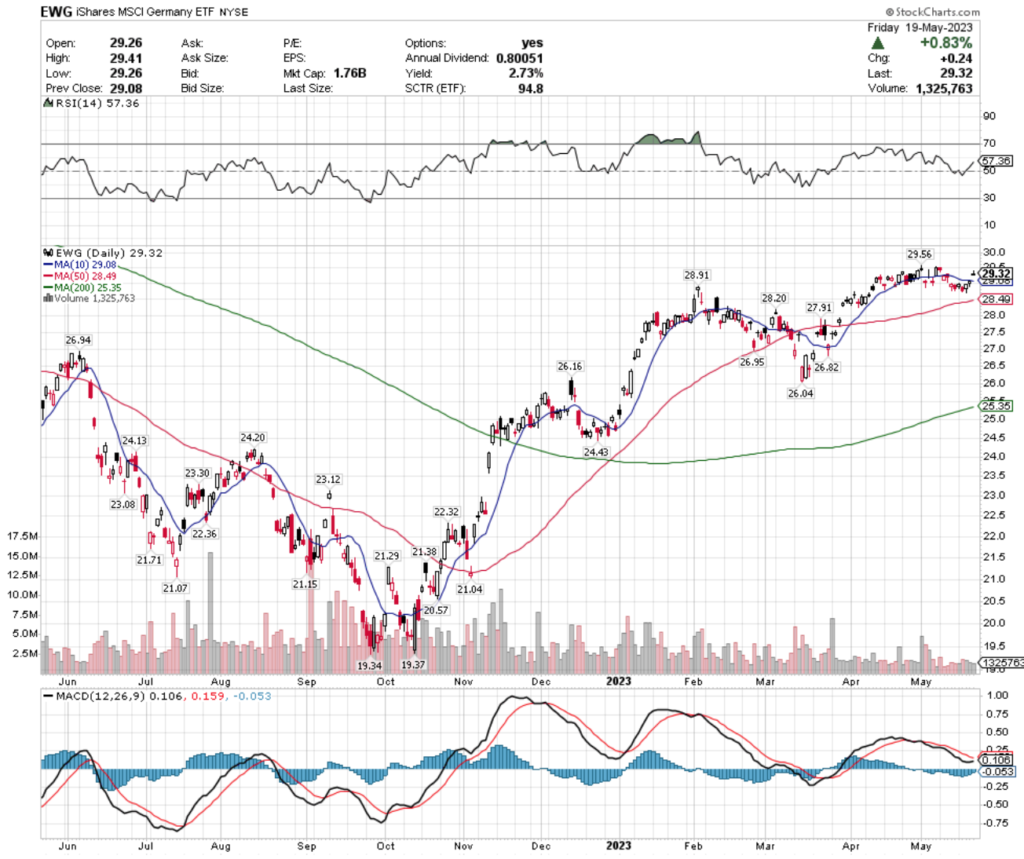
EWG, the iShares MSCI Germany ETF has improved +15.8% over the past year, climbing +51.52% since their 52-week low in September of 2022 (ex-distributions).
EWG ETF – iShares MSCI Germany ETF’s Technical Performance Over The Past Year
Their MACD is currently bearish, but moving towards a bullish crossover in the coming sessions, but a shooting star candlestick from Friday’s session shows that there may be a consolidation coming in the near-term.
Their RSI is on the overbought end of neutral at 57.36, and recent trading volumes have been below average, confirming that uncertainty that investors are feeling regarding their share price.
EWG offers a 2.73% distribution yield for long-term holders which will provide some cushion against losses, but trading options around their current price levels will provide a better form of insurance while waiting to see how they behave at key support levels in the near-term.
EWG has support at the $29.08 (10 day moving average), $28.91, $28.49 (50 day moving average) & $28.20/share price levels, with resistance at the $29.56, $29.86, $30.26 & $30.84/share price levels.
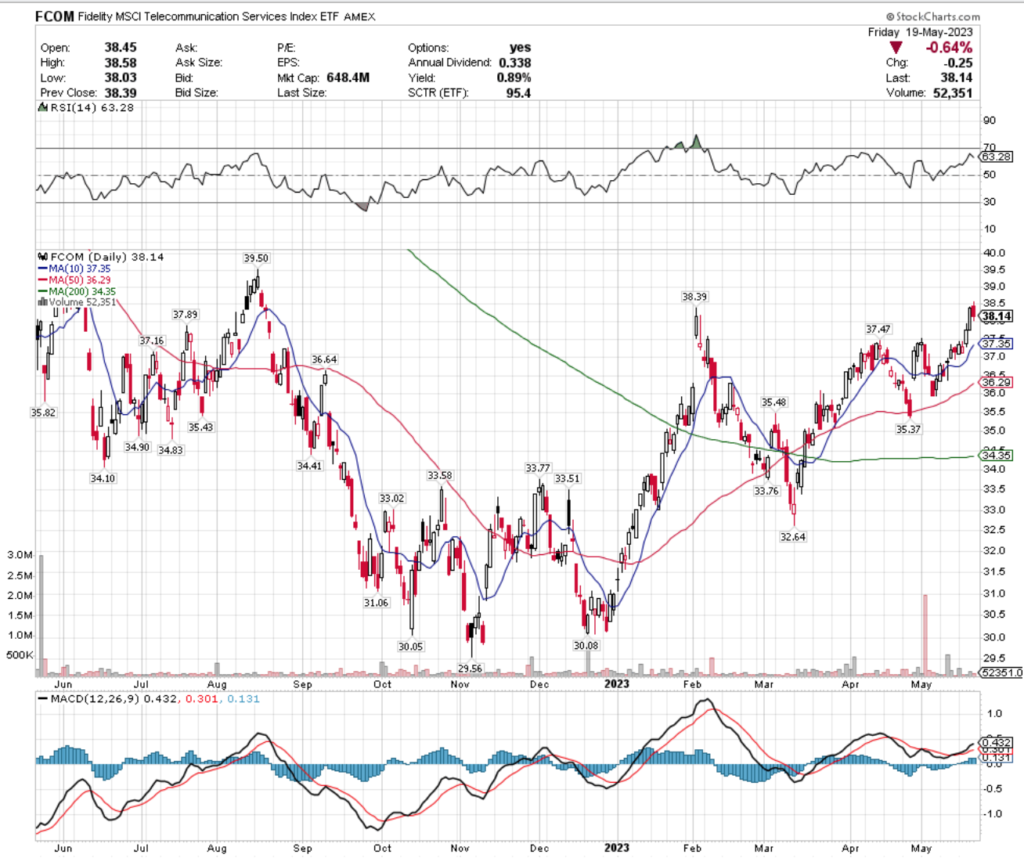
FCOM ETF – Fidelity MSCI Telecommunication Services Index ETF’s Technical Performance Over The Past Year
Friday’s session has caused their MACD to begin taking a turn towards a bearish crossover in the coming sessions, but this past week’s volume was also subpar compared to the year prior.
Their RSI is moving back towards neutral from a more overbought position earlier in the week.
Their modest 0.89% distribution yield will not provide much protection against losses, making an options strategy the best bet while waiting to see where to enter a long-term position.
FCOM has support at the $37.89, $37.47, $37.35 (10 day moving average) & $37.16/share price levels, with resistance at the $38.39, $39.35, $39.50 & $40.73/share price levels.
Regional Banking (KRE), Clean Energy (PBW), Metals & Mining (XME) & Turkey (TUR) Are All Bearishly Lagging The Market
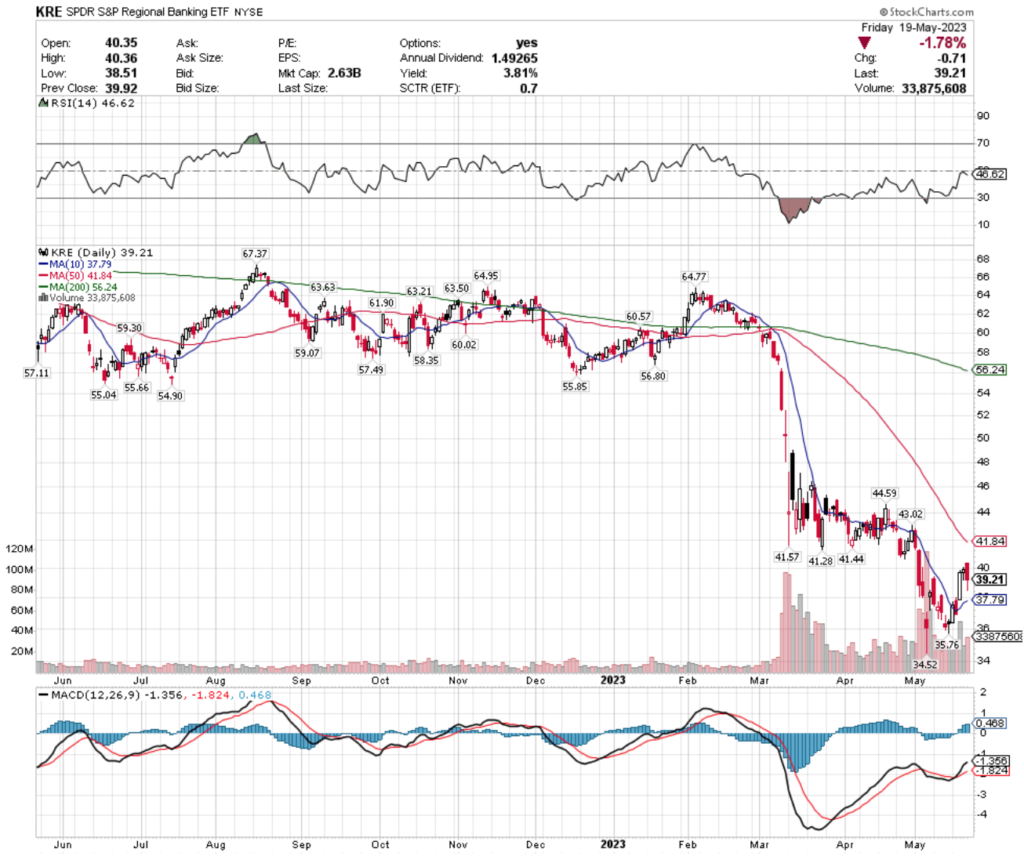
KRE, the SPDR S&P Regional Banking ETF has lost -32.8% over the past year, losing -43% from their 52-week high in August of 2022, but recovering +13.59% from their 52-week low in May of 2023 (ex-distributions).
KRE ETF – SPDR S&P Regional Banking ETF’s Technical Performance Over The Past Year
After a small rebound early in the week, an ominous hanging man candle concluded the week on both Thursday & Friday, signaling that investors are not feeling optimistic on their share price in the near-term.
Their MACD is bullish, but beginning to curl over bearishly & their RSI bounced off of neutral earlier in the week, but has begun bearishly declining again.
While volumes are above average compared to the year prior, they are below average for the last few months, which is when regional banks began to get in trouble, showing more uncertainty among investors.
KRE offers a 3.81% distribution yield, which is a decent cushion against losses for long-term holders, but any position should be accompanied by an options strategy in the near-term, as we wait to see how these banks fare.
KRE has support at the $37.79 (10 day moving average), $35.76 & $34.52/share price levels, with resistance at the $41.28, $41.44, $41.57 & $41.84/share (50 day moving average) price levels.
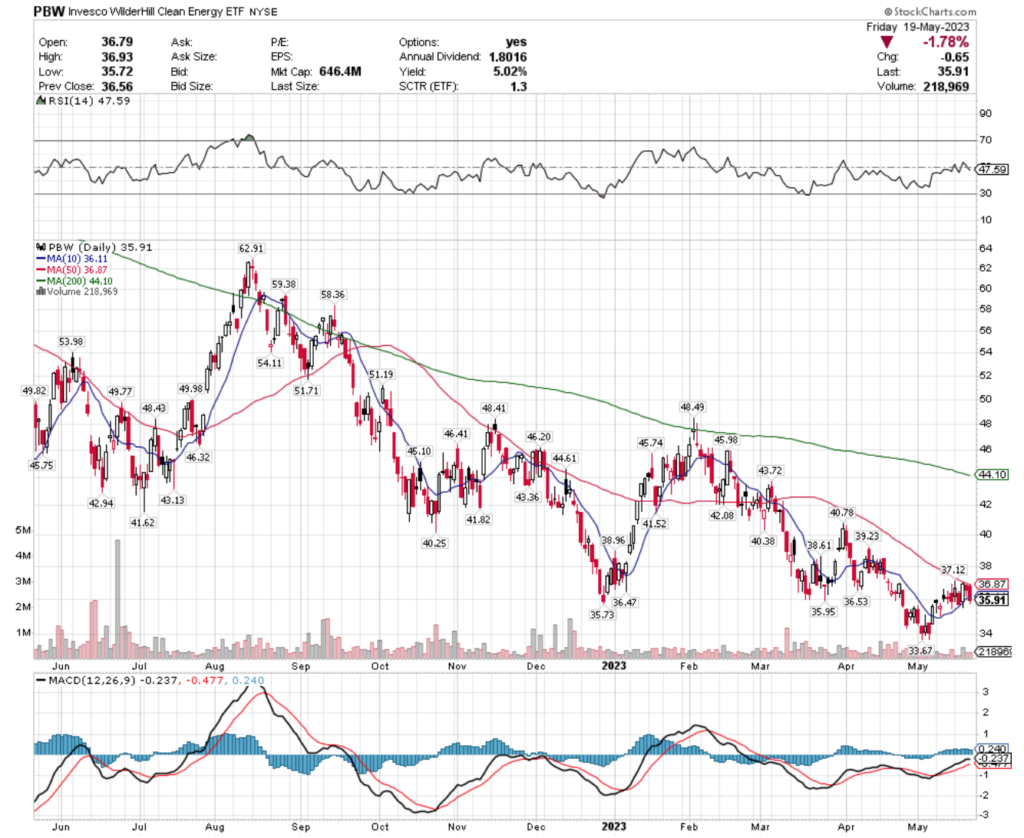
PBW, the Invesco WilderHill Clean Energy ETF has fallen -24.88% over the past year, losing -44.85% since their 52-week high in August of 2022, while recovering +6.65% since their 52-week low in May of 2023 (ex-distributions).
PBW ETF – Invesco WilderHill Clean Energy ETF’s Technical Performance Over The Past Year
Their MACD is signaling that momentum is being lost, with their RSI beginning to bearishly decline after crossing over the neutral 50 mark recently.
All of their candles for the past week have been consolidated in a tight range, with very weak volume, signaling that investors are still not confident in their price level.
Their 5.2% distribution yield is a decent cushion for long-term holders, but investors would be wise to wait & see how they behave at their existing support levels before buying long shares, unless they are employing an insurance policy using options.
PBW has support at the $35.73 & $33.67/share price levels, with resistance at the $35.95, $36.11, $36.53 & $36.87 (50 day moving average) price levels.
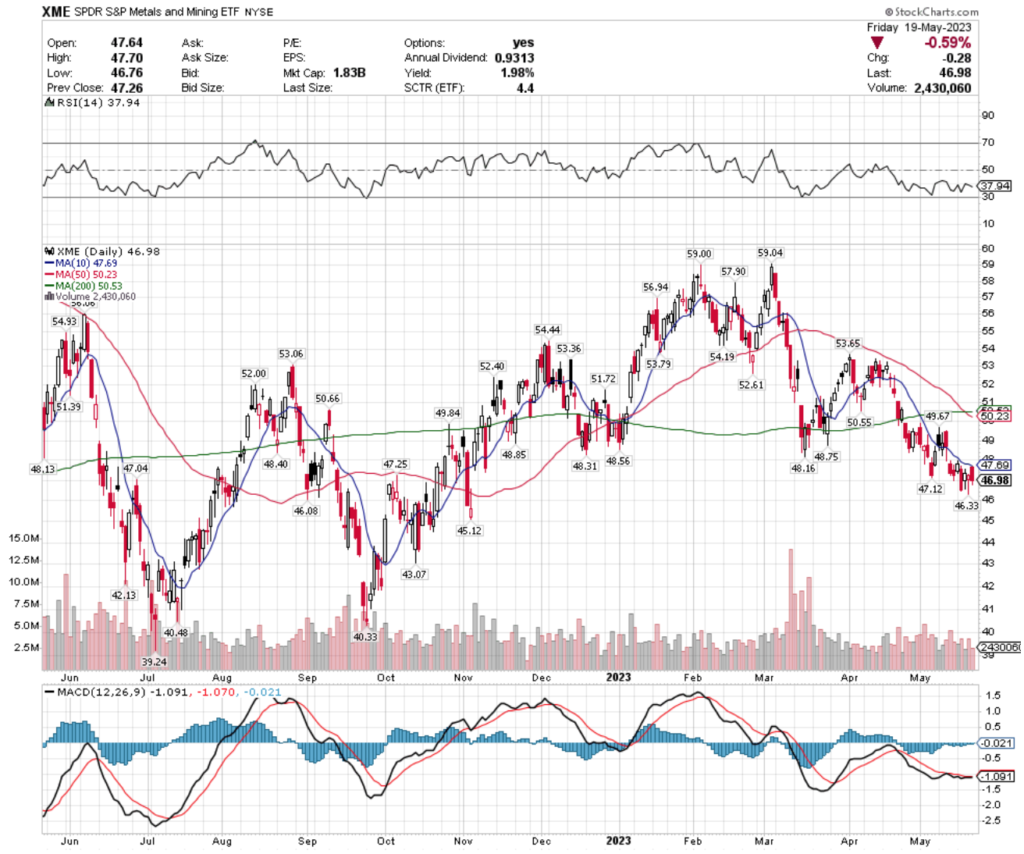
XME, the SPDR S&P Metals & Mining ETF has dropped -5.26% over the past year, losing -20.7% since their 52-week high in March of 2023, but has recovered +17.95% since their 52-week low in July of 2022 (ex-distributions).
XME ETF – SPDR S&P Metals & Mining ETF’s Technical Performance Over The Past Year
After a recent death cross last week, their MACD has been unable to manage a bullish crossover & has moved relatively flat for the past couple of weeks.
Their RSI is moving towards the oversold level of 30, with recent trading volumes being about average compared to the year prior.
Their price has spent the past week consolidated in a narrow range, signaling uncertainty among investors.
XME offers a 1.98% distribution yield for long-term holders, but that provides limited insurance against losses, calling for a defensive options strategy to be in place while waiting out to see how their support levels hold up in the near-term.
XME has support at the $46.33, $46.08, $45.12 & $43.07/share price levels, with resistance at the $47.04, $47.12, $47.25 & $47.69/share (10 day moving average) price levels.
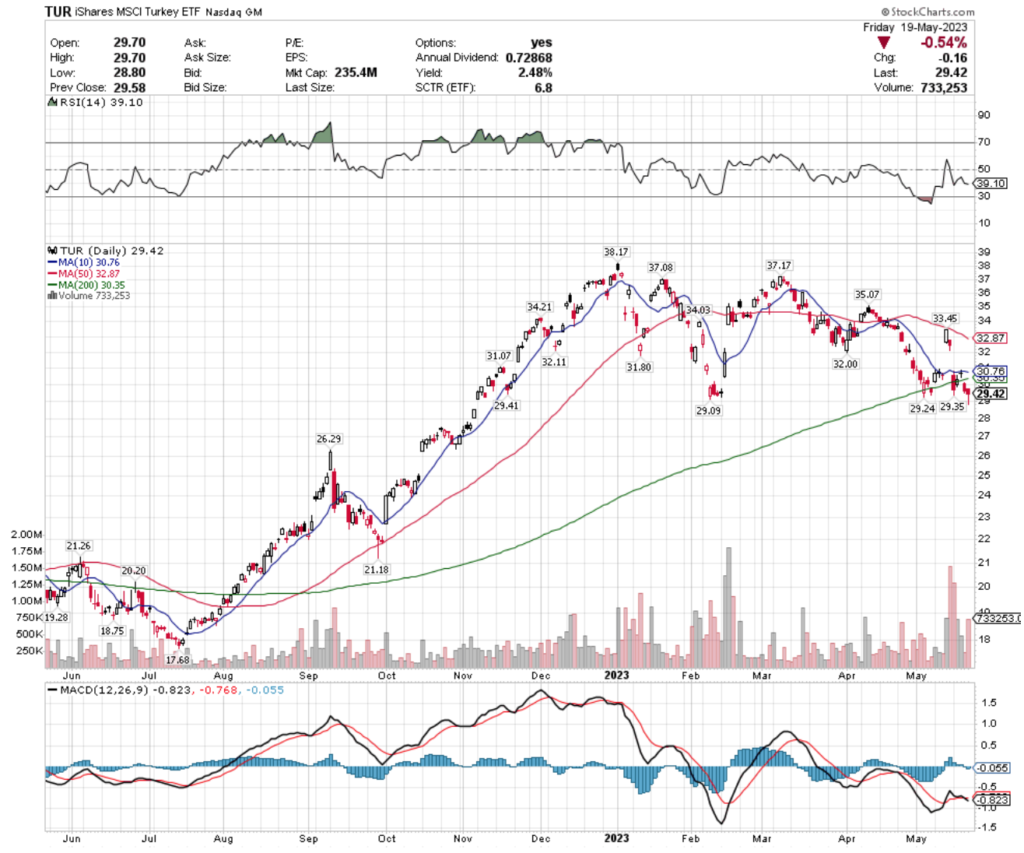
TUR, the iShares MSCI Turkey ETF has gained +50.1% over the past year, including a +66% gain since their 52-week low in July of 2022, but has fallen -22.92% since their 52-week high achieved in the first trading session of 2023 (ex-distributions).
TUR ETF – iShares MSCI Turkey ETF’s Technical Performance Over The Past Year
Their MACD is bearish, as is their RSI which is trending its way back towards the oversold mark at 30.
Recent trading volumes have been above average compared to the year prior, signaling that investors think that their price level is valued below their two day gap up range that they tried to establish earlier in May.
With a 2.48% cushion for protection against losses from their distribution yield, there are other gaps that need to be filled in the near-term that support levels may not be able to protect.
TUR has support at the $29.41, $29.35, $29.24 & $29.09/share price levels, with resistance at the $30.35 (200 day moving average), $30.76 (10 day moving average), $31.07 & $31.80/share price levels.
Tying It All Together
This week is relatively quiet on the data front until Friday, compared to prior weeks in terms of the number of announcements.
Monday morning at 8:30 am St. Louis President James Bullard speaks, followed by San Francisco Fed President Mary Daly at 11 am & Atlanta Fed President Bostic & Richmond Fed President Barkin speaking at 11:05 am.
Monday’s earnings calls include Global-E Online, HEICO, Nordson & Zoom Video Communications.
Dallas Fed President Lorie Logan speaks at 9 am on Tuesday, followed by S&P Flash U.S. Services PMI & S&P Flash U.S. Manufacturing PMI data at 9:45 am & New Home Sales data at 10 am.
On Wednesday Fed Governor Waller speaks at 12:40 pm & at 2pm the Fed’s May FOMC Minutes are released.
Wednesday’s earnings calls include Nvidia, Abercrombie & Fitch, Digital Turbine, Kohl’s, Petco Health & Wellness, Snowflake, Splunk, The Children’s Place & more.
Thursday morning kicks off at 8:30 am with the GDP (second reading) & Initial Jobless Claims data, followed up with Richmond Fed President Barkin speaking at 9:50 am & at 10 am the Pending Home Sales data being reported.
Dollar Tree, 23andMe, Best Buy, Burlington Stores, Costco Wholesale, Deckers Outdoor, Gap, Manchester United, Nutanix, Pinduoduo, Ralph Lauren, Royal Bank of Canada, Titan Machinery, Toronto-Dominion Bank, Ulta Beauty, WMware, Workday & many other names will report earnings on Thursday.
Friday morning at 8:30 am we get the bulk of the week’s data reports, which include Durable-goods Orders, Durable-goods Minus Transportation, Person Income (nominal), Personal Spending (nominal), PCE Index, Core PCE Index, PCE (Y-o-Y), Core PCE (Y-o-Y), Advanced U.S. Trade Balance in Goods, Advanced Retail Inventories & Advanced Wholesale Inventories, with Consumer Sentiment (final) data coming in at 10 am.
Friday’s earnings calls conclude with Big Lots, Booz Allen Hamilton, Buckle & Hibbett reporting.
See you back here next week!
***I DO NOT OWN SHARES OR OPTIONS CONTRACT POSITIONS IN SPY, QQQ, IWM, SOXL, ARGT, EWG, FCOM, KRE, PBW, XME or TUR AT THE TIME OF PUBLISHING THIS ARTICLE***
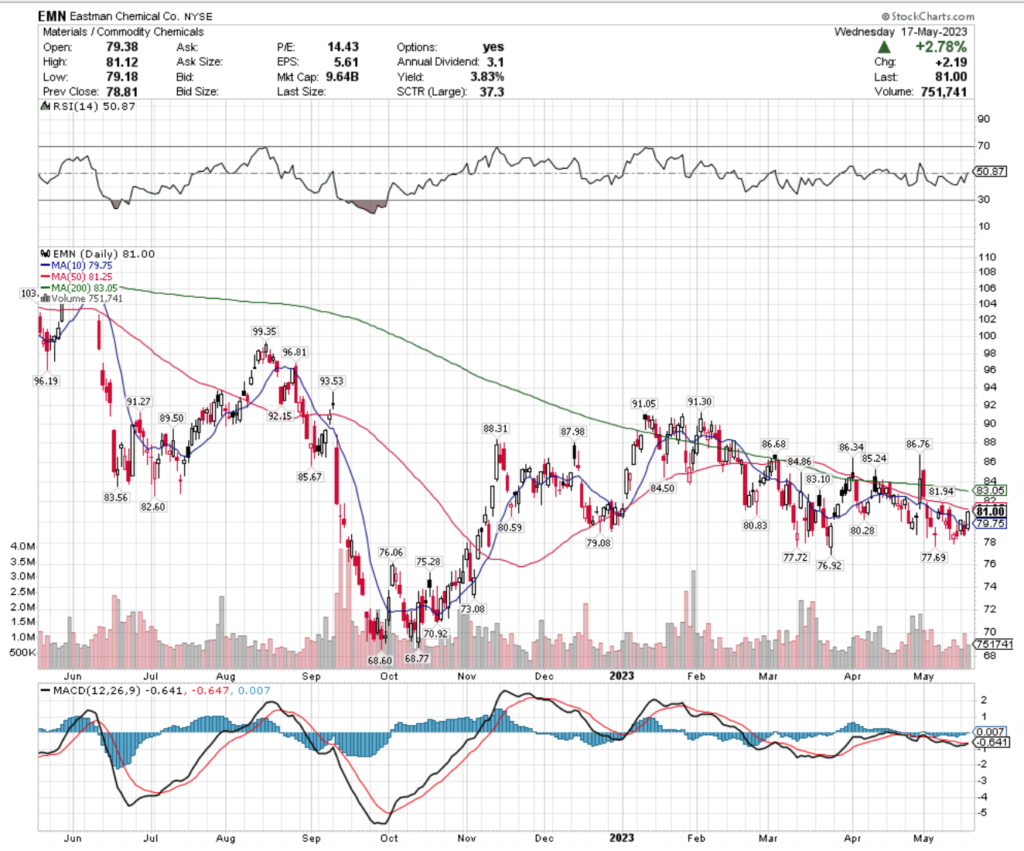
Eastman Chemical Co. stock trades under the ticker EMN & has shown recent bullishness that traders & investors should look deeper into to find opportunities for when market volatility has subsided.
EMN stock closed at $81.00/share on 5/17/2023.
Eastman Chemical CO. EMN Stock’s Technical Performance Broken Down
Eastman Chemical CO. EMN Stock’s Technical Performance Over The Past Year
EMN Stock Price: $81.00
10 Day Moving Average: $79.75
50 Day Moving Average: $81.25
200 Day Moving Average: $83.05
RSI: 50.87
MACD: -0.641, -0.647, 0.007
Yesterday, EMN stock completed a bullish MACD crossover, gaining +2.78% on the day’s session.
Their RSI is neutral at 50.87 & recent trading volumes have been about average compared to the year prior.
Investors would be wise to watch how they behave around their support levels in the near-term while planning an entry point for when markets have become less volatile, while traders can use options in the meantime to profit from their price movements.
EMN stock has support at the $80.83, $80.59, $80.28 & $79.75/share (10 day moving average) price levels, with resistance at the $81.25 (50 day moving average), $81.94, $82.60 & $83.10/share price levels.
Eastman Chemical CO. EMN Stock As A Long-Term Investment
Long-term oriented investors will like EMN stock’s 14.86 P/E (ttm) & their 1.95 P/B (mrq).
They recently reported -11.1% Quarterly Revenue Growth Y-o-Y, with -43% Quarterly Earnings Growth Y-o-Y, which should be looked further into before making an investment.
Their balance sheet will also require a more thorough review, with $559M of Total Cash (mrq) & $5.74B of Total Debt (mrq).
EMN stock pays a 3.93% dividend, which appears it should be sustainable in the long-run, with a 54.67% payout ratio.
86.2% of EMN stock’s outstanding share float is owned by institutional investors.
Eastman Chemical CO. EMN Stock As A Short-Term Trade Using Options
Traders with shorter time horizons can use options to profit from EMN stock’s price movements, while protecting their portfolios from volatility.
I am looking at the contracts with the 6/16 expiration date.
The $80, $75 & $70 call options are in-the-money, listed from highest to lowest level of open interest.
The $85, $90 & $100 puts are also all in-the-money, with the former being more liquid than the latter strikes.
Tying It All Together
EMN stock has many interesting characteristics that traders & investors will find appealing.
Investors will like their dividend yield & valuation metrics, but will want to research further into their balance sheet & recent growth metrics.
Traders will like their recent technical performance & relatively liquid options.
All-in-all, it is worth taking a closer look into EMN stock to see how it fits into your portfolio strategy for when market volatility has died down.
*** I DO NOT OWN SHARES OR OPTIONS CONTRACT POSITIONS IN EMN STOCK AT THE TIME OF PUBLISHING THIS ARTICLE ***
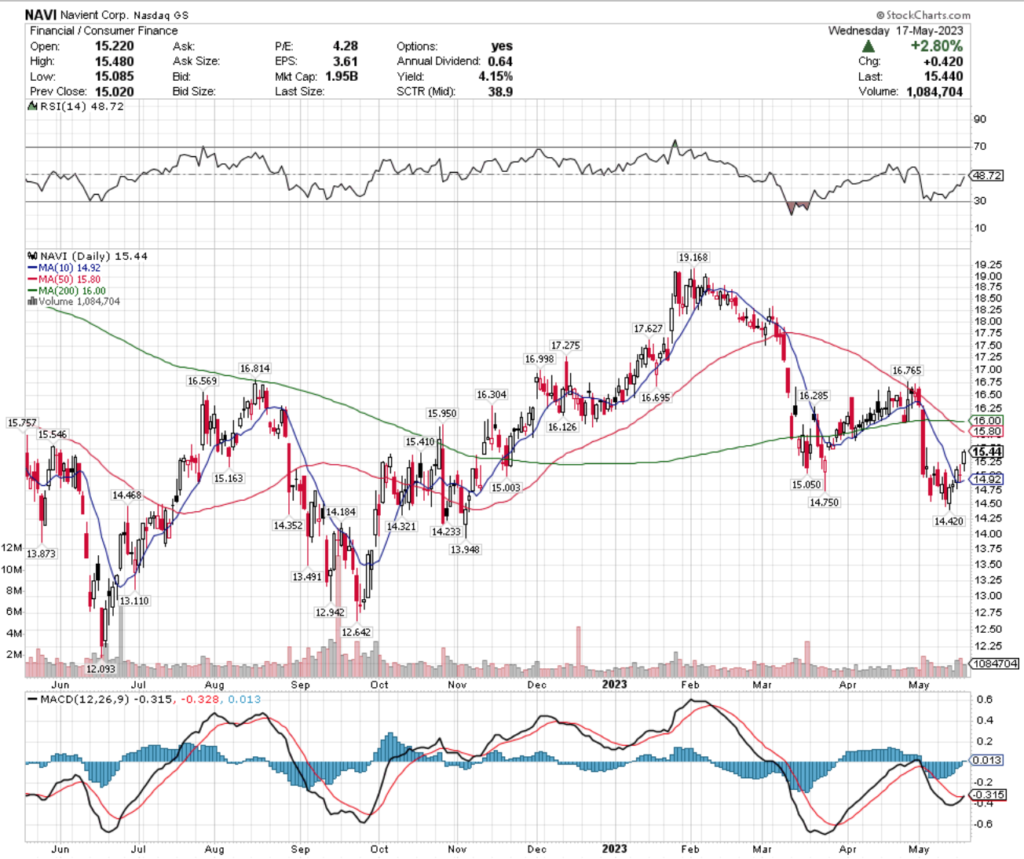
Navient Corp. stock trades under the ticker NAVI & has shown recent bullishness that traders & investors should research further into for when market volatility has subsided.
NAVI stock closed at $15.44/share on 5/17/2023.
Navient Corp. NAVI Stock’s Technical Performance Broken Down
Navient Corp. NAVI Stock’s Technical Performance Over The Past Year
NAVI Stock Price: $15.44
10 Day Moving Average: $14.92
50 Day Moving Average: $15.80
200 Day Moving Average: $16.00
RSI: 48.72
MACD: -0.315, -0.328, 0.013
Yesterday, NAVI stock completed a bullish MACD crossover, gaining +2.8% on the day’s session.
Their RSI is in neutral range at 48.7, with recent trading volumes being average/just below average compared to the year prior.
Investors would be wise to watch how NAVI stock behaves around its support levels in the coming weeks to plan where to enter once the markets have become less volatile, while traders can use options in the meantime to profit from the swings in their price level.
NAVI has support at the $15.41, $15.16, $15.05 & $15 price levels, with resistance at the $15.55, $15.76, $15.80 (50 day moving average) & $15.95/share price levels.
Navient Corp. NAVI Stock As A Long-Term Investment
Long-term focused investors will like NAVI stock’s 4.46 P/E (ttm), as well as their 0.7 P/B (mrq).
They recently reported -38.2% Quarterly Revenue Growth Y-o-Y, with -56.5% Quarterly Earnings Growth Y-o-Y, which investors will want to research deeper into before investing.
Their balance sheet will also require a more thorough review, with $643M of Total Cash (mrq) & $63.37B of Total Debt (mrq).
NAVI stock pays a 4.26% dividend, which appears to be sustainable in the long-run, as their payout ratio is 17.39%.
96.38% of NAVI stock’s outstanding share float is owned by institutional investors.
Navient Corp. NAVI Stock As A Short-Term Trade Using Options
Short-term oriented traders can use options to profit from NAVI stock’s price movements, while protecting their portfolios from volatility.
NAVI stock has limited liquidity in their near-term options prices.
The for call options, the $15 5/19 expiration dated contracts, $15 6/16 expiration dated contracts & $15 7/21 dated contracts are all in-the-money.
For puts, currently the only in-the-money strike price are the $17.50 puts that expire on 7/21.
Tying It All Together
NAVI stock has many interesting characteristics that traders & investors should research further into for when markets become less volatile.
Investors will like their valuation metrics & dividend yield, but may want to look into their recent growth metrics, as well as their balance sheet before investing.
Traders will like their recent technical performance, but will be disappointed by the current, less than liquid state of their options.
Overall, it is worth taking a closer look at NAVI stock to see how it fits into your portfolio strategy.
*** I DO NOT OWN SHARES OR OPTIONS CONTRACTS IN NAVI STOCK AT THE TIME OF PUBLISHING THIS ARTICLE ***
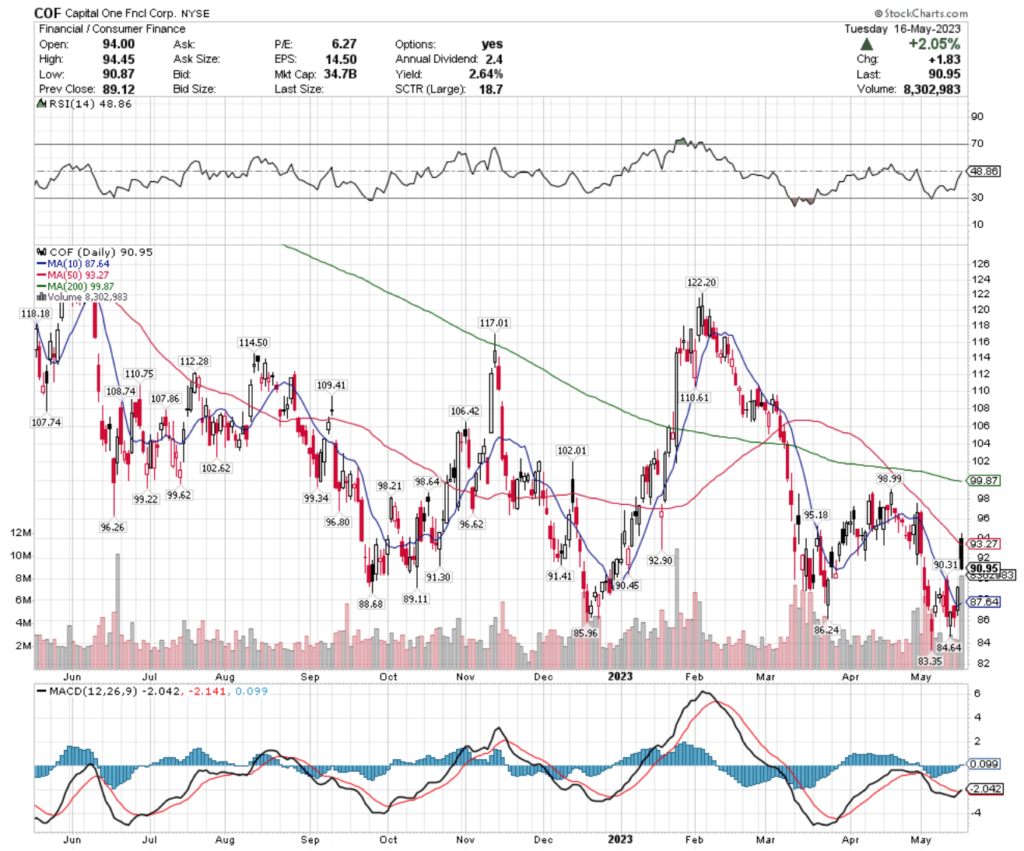
Capital One Financial Corp. stock trades under the ticker COF & has shown recent bullishness that traders & investors should research further into for when market volatility has calmed down.
COF stock closed at $90.95/share on 5/16/2023.
Capital One Financial Corp. COF Stock’s Technical Performance Broken Down
Capital One Financial Corp. COF Stock’s Technical Performance Over The Past Year
COF Stock Price: $90.95
10 Day Moving Average: $87.64
50 Day Moving Average: $93.27
200 Day Moving Average: $99.87
RSI: 48.86
MACD: -2.042, -2.141, 0.099
Yesterday, COF stock completed a bullish MACD crossover, gapping up +2.05% on the day’s sessions.
Their RSI is slightly in the oversold end of neutral at 48.86, with their recent volumes being above average.
Yesterday’s session had a major volume spike, but closed -3.24% below the day’s open, signaling uncertainty in the near-term for COF stock’s price movements.
Investors are best off waiting to see how they behave at support levels in the next couple of weeks before entering a position, while traders can profit in that time using options strategies around the volatility.
COF has support at the $90.45, $90.31, $89.11 & $88.68/share price levels, with resistance at the $91.30, $91.41, $92.90 & $93.27/share (50 day moving average) price levels.
Capital One Financial Corp. COF Stock As A Long-Term Investment
Long-term oriented investors will like COF stock’s 5.43 P/E (ttm), as well as their 0.71 P/B (mrq).
They recently reported 18.5% Quarterly Revenue Growth Y-o-Y, with -60% Quarterly Earnings Growth Y-o-Y, which will need to be looked deeper into before making an investment.
Their balance sheet will require a more thorough review, with $48.14B of Total Cash (mrq) & $53.04B of Total Debt (mrq).
COF stock pays a 2.69% dividend, which appears to be sustainable in the long-run, as their payout ratio is 16.44%.
90.54% of COF stock’s outstanding share float is owned by institutional investors.
Capital One Financial Corp. COF Stock As A Short-Term Trade Using Options
Traders with shorter time horizons can trade options to profit from COF stock’s price movements, while protecting their portfolios from volatility.
I am looking at the contracts with the 6/16 expiration date.
The $85, $90 & $80 call options are all in-the-money, with the former being more liquid than the latter strikes.
The $100, $95 & $105 puts are also all in-the-money, listed from highest to lowest level of open interest.
Tying It All Together
Capital One Financial Corp. stock has many interesting attributes that traders & investors will find appealing.
Investors will like their valuation metrics, balance sheet & dividend yield, but may want to review the causes of their recent growth trouble before investing.
Traders will like their recent technical performance, as well as their liquid options.
All-in-all, it is worth taking a closer look into how COF stock fits into your portfolio strategy.
*** I DO NOT OWN SHARES OR OPTIONS CONTRACT POSITIONS IN COF STOCK AT THE TIME OF PUBLISHING THIS ARTICLE ***