Fox Corporation stock trades under the ticker FOX & has shown recent bullishness that traders & investors should take a closer look into.
FOX stock closed at $31.95/share on 9/19/2022.
Fox Corporation FOX Stock’s Technical Performance Broken Down
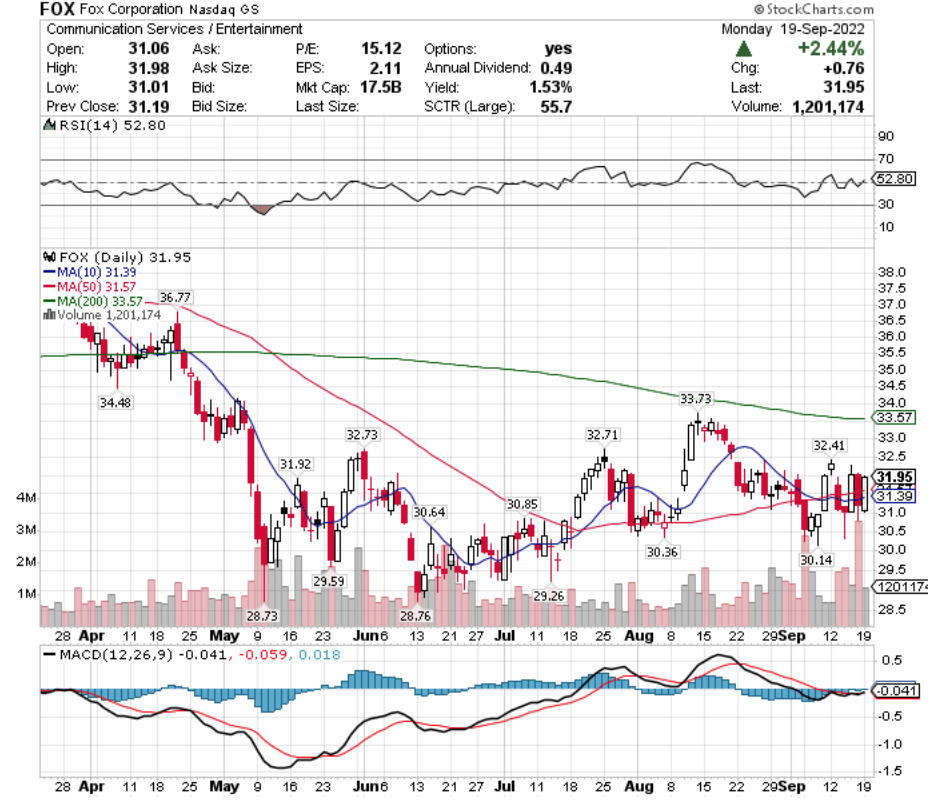
FOX Stock Price: $31.95
10 Day Moving Average: $31.39
50 Day Moving Average: $31.57
200 Day Moving Average: $33.57
RSI: 52.8
MACD: -0.041
Yesterday, FOX stock completed a bullish MACD crossover, settling just above its 50 day moving average.
Recent trading volumes have been above average compared to the year prior & their MACD is neutral, signaling that there may be a short-term momentum pump in the near-term (depending on macro market conditions).
They have support at $31.92 & $30.85/share as they try to break out & above the $32.41 & $32.71/share resistance levels.
Fox Corporation FOX Stock As A Long-Term Investment
Long-term oriented investors will like FOX stock’s valuation metrics, with a 14.78 P/E (ttm) & a 1.51 P/B (mrq).
They recently reported 4.9% Quarterly Revenue Growth Y-o-Y, with 20.9% Quarterly Earnings Growth Y-o-Y.
Their balance sheet also looks appealing, with $5.2B of Total Cash (mrq) & $7.72B of Total Debt (mrq).
FOX stock pays a 1.54% dividend, which appears stable in the long-run, as their payout ratio is 22.75%.
56.65% of FOX stock’s outstanding share float is owned by institutional investors.
Fox Corporation FOX Stock As A Short-Term Trade Using Options
Short-term focused traders can use options to profit from FOX stock’s price movements, while hedging their portfolio against volatility.
I am looking at the contracts with the 10/21 expiration date.
The $30 call options are in-the-money.
The $35 puts are also in-the-money.
There are other liquid strikes for calls & puts, however none of them are currently in-the-money.
Tying It All Together
FOX stock has many interesting attributes that traders & investors should research further into.
Investors will like their dividend yield, as well as their valuation metrics, and will find their balance sheet to be healthier than many alternatives.
Traders will like their current technical resilience, but may be disappointed in the liquidity of their options.
All-in-all, it is worth taking a closer look into FOX stock to see how it fits into your portfolio strategy.
*** I DO NOT OWN SHARES OF FOX STOCK AT THE TIME OF PUBLISHING THIS ARTICLE ***