Reynolds Consumer Products Inc. stock trades under the ticker REYN & has shown recent bullish behavior that traders & investors should look further into.
REYN stock closed at $26.89/share on 10/10/2022.
Reynolds Consumer Products Inc. REYN Stock’s Technical Performance Broken Down
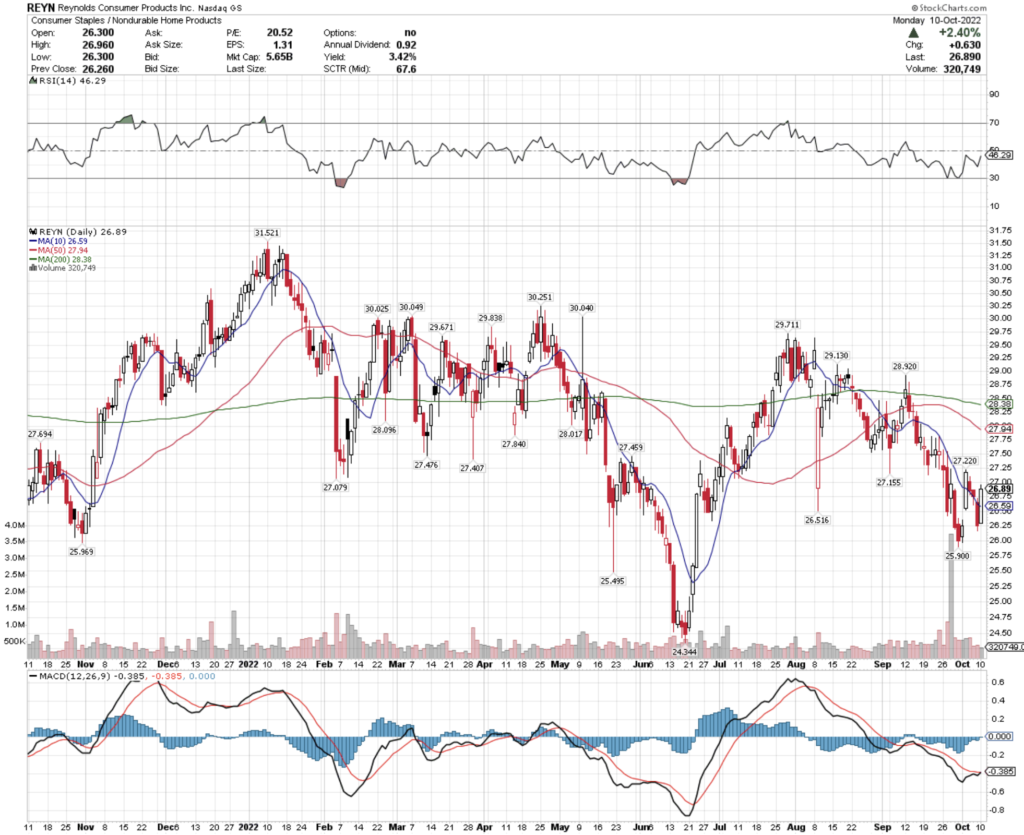
REYN Stock Price: $26.89
10 Day Moving Average: $26.59
50 Day Moving Average: $27.94
200 Day Moving Average: $28.38
RSI: 46.29
MACD: -0.385
Yesterday, REYN stock completed a bullish MACD crossover, breaking above their 10 day moving average.
Recent volumes have been on the lower side of average compared to the year prior & their RSI is neutral, signaling that there is still some uncertainty of their proper valuation in this volatile market, which may present favorable entry points in the near-future.
They have support at the $26.51 & $25.96/share price levels, as they try to break out & above the $27.07 & $27.15 resistance levels.
Reynolds Consumer Products Inc. REYN Stock As A Long-Term Investment
Long-term oriented investors will like REYN stock’s 20.5 P/E (ttm), but may find their 3.17 P/B (mrq) to be a bit rich.
They recently reported 5% Quarterly Revenue Growth Y-o-Y, despite -35% Quarterly Earnings Growth Y-o-Y, which investors may want to research further into.
Their balance sheet will also require a more thorough review, with $101M of Total Cash (mrq) & $2.15B of Total Debt (mrq).
REYN stock pays a 3.5% dividend, which may not be sustainable at such a high level in the long-run, as their payout ratio is 70.23%.
32.26% of REYN stock is owned by institutional investors.
Reynolds Consumer Products Inc. REYN Stock As A Short-Term Trade Using Options
Short-term focused traders can use options to profit from REYN stock’s price movements, while protecting their portfolios from volatility.
I am looking at the contracts with the 10/21 expiration date.
The $25 &$20 calls are in-the-money, with the former being more liquid than the latter.
The $30 puts are also in-the-money, with liquidity at the next out-of-the-money $25 strike as well (but will require a ~7% drop in 10 days to be in-the-money).
Tying It All Together
REYN stock has many interesting characteristics that traders & investors should find attractive.
Investors will like their dividend yield & valutation metrics, but may want to look into their balance sheet & its long-term impact on their payout ratio.
Traders will like their recent technical performance, but may be disappointed at the liquidity of their options.
Overall, it is worth taking a closer look into REYN stock to see how it fits into your portfolio strategy.
*** I DO NOT OWN SHARES OF REYN STOCK AT THE TIME OF PUBLISHING THIS ARTICLE ***