This past week saw a rebound for the markets, after starting 2022 off in a tumble.
Volumes still remain elevated compared to the year prior’s average, as traders are repositioning themselves into a rising interest rate environment.
Earnings calls are also going to continue into this week, which should shed more outlook into what companies are seeing for the upcoming year’s projections in a year already muddled with uncertainty.
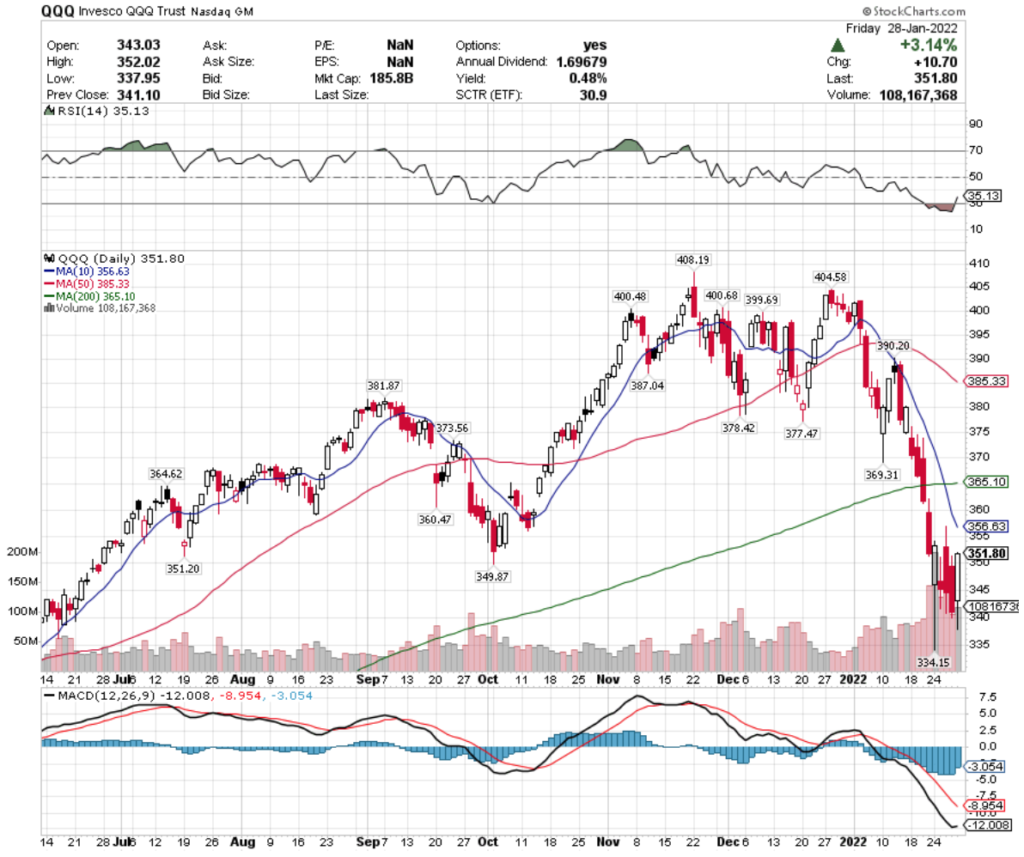
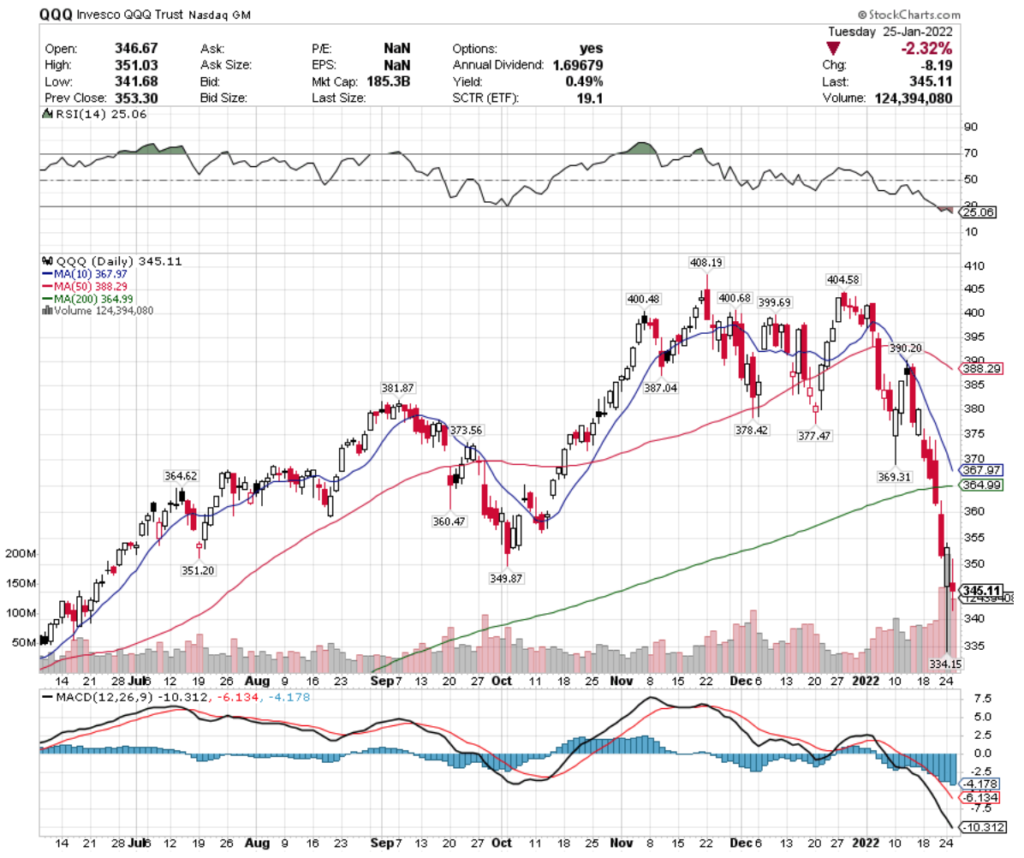
TQQQ, the ProShares UltraPro QQQ ETF that tracks the NASDAQ’s performance 3x began climbing back from recent losses, with Friday’s price breaking out above their 10 Day Moving Average.
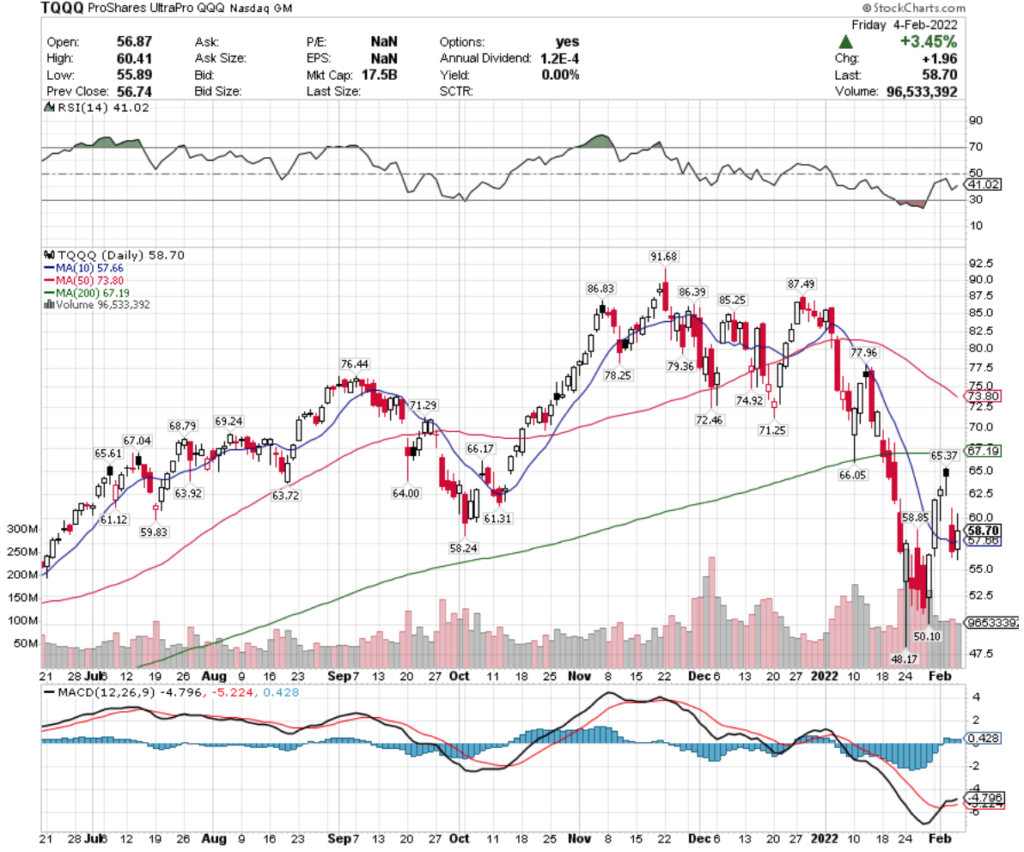
While its RSI is still oversold, as it creeps back to neutral keep an eye on the MACD, which while it is bullish currently, looks to be turning back over for a bearish crossover in the coming week.
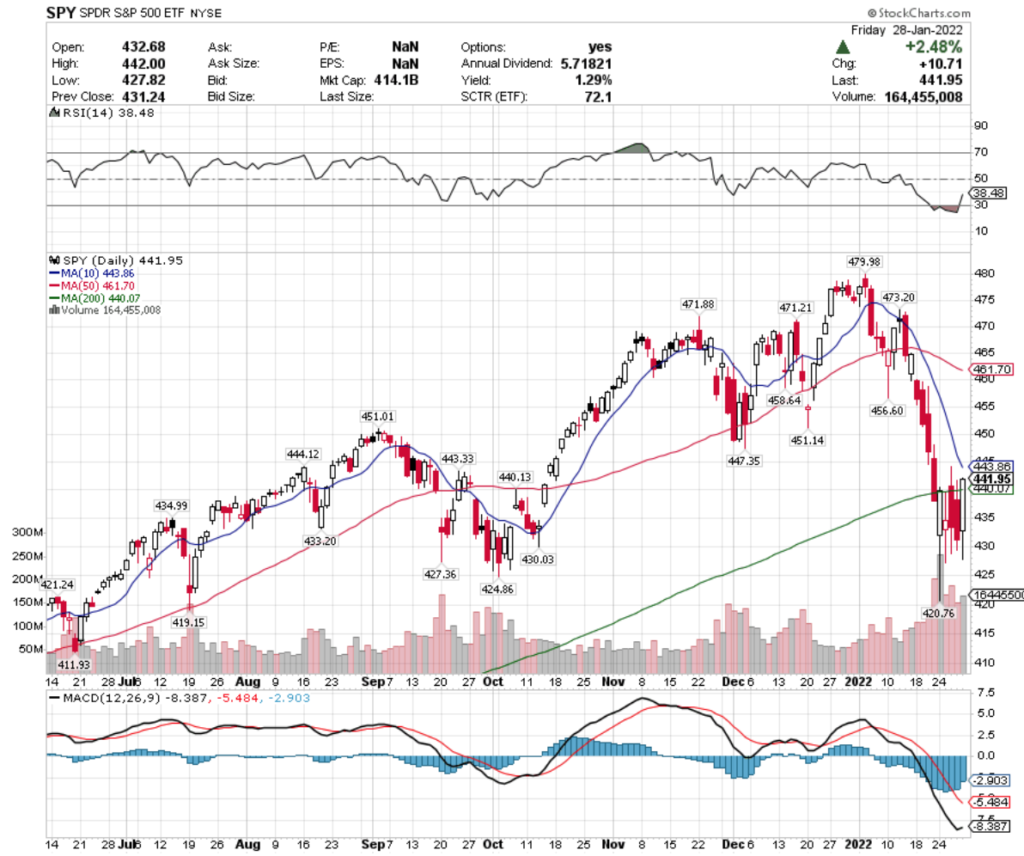
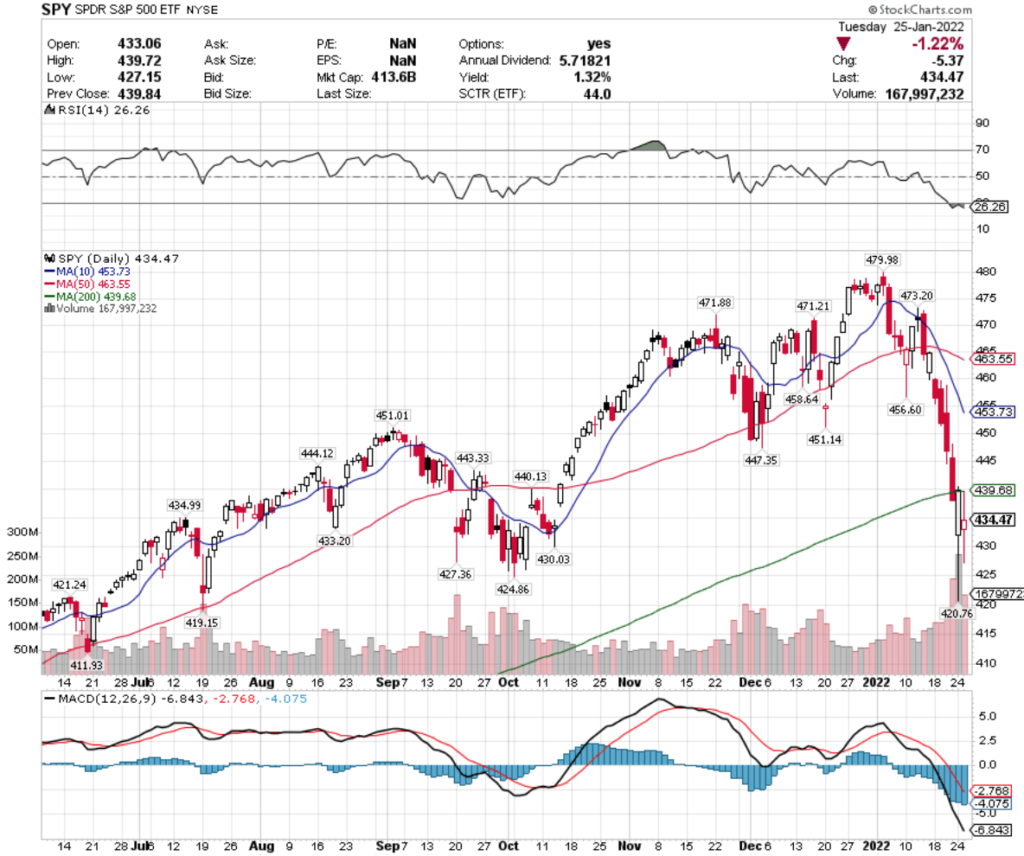
SPXL, the Direxion Daily S&P 500 Bull 3x Shares ETF is in a very similar position.
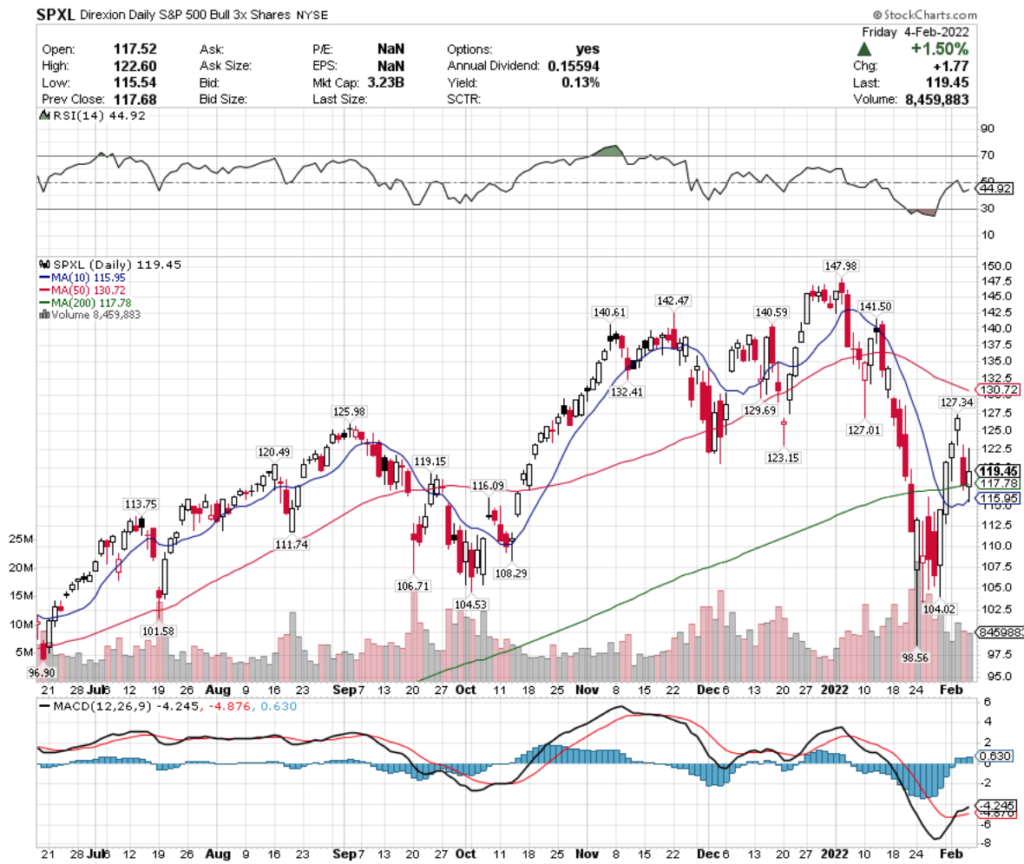
They’re slightly more bullish, but still signaling that there will be more near-term pain to come as their RSI approaches neutral.
Let’s hop into the leaders & laggards from this week’s data!
Gasoline (UGA), Natural Gas (FCG), Qatar (QAT) & Equities For Rising Rates (EQRR) All Leading The Pack
UGA, the United States Gasoline Fund, LP ETF has been on a great run since early December, gaining 40% in two months.
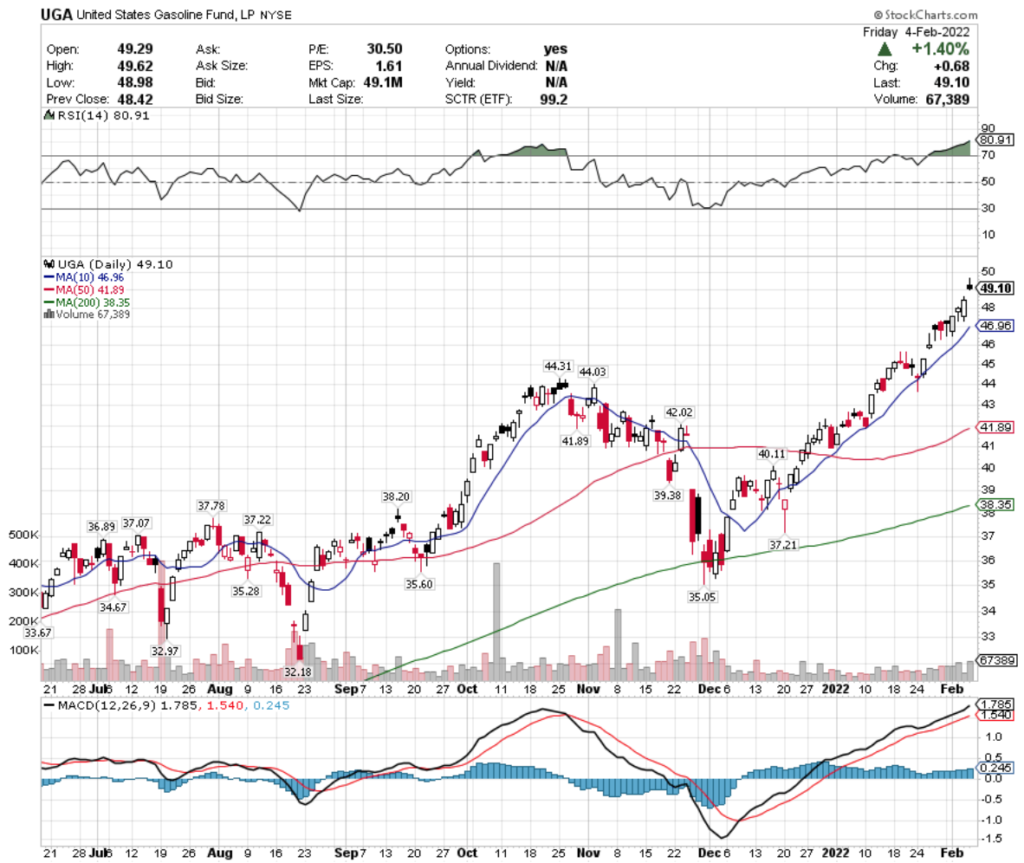
It’s no surprise that their RSI is heavily overbought at 80.91, but there looks to be more momentum in the tank for UGA.
I’ll be eyeing the MACD as the spread between the price & the 10 Day Moving Average grows narrower; the lighter than average recent volumes do signal some uncertainty at these high price levels.
FCG, the First Trust Natural Gas ETF has also been enjoying a nice run that began back in August of 2021; gaining 71%.
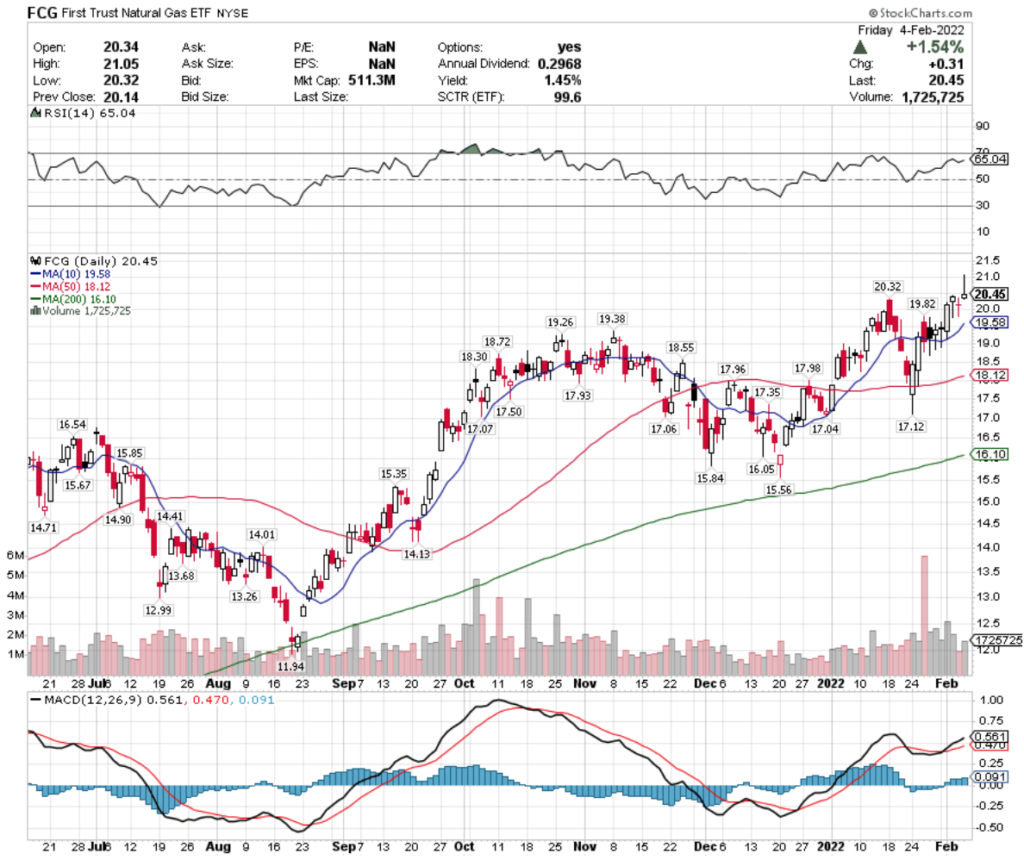
Their volumes continue to be strong, but momentum does look to be waning.
This makes sense given we are near the end of winter, and so far it looks like all perceived possible winter energy crises have been averted.
Given it is at a new high, expect to see a bit of a pullback around the $21-level as it establishes a new price range.
QAT, the iShares MSCI Qatar Capped ETF has climbed steadily over the last year.
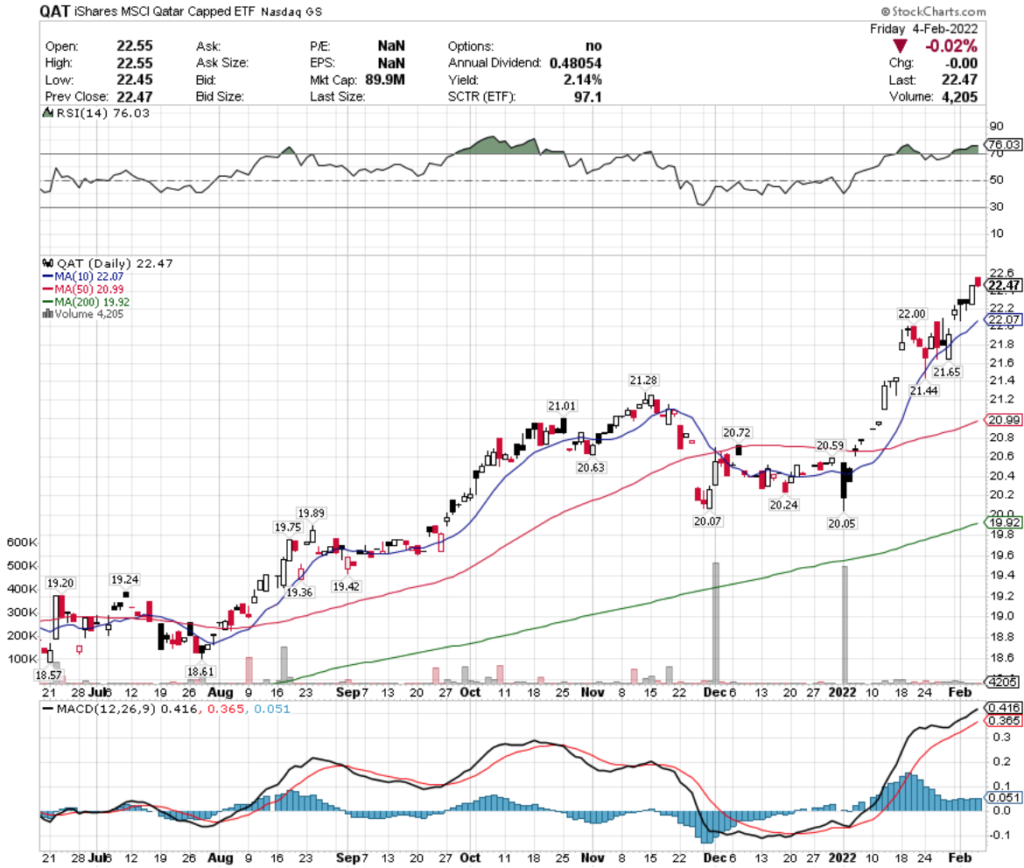
Their RSI is heavily overbought at 76; I am eyeing what happens as they try to cross above the $22.60/share mark, as their MACD is showing signs of losing momentum & rolling over bearishly.
EQRR, the ProShares Equities For Rising Rates ETF has been trading on above average volume coming into 2022, to no one’s surprise.
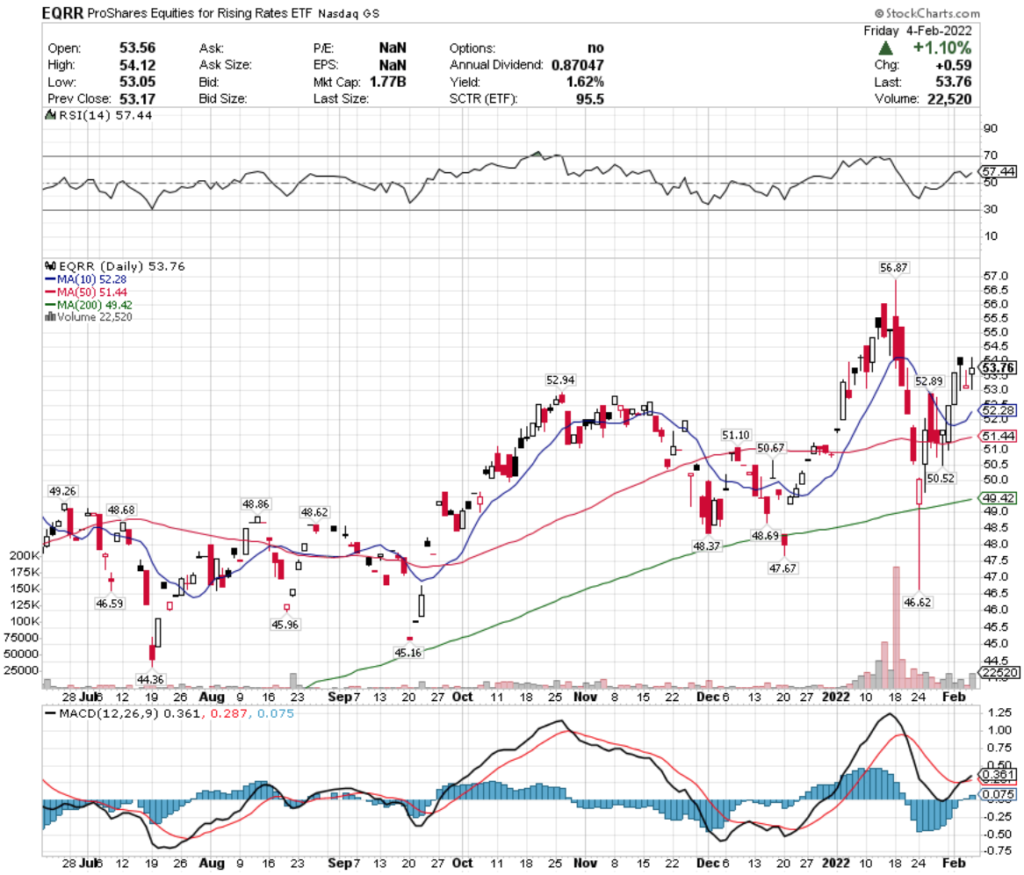
With an RSI that is still neutral & a 1.62% annual dividend yield, this may be a good name to get into while it gathers momentum.
Last week’s bullish MACD crossover also signals that, but first they will need to re-test & break out above the $54.12/share price level.
Retail (RETL), Biotechnology (BIB), Cloud Computing (SKYY) & Emerging Market Corporate Bonds (CEMB) All Lagging The Pack
RETL, the Direxion Daily Retail Bull 3x Shares ETF has been tumbling since mid-November.
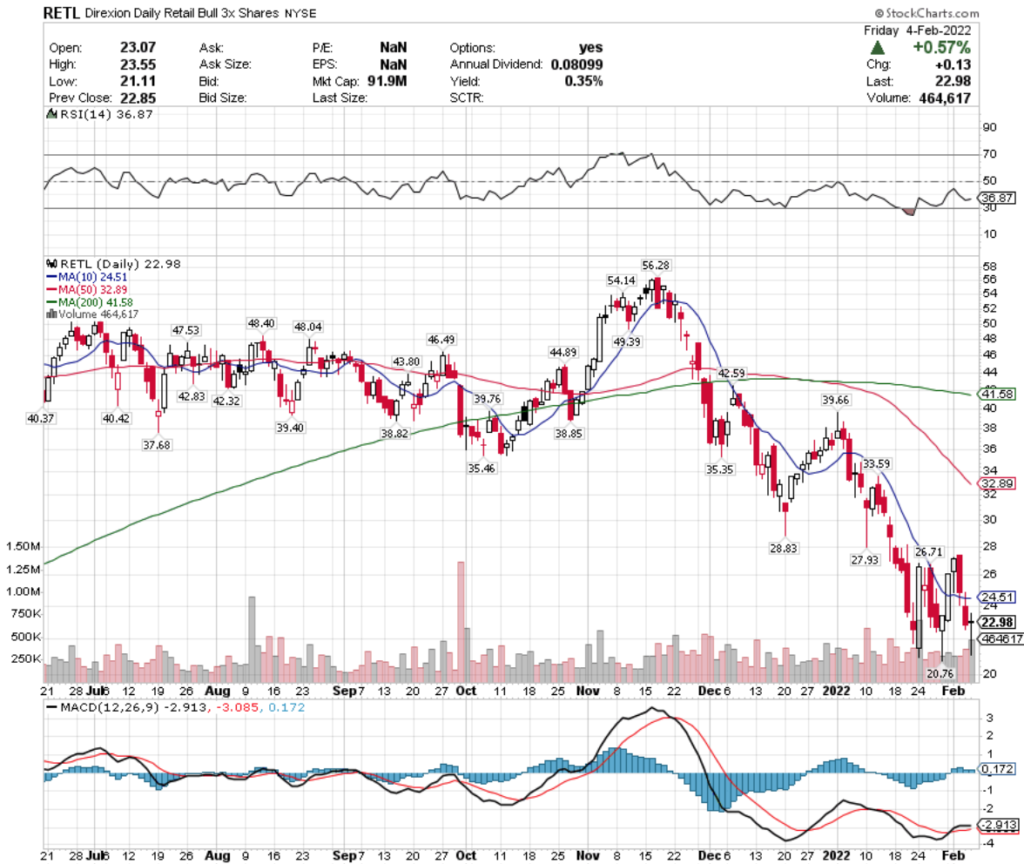
Volumes have increased in 2022, where it has managed to hold above $20.76/share, but their MACD is signaling that there will be additional short-term pain to come, as it bearishly rolls over.
With limited yield to collect, I’d be keeping an eye on their RSI to time an entry if this is something of interest, but it doesn’t seem like a safe time just yet to begin establishing a position.
BIB, the ProShares Ultra NASDAQ Biotechnology ETF is another name that has been trying to establish its footing, since it began falling in September of 2021.
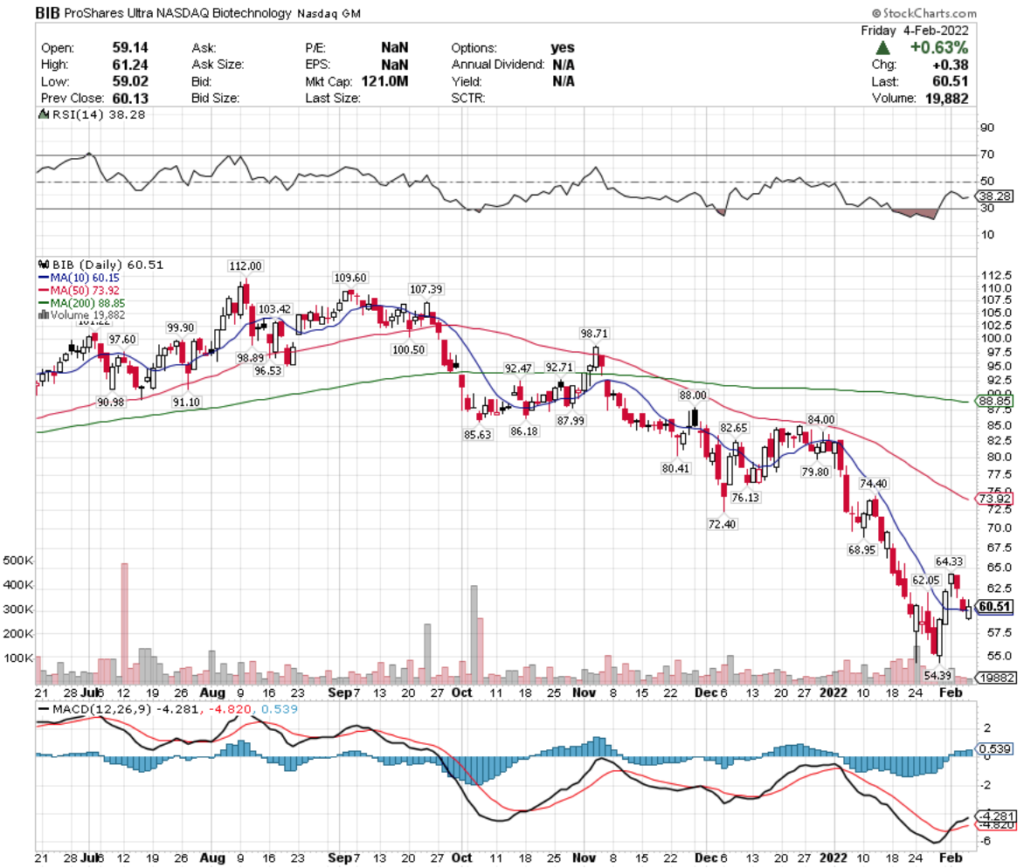
While its MACD has been bullish since the beginning of February, their recent trading volume is light, indicating that there is no clear sentiment about where its price level should be.
This one is another to wait on before beginning a position, as they do not offer a dividend yield to provide a cushion for additional near-term downside, and only hit their lowest price of the year within the last 2 weeks.
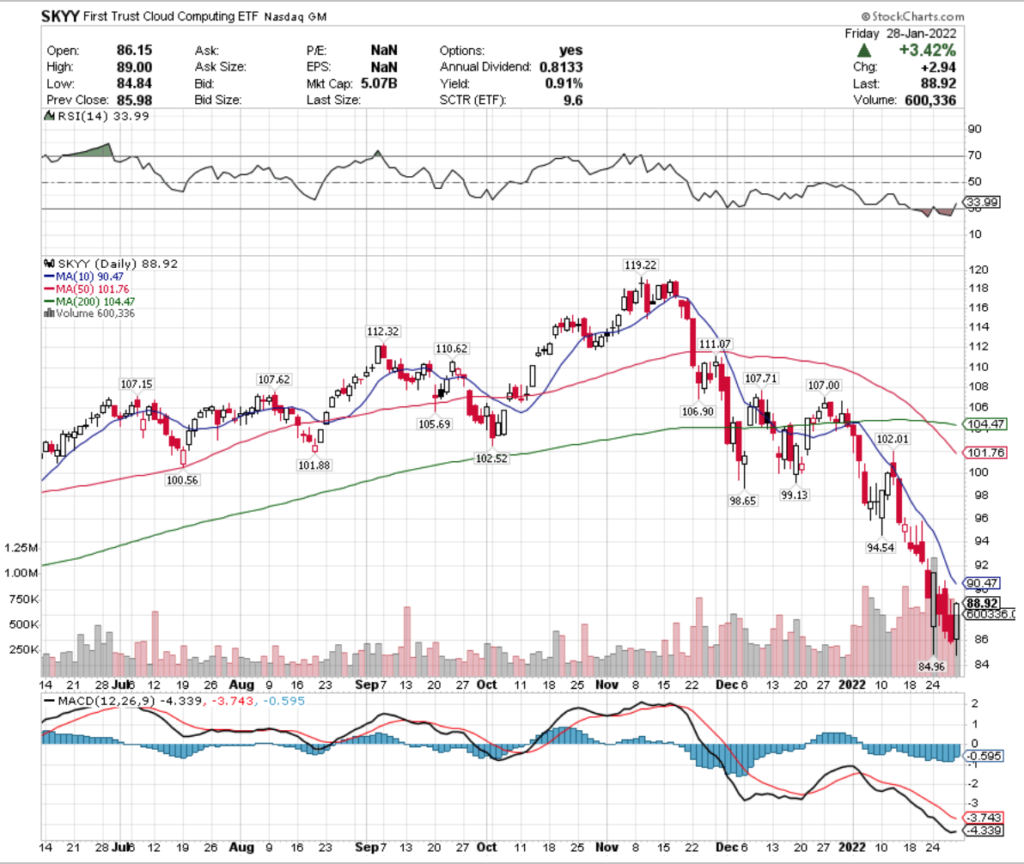
SKYY, the First Trust Cloud Computing ETF is one of the top performing Cloud Computing ETFs, but the space as a whole has been performing poorly.
They have dropped 24% since early November, as many of SKYY’s holdings will be adversely impacted by rising interest rates.
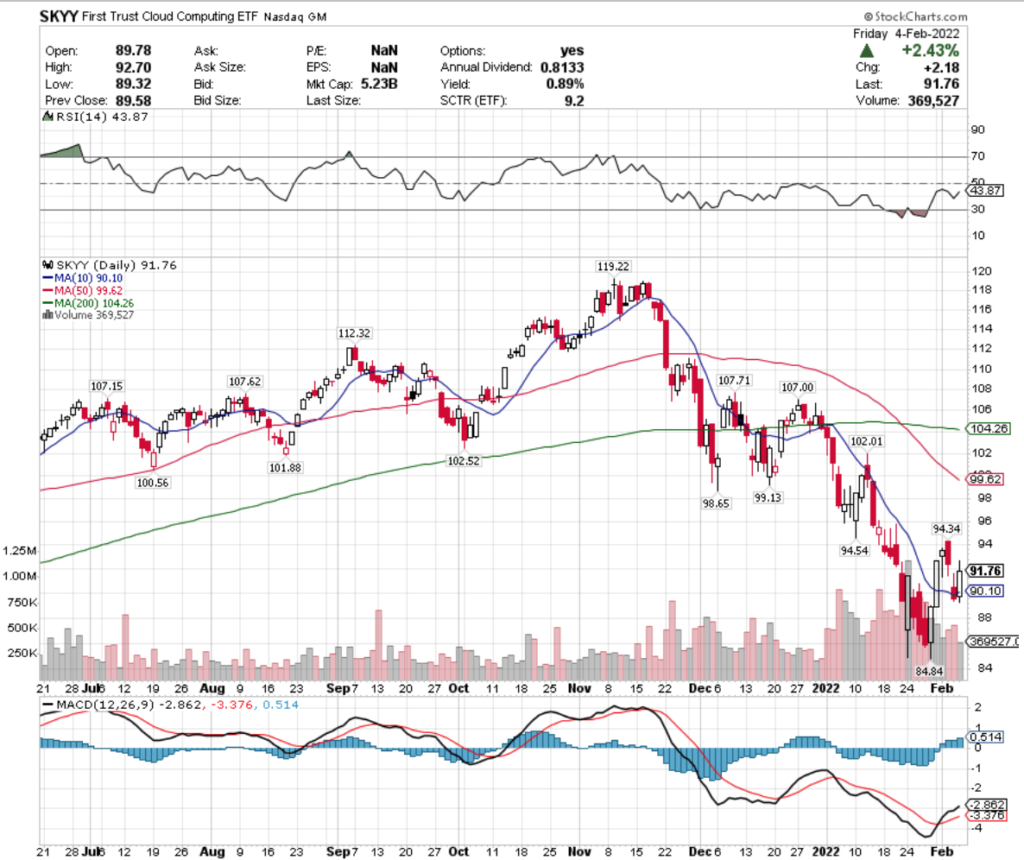
Keep an eye on their MACD, which is currently rolling over bearishly.
Given that their RSI is approaching neutral again & volumes have been above average in the last month, this looks set to go back down & test its support levels, hopefully holding above $90, as otherwise it’s a long drop to $84.84.
CEMB, the iShares Emerging Markets Corporate Bond ETF has also been underperforming since August, but may have a near-term opportunity for profits.
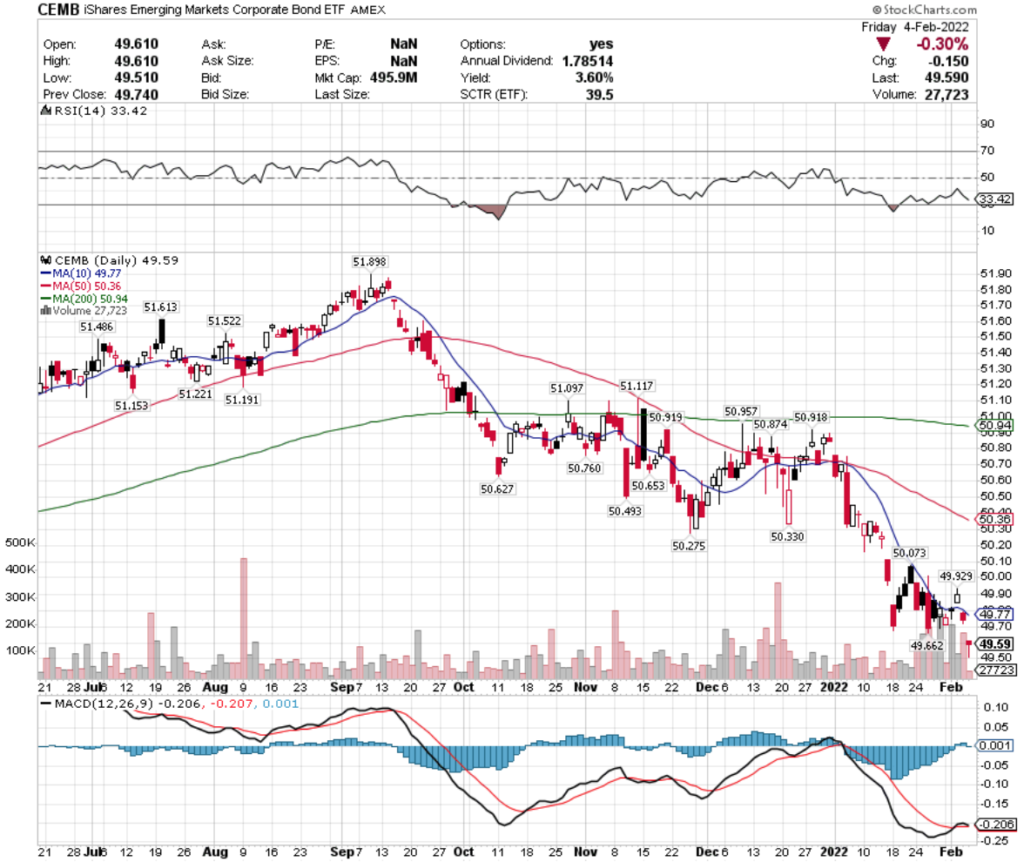
Given that they offer a 3.6% dividend yield & have options, there may be an opportunity to buy puts here while establishing a position on the way down.
This way, you can collect interest from the dividend, while also hedging with the puts while CEMB establishes a new support level.
With their bearish MACD & oversold RSI, this could present an interesting opportunity.
Tying It All Together
I don’t think anyone is surprised that energy names & rising rate-oriented equities have been having a great run in the last few months.
The lack of confidence in consumers & emerging market corporate bonds is cause for concern though, which when paired with rising fuel prices could spell more trouble on the horizon.
Should there be a wave of defaults & an already cautious consumer, economic activity will be hampered a bit, which in turn will create an issue for the Federal Reserve, who is already somewhat cornered into taking the actions that they’ve stated as a goal for 2022.
The good news, is that spring is around the corner, so demand for energy should ease a bit, as consumers go from using it for heating to using it for traveling & recreation, which is also good for the economy in a broader sense.