Cronos Group Inc. CRON Stock Analysis

Cronos Group Inc. stock trades under the ticker CRON & has shown recent bullishness that traders & investors should take note of.

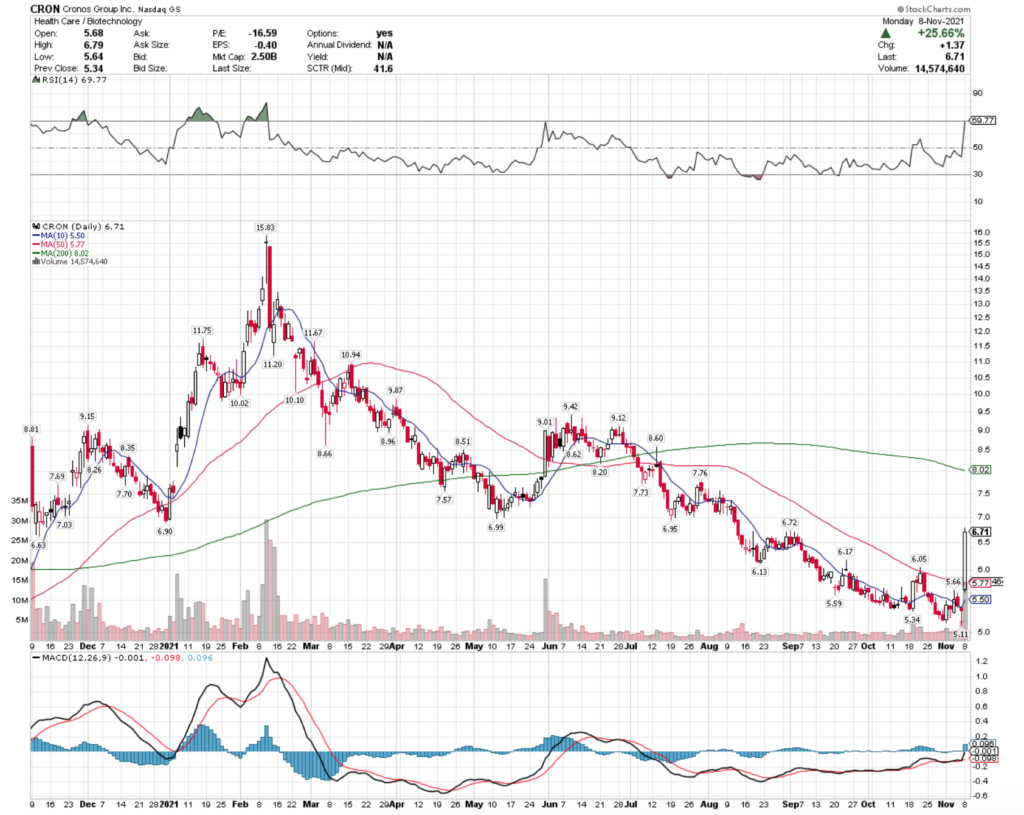
CRON stock closed at $6.71/share on 11/8/2021, after gapping up 25%+ on Monday.

Cronos Group Inc. CRON Stock’s Technical Performance Broken Down
Cronos Group Inc. CRON Stock's Technical Performance For The Last Year

CRON Stock Price: $6.71

10 Day Moving Average: $5.50

50 Day Moving Average: $5.77

200 Day Moving Average: $8.02

RSI: 69.8

MACD: -0.001

Yesterday, CRON stock completed a bullish MACD crossover, while gapping up over 25% on the day.

Their share price also jumped above the 10 & 50 Day Moving Averages, while trading on daily volume that was higher than average for the first time since June.

Given the nature of the steep jump yesterday, I expect there to be a shake-off period for their RSI to even out, as it jumped from slightly oversold to being almost completely overbought within a day.

With this in mind, there should be entry-points in the coming days for traders & investors to be able to get in & profit from.

The next price level of resistance to overcome will be the $6.72/share level, which they closed one cent below yesterday.

Cronos Group Inc. CRON Stock As A Long-Term Investment

Cronos Group Inc.’s stock is a cannabis stock, which investors may be interested in as a means of gaining exposure to the space in their portfolio.

CRON’s valuation metrics look fair, with a P/E (ttm) of 65.3 & a P/B of 1.22.

One area that stands out to investors is their sturdy 58.1% Quarterly Revenue Growth Y-o-Y.

CRON’s balance sheet looks appealing as well, with $1.1B in Total Cash (mrq) & Total Debt (mrq) of $7.54M.

With a Beta of 1.45, CRON stock will tend to be a bit jumpier than the broader market indexes, which is something that investors should be aware of.

They also do not offer a dividend, which may be off-putting to some investors, and may be in part to blame for their 17.6% % Institutional Investors.

Cronos Group Inc. CRON Stock As A Short-Term Trade Using Options

Short-term focused traders can take advantage of CRON stock’s recent momentum shift by using options.

I am looking at the contracts with the 11/19 expiration date.

The $6 & $6.50 call options look appealing being in & at-the-money.

The $6 calls are very liquid with 4,400+ contracts of open interest.

The $7 puts also look appealing for that time period, as the $7.50’s lack sufficient open interest & the $6.50’s will likely be out-of-the-money before expiration.

Tying It All Together

All-in-all, there looks to be many advantages to CRON stock in both the near & long-term.

Long-term focused investors will like CRON’s exposure to the cannabis industry, as well as their valuation metrics & balance sheet.

Short-term traders will like their current momentum, as well as the liquidity of their options market, which is signaling more bullish sentiment to come when comparing the open interest of calls:puts.

CRON stock is worth taking a closer look at to investors & traders alike.

*** I DO OWN COMMON SHARES OF CRON STOCK AS OF WRITING & PUBLISHING THIS ARTICLE ***
Starbucks Corp. SBUX Stock Analysis

Starbucks Corp. stock trades under the ticker SBUX & has shown recent bullishness that traders & investors should research further.

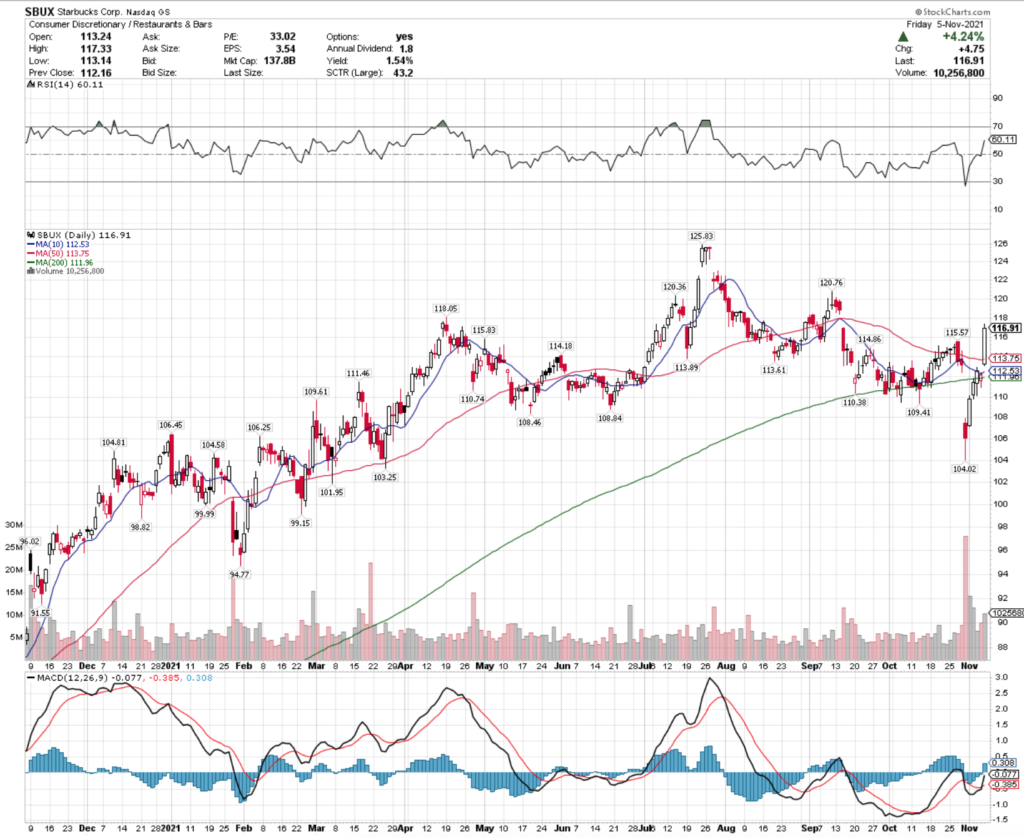
SBUX stock closed at $116.91/share on Friday 11/5/2021.

Starbucks Corp. SBUX Stock’s Technicals Broken Down

Starbucks Corp. SBUX Stock's Technical Performance Over The Last Year

SBUX Stock Price: $116.91

10 Day Moving Average: $112.53

50 Day Moving Average: $113.75

200 Day Moving Average: $111.96

RSI: 60.11

MACD: -0.077

SBUX completed a bullish MACD crossover yesterday, after trading on above average volume for the last few days.

They also gapped up 4%+, bullishly crossing over their 10 & 50 Day Moving Averages as well.

With an RSI that is only slightly overbought, there looks to be additional momentum in the near-term to continue pushing SBUX’s share price higher.

The next area of major resistance is the $120 level.

Starbucks Corp. SBUX Stock As A Long-Term Investment

Starbucks has been a longterm hold favorite for many investors.

Their P/E (ttm) is 33.03, and they do not have a positive P/B, which is to be expected as they operate a chain of restaurants that are focused on renting their space.

SBUX stock’s Beta is 0.83, meaning that it tends to move less aggressively than the broader market, which is another perk for investors focused on the long-term.

Starbuck’s balance sheet could look better though, with Total Cash (mrq) of $6.62B & Total Cash (mrq) of $23.61B.

They offer a dividend yield of 1.64%, which looks safe with a payout ratio of just over 50%.

SBUX also enjoys 70% of their share float being held by institutional investors.

Starbucks Corp. SBUX Stock As A Short-Term Trade Using Options

Short-term oriented traders can profit off of SBUX stock’s recent momentum by using options.

I am looking at the contracts with the 11/19 expiration date.

The $116, $117 & $118 calls all look liquid enough to trade & are either in, at or near being in the money by a matter of percentage points.

The $119 & $118 puts also look appealing as a hedge, although they have less open interest, meaning that traders see more near-term upside than downside for SBUX’s share price.

Tying It All Together

Overall, SBUX stock looks to be appealing in both the near-term & long-term.

Investors will like collecting a safe dividend from a stock that is less volatile than the broader market, with a fair valuation.

Traders will like their current momentum which looks poised to continue climbing in the near-term based on their technicals.

Starbuck’s Corp. stock is worth taking a closer look at, regardless of what your trading style & time frames are.

*** I DO NOT OWN SHARES OF SBUX STOCK ***

Elevate Credit, Inc. ELVT Stock

Elevate Credit, Inc. stock trades under the ticker ELVT & has show recent bullish signals that traders & investors should take note of.

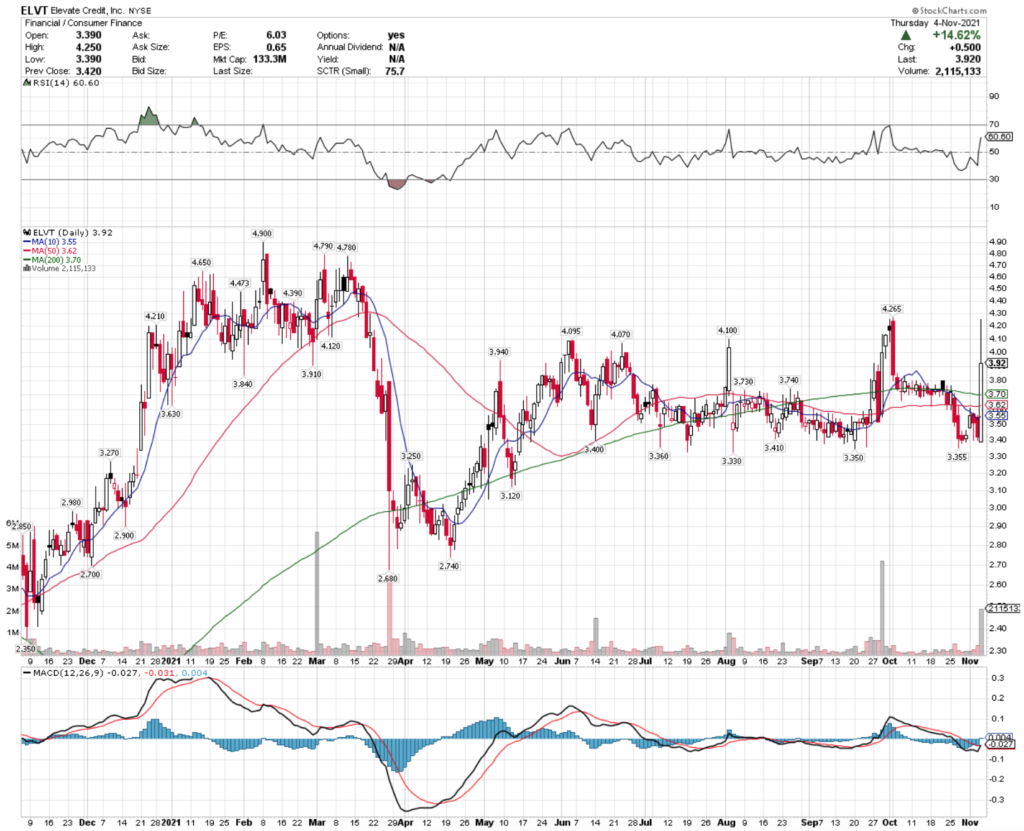
ELVT stock closed at $3.92/share on 11/5/2021 & looks poised to continue climbing.

Elevate Credit Inc. ELVT Stock’s Technicals Broken Down

Elevate Credit Inc. ELVT Stock's Technical Performance For The Last Year

ELVT Stock Price: $3.92

10 Day Moving Average: $3.55

50 Day Moving Average: $3.62

200 Day Moving Average: $3.70

RSI: 60.6

MACD: -0.027

ELVT completed a bullish MACD crossover yesterday, on higher than average volume compared to the rest of the year, which is a bullish signal.

Additionally, the price broke out above & closed above the 10, 50 & 200 Day Moving Averages.

The $4.10 & $4.26 price levels are the next levels of resistance for traders to be targeting & ELVT’s share price continues to climb.

Elevate Credit Inc. ELVT Stock As A Long-Term Investment

Long-term oriented investors will like ELVT stock’s P/B of 0.81, however their P/E (ttm) is not positive, which investors will typically not be fond of.

ELVT’s Quarterly Revenue Growth Y-o-Y is not stellar, at -28% & their balance sheet is also looking questionable.

ELVT has Total Cash (mrq) of $105.8M & Total Debt (mrq) of $361.8M, which also may not be suitable to most investors’ portfolio strategies.

With no Dividend Yield & the above mentioned metrics, it comes as no surprise to see that only 53% of their share float is held by institutional investors.

However, some investors may find ELVT appropriate to their portfolio & risk strategies.

Elevate Credit Inc. ELVT Stock As A Short-Term Trade Using Options

Traders can catch ELVT’s current momentum while hedging against risk by trading options.

I am looking at the contracts with the 11/19 expiration date.

The $2.50 calls are in-the-money & the $5 may also be worth looking at if you think that they will break above the $4.26 level fast in order to make some additional profit.

Both have open interest of just below or over 1,000 contracts, so they are liquid enough to make quick plays with.

The $5 puts are the only liquid option that is reasonable as the $7.50’s show no open interest, and it is highly unlikely anyone will be writing those contracts at this point in time.

Tying It All Together

All-in-all, traders & investors may be interested in the gains that ELVT has to offer.

As an investment, their fundamentals are shaky, but they may fit in some investors’ strategies pending further research.

In the near-term, their current momentum looks healthy & set to continue climbing for a bit.

ELVT stock is worth taking a closer look at to see if it is right for your strategy.

*** I DO NOT OWN SHARES OF ELVT STOCK ***

AMC Entertainment Holdings Inc. AMC Stock

AMC Entertainment Holdings Inc. has shown recent technical strength that traders may be interested in exploring further.

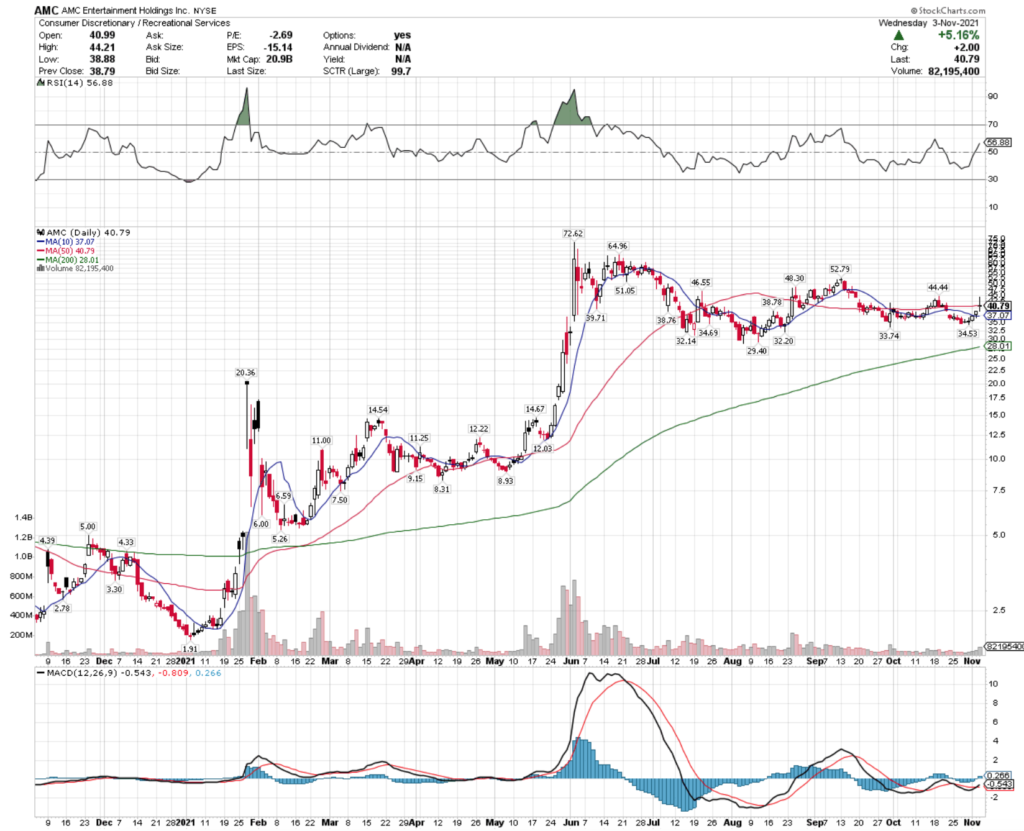
AMC stock closed at $40.79/share on 11/3/2021, with more bullish momentum to come.

AMC Entertainment Holdings Inc. AMC Stock’s Technicals Broken Down

AMC Entertainment Holdings Inc. AMC Stock's Technical Performance For The Last Year

AMC Stock Price: $40.79

10 Day Moving Average: $37.07

50 Day Moving Average: $40.79

200 Day Moving Average: $28.01

RSI: 56.9

MACD: -0.543

Yesterday, AMC stock completed a bullish MACD crossover, while the day’s high prices also went over the 50 Day Moving Average, although they settled for the day right on it.

There is a ~10% difference between the 10 & 50 Day Moving Averages, which will provide additional bullish momentum in the days to come.

The $44.20 level will be the next resistance test, which they should see in the coming days, as their RSI is still relatively neutral.

AMC Entertainment Holdings Inc. AMC Stock As A Long-Term Investment

AMC has recently been one of the meme stocks, that traders have been pumping for short-term gains.

As a long-term investment, they are pure speculation.

Their P/E (ttm) is negative & their P/B is 0.18 (which is low & may be the only appealing aspect to their stock).

AMC stock’s Quarterly Revenue Growth is 2,252.9%, which is only because of COVID lockdown measures being rolled back Y-o-Y.

AMC’s balance sheet is also unappealing with Total Cash (mrq) of $1.81B & Total Debt (mrq) of $11.08B.

Again, this is a purely speculative name.

AMC Entertainment Holdings Inc. AMC Stock As A Short-Term Trade Using Options

Traders can take advantage of AMC’s current momentum, while also protecting themselves from its speculative nature by trading AMC options

I am looking at the 11/19 expiration dated contracts.

The $40 & $39 calls look appealing as they are already in-the-money & this is an erratic stock.

As a hedge, the $41 & $42 puts also look appealing in the near-term.

The Open Interest on the puts is far lower than on the calls, signaling that traders see this name powering higher in the near-term.

Tying It All Together

Overall, AMC stock is not suitable for investing in, unless you have picked up a discarded scratch ticket on the ground before & won $1,000+; then you may be lucky enough for it to work.

In the near-term, however, they do have momentum that can be taken advantage of for profits.

Always be careful when playing with a speculative name like AMC stock.

*** I DO NOT OWN SHARES OF AMC STOCK ***

Fabrinet FN Stock Analysis

Fabrinet stock trades under the ticker FN & has shown recent bullishness that traders should take a closer look at.

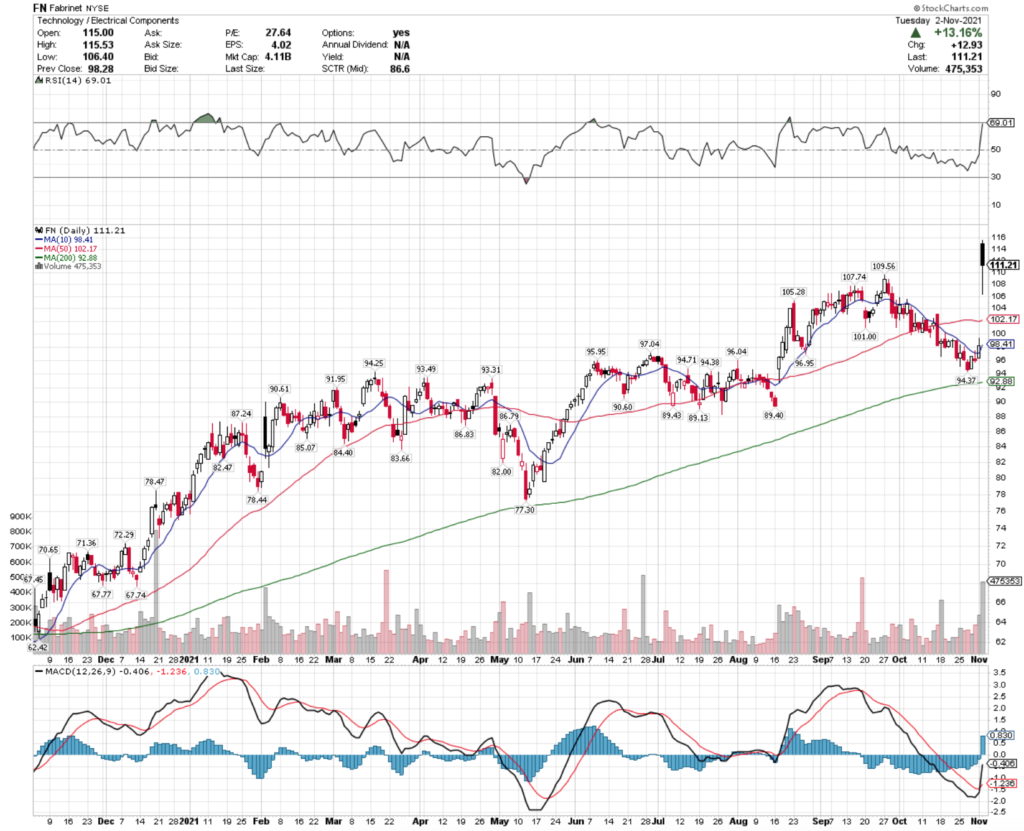
FN stock closed at $111.21/share on 11/1/2021, after a 13%+ gap up day.

Fabrinet FN Stock’s Technical Performance Broken Down

Fabrinet FN Stock's Technical Performance Over The Last Year

FN Stock Price: $111.21

10 Day Moving Average: $98.41

50 Day Moving Average: $102.17

200 Day Moving Average: $92.88

RSI: 69

MACD: -0.406

Fabrinet’s stock completed a bullish MACD crossover yesterday, on a 13%+ gap up day.

FN crossed over its 50 Day Moving Average, with ~4% difference between the 10 & 50 Day MAs that will provide additional support.

While their RSI is approaching overbought, over the next few days that will settle down as they establish a new range.

The next level to watch for will be $115.53, which was yesterday’s high.

Fabrinet FN Stock As A Long-Term Investment

Investors may be interested in FN stock, particularly their P/E (ttm) of 24.3.

FN stock’s P/B is 3.2, with a Beta of 1.02, showing that they tend to move in line with the broader markets.

Fabrinet’s Quarterly Revenue Growth Y-o-Y is 25.8%, and their balance sheet also looks healthy.

With Total Cash (mrq) of $547.9M & Total Debt (mrq) of $45.96M, FN looks to be a healthy investment.

While they do not offer a dividend yield, they still attract a lot of institutional investors, with 96% of their share float being held by them.

Fabrinet FN Stock As A Short-Term Trade Using Options

Short-term oriented traders can use options to take advantage of FN stock’s current momentum, while protecting themselves against volatility.

I am looking at the 11/19 expiration dated contracts.

The $105, $110 & $115 strike price calls all look appealing, although they have very low levels of open interest, which is to be expected as they were <$100/share for the last month until yesterday.

There is very low open interest on the puts side, but I would be looking to the $115 & $120 strike price there, should there be contracts written in the meantime, otherwise perhaps look towards the 12/17 expiration date.

Tying It All Together

Overall, it looks like Fabrinet’s stock is well worth taking a closer look at for all types of market participants.

As an investment, they look fairly valued & have a solid looking balance sheet.

In the near-term, they should continue to push higher after yesterday’s strong performance.

FN stock is worth doing more research into as both a trade & an investment.

*** I DO NOT OWN SHARES OF FN STOCK ***

Papa John’s Intl. Inc. PZZA Stock

Papa John’s Intl. Inc. stock trades under the ticker PZZA & has shown recent bullish movement that traders & investors should take a deeper look at.

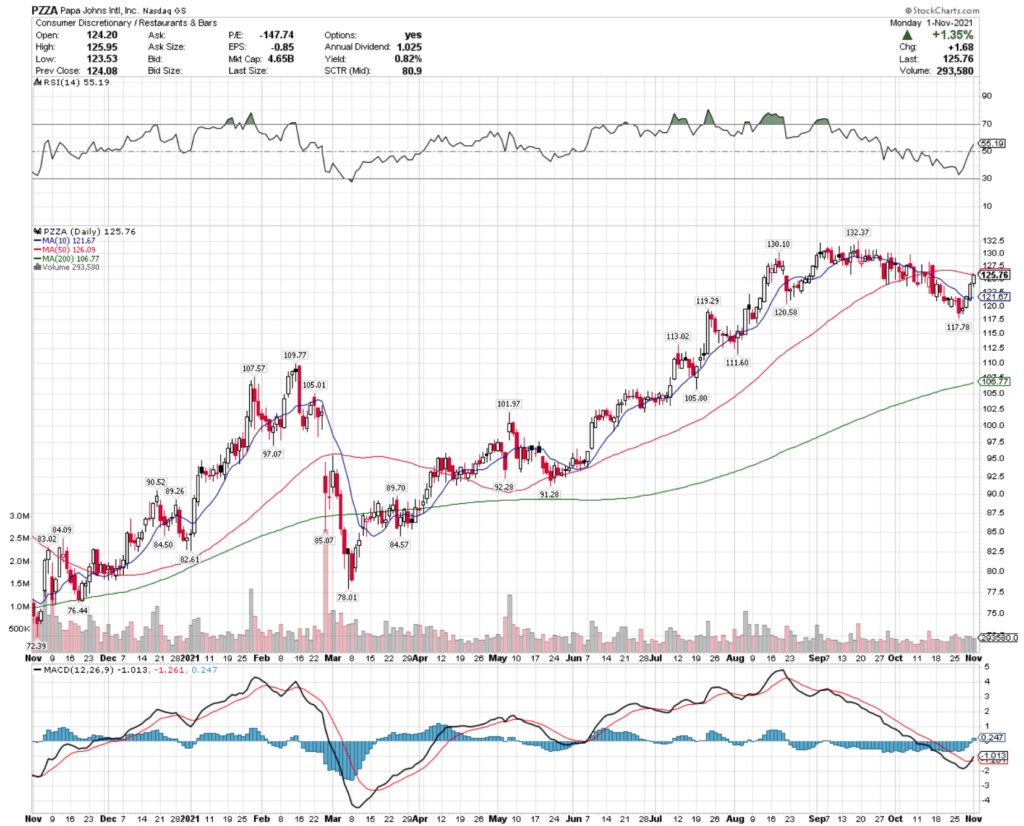
PZZA stock closed at $125.76/share on 11/1/2021.

Papa John’s Intl. Inc. PZZA Stock’s Technicals Broken Down

Papa John's Intl. Inc. PZZA Stock's Technical Performance For The Last Year
Papa John’s Intl. Inc. PZZA Stock’s Technical Performance For The Last Year

PZZA Stock Price: $125.76

10 Day Moving Average: $121.67

50 Day Moving Average: $126.09

200 Day Moving Average: $106.77

RSI: 55.2

MACD: -1.013

Yesterday, PZZA completed a bullish MACD crossover, while also approaching its 50 Day Moving Average.

The prior day, PZZA broke out above its 10 Day MA, which is <5% behind their 50 Day MA.

With a neutral RSI, there is additional momentum to push the price above the 50 Day MA, which will get additional fuel from the 10 Day MA crossing it a matter of days later.

The next test for PZZA will be the $127.66-128/share range.

Papa John’s Intl. Inc. PZZA Stock As A Long-Term Investment

Investors may be fond of PZZA stock as a long-term hold, due to their popularity & increased Quarterly Revenue Growth of 11.8% & Quarterly Earnings Growth of 56%.

Their Institutional Shareholders account for ~98% of shareholders.

However, their P/E (ttm) & P/B are both not positive, and their 1.13% dividend yield is not supported by a strong payout ratio (-13%).

Another area that some investors may be wary of is their balance sheet, where they have Total Cash (mrq) of $96.2M & Total Debt (mrq) of $614.2M.

Papa John’s Intl. Inc. PZZA Stock As A Short-Term Trade Using Options

Short-term focused traders may be interested in using options to profit from PZZA stock’s recent momentum.

I am looking at the contracts with the 11/19 expiration date.

The $120 & $125 calls look safe, with the $130 also being in the running to be in-the-money by the expiration.

For puts, the $130, $135 & $140 strike prices also look appealing as a hedge.

The open interest on puts vs. calls shows that traders expect there to be more bullishness to come from PZZA stock in the near term, although that sentiment may shift as contracts with expiration dates between now & then expire.

Tying It All Togher

Overall, PZZA stock has a lot of opportunities for traders & investors.

Investors may like their recent growth & undisputed popularity of the major pizza chains.

Traders will like their current momentum & variety of expiration dates for options contracts, as they can get better prices on contracts that expire sooner.

All-in-all, Papa John’s Intl. Inc. is worth taking a closer look at for all market participants.

*** I DO NOT OWN SHARES OF PZZA STOCK ***

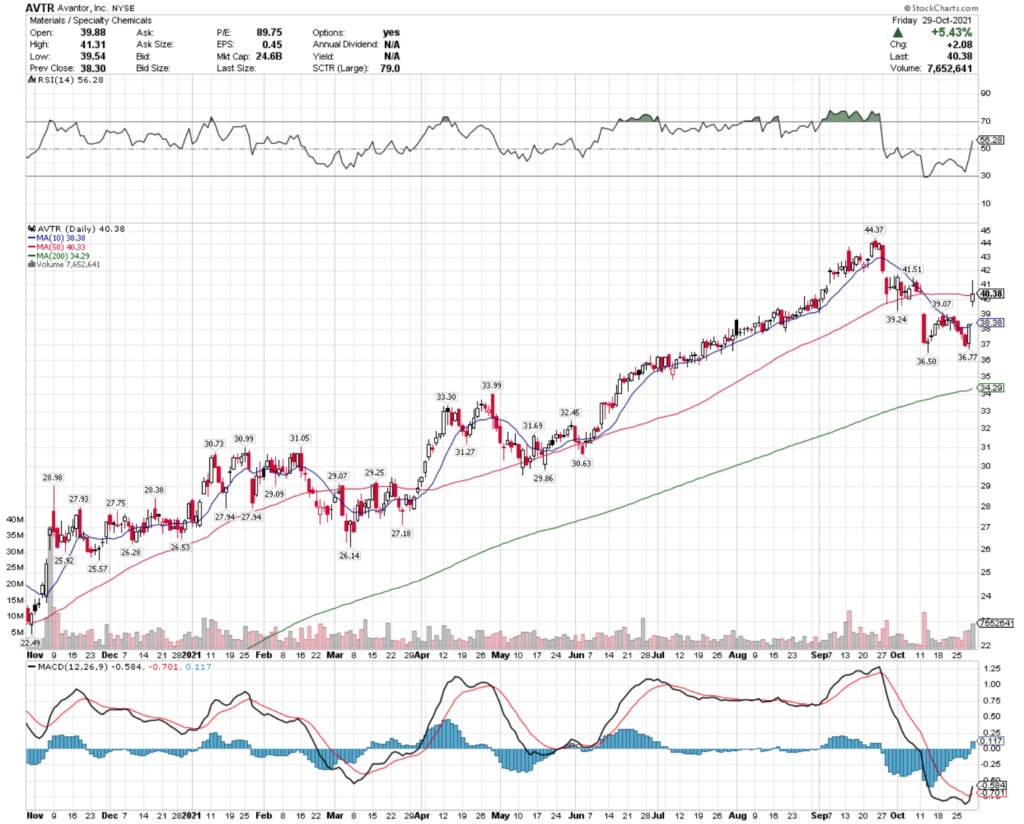
Avantor, Inc. AVTR Stock Analysis

Avantor, Inc. stock trades under the ticker AVTR & has shown recent bullishness that is worth taking a closer look at.

AVTR closed at $40.38/share on 10/29/2021.

Avantor, Inc. AVTR Stock’s Technicals Broken Down

Avantor, Inc. AVTR Stock's Technical Performance For The Last Year
Avantor, Inc. AVTR Stock’s Technical Performance For The Last Year

AVTR Stock Price: $40.38

10 Day Moving Average: $38.38

50 Day Moving Average: $40.33

200 Day Moving Average: $34.29

RSI: 56.3

MACD: -0.584

On Friday, AVTR stock completed a bullish MACD crossover, while also gapping up 5.4%.

In the process, they also bullishly crossed their 10 & 50 Day Moving Averages.

With ~5% between the 10 & 50 Day MA’s, there looks to be additional bullish support to come in the near-term.

The $41.51-level is the next stop on resistance, and with a neutral RSI that looks to be the next stop in the coming days for AVTR.

Avantor, Inc. AVTR Stock As A Long-Term Investment

AVTR can give investors exposure to the Specialty Chemicals industry as they look to balance their portfolios.

AVTR has a P/E (ttm) of 89.7 & a P/B of 12.4.

Their Quarterly Revenue Growth Y-o-Y is 14.3%, and they do not offer a dividend yield.

On AVTR’s balance sheet, they have Total Cash (mrq) of $1.43B & Total Debt (mrq) of $5.6B.

Despite these metrics that some investors may not be too fond of, AVTR is 92% held by institutional investors.

Avantor, Inc. AVTR Stock As A Short-Term Trade Using Options

Avantor Inc.’s stock has options contracts to trade, which traders can use to take advantage of their current momentum.

I am looking at the 11/19 expiration dated contracts.

The $40 & $42.50 calls look interesting, with the former being in the money already & the latter being ~5% away.

For puts, the $42.50 & $45 strike prices look like a good way to fend off broader market volatility.

Tying It All Together

Overall, AVTR stock has many advantages for both the near & long-term.

Their valuation metrics may appeal to investors, although their balance sheet may make some investors wary.

In the near-term, their current momentum looks strong & set to continue pushing them higher.

AVTR stock is worth taking a closer look at, regardless of your trading style & time frames.

*** I DO NOT OWN SHARES OF AVTR STOCK ***

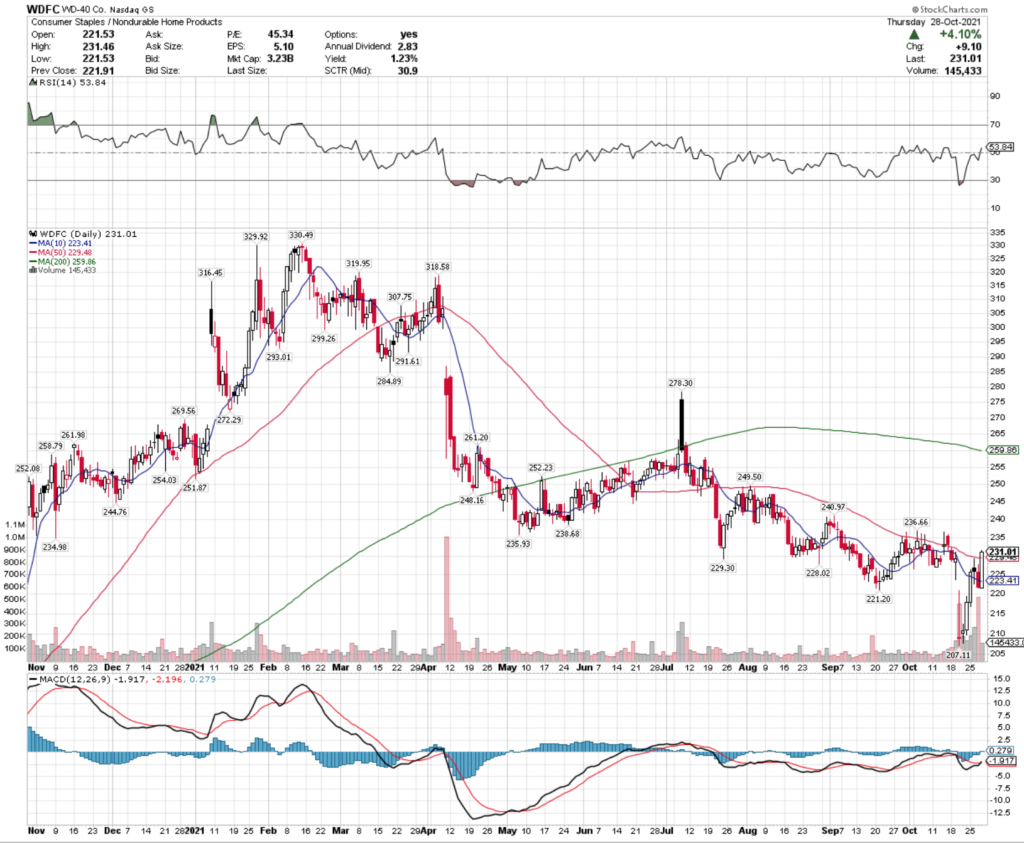
WD-40 Co. WDFC Stock Analysis

WD-40 Co. stock trades under the ticker WDFC & has shown recent technical strength that should be closer examined.

WDFC stock closed at $231.01/share on 10/28/2021.

WD-40 Co. WDFC Stock’s Technical Performance Broken Down

WD-40 Co. WDFC Stock's Technical Performance Over The Last Year

WDFC Stock Price: $231.01

10 Day Moving-Average: $223.41

50 Day Moving-Average: $229.48

200 Day Moving-Average: $259.86

RSI: 53.8

MACD: -1.917

WDFC has had higher than average volume the past couple of weeks when compared to the rest of the year, and yesterday completed a bullish MACD crossover.

Additionally, WDFC crossed over both its 10 & 50 Day MA’s bullishly in the process, while maintaining a neutral RSI.

With ~3% between the 10 & 50 Day MA’s, there looks to be additional momentum in the near-term that will help them test the $235 price level.

Once they have crossed there, the next level to eye is the $240 level.

WD-40 Co. WDFC Stock As A Long-Term Investment

WDFC has a P/E (ttm) of 44.4 & a P/B of 15.4. While the P/B is a bit rich, investors may like their Price to earnings ratio.

While their Quarterly Revenue Growth Y-o-Y was not impressive at only 3%, this is a household name that has a large marketshare that spans over generations that was founded in 1953.

WDFC has Total Cash (mrq) of $85.96M & Total Debt (mrq) of $124.7M on their balance sheet.

WDFC’s dividend yield is 1.3%, with a Payout Ratio of 54%, which although is high, does not suggest that the yield will need to be cut anytime soon.

Institutional investors like WDFC stock, owning 89.5% of the share float.

WD-40 Co. WDFC Stock As A Short-Term Trade Using Options

Traders can take advantage of WDFC stock’s current momentum using options.

I am looking at the 11/19 expiration dated contracts.

The $230 & $240 calls look appealing, with the latter only being 4.5% out of the money.

The $240 & $250 puts also look interesting, and can be used to prevent losses from broader market volatility.

Tying It All Together

Overall, WD-40 Co.’s stock has many appealing attributes for traders & investors to look into.

As a long-time established brand, investors can feel safe in their performance, although some of their metrics may be riskier than others.

Near-term traders will like their current path of momentum, and additional near-term strength.

WDFC stock is worth taking a closer look at for any and all market participants.

*** I DO NOT OWN SHARES OF WDFC STOCK ***

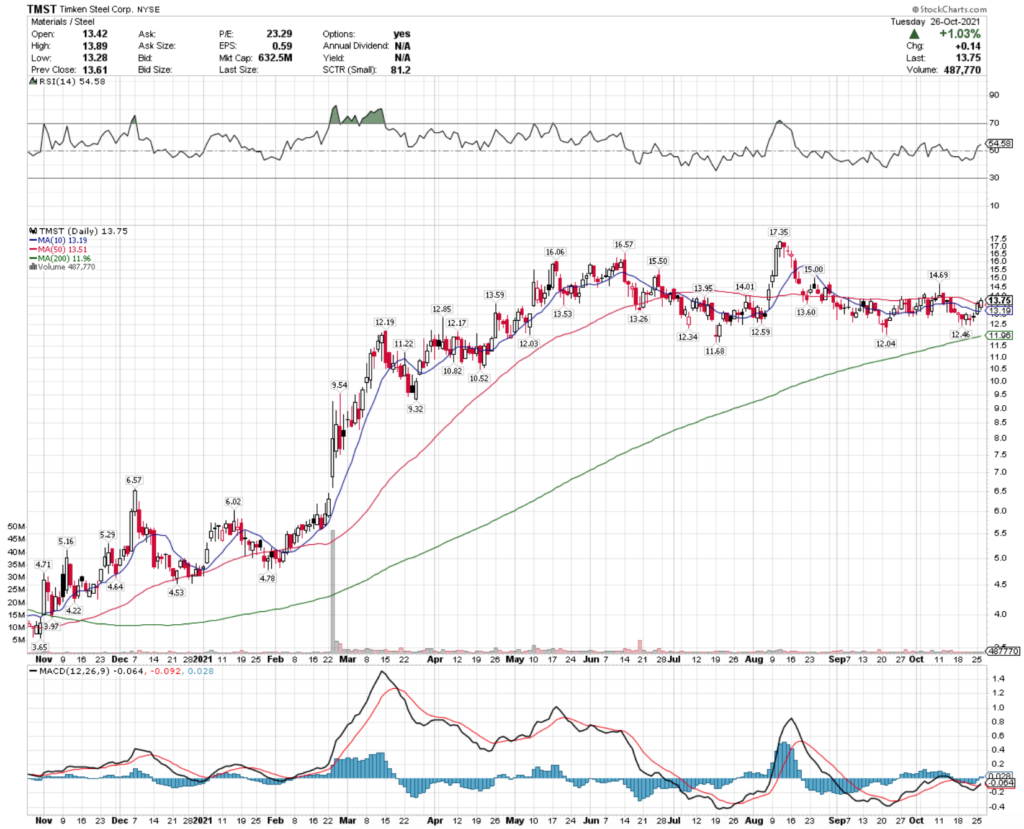
Timken Steel Co. TMST Stock Analysis

Timken Steel Corp. stock trades under the ticker TMST & has shown recent bullishness that traders & investors should take note of.

TMST stock closed at $13.75/share on 10/26/2021, after completing many bullish indicators that signal future growth is to come in the near-term.

Timken Steel Corp. TMST Stock’s Technical Performance Broken Down

Timken Steel Corp. TMST Stock's Technical Performance For The Last Year

TMST Stock Price: $13.75

10 Day Moving-Average: $13.19

50 Day Moving-Average: $13.51

200 Day Moving-Average: $11.96

RSI: 54.6

MACD: -0.064

Yesterday, TMST stock completed a bullish MACD crossover, while also bullishly breaking through its 10 & 50 Day Moving-Averages.

With a neutral RSI, TMST has more room to run in the near-term, although traders should note that their volume is about average compared with the rest of the year.

This may be of less concern to traders now, as most stocks that we have covered on this site have been trading below their annual average volumes.

Timken Steel Corp. TMST Stock As A Long-Term Investment

Investors may be interested in TMST stock’s valuation metrics, where their P/E (ttm) is 21.83 & their P/B is 1.04.

TMST stock has experienced Quarterly Revenue Growth Y-o-Y of 112%, which also should catch the eye of investors.

TMST’s balance sheet is also appealing, with Total Cash (mrq) of $115.2M & Total Debt (mrq) of only $63.9M.

Two areas of concern for investors may be their lack of a dividend yield, as well as their high beta that is 2.09, meaning that they will generally move in a more volatile fashion than the rest of the market.

Timken Steel Corp. TMST Stock As A Short-Term Trade Using Options

Short-term oriented traders can use options to take advantage of TMST stock’s recent momentum, while hedging against broader market inflation.

I am looking at the contracts with the 11/19 expiration date.

The $15 & $12.50 calls look appealing, although they will need to test the $14.69 level before the former will be in-the-money.

The $15 & $17.50 puts also look appealing as a means of hedging against a fall in price caused by broader market volatility.

Tying It All Together

Overall, TMST stock has many appealing attributes that traders & investors should take a closer look at.

Traders will like TMST’s current momentum & with 3 weeks left on their option contracts there is time for them to break out into higher territory, putting the $15 calls in-the-money.

Investors will like their fundamentals, although they may be disappointed by the lack of dividend.

All-in-all, TMST stock is worth taking a closer look at.

*** I DO NOT OWN SHARES OF TMST STOCK ***

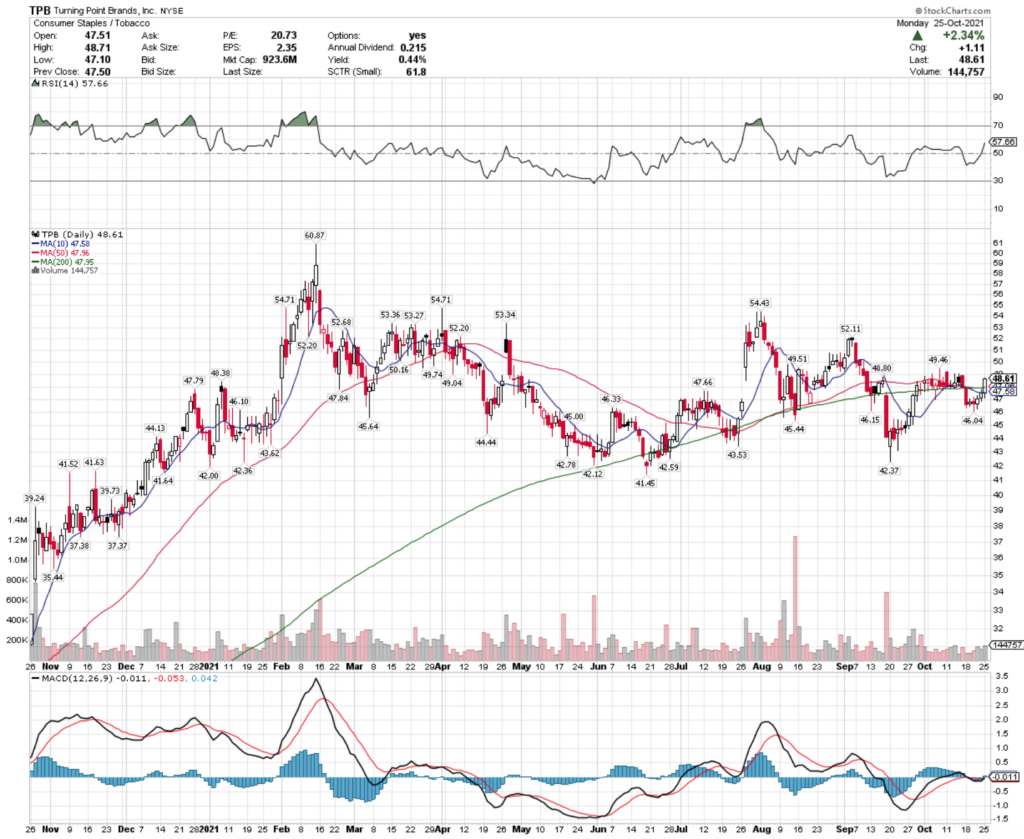
Turning Point Brands, Inc. TPB Stock

Turning Point Brands, Inc. stock trades under the ticker TPB & has recently shown signs of bullishness.

TPB closed at $48.61/share on 10/25/2021, after completing multiple bullish indicators.

Turning Point Brands Inc. TPB Stock’s Technical Performance Broken Down

Turning Point Brands Inc. TPB Stock's Technical Performance Over The Last Year

TPB Stock Price: $48.61

10 Day Moving-Average: $47.58

50 Day Moving-Average: $47.96

200 Day Moving-Average: $47.95

RSI: 57.7

MACD: -0.011

TPB stock completed a bullish MACD crossover yesterday, while also breaking out above all of its major moving averages bullishly.

With their 10 Day Moving-Average primed to cross through their 50 & 200 Day MA’s in the coming days, there looks to be additional momentum to help propel their price higher in the near-term.

The $49.25-$49.50 level is the next price level that they will test, and their RSI is still relatively neutral, which should also help their share price power higher.

Turning Point Brands Inc. TPB Stock As A Long-Term Investment

Investors with long time horizons may be interested in Turning Point Brands Inc.’s stock’s valuation metrics, with a P/E(ttm) of 21.2, although their P/B is a bit rich at 6.9.

TPB had 16.8% Quarterly Revenue Growth Y-o-Y, and has 81% % Institutional Investors.

TPB offers s modest dividend yield of 0.44%, with a very safe 9.4% payout ratio for investors.

One area of concern is TPB’s balance sheet, with $157.5M in Total Cash (mrq), but $448.4M in Total Debt (mrq).

Turning Point Brands Inc. TPB Stock As A Short-Term Trade Using Options

Short-term traders will like TPB’s current momentum, and can use options to profit from it while hedging against broader market volatility.

I am looking at the 11/19 expiration dated contracts.

The $45 & $50 calls look appealing, especially as they should gain more open interest as we approach the expiration date.

The $50 puts are more liquid than the $55 contracts, although that too is likely to change as their price continues on higher.

Tying It All Together

Overall, Turning Point Brands Inc.’s stock has many great qualities that traders & investors should both like.

TPB’s current momentum looks poised to continue upwards in the near-term, with additional strength to come in the coming days.

Long-term investors will like their valuation metrics & safe dividend yield.

All-in-all, it is worth taking a closer look at TPB stock.

*** I DO NOT OWN SHARES OF TPB STOCK ***