Tupperware Brands Corp. TUP Stock Analysis

Tupperware Brands Corp. trades under the ticker TUP & has recently shown a lot of technical strength. They currently are trading at $25.61 as of the close on 9/21/2020, making me eye the calls for $25 and $26.

Given that the markets look to have some overnight momentum to run with from the look of futures, the slightly out of the money $26 may be advantageous for a short term trade.
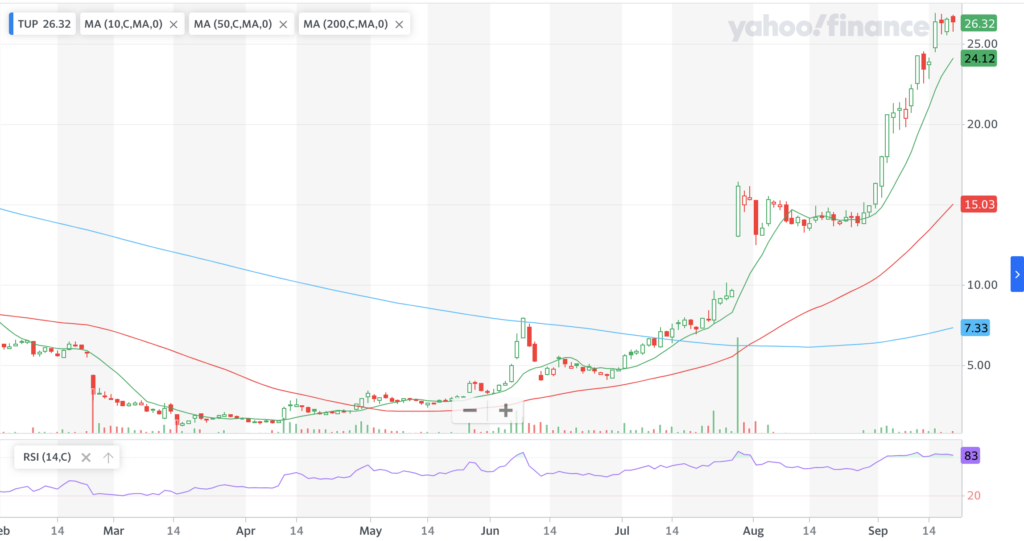
Tupperware Brands Corp. TUP Stock Chart For The Last Year

TUP Price: $25.61

10 Day Moving-Average: $24.12

50 Day Moving-Average: $15.03

200 Day Moving-Average: $7.33

RSI: 83

Their RSI is showing signs of being overbought, which could also make the idea of using a straddle appealing to some traders, as when the price of TUP ventures too far from the strike in either direction while the price establishes its range, the trader will profit.

If exercising the straddle, I may think to opt for the $25 calls & puts instead of the $26.

*** I DO NOT OWN ANY SHARES OF TUP ***

Pacific Ethanol, Inc. PEIX Stock Review

Pacific Ethanol, Inc. trades under the ticker PEIX & has recently had very strong technical performance. I’m looking at their options, and am interested in either buying the in-the-money $6 calls as they are currently set to open <$7/share due to today’s volatility, or I may set up a straddle using the $7 PEIX calls & puts with the October 16th expiration.

PEIX Price (per 9/18/20 Close): $7.10

10 Day Moving-Average: $5.13

50 Day Moving-Average: $3.19

200 Day Moving-Average: $1.20

RSI: 77

While today I will likely be selling SPXS & SQQQ calls, this is a play that I am going to be looking to make within the coming days to take advantage of their recent strength.

*** I DO NOT OWN ANY SHARES IN PEIX AS ON PUBLISHING THIS POST ***

Digital Turbine Inc. APPS Stock

Digital Turbine Inc. trades under the ticker APPS & has recently exhibited a lot of technical strength. I’m looking at their October calls, at the moment favoring the slightly in-the-money $30 calls to the $35’s for some added protection from volatility.

Digital Turbine Inc. APPS One Year Chart

APPS Price: $32.35

10 Day Moving-Average: $25.79

50 Day Moving-Average: $20.13

200 Day Moving-Average: $10.23

RSI: 74

While I am looking at the calls now, they may offer an opportunity for longer-term investment in time once we achieve more market clarity & less volatility.

*** I DO NOT OWN ANY SHARES OF APPS ***

Giga Metals Corp. HNCKF Stock Overview

Giga Metals Corp. trades under the ticker HNCKF, and has recently shown technical strength making it worth looking closer at from a trading perspective. This is especially true, given that at the moment futures are pointing lower across the board & they focus on mining & are an OTC stock.

Gigal Metals Corp. HNCKF Stock Chart For The Last Year

HNCKF Price: $1.27

10 Day Moving-Average: $0.73

50 Day Moving-Average: $0.34

200 Day Moving-Average: $0.22

RSI: 83

I’ll be taking a look at them today & potentially making a few trades depending on how they perform, but their recent gap up a few days ago has them in a position of strength that may be able to be built upon further.

*** I DO NOT OWN SHARES OF HNCKF ***

Lifeway Foods, Inc. LWAY Stock

Yesterday I picked up some shares of Lifeway Foods, Inc., which trades under the ticker LWAY. LWAY has presented strong technical performance recently, so after reviewing their chart I decided to buy some shares. I don’t plan to hold them long, but do still see some room for them to run to add to yesterday’s profits.

LWAY stock closed for trading at $7.45/share on 9/15/2020.

Lifeway Foods, Inc. LWAY Stock Chart For The Past Year

LWAY Price: $7.45

10 Day Moving-Average: $5.22

50 Day Moving-Average: $3.82

200 Day Moving-Average: $2.63

RSI: 68

While I intend to just trade this for now, there may be a move to invest for the longterm in the business upon a market pullback.

*** I Currently Own Shares Of LWAY Stock ***

Trillium Therapeutics Inc. TRIL Stock

Trillium Therapeutics Inc. trades under the ticker TRIL & has exhibited strength, after gapping up on 9/9/2020. I’ll be looking at their options this week, both TRIL Calls & Puts, as it looks to establish a new range after the gap. As of the pre-market they’re currently trading at $15, so the $15 calls are at-the-money, will be trading around the at-the-money options in either direction.

Trillium Therapeutics Inc. TRIL Stock Chart For Last Year

TRIL Price: $14.89 (per 9/14 close)

10 Day Moving-Average: $11.34

50 Day Moving-Average: $8.84

200 Day Moving-Average: $5.44

RSI: 75

*** I DO NOT OWN ANY TRIL SHARES OR OPTIONS AS OF WRITING THIS ***

Workhorse Group Inc WKHS

Workhorse Group Inc. has been showing up as a very strong technical performer for the last week, and I have been trading in & out of call options for them recently. Currently holding some $23 calls that expire this upcoming Friday, and may trade some additional ones this week.

Workhorse Group Inc. WKHS Stock Chart For Past Year

With a price of $23.69, they still show room to climb with the following moving averages:

10 Day Moving-Average – $20.21

50 Day Moving-Average – $17.13

200 Day Moving-Average – $6.77

RSI – 68

Given the nature of their industry & their fundamentals, I’m not interested in it as an investment, but am seeing the value in trading around WKHS.

*** I Currently Hold $23 WKHS Calls Expiring 9/18 ***