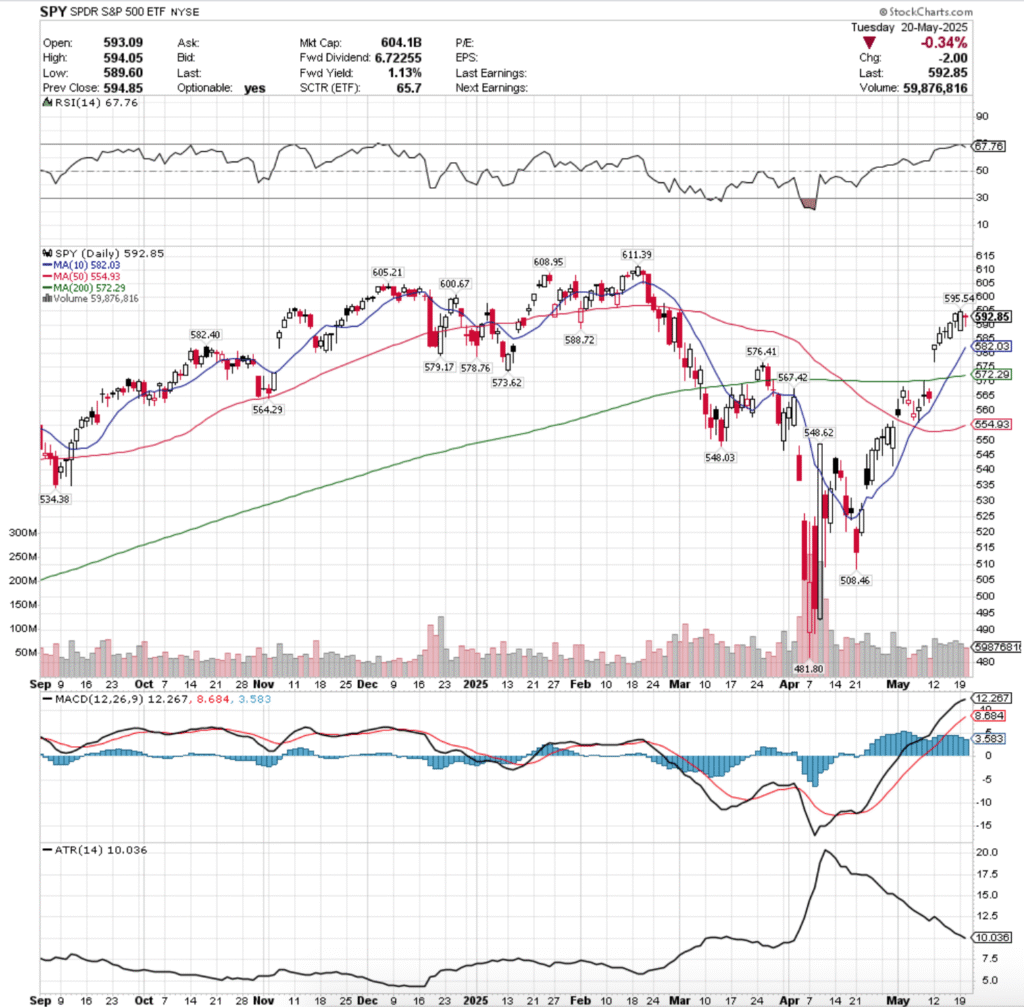
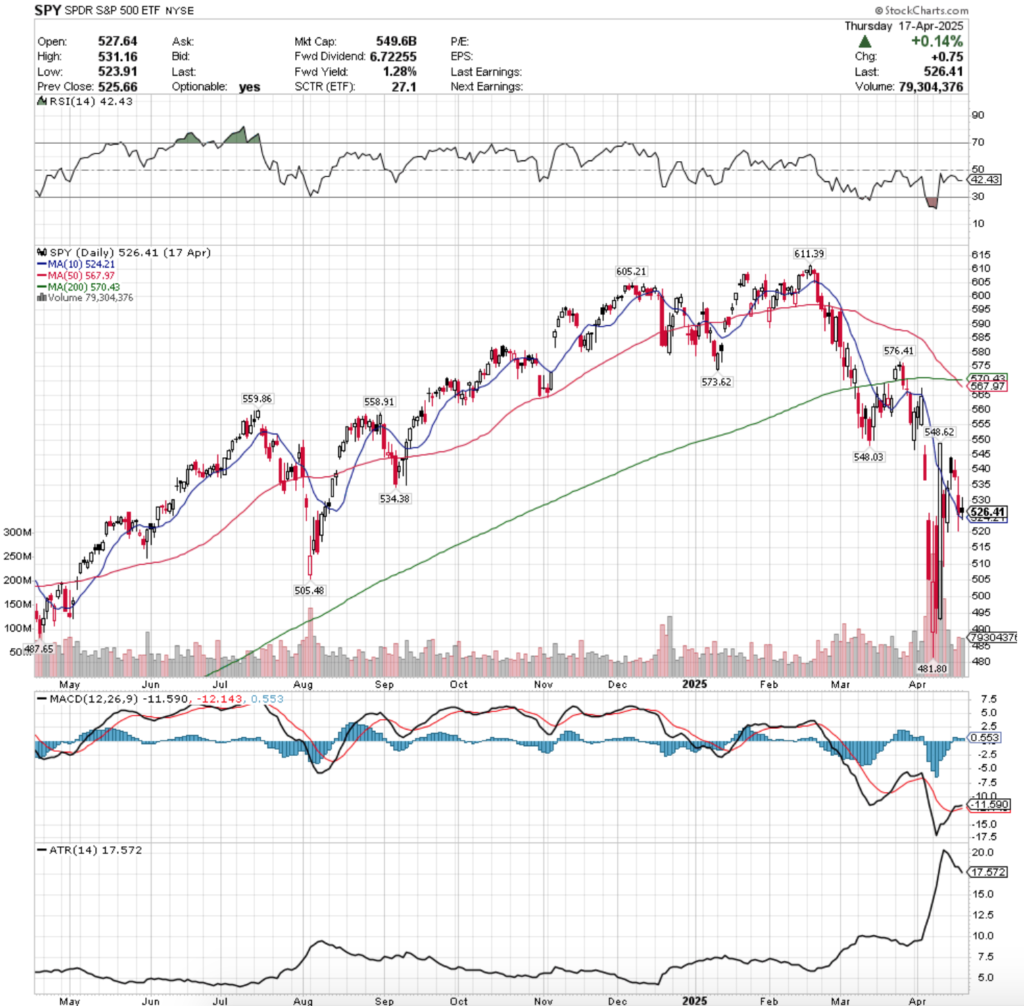
SPY, the SPDR S&P 500 ETF declined -0.46% for the week, while the VIX closed the week at 20.62, indicating an implied one day move of +/-1.3%, and a one month implied move of +/-5.96%.
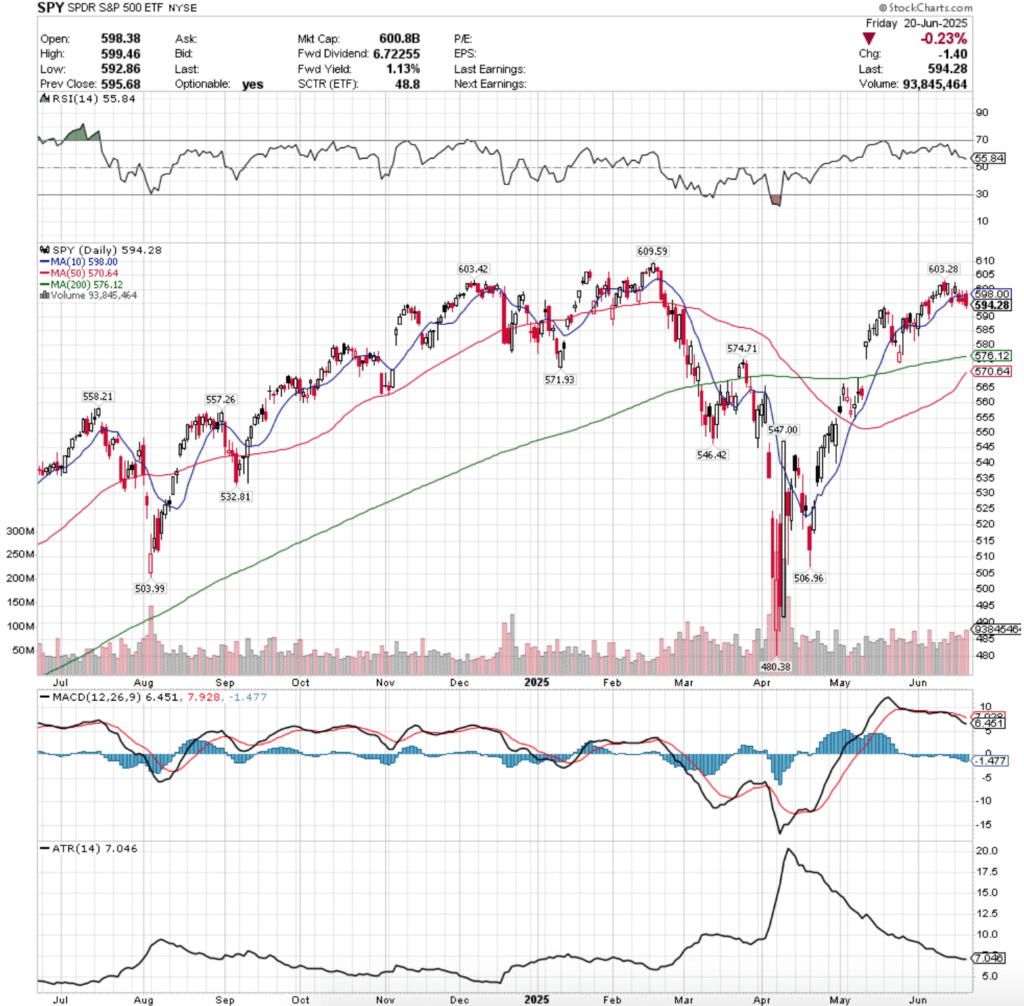
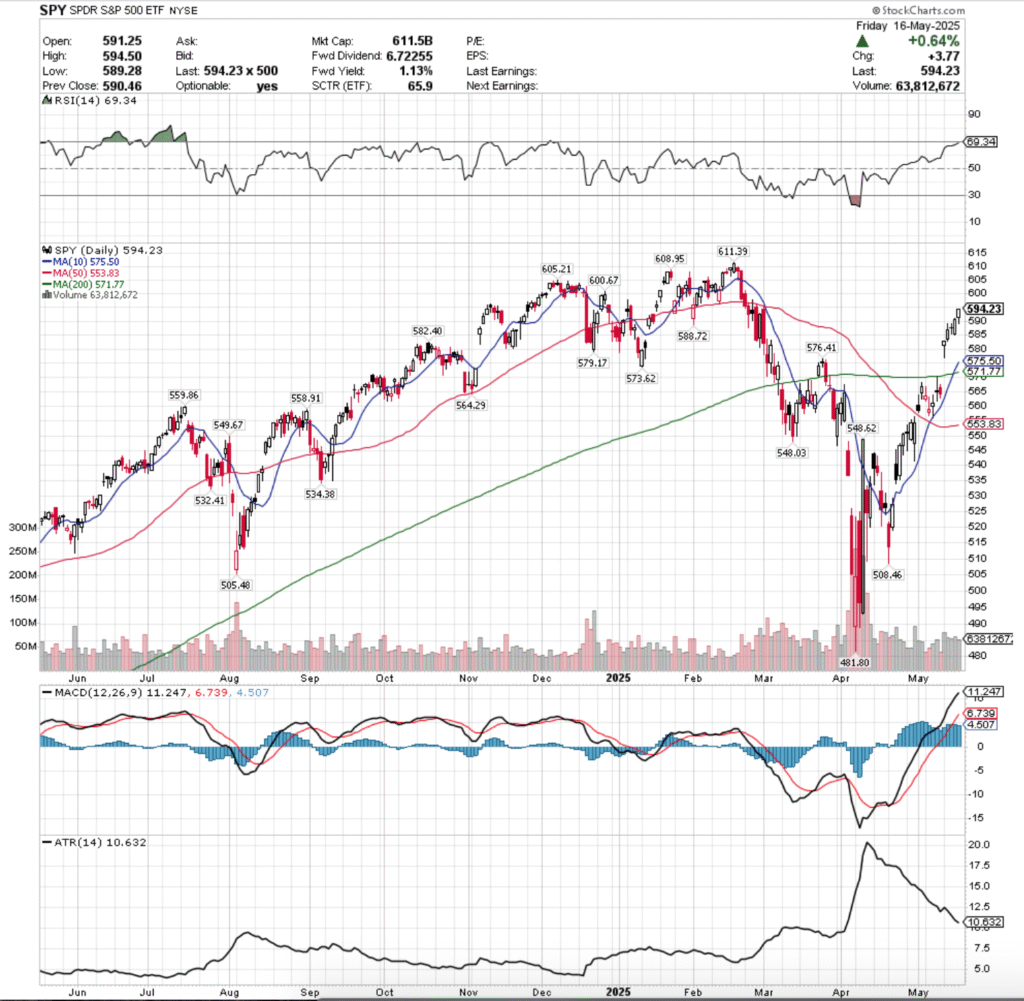
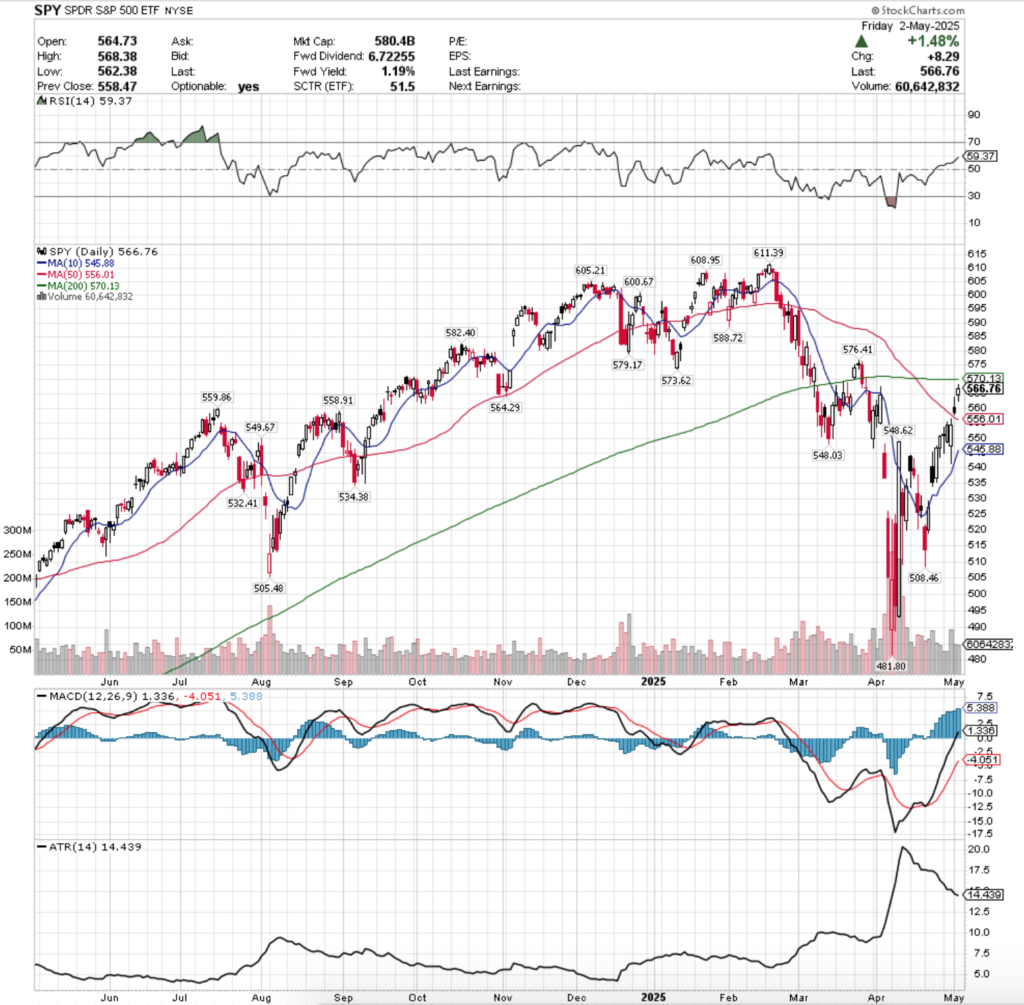
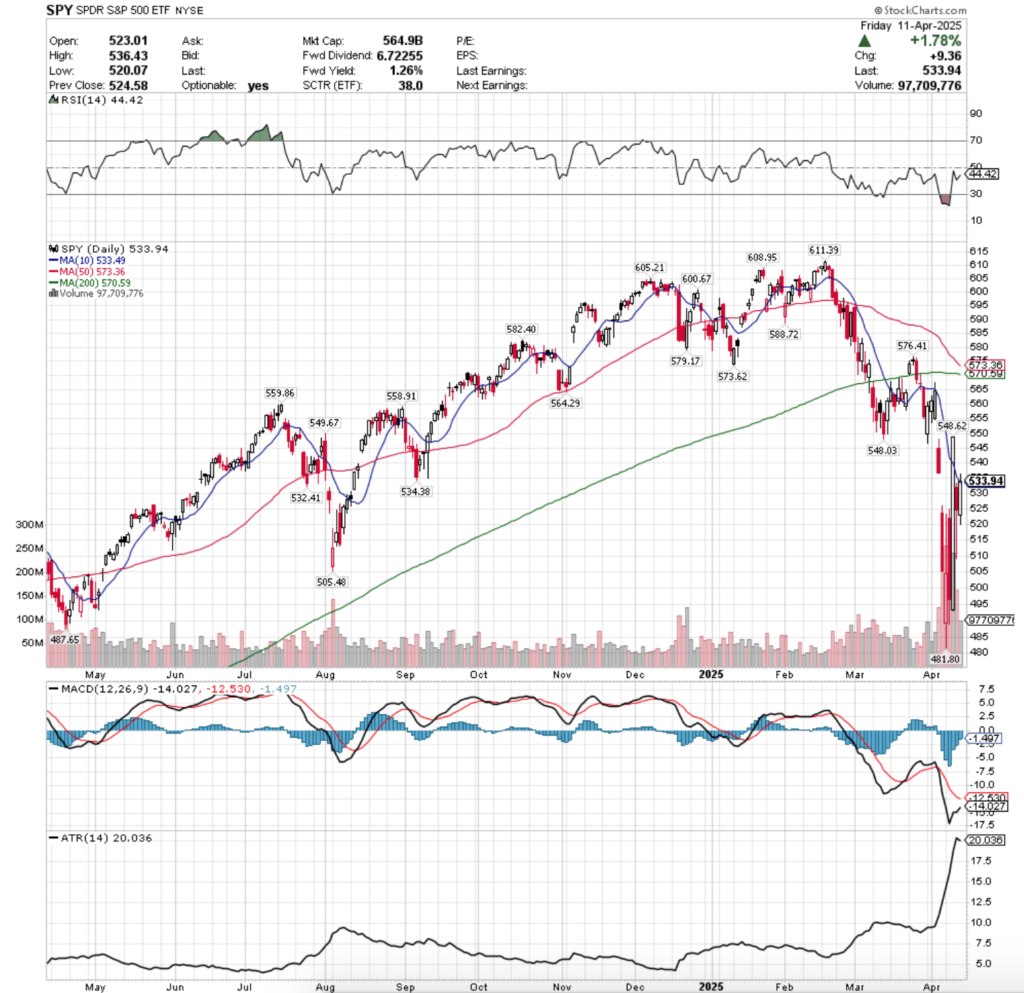
SPY ETF – SPDR S&P 500 ETF’s Technical Performance Over The Past Year
Their RSI is declining towards the neutral 50-mark & sits current at 55.84, while their MACD is bearish, with the histogram implying that there may be more declines on the near-term horizon.
Volumes were +42.48% higher than the prior year’s average levels (83,212,500 vs. 58,401,952), which is cause for concern given that aside from Monday’s gap up open that caused an advance, the entire holiday week was declining with lower shadows indicating that there is more Seller pressure on the horizon.
Monday the week began on the only advancing session, which is of note due to the rest of the week resulting in declines & it was the third highest volume of the four sessions.
While the week opened on a gap up, the lack of participation was disappointing from a sustainability perspective.
Tuesday the cracks became exposed, opening on a gap down that was unable to break above $599.98/share & ended up breaking down though the support of the 10 day moving average on higher volume than Monday.
Wednesday things got even fisher, as the session produced lower highs & lower lows, forming a bearish harami pattern with Tuesday’s candle on the week’s lowest volume heading into the holiday Thursday & the resistance of the 10 day moving average kept SPY subdued.
Friday’s candle opened on a gap higher, attempted to crack the $600/share level, but ultimately declined forming a bearish engulfing pattern with Wednesday’s session on the highest volume of the week.
The story of this week is going to be focused on Iran, PCE & Powell’s testimony to the House.
To the upside the $603.28-.42/level needs to be broken through to see any type of advances.
This will prove tricky though as like noted last week there is a bearish head & shoulders pattern emerging for SPY that’s shoulders are at those two prices.
There’s going to need to be major, consistent advancing volume in order for that to happen, which should be noted.
The head is the $609.59/share level, which is SPY’s all-time high, and will need a lot of participation to break down.
The consolidation case has SPY oscillating around the 10 day moving average, with perhaps a minor pump when the 50 day moving average crosses through the 200 DMA bullishly, but should that happen there is another, smaller head & shoulders that would form from mid-May’s gap up, leading to the following.
The declining case gets tricky, as there is limited support at SPY’s current price level nearby, which means that there is likely going to be a closing on said window that occurred in mid-May, and the long-term trend line will be tested as support.
In the best case scenario there SPY will oscillate around the 200 DMA awaiting an upside or downside catalyst, but the price level that the 200 DMA resides in is historically Seller oriented, which adds fuel to any declines.
$570.64/share is the current downside target level to watch, but that will change daily as it is the 50 day moving average (Per Friday’s close).
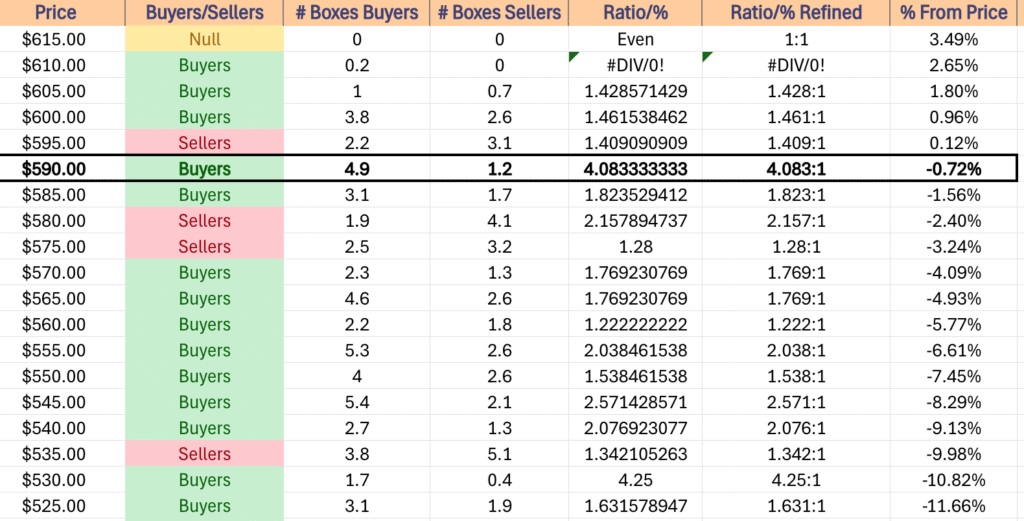
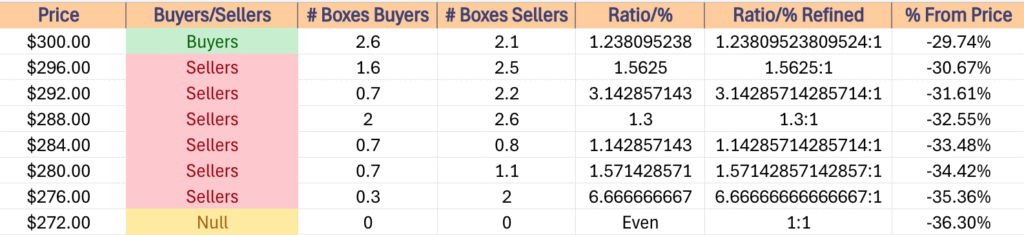
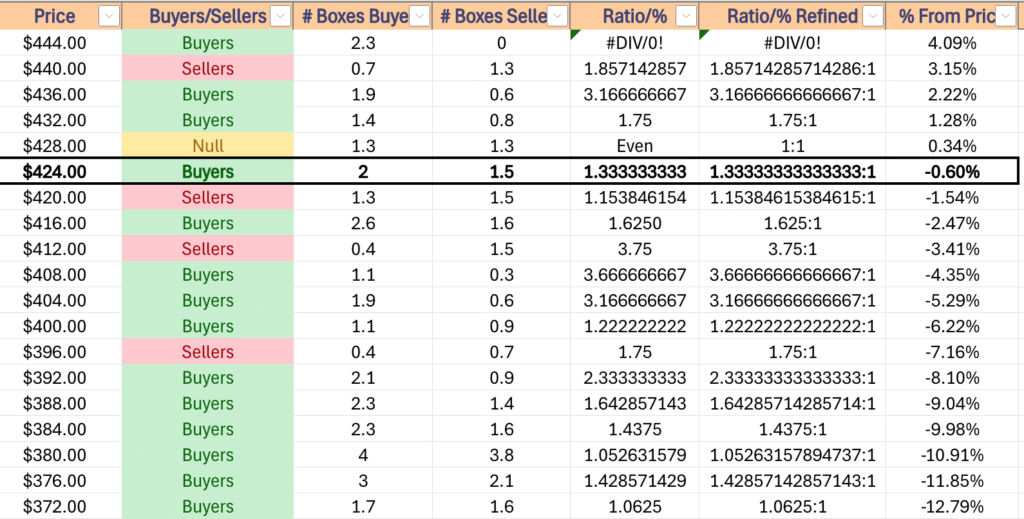
SPY has support at the $576.12 (200 Day Moving Average, Volume Sentiment: Sellers, 1.28:1), $574.71 (Volume Sentiment: Buyers, 1.77:1), $571.93 (Volume Sentiment: Buyers, 1.77:1) & $570.64/share (Volume Sentiment: Buyers, 1.77:1) price levels, with resistance at the $598.00 (Volume Sentiment: Sellers, 1.41:1), $603.28 (Volume Sentiment: Buyers, 1.46:1), $603.42 (Volume Sentiment: Buyers, 1.46:1) & $609.59/share (All-Time High, Volume Sentiment: Buyers, 1.43:1) price levels.
SPY ETF’s Price Level:Volume Sentiment Over The Past ~4 Years
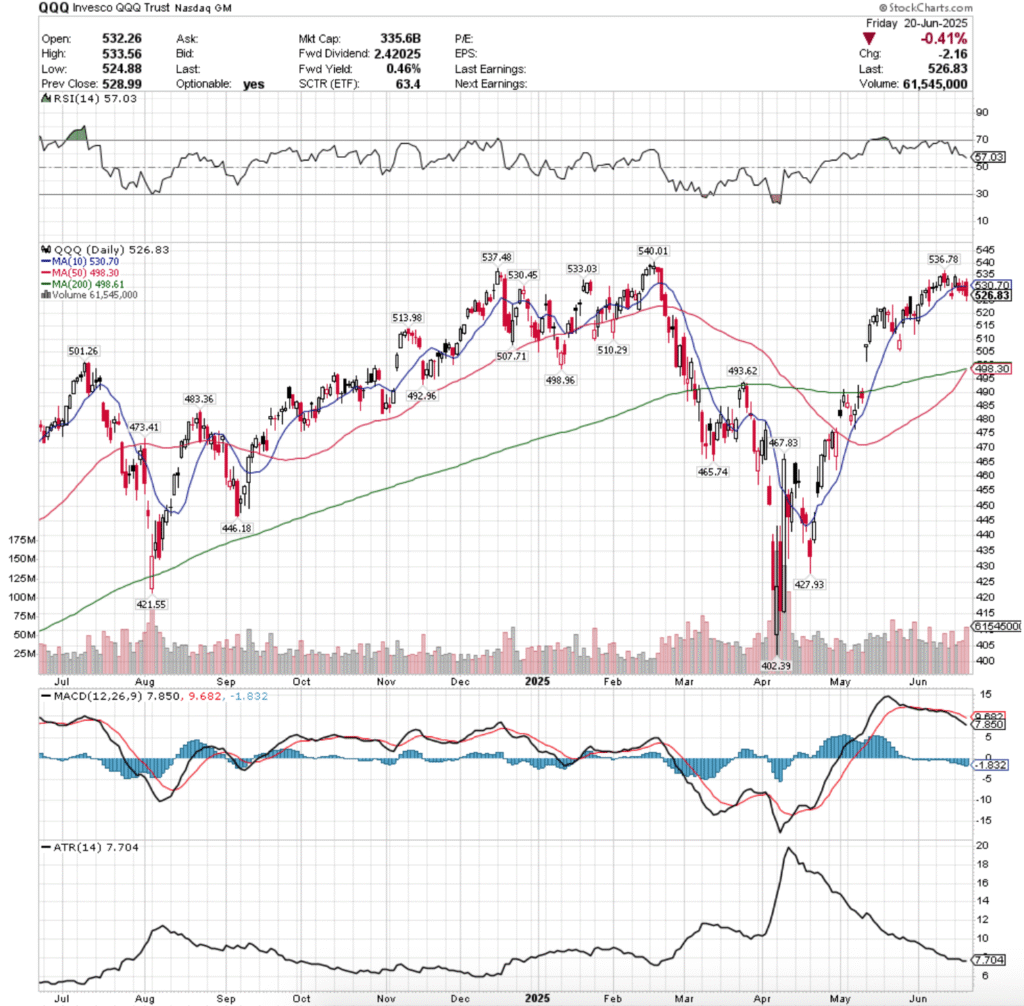
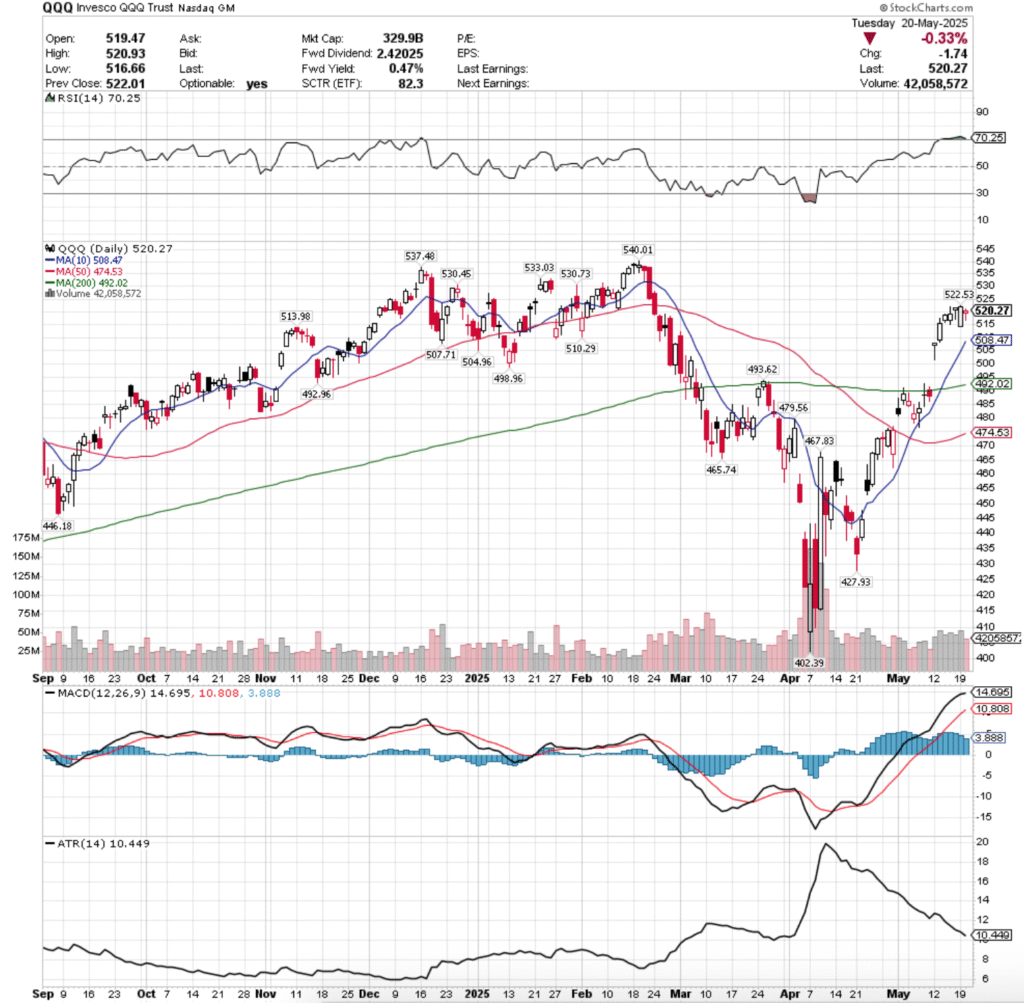
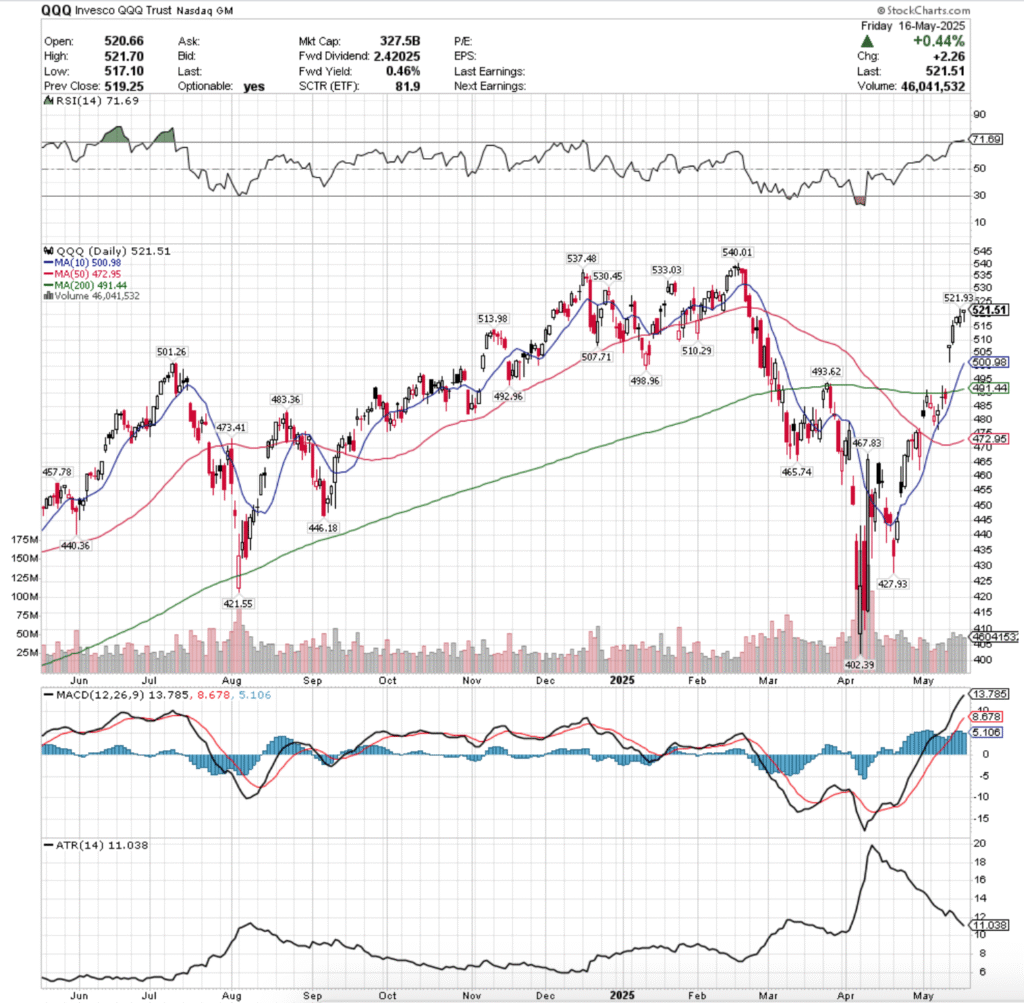
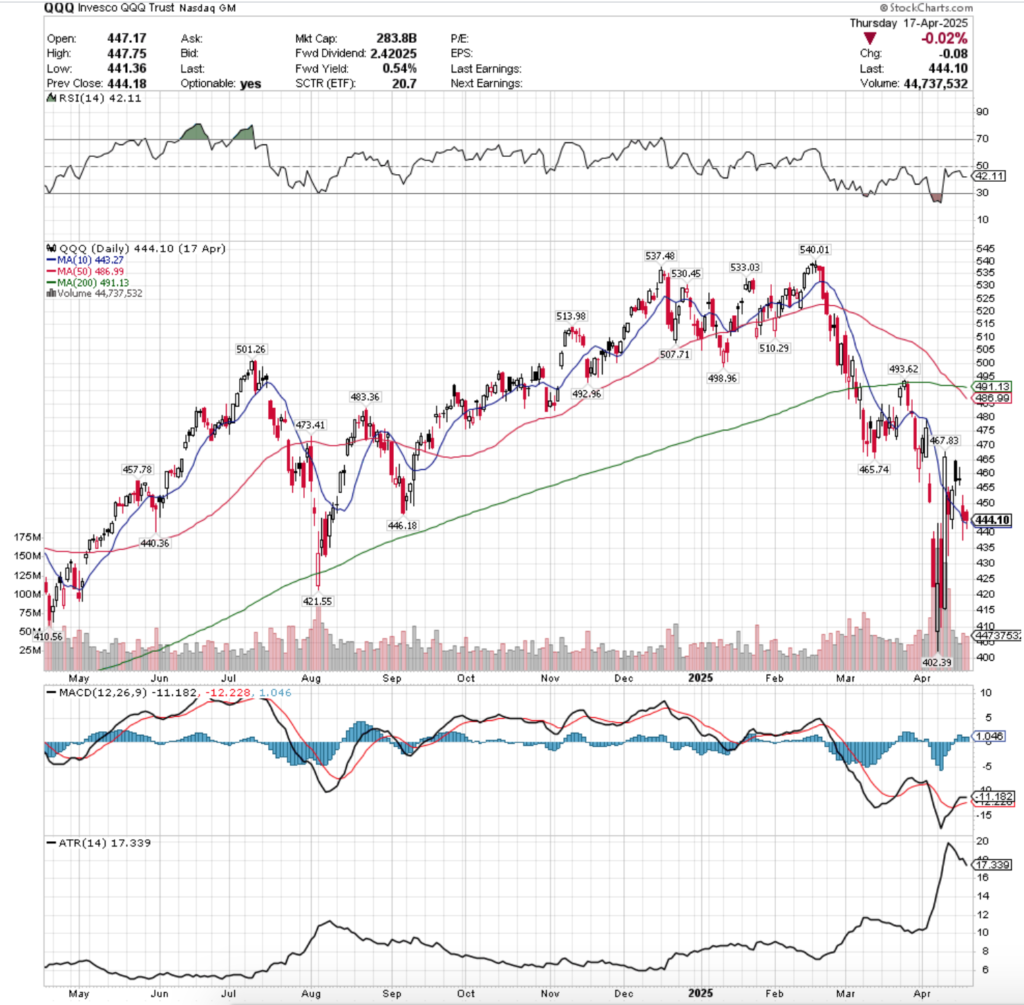
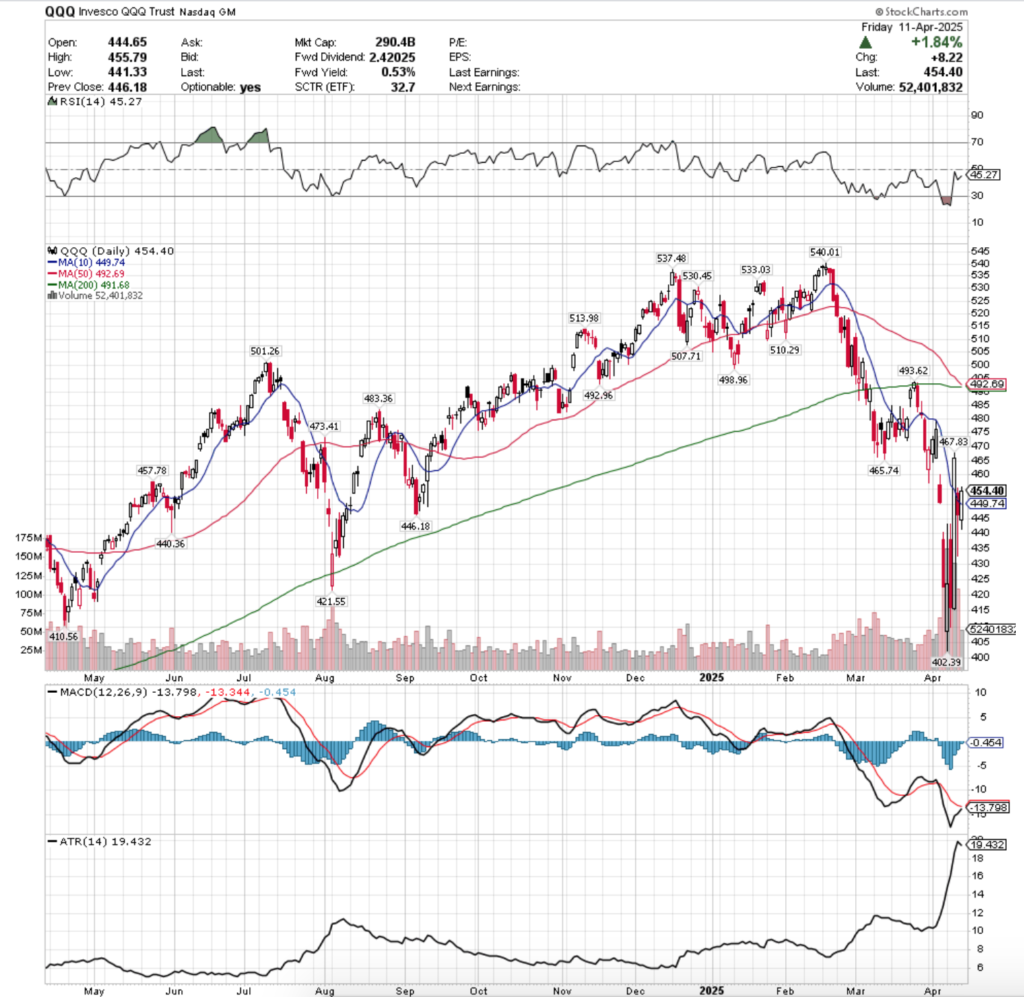
QQQ, the Invesco QQQ Trust ETF dipped -0.02% last week, and much like SPY it was mostly only that muted of a decline due to Monday’s gap up open.
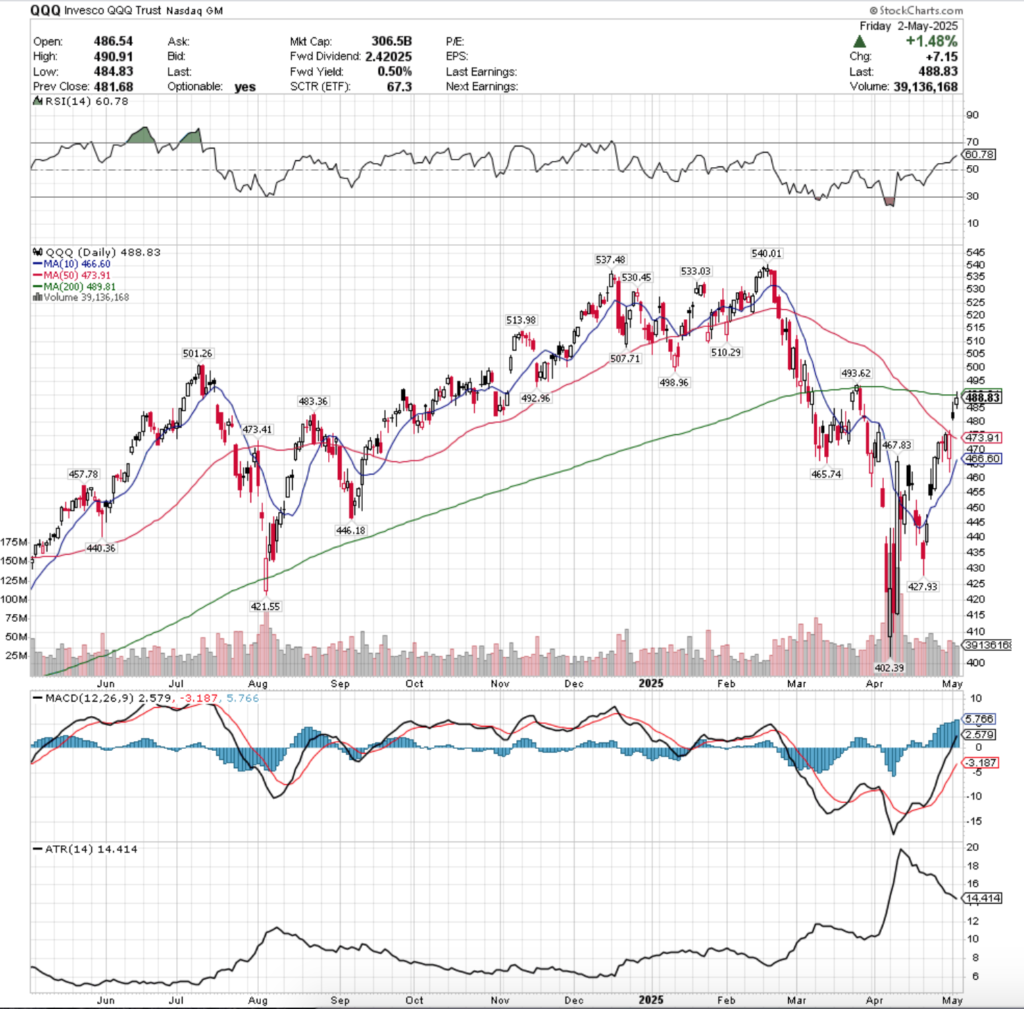
QQQ ETF – Invesco QQQ Trust ETF’s Technical Performance Over The Past Year
Their RSI is trending down towards the neutral 50 level at 57.03, while their MACD is bearish & looks to signal more trouble on the near-term horizon.
Volumes were +19.62% higher than the previous year’s average (46,355,000 vs. 38,750,598), which paints a bleaker picture when you factor in that the weekest session of the week was the only advancing one, signaling that there was quite a bit of risk being taken off of the table.
QQQ’s week looked an awful lot like SPY’s with only a few small differences.
Monday’s gap up session for QQQ was their weakest volume of the week, which was quite telling about the rest of the week’s performance.
Tuesday opened lower, and while there was briefly an attempt higher the Sellers came out in droves to force a breakdown of the 10 day moving average’s support.
Wednesday this theme continued on higher declining volume, as Sellers emerged more & more throughout the week & there was more of a risk-off sentiment emerging that looks poised to carry over into the new week.
Wednesday’s candle formed a bearish harami, which was bearishly engulfed by Friday’s candle on even higher volume, which is even more bleak.
Like SPY, the upside case is relying on there not being a bearish head & shoulders pattern emerging, where the shoulders are $536.78 & $537.48/share.
Those levels need to be broken through in order for there to be a run at QQQ’s all-time high of $540.01 (the head).
Consolidation case is also like SPY’s, with the only difference being that their 50 day moving average is forming a bullish golden cross today, which may provide a brief pump, but unlikely based on the volume trends of last week.
To the downside QQQ’s first two support levels have been historically Seller zones, which will lead it down into the window formed by mid-May’s gap up & will likely force re-test of the long-term trendline.
For this week the 200 Day moving average is a good place to look from a downside perspective, as the $498-500/share is going to be a pivotal support level.
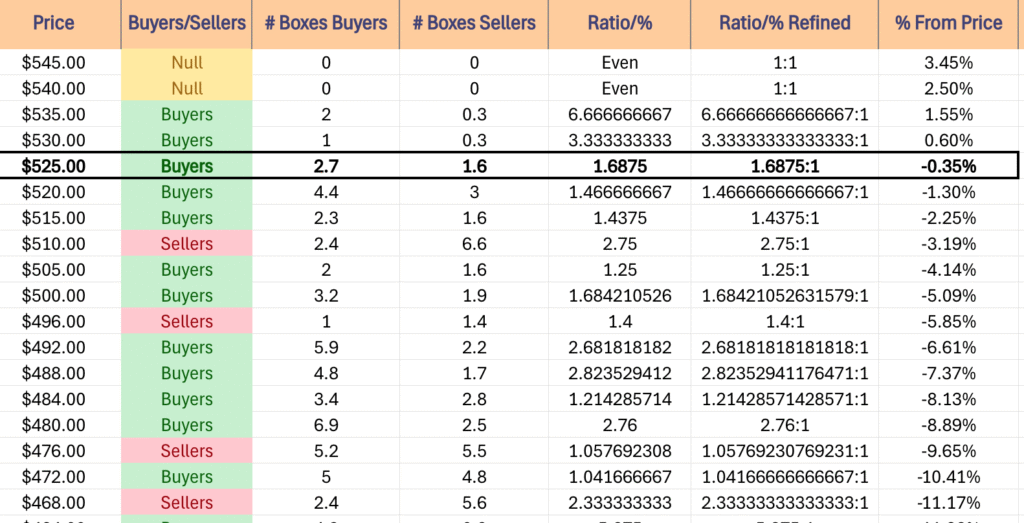
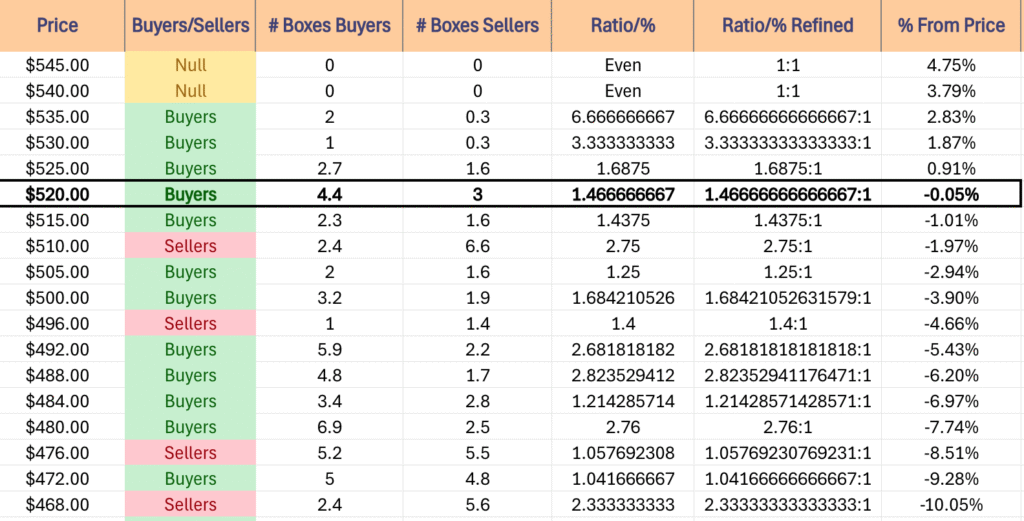
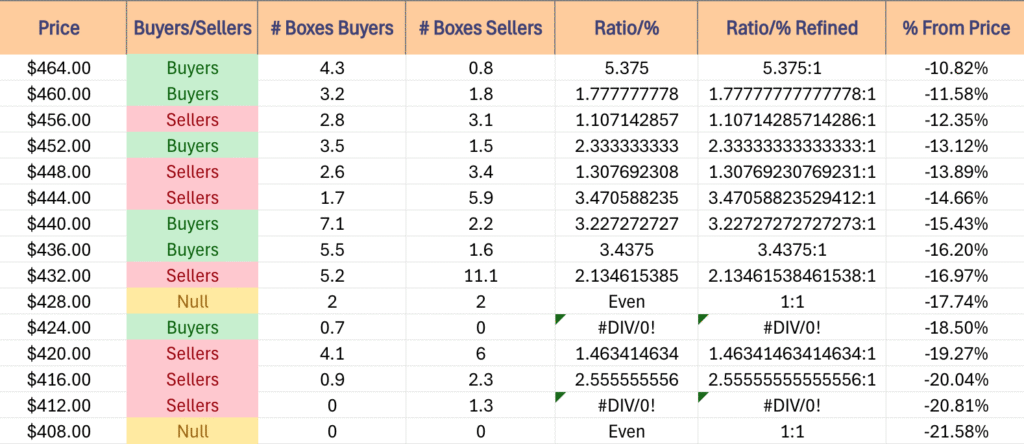
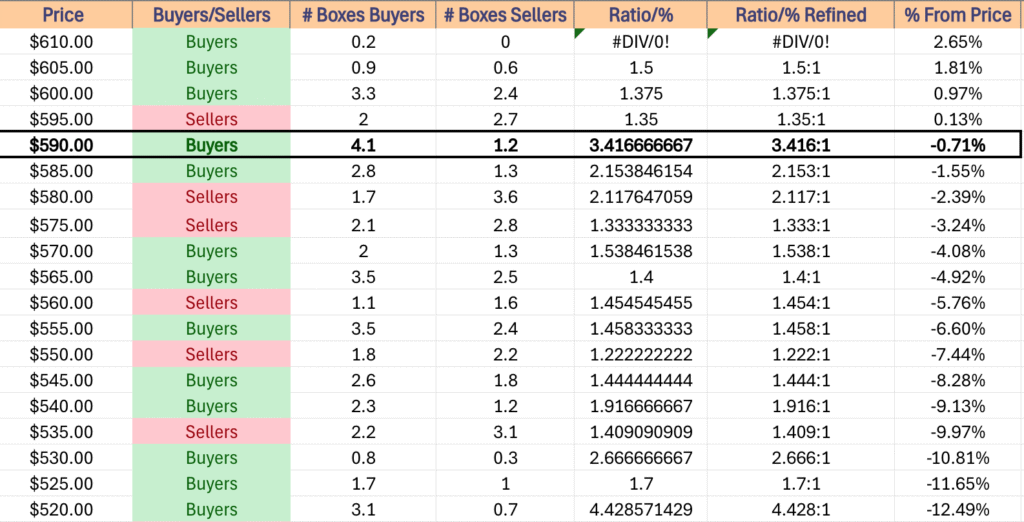
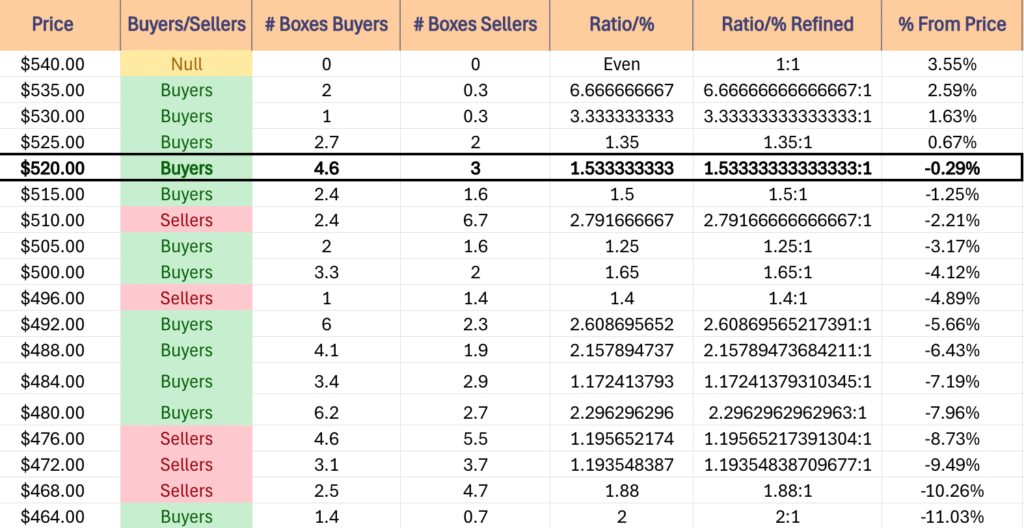
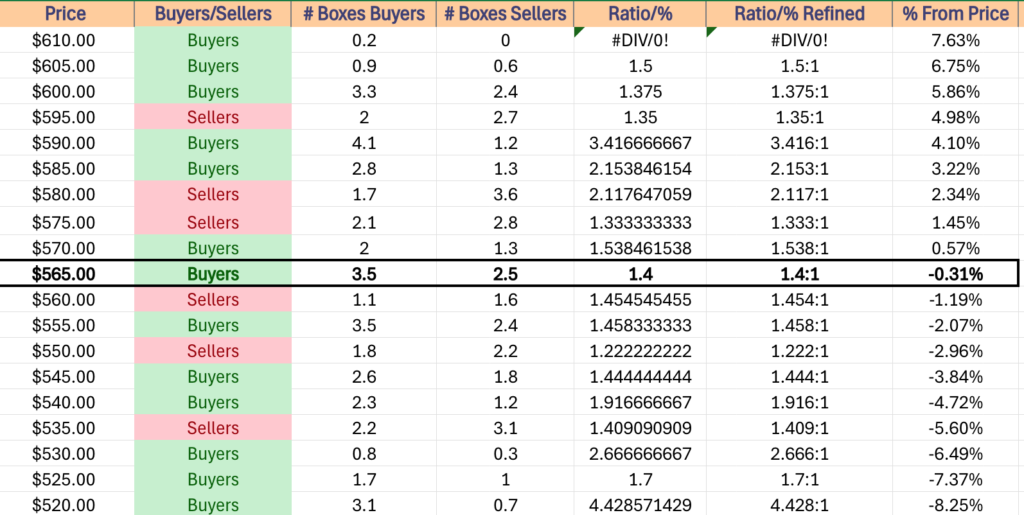
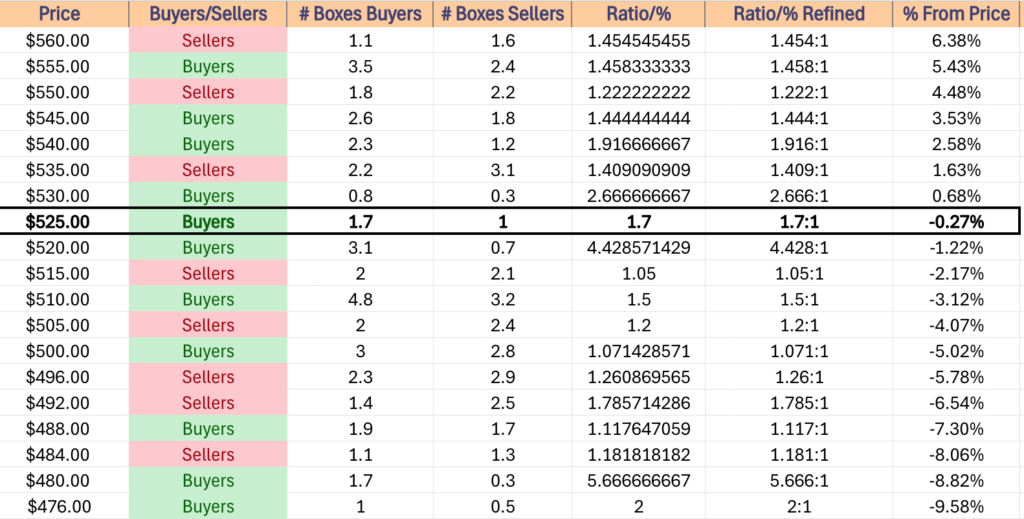
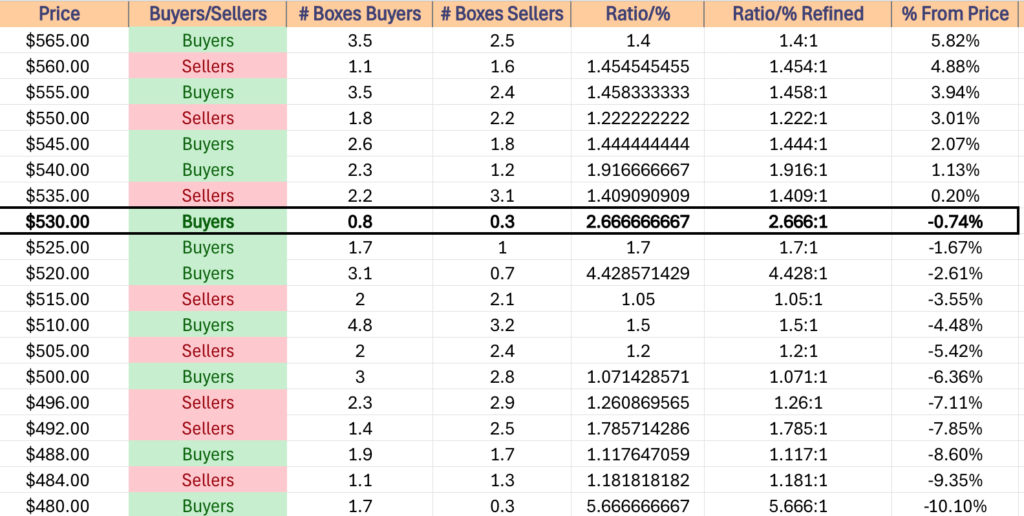
QQQ has support at the $513.98 (Volume Sentiment: Sellers, 2.75:1), $510.29 (Volume Sentiment: Sellers, 2.75:1), $507.71 (Volume Sentiment: Buyers, 1.25:1) & $501.26/share (Volume Sentiment: Buyers, 1.68:1) price levels, with resistance at the $530.45 (Volume Sentiment: Buyers, 3.33:1), $530.70 (Volume Sentiment: Buyers, 3.33:1), $533.03 (Volume Sentiment: Buyers, 3.33:1) & $536.78/share (Volume Sentiment: Buyers, 6.67:1) price levels.
QQQ ETF’s Price Level:Volume Sentiment Over The Past ~1 Year
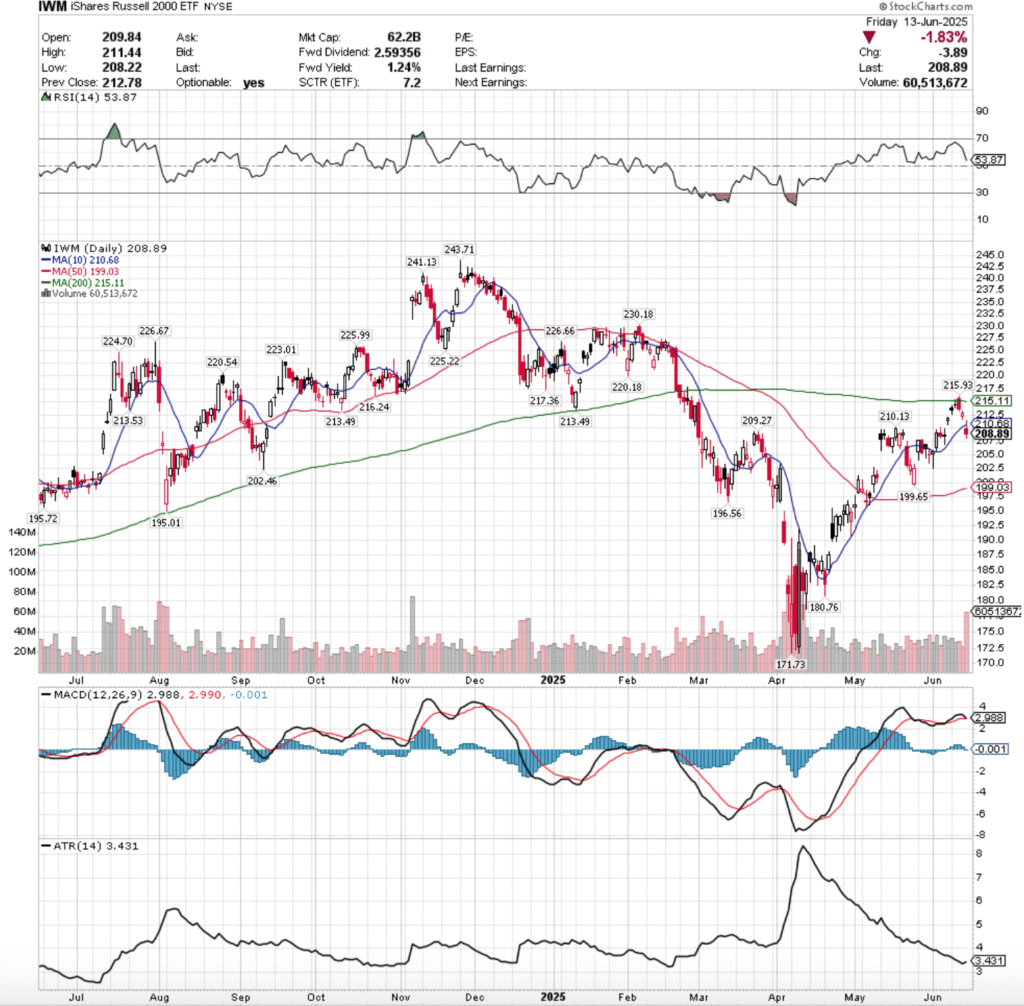
IWM, the iShares Russell 2000 ETF advanced +0.15% for the week, as there was a rotation into the small cap index after much of the past two months showed more people buying into its larger peers.
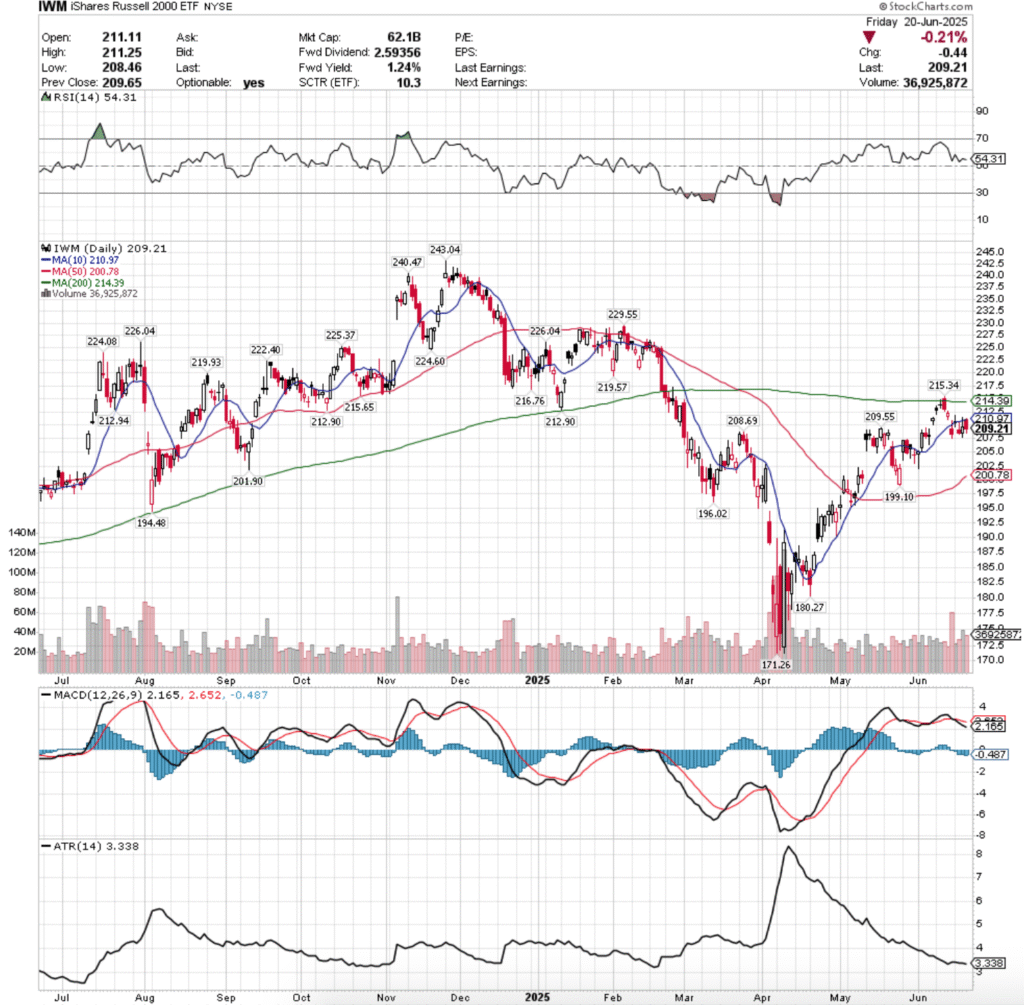
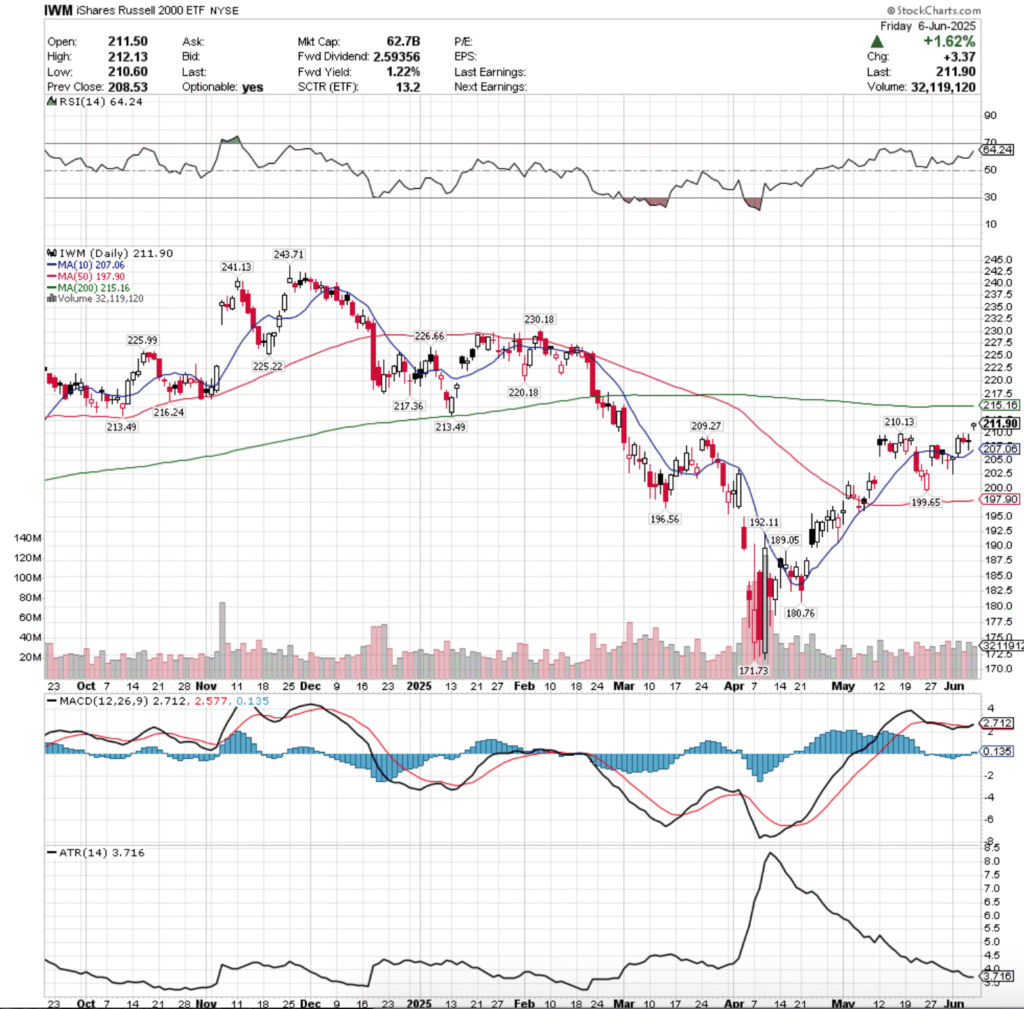
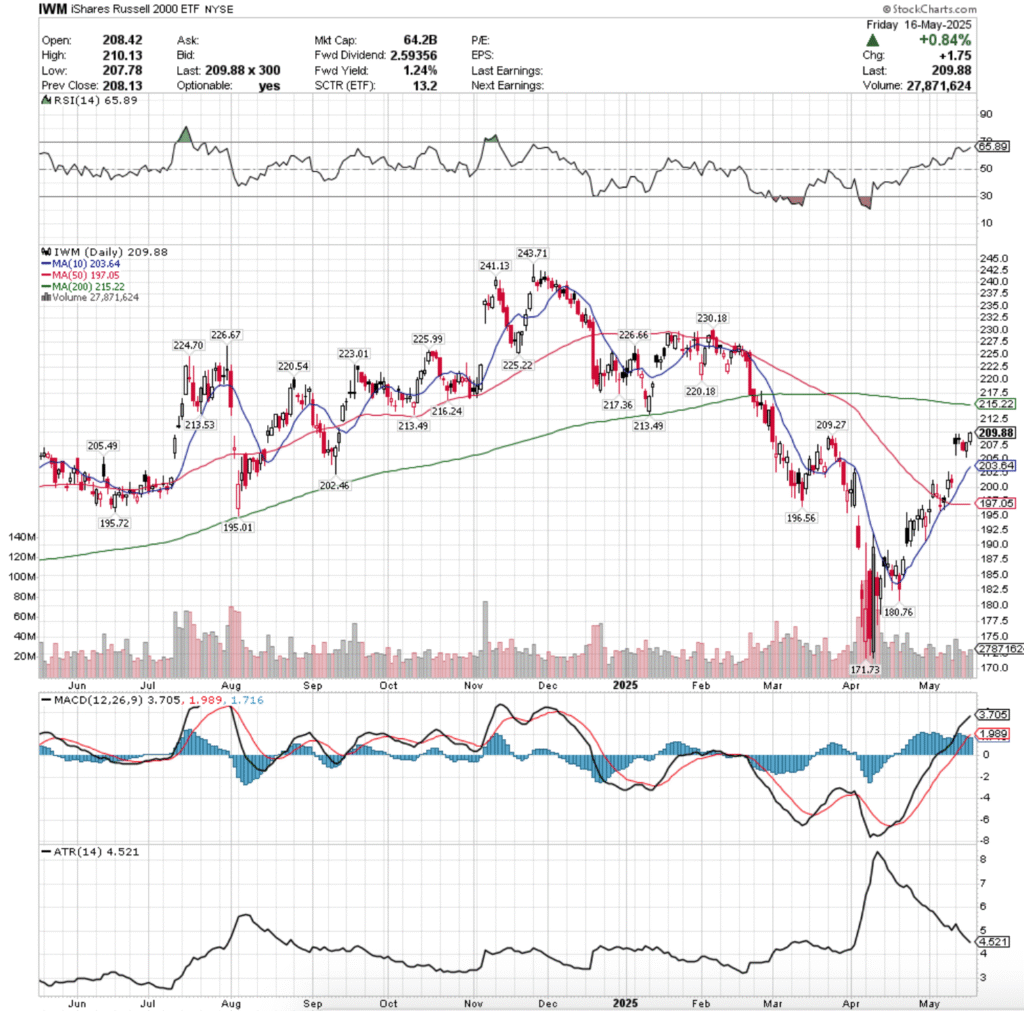
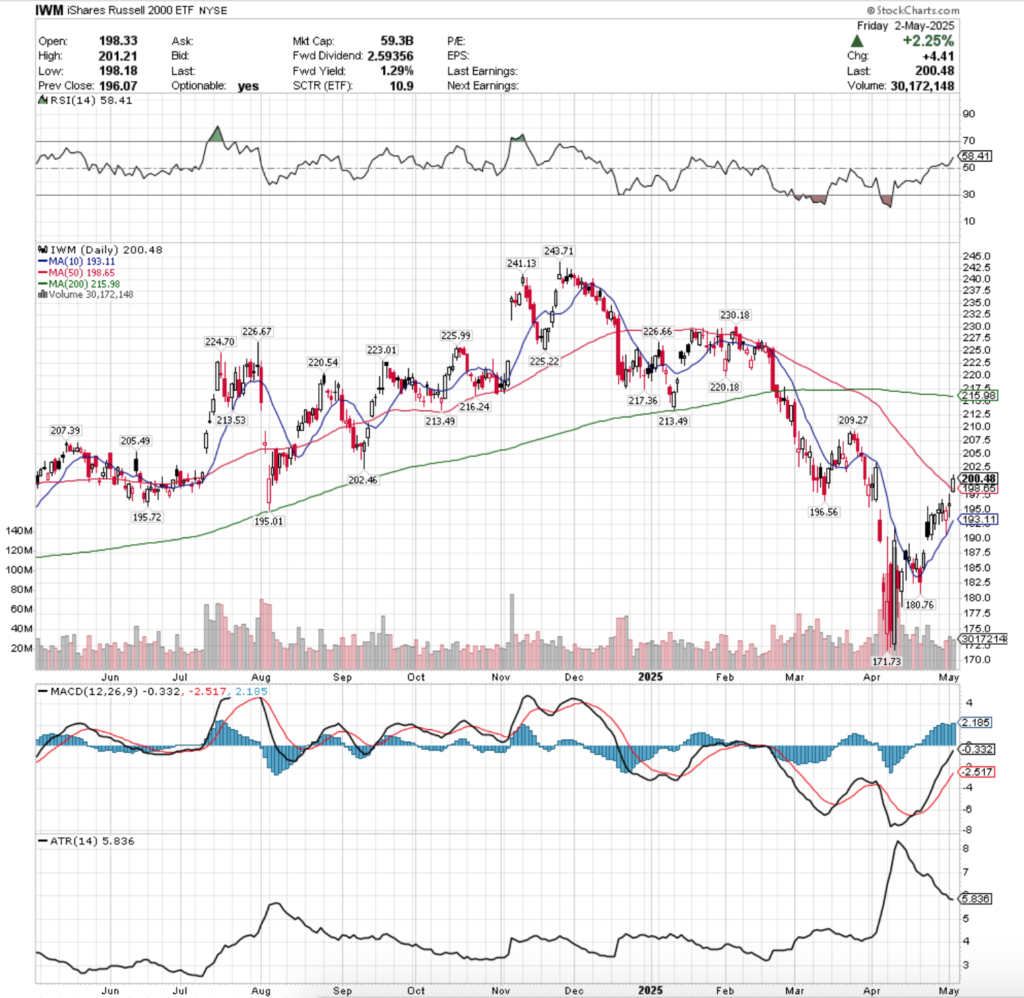
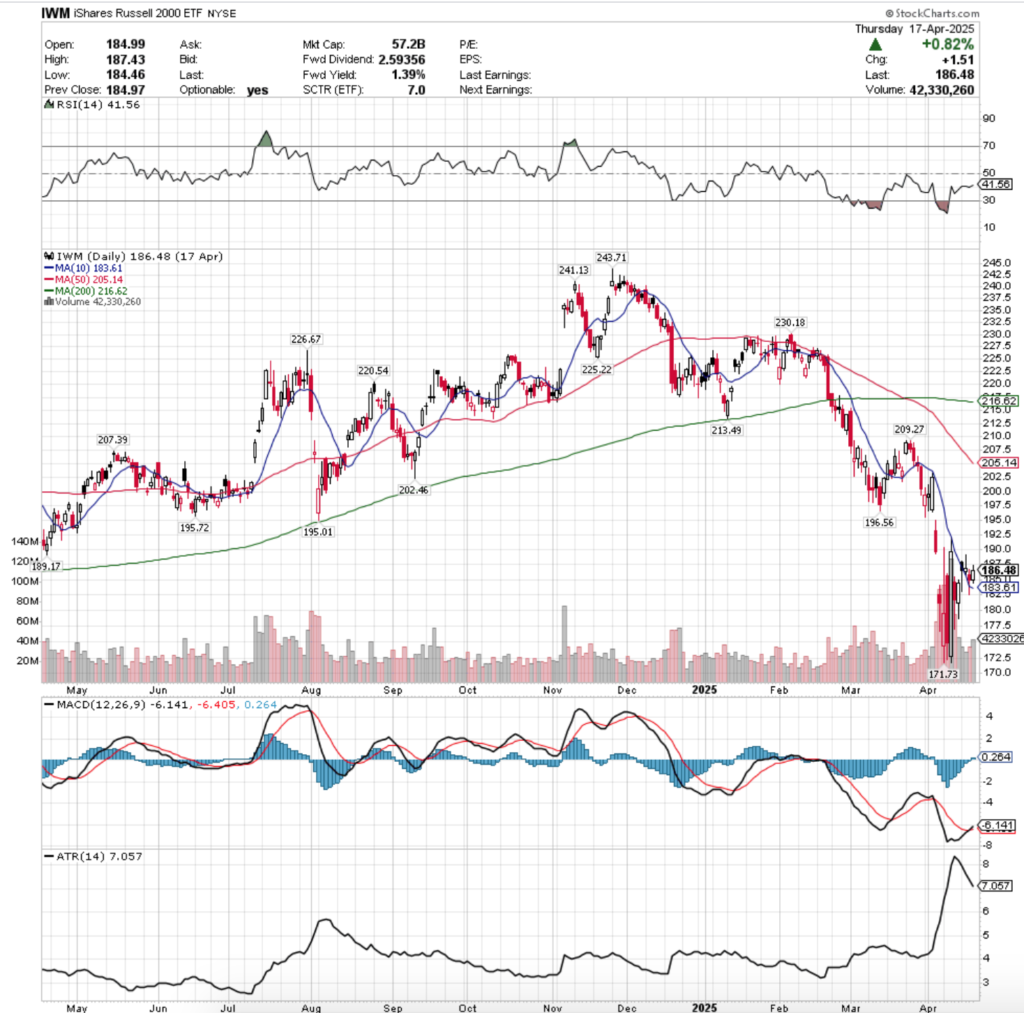
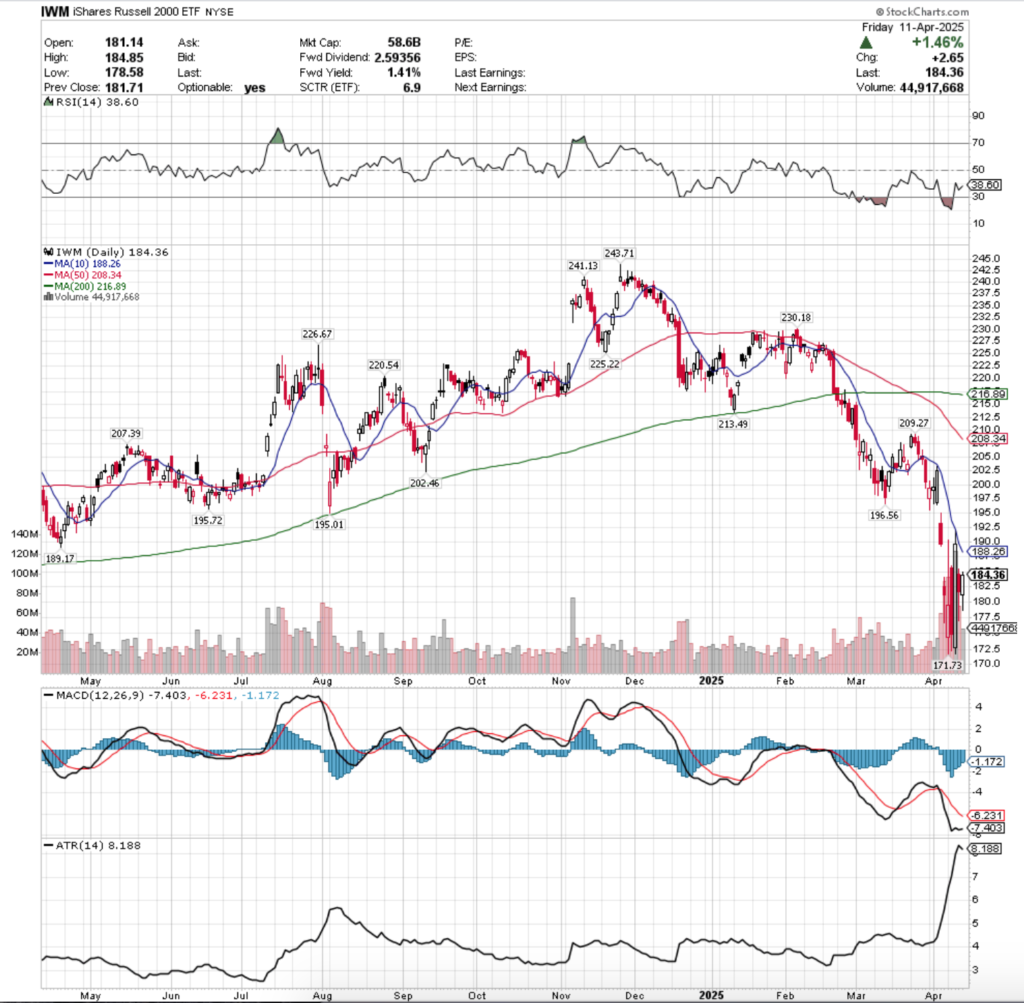
IWM ETF – iShares Russell 2000 ETF’s Technical Performance Over The Past Year
Their RSI is also declining back towards the neutral 50 level despite a stronger weekly performance than the aforementioned indexes & is currently at 54.31, while their MACD is bearish, and looks content on heading lower based on last week’s performance.
Volumes were +15.86% higher than the prior year’s average (35,410,000 vs. 30,562,351), but while Wednesday’s advancing volume led the pack in terms of strongest performing day, Friday’s risk-off move signaled that there is still quite a bit of uncertainty out there among market participants.
IWM saw a different type of week, bucking the trend of the major indexes declining for the week.
Monday opened on a gap up, and resulted ina high wave doji candle that closed in-line with the 10 day moving average, indicating that there was a strong tie to price & the short-term trendline & despite the wide trading range of the day the session produecd the lowest volume of the week.
Tuesday opened on a gap lower, attempted a run up to the resistance of the 10 day moving average, but promptly fell & resulted in a declining session.
Wednesday was the crown jewel of IWM’s week, as the session resulted in the week’s highest volume & a bullish engulfing candle, but there was a problem.
The 10 day moving average’s resistance held strong & to the downside market participants were willing to test the $207.50/share level, indicating that there was some pent up downside appetite that we had not been seeing previously.
Friday left a sour taste for IWM’s week, when the small cap index opened on a gap up in-line with the 10 day moving average, only to progress lower throughout the session & close -0.21% on the week’s second highest volume.
Risk-off into the weekend was the theme, and profits were taken to safety.
The coming week will likely hinge greatly on the other major indexes’ performances, but to the upside the $212.90/share level will be a target that needs to be overcome, as there are two resistance touch-points there.
After that the 200 day moving average comes into view, as the price has not been above the long-term trendline since February of 2025.
Consolidation looks much like SPY & QQQ’s short-term bearish head & shoulders formation forming from May’s gap up session.
To the downside the main place to keep an eye on is the 50 day moving average, as it is the gatekeeper to a Seller dominated price zone.
If it doesn’t hold up as support there is likely to be a run at the 52-week low given the unfilled gap from mid-April in the $187.50-190 range.
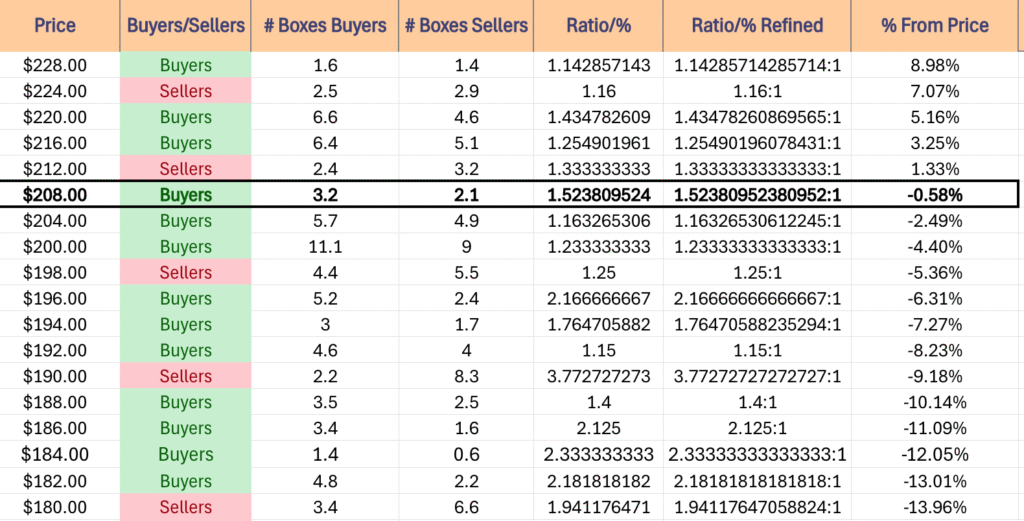
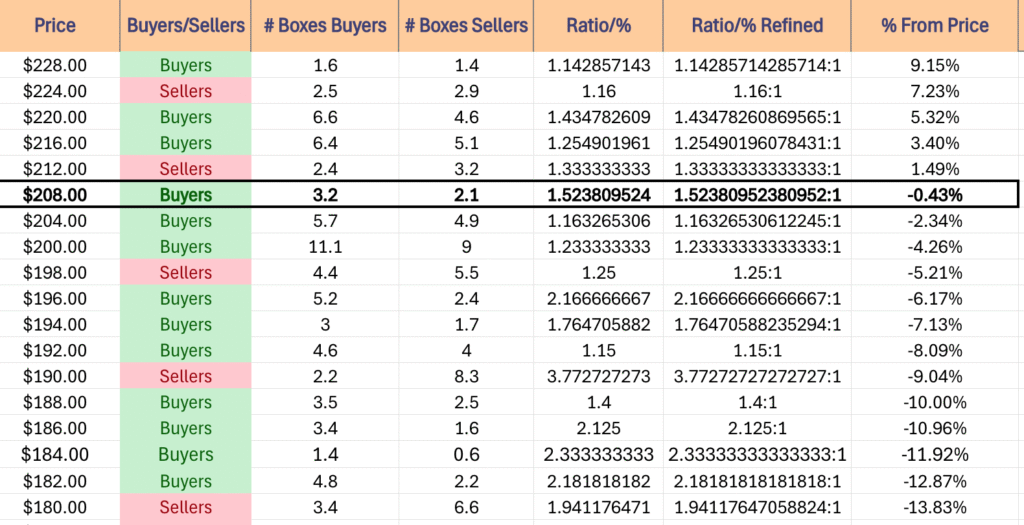
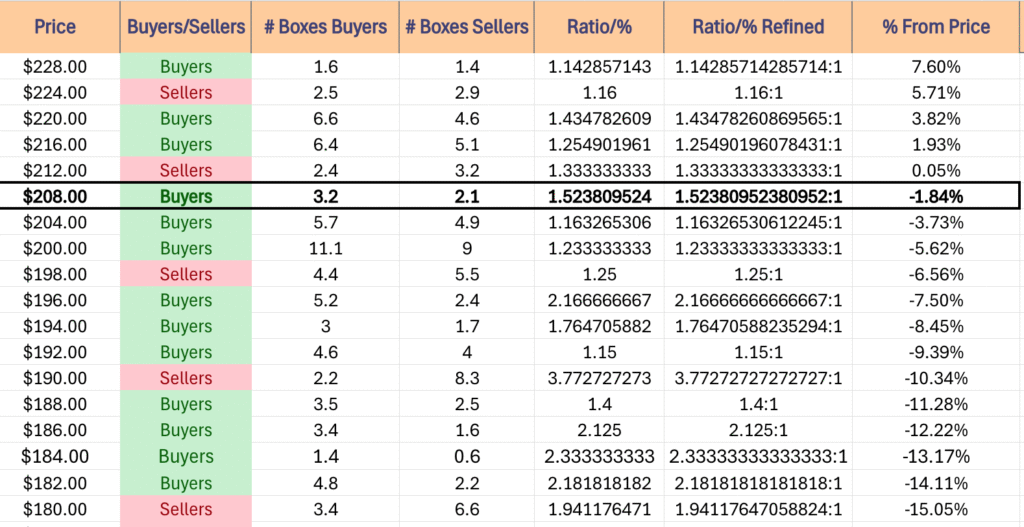
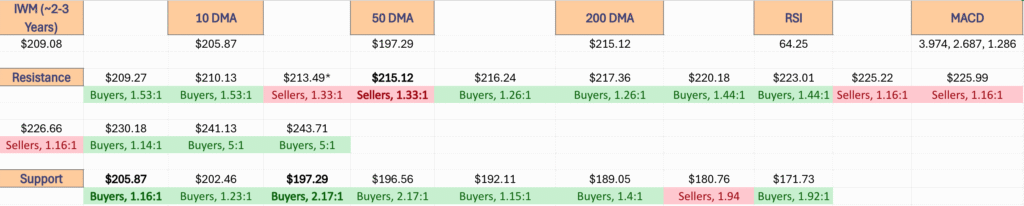
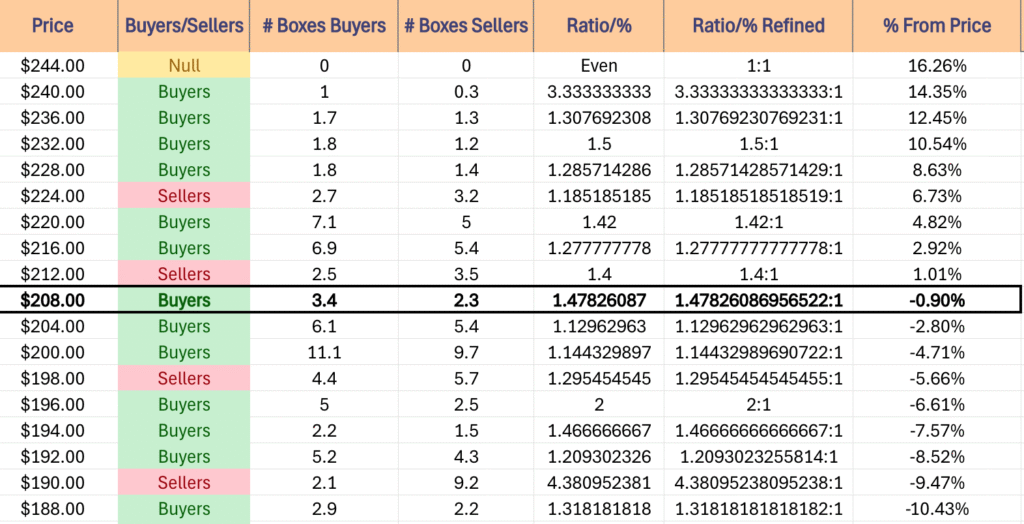
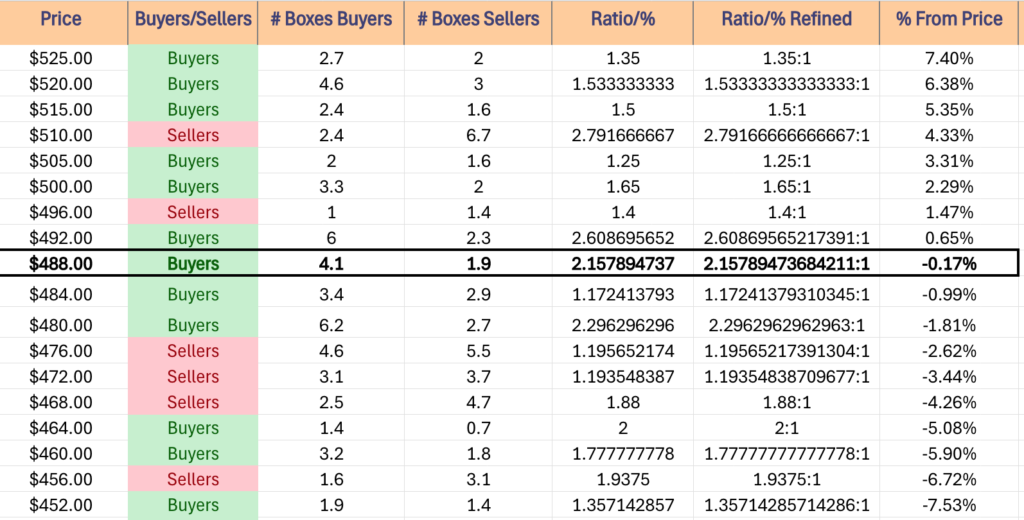
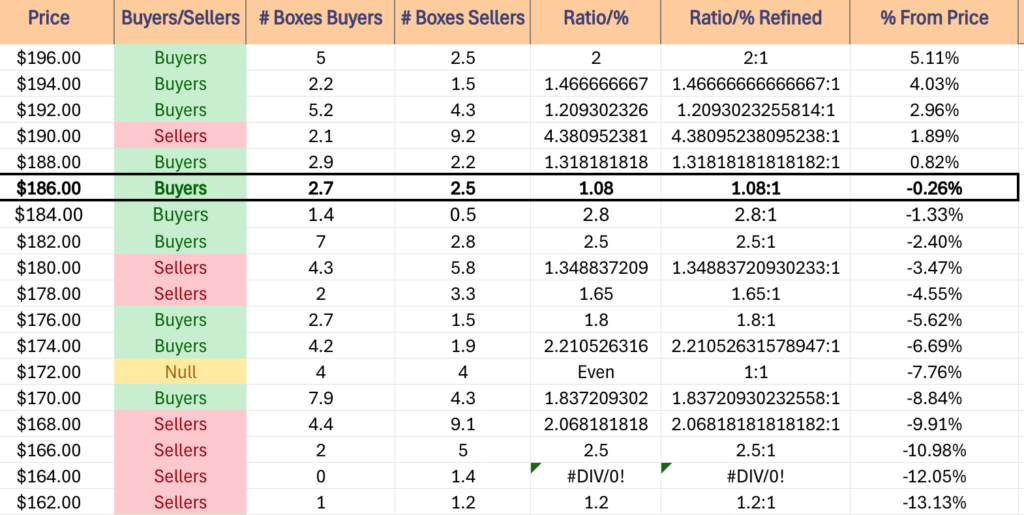
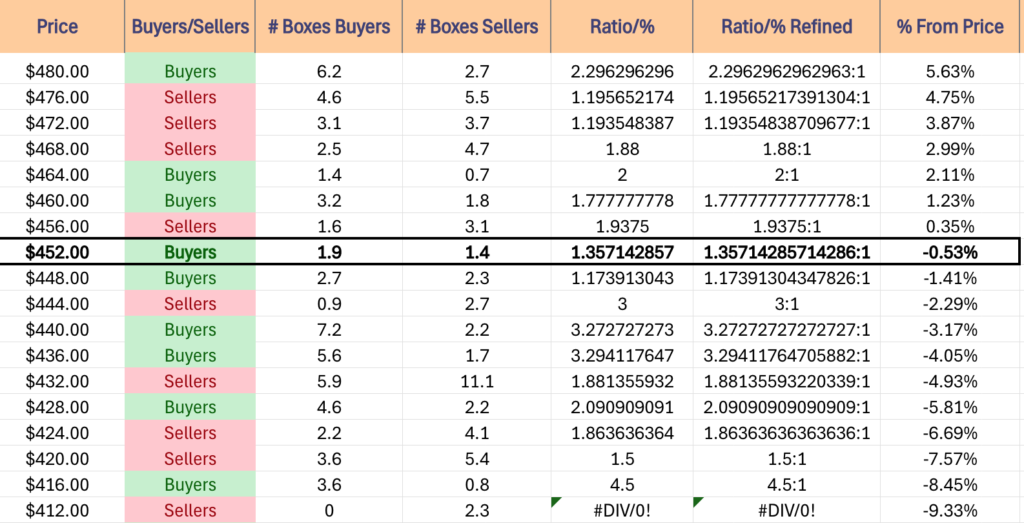
IWM has support at the $208.69 (Volume Sentiment: Buyers, 1.52:1), $201.90 (Volume Sentiment: Buyers, 1.23:1), $200.78 (50 Day Moving Average, Volume Sentiment: Buyers, 1.23:1) & $199.10/share (Volume Sentiment: Sellers, 1.25:1) price levels, with resistance at the $209.55 (Volume Sentiment: Buyers, 1.52:1), $210.97 (10 Day Moving Average, Volume Sentiment: Buyers, 1.52:1), $212.90 (2 Touch-Points, Volume Sentiment: Sellers, 1.33:1) & $212.94/share (Volume Sentiment: Sellers, 1.33:1) price levels.
IWM ETF’s Price Level:Volume Sentiment Over The Past ~3 Years
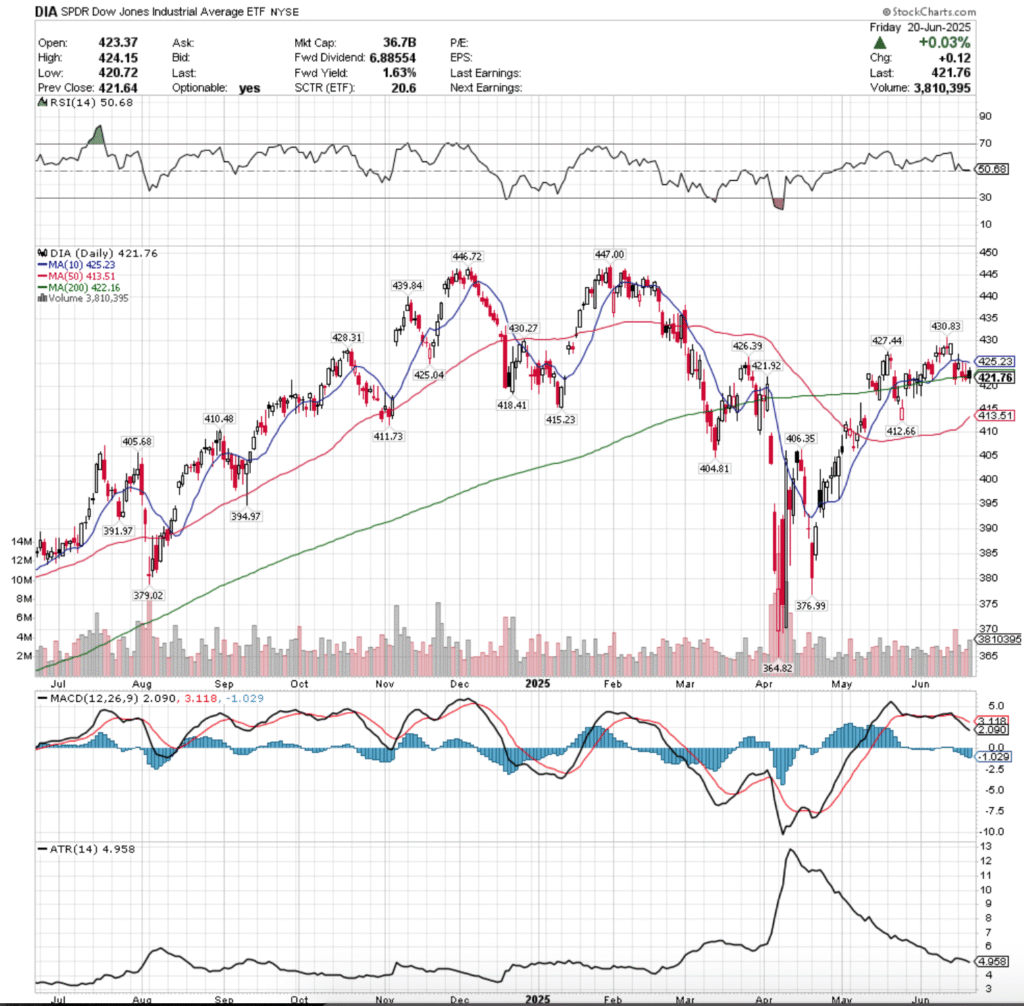
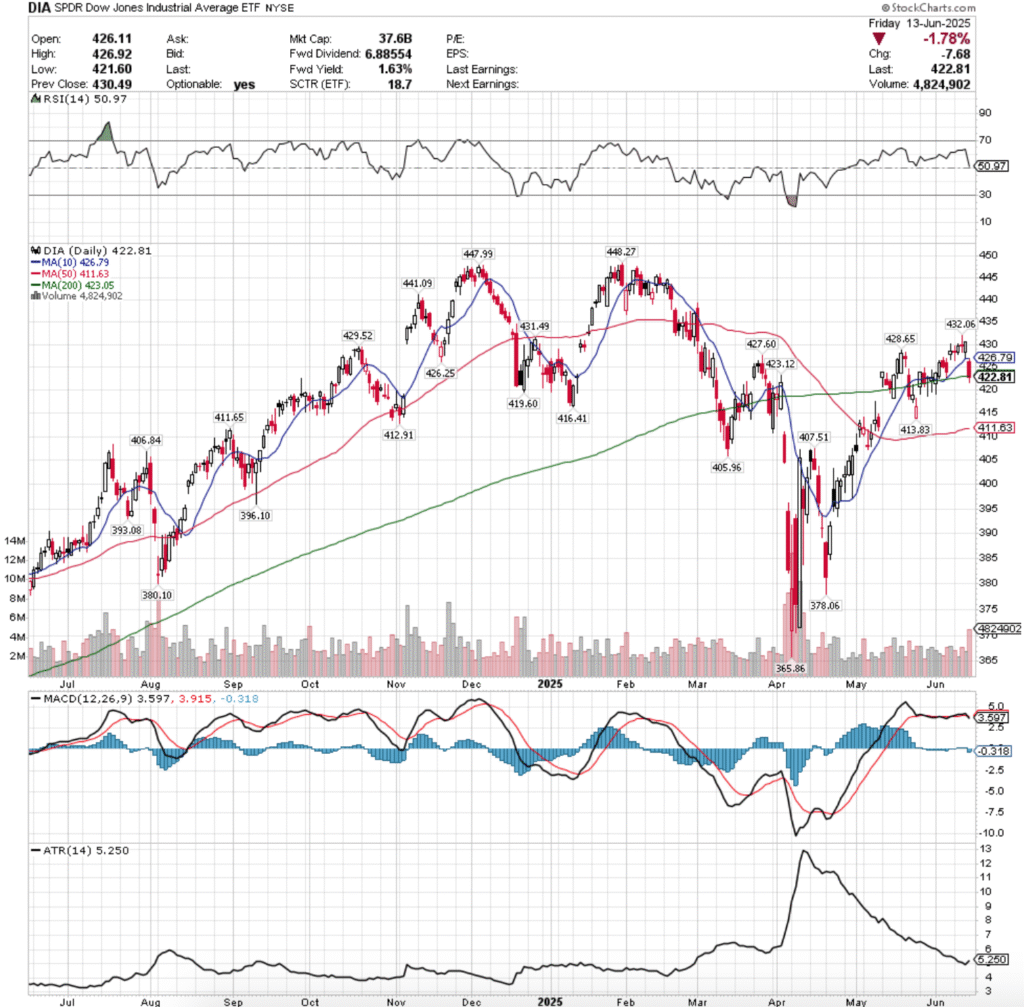
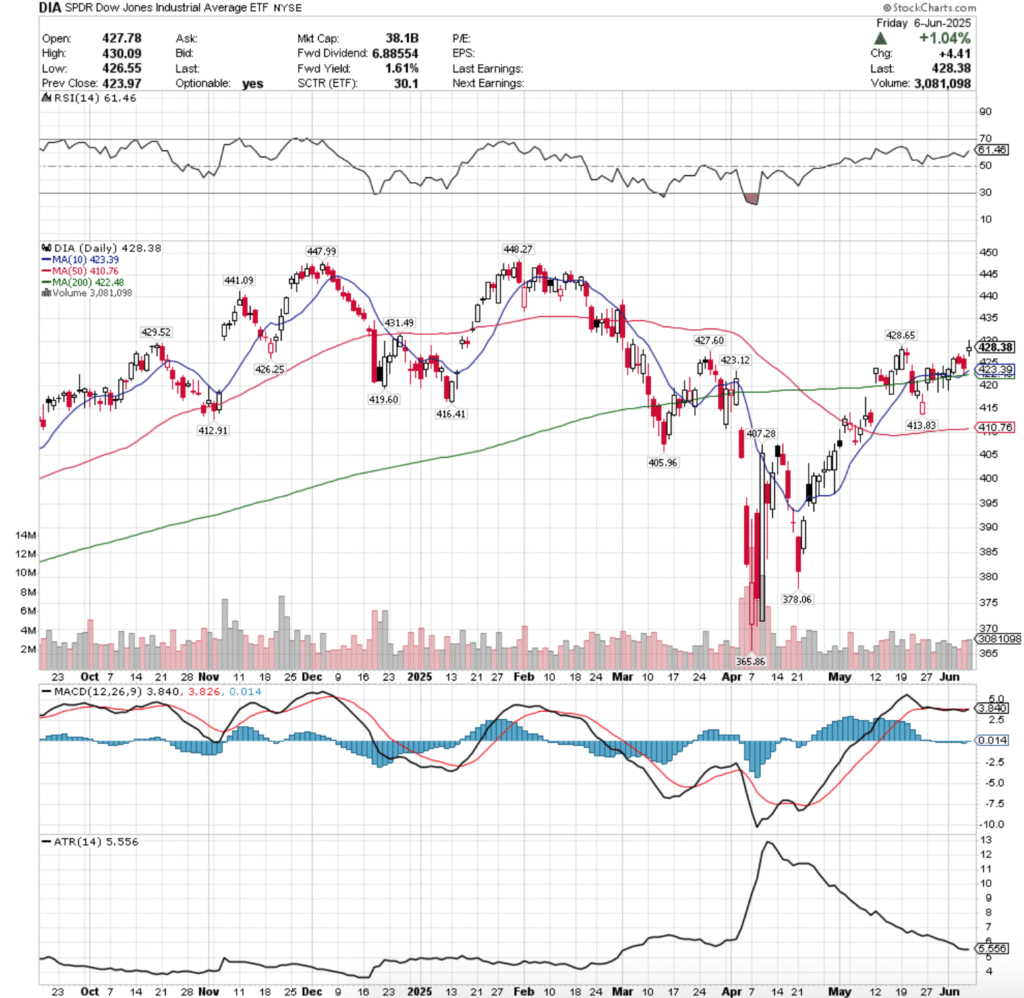
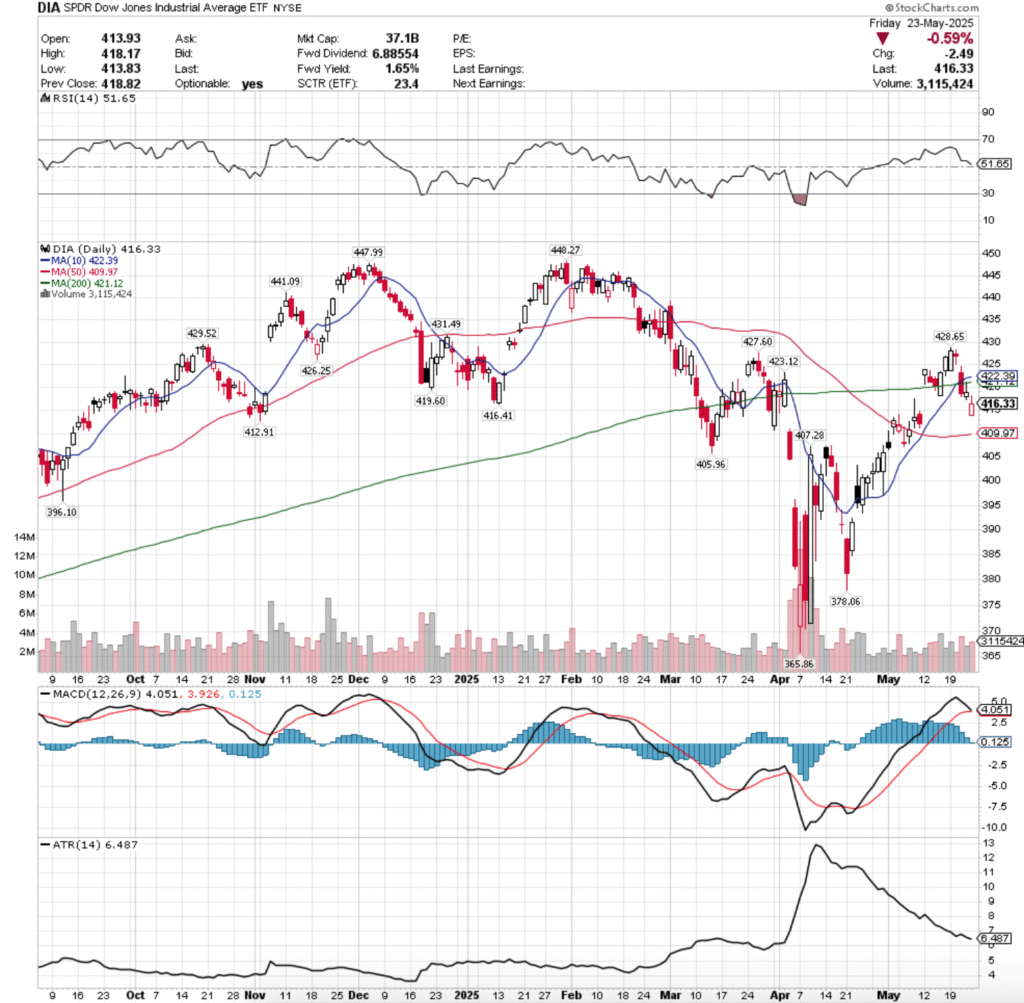
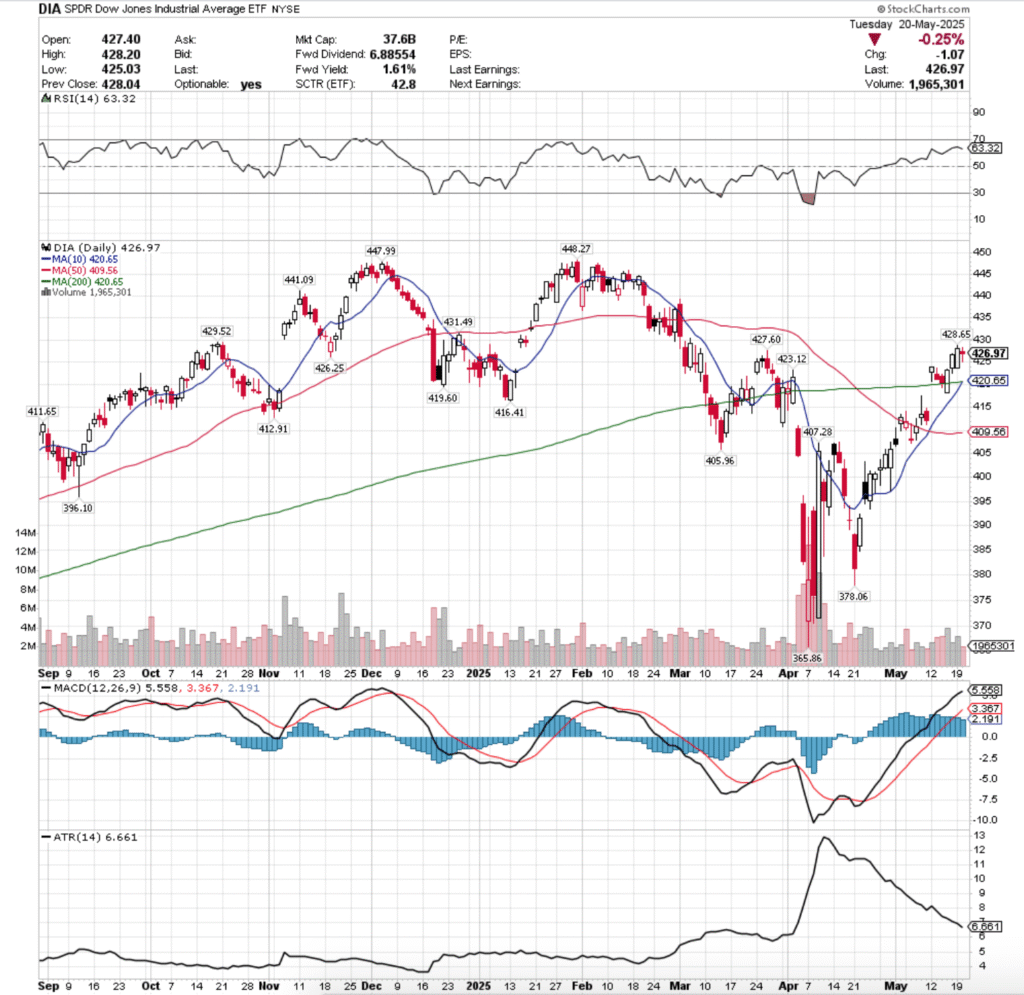
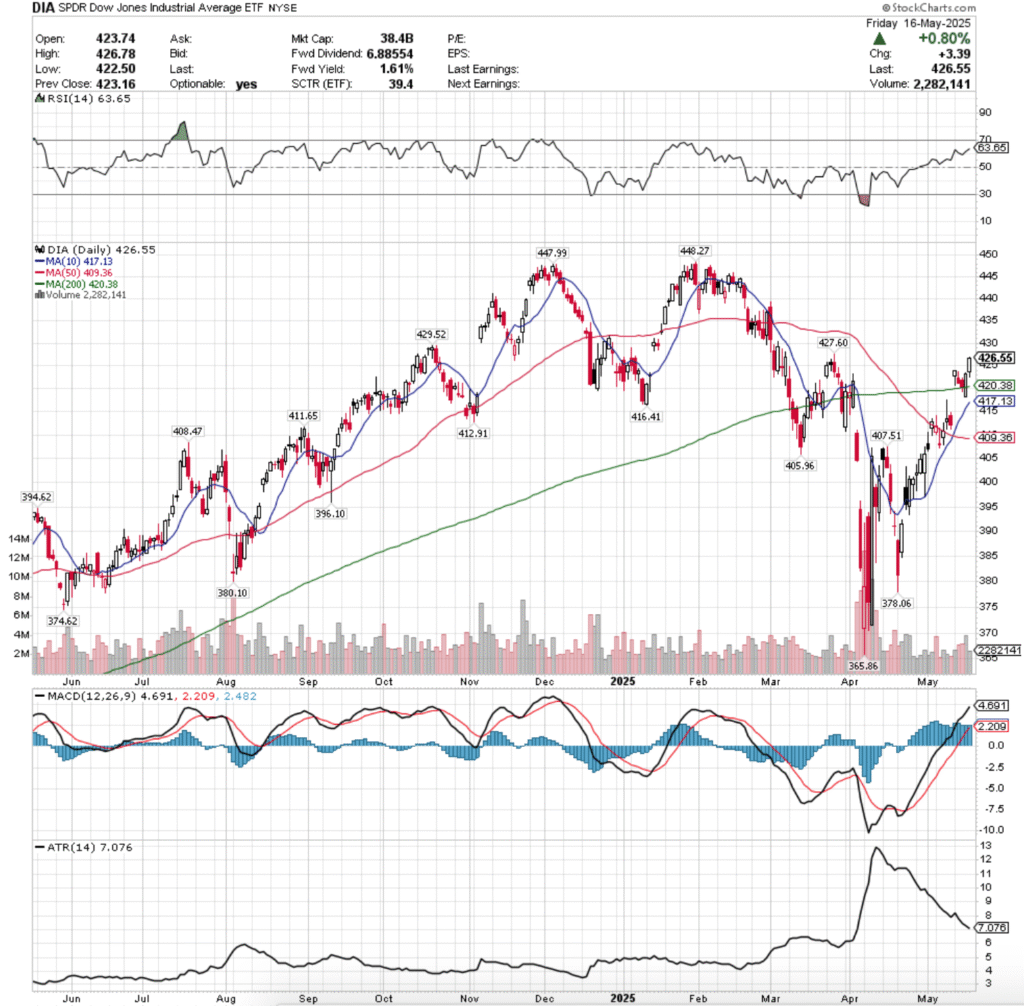
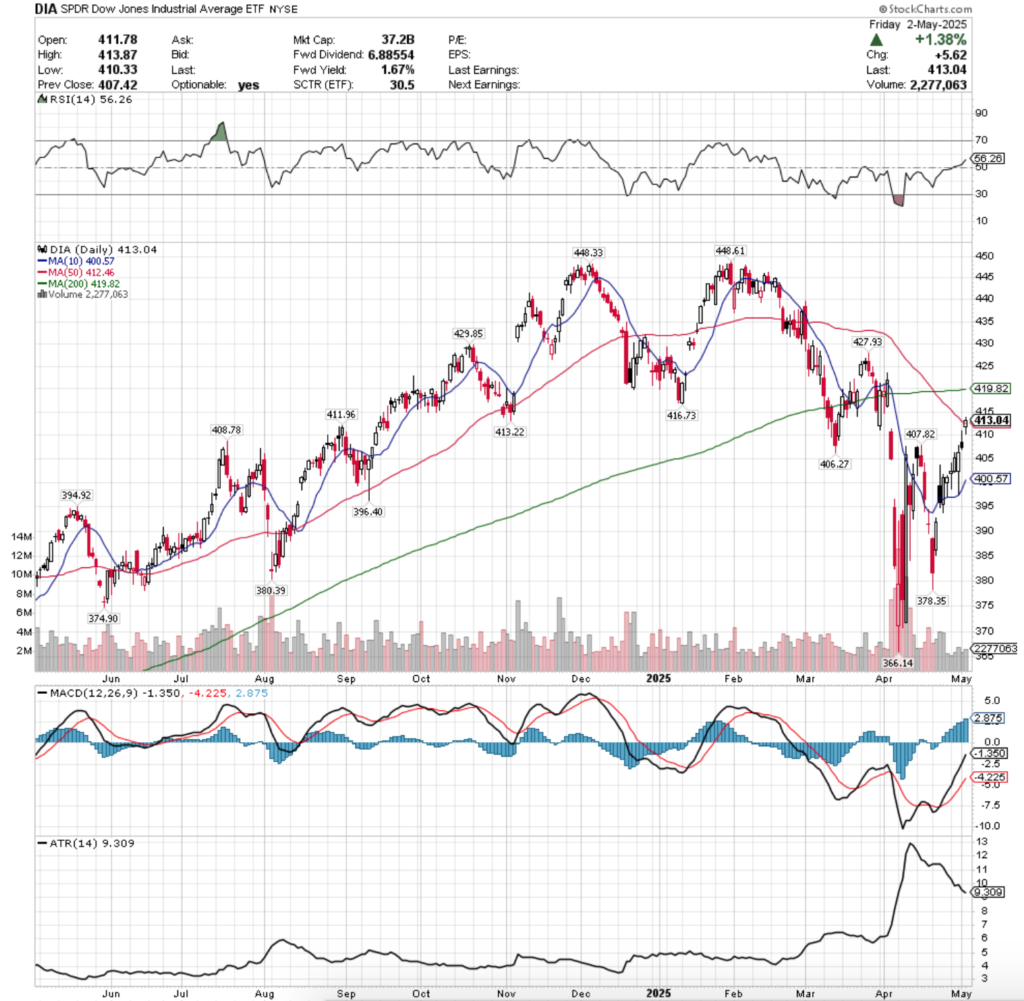
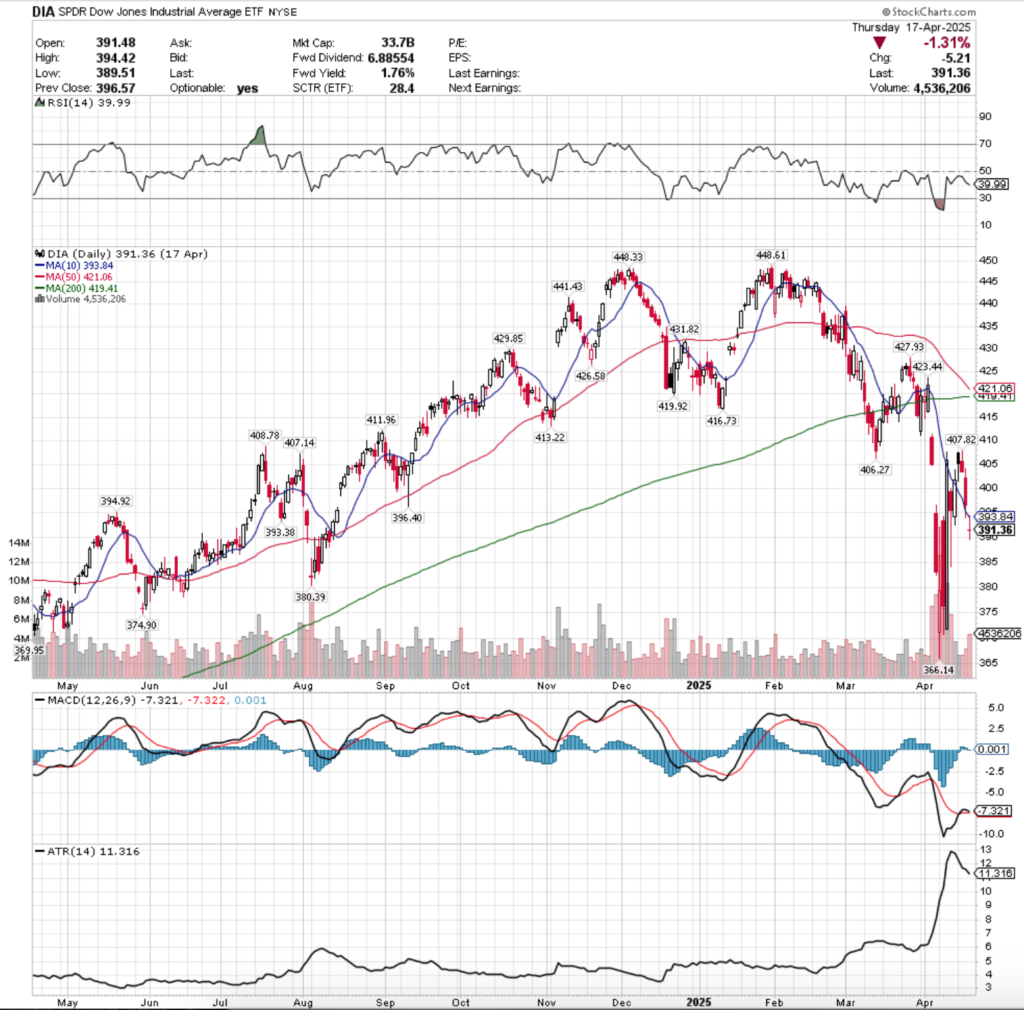
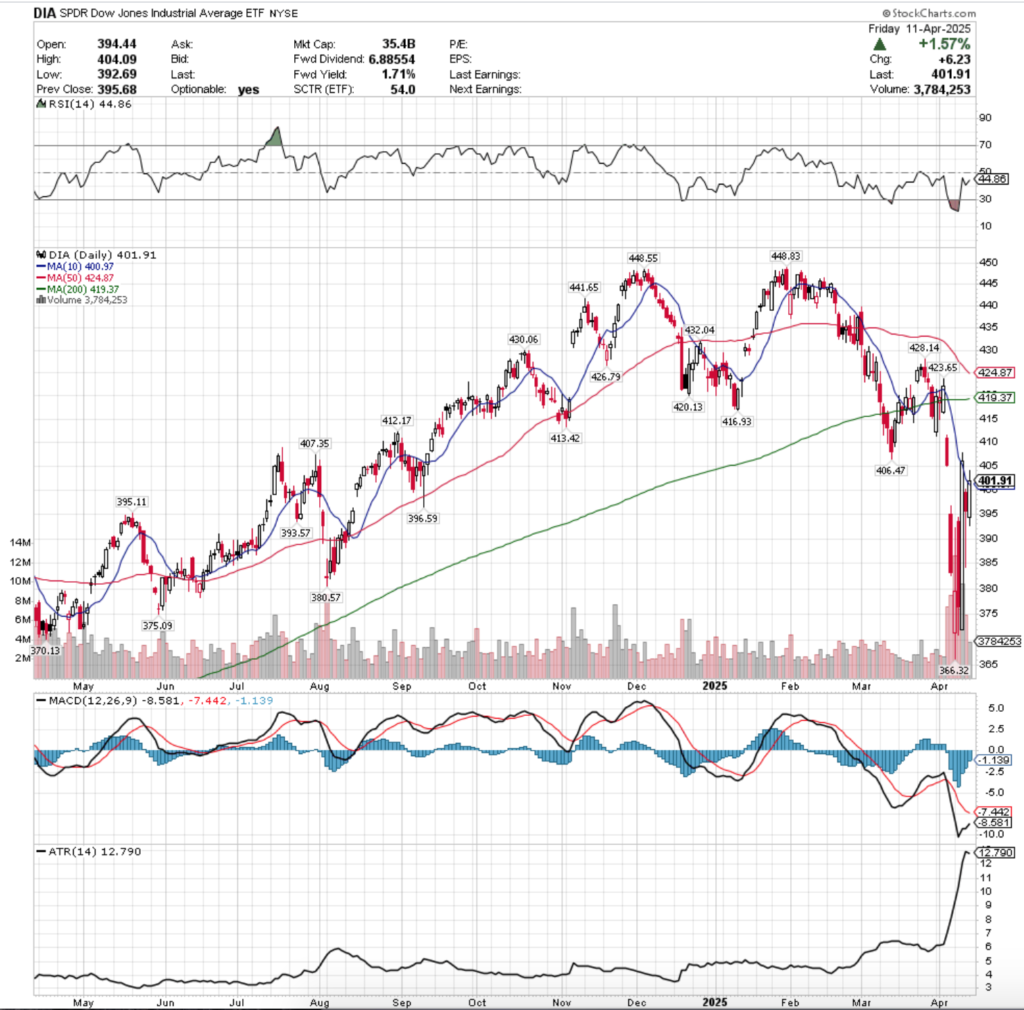
DIA ETF – SPDR Dow Jones Industrial Average ETF’s Technical Performance Over The Past Year
Their RSI is flat at 50.68, straddling the neutral 50-level, while their MACD is bearish & stretching lower indicating that there is likely more short-term pain to come.
Volumes were -4.14% below the prior year’s average levels (3,057,500 vs. 3,189,681), which paints an interesting picture given Friday had the best volume of the week on an advancing session, but given that it closed below both its opening price & the 200 DMA paints a gloomy picture.
DIA’s week kicked off on a gap up open on the second highest volume of the week, which was able to temporarily break above the 10 day moving average’s resistance, but the proved to be short-lived and profit taking forced the session to close near the previous Friday’s open.
Tuesday opened on a gap down, but showed mixed signals as the lowest volume session of the week tested the resistance of the 10 day moving average but was rejected, before the 200 day moving average was tested & the long-term trendline showed signs of fatigue.
Wednesday was more of the same, but the real body of the session’s candle stayed on the lower end of the daily range, on slightly higher volume, indicating that there was a bit of hesitancy & risk aversion in the air.
Friday opened on a gap higher, but the week’s highest volume session resulted in a lot of profit-taking that drove prices to break down though the 200 day moving average temporarily, before closing lower than the day’s open just below the 200 day moving average.
Looking at their 10 day moving average vs. the 200 DMA we appear to have more pain on the horizon for DIA, but the upside case revolves heavily around breaking above the 200 & 10 day moving averages first, which appears unlikely without a massive shift in advancing volume.
Should we see that, the $430.83 is the high water target in the near-term.
The consolidation case also has the making of a bearish head & shoulders pattern emerging, with declines likely to come in the wake of the 10 DMA death crossing through the 200 DMA, but until then DIA will likely oscillate around & in between the two trendlines.
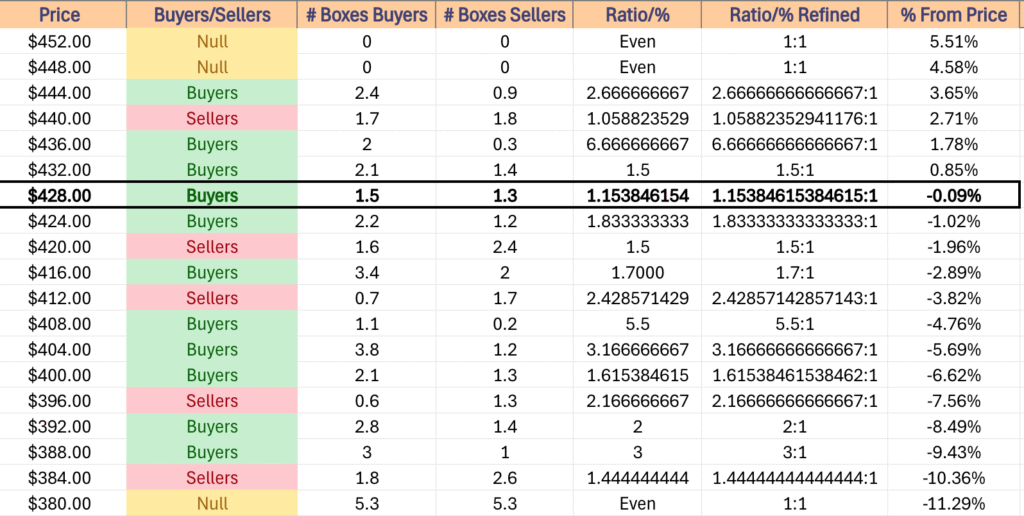
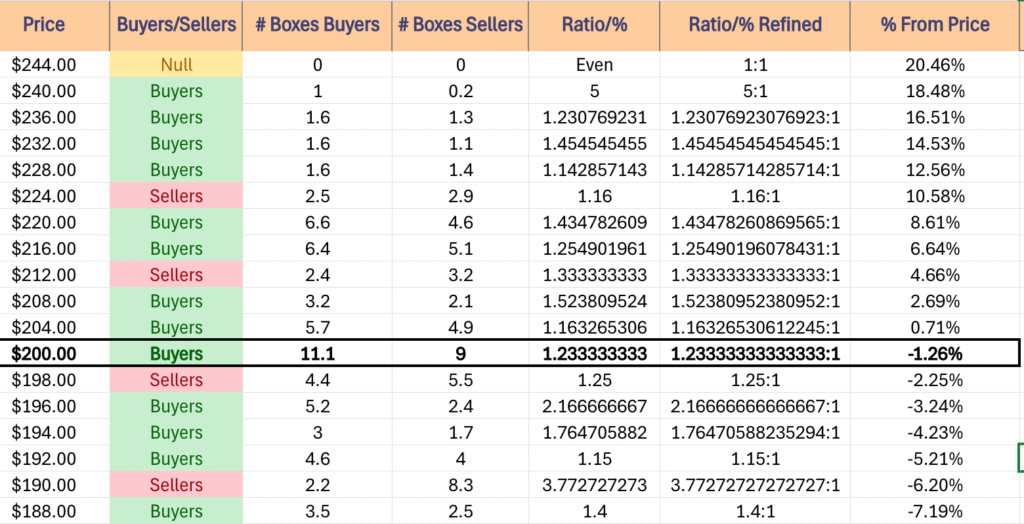
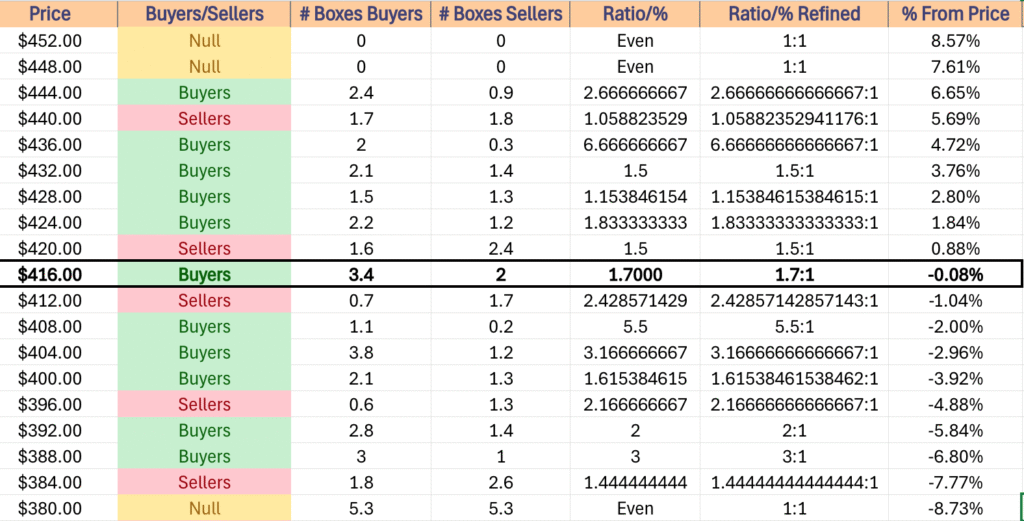
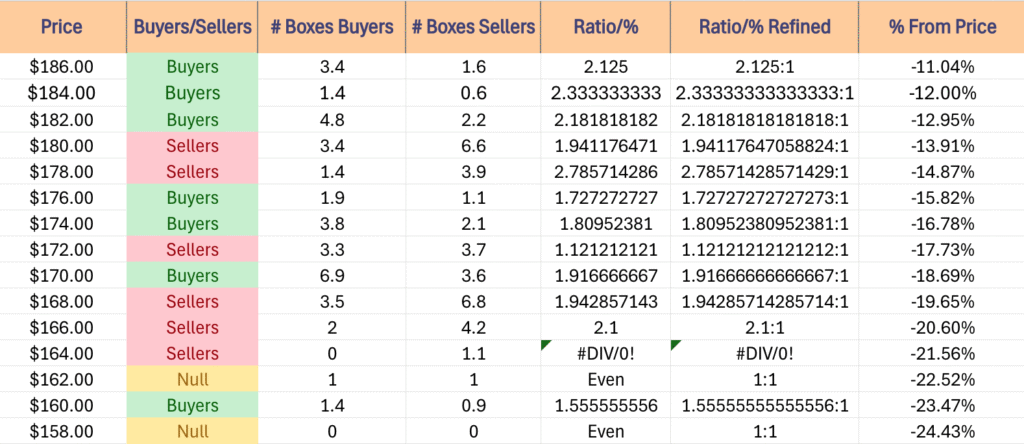
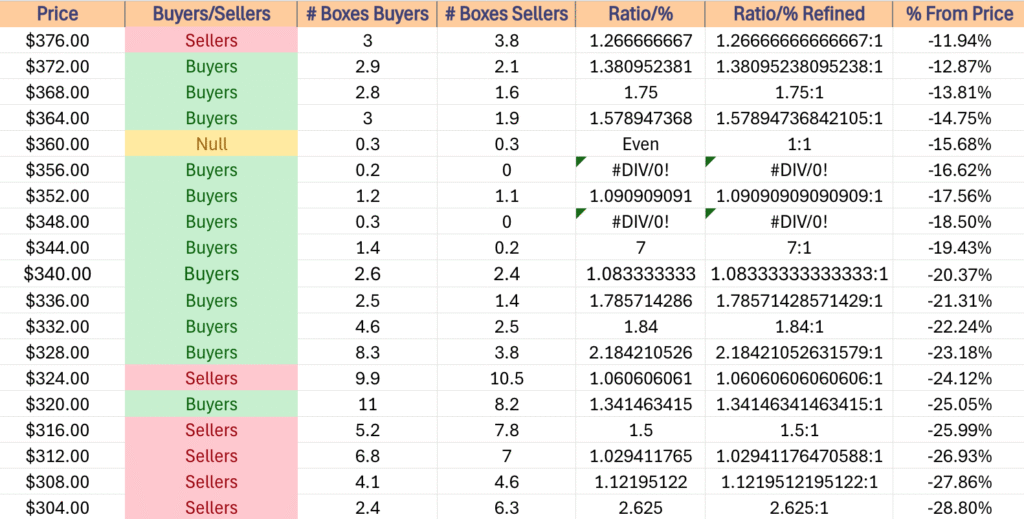
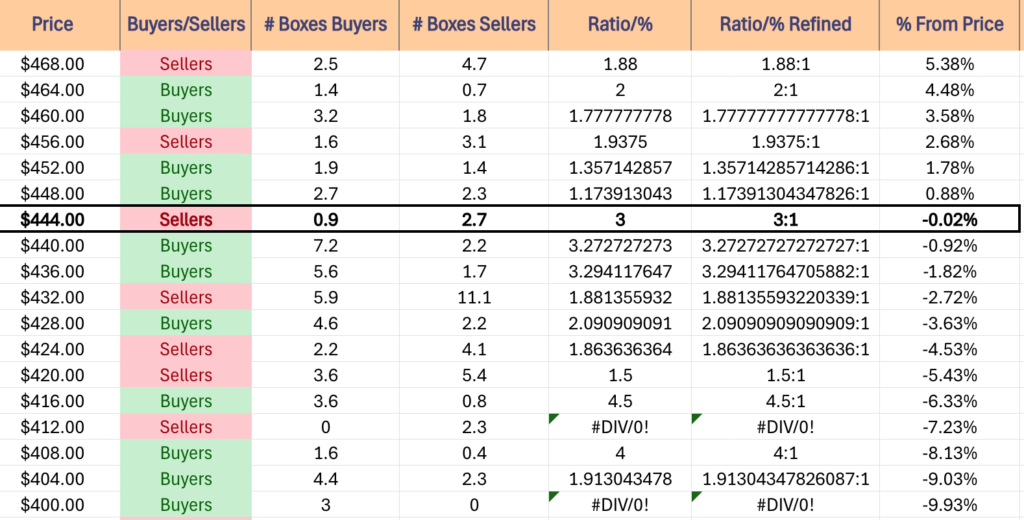
In the event of decline DIA has a bit of a headwind on the horizon, as once their first support levels is broken through the next 3+ are all in Seller dominated price zones, which will potentially lead to a re-test of the $410.48 or $406.35/share level, depending on where it manages to find footing.
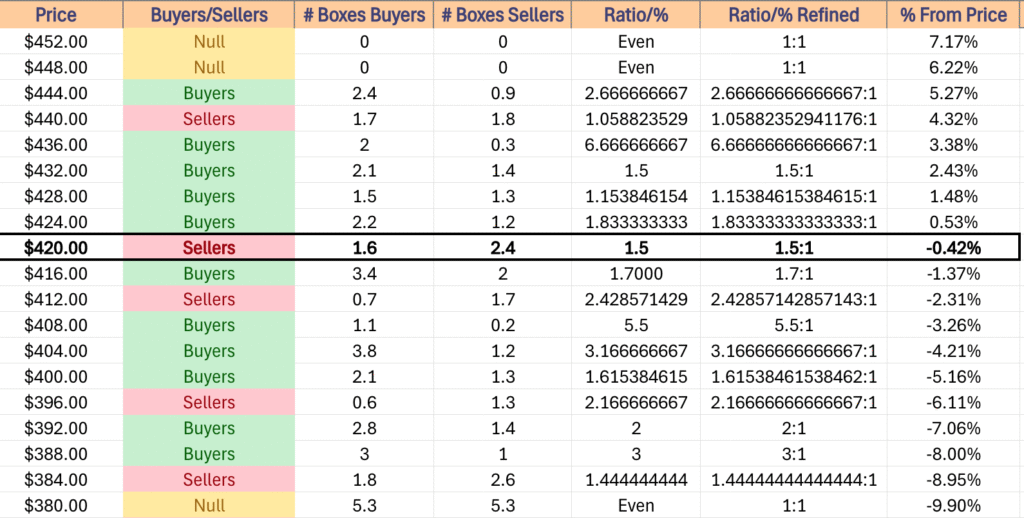
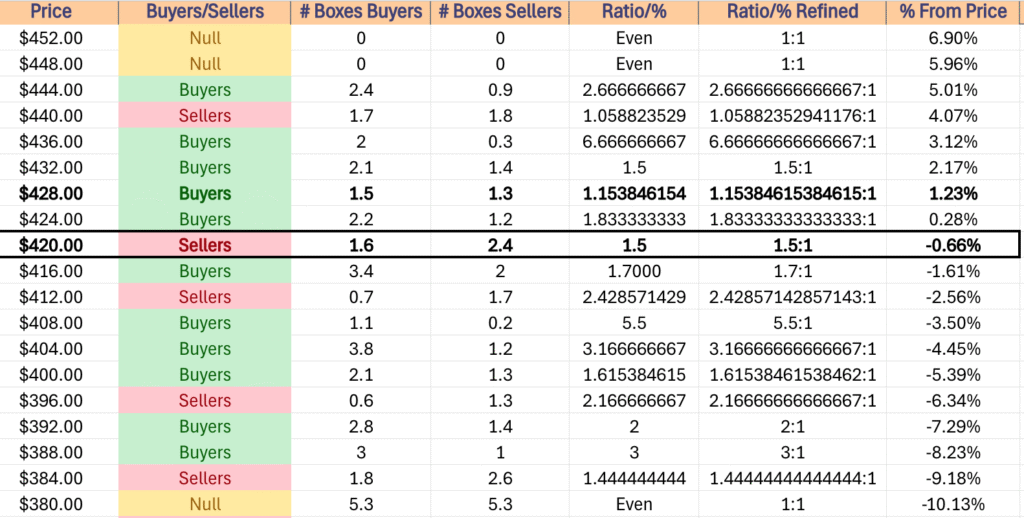
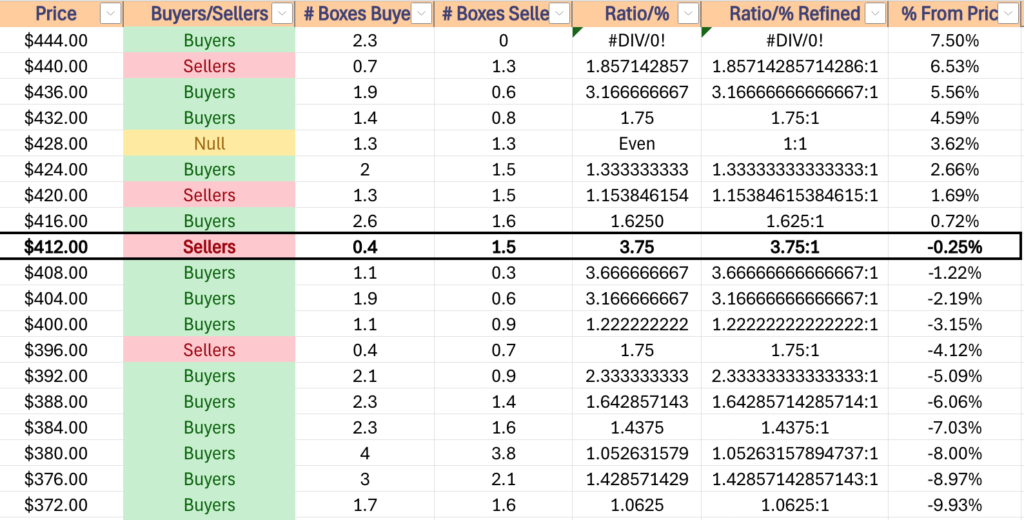
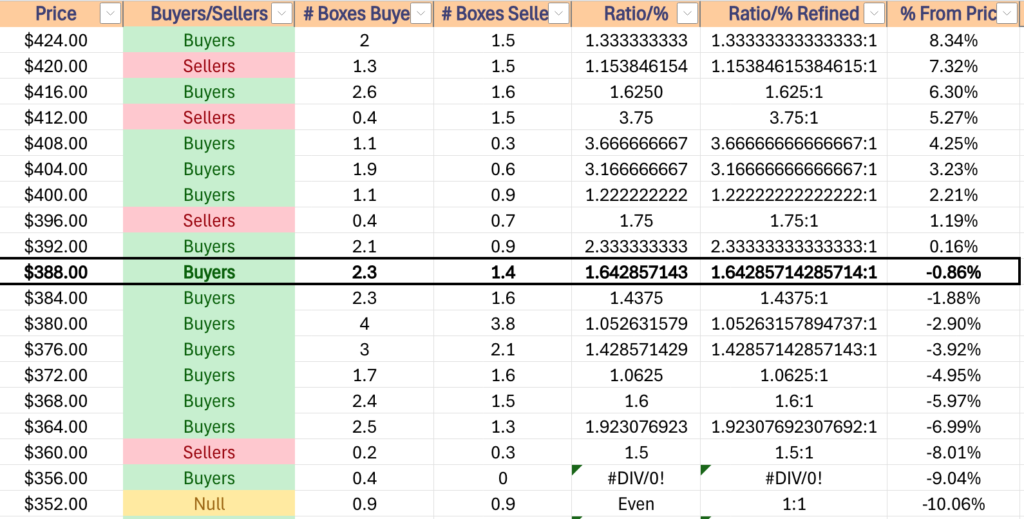
DIA has support at the $418.41 (Volume Sentiment: Buyers, 1.7:1), $415.23 (Volume Sentiment: Sellers, 2.43:1), $413.51 (50 Day Moving Average, Volume Sentiment: Sellers, 2.43:1) & $412.66/share (Volume Sentiment: Sellers, 2.43:1) price levels, with resistance at the $421.92 (Volume Sentiment: Sellers, 1.5:1), $422.16 (200 Day Moving Average, Volume Sentiment: Sellers, 1.5:1), $425.04 (Volume Sentiment: Buyers, 1.83:1) & $425.23/share (10 Day Moving Average, Volume Sentiment: Buyers, 1.83:1) price levels.
DIA ETF’s Price Level:Volume Sentiment Over The Past ~4 Years
The Week Ahead
Monday the week kicks off with S&P Flash U.S. Services PMI & S&P Flash U.S. Manufacturing PMI data at 9:45 am, followed by Existing Home Sales data at 10 am.
Commercial Metals & Fact set report earnings before Monday’s opening bell, followed by KB Home after the session’s close.
S&P Case-Shiller Home Price Index (20 Cities) data comes out Tuesday morning at 9 am, before Fed President Hammack speaks at 9:15 am, Consumer Confidence data is released at 10 am, and Fed Chair Powell testifies to the House Financial Service Committee at 10 am as well.
Tuesday morning begins with earnings calls from Carnival & TD Synnex, before FedEx, AeroVironment, BlackBerry & Worthington Enterprises report after the closing bell.
Wednesday morning begins with New Home Sales data at 10 am.
General Mills, Paychex & Winnebago report earnings before Wednesday’s opening bell, followed by Micron Technology, H.B. Fuller, Jefferies, MillerKnoll, Steel case & Worthington Steel after the session closes.
Advanced U.S. Trade Balance In Goods, Advanced Retail Inventories, Advanced Wholesale Inventories, Initial Jobless Claims, Durable-Goods Orders, Core Durable-Goods Orders & GDP (Second Revision) data all come out Thursday at 8:30 am, before Fed President Hammack speaks at 9 am & Pending Home Sales data at 10 am.
Acuity, Lindsay Corp., McCormick & Walgreens Boots Alliance report earnings before Thursday morning’s opening bell, before Nike & Concentrix report after the session’s closing bell.
Friday the week winds down with Personal Income, Personal Spending, PCE Index, PCE Year-over-Year, Core PCE Index & Core PCE Index (Year-over-Year) at 8:30 am before Consumer Sentiment (Final) data comes out at 10 am.
Apogee Enterprises reports earnings on Friday morning.
See you back here next week!
*** I DO NOT OWN SHARES OR OPTIONS CONTRACT POSITIONS IN SPY, QQQ, IWM OR DIA AT THE TIME OF PUBLISHING THIS ARTICLE ***
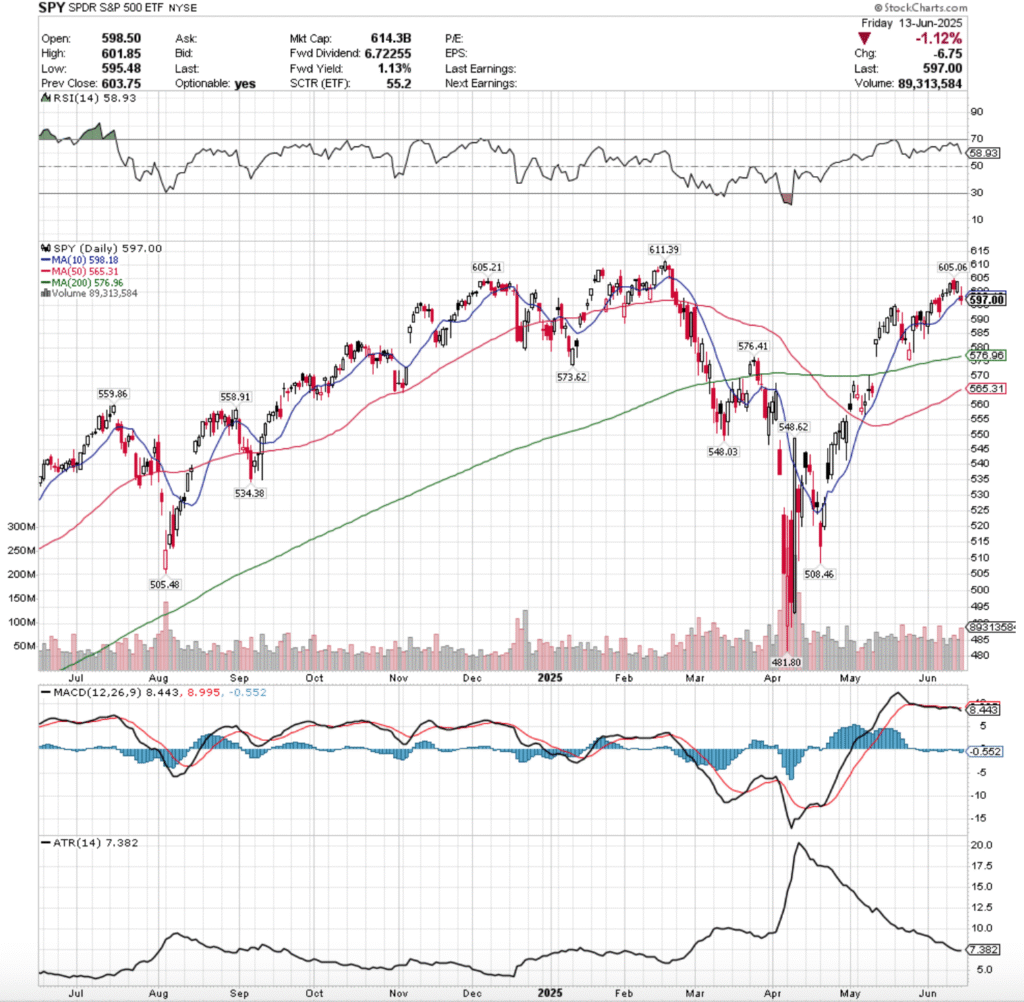
SPY, the SPDR S&P 500 ETF lost -0.36% this week, while the VIX closed at 20.82, indicating an implied one day move of +/-1.31 & a one month implied move of +/-6.02%.
SPY ETF – SPDR S&P 500 ETF’s Technical Performance Over The Past Year
Their RSI is trending down towards the neutral 50 mark & is currently at 58.93 & their MACD is bearish, but still relatively flat; however their histogram is signaling that bearishness is likely to continue & expand next week.
Volumes were +19.92% higher than the prior year’s average (69,314,000 vs. 57,801,235), with Friday’s bearish session seeing the highest level of the week, as market participants were eager to take risk off of the table before the weekend in the wake of Israel & Iran’s conflict escalating.
Last week kicked off on a note of uncertainty for SPY, as the session opened in line with Friday’s close & produced the lowest volume of the week to close as a doji candle, indicating that there was not much confidence & market participants were more in a “wait & see” type of mood.
Tuesday opened higher, retraced much of Monday’s candle to the downside, before pushing higher to close at $603.08/share on slightly better volume.
Wednesday confirmed the feelings of unease, as a gap up open managed to break above the $605/share mark temporarily, before plunging down & exposing the vulnerability in broader markets on the week’s second highest volume as market participants took chips off of the table following the gains of Tuesday.
Thursday opened lower & made a run at Wednesday’s opening price but failed to reach it as there was not enough positive sentiment in the market, and that inability to hit Wedneday’s open or high signaled that there is clearly an impediment at the $605/share level.
Friday was the epitome of a ris-off day, as a gap down open led to a brief stint above $600/share again, but profits were quickly taken from the table & SPY was forced down to $595.48 before closing at $597/share ont he highest volume of the week.
Looking to the coming week there are a few things to take into consideration.
Firstly, the $605/share level looks to be forming the shoulders of a potential bearish head & shoulders pattern on the one year chart with the $611.39/share level, which will be an area of focus in the coming week.
There is also another head & shoulders pattern brewing on a more short-term level bearishly that began with the gap up on May 12, 2025 which will be something to watch, as it may well become an island top when the gap created that day gets filled.
The bullish case for SPY is now incredibly simple, the $605-605.99/share zone needs to be broken through & it needs solid advancing volume if it is to be sustainable.
If that can’t happen, we don’t see a run at the all-time high of $611.35/share, much less it broken through.
There is likelihood of a squeeze higher situation early in the week where a mix of short-covering & “last hurrah” profit seekers pump prices up before Wednesday’s FOMC decision, but if $605 holds up as a resistance point/doesn’t get retested it’s a signal of bearishness.
The consolidation case remains the same as it has for the past month in our notes, oscillations around the 10 day moving average, but keep an eye on the 50 DMA approaching the 200 DMA bullishly, as a golden cross may boost confidence briefly & lead to some advances.
The consolidation case looks to be the best case scenario at the moment, as there is limited data & earnings coming out this week, minus the FOMC decision & earnings/reports on the state of homebuilders & the housing market, as well as some US absed manufacturing data on a shortened holiday week (Thursday the market is closed).
To the downside there begins to be some pockets of concern given how SPY has recently performed.
One of the most important things to watch heading into this week is that when things do cool off, how far support levels are away from SPY’s closing price.
There is a very easy to visualize ~3% decline on the horizon when you look at SPY’s support levels heading into the new week, where the 200 day moving average comes into play.
All eyes should be on there if we see any declines this week, as the long-term trend line is likely to be retested.
The long-term trend line is ~-3.36% lower than Friday’s close & will likely be retested in the event of any declines given how few support levels SPY has at this point.
That’s where to fixate attention to at the moment, particularly when you reference the table below for their historic price level sentiment.
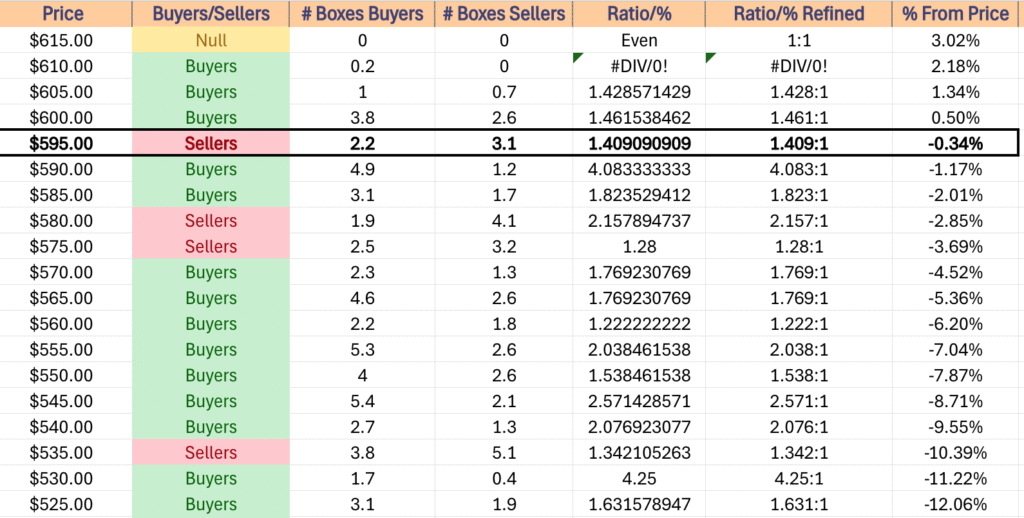
SPY has support at the $576.96 (200 Day Moving Average, Volume Sentiment: Sellers, 1.28:1), $576.41 (Volume Sentiment: Sellers, 1.28:1), $573.62 (Volume Sentiment: Buyers, 1.77:1) & $565.31/share (Volume Sentiment: Buyers, 1.77:1) price levels, with resistance at the $598.18 (10 Day Moving Average, Volume Sentiment: Sellers, 1.41:1), $605.06 (Volume Sentiment: Buyers, 1.43:1), $605.21 (Volume Sentiment: Buyers, 1.43:1) & $611.39/share (All-Time High, Volume Sentiment: Buyers, 0.2:0*) price levels.
SPY ETF’s Price Level:Volume Sentiment Over The Past ~3 Years
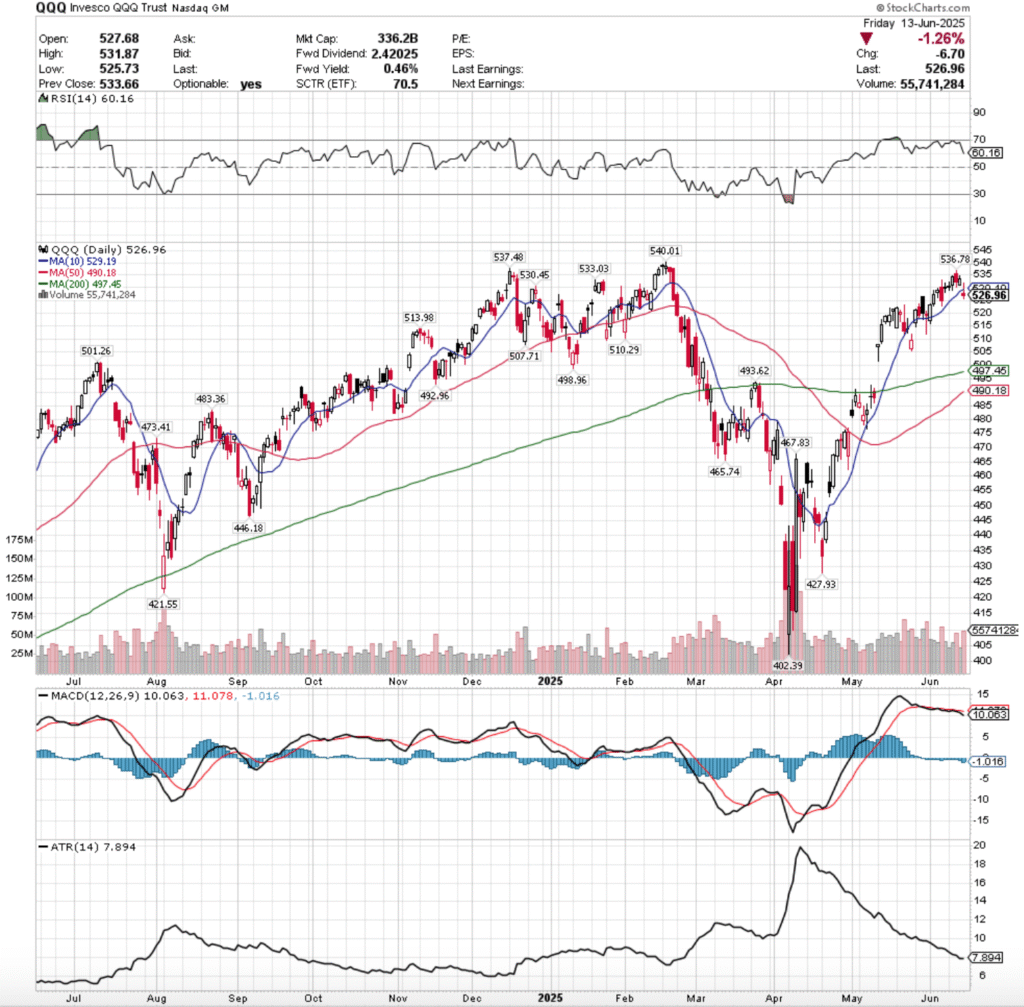
QQQ, the Invesco QQQ Trust ETF dropped -0.56% last week, as the tech heavy index was saved in part by Oracle’s earnings call.
QQQ ETF – Invesco QQQ Trust ETF’s Technical Performance Over The Past Year
Their RSI is trending down back towards the neutral 50-mark & is currently at 60.16, while their MACD is still bearish, with their histogram implying that there is more declines & sour sentiment on the horizon.
Volumes were +13.36% higher than the previous year’s average (43,592,000 vs. 38,452,988), led primarily by Wednesday & Friday’s declining sessions, which were the two highest volume days of the week.
Monday started off similar to SPY, another low volume doji session as market participants digested the week prior’s data & looked ahead to plan the approach to the following week that is short & features an FOMC decision.
Tuesday opened on a gap higher, tested back below the $520/share mark, but was able to grind higher on slightly better volume than the previous day.
Wednesday opened on a gap up to above $535, but was unable to gain stable footing & wound up declining throughout the session, reverting back towards the 10 day moving average & indicating that the sh0rt term trend had not been broken out from.
Thursday opened on a gap down, but the weak volume session managed to squeeze QQQ higher briefly, but the lack of participation was noted.
It was felt on Friday when QQQ opened on a gap down, tried to retrace higher & break back to where it had spent the week, but was unable to as profits were taken & prices were forced lower, causing a -1.26% decline & forcing the close & open to both take place below the resistance of the 10 day moving average.
Looking ahead to this week, that negative sentiment is in the air & any bullishness is making a run at all-time highs, so unless we see a real shift in rising advancing volume or a surprise bit of FOMC news there’s not much to watch beyond the $540.01/share mark.
There is a growing concern about the potential bearish head & shoulders pattern from November where the ATH is the head & $537.48 & $536.78/share are the left & right shoulder respectively, which will be something to watch.
The consolidation case here is the same as usual, oscillations around the 10 day moving average, waiting for an upside or downside catalyst to strike, while also awaiting a potential small short-term pump from the 50 & 200 DMA’s golden cross that is impending.
The downside case has the $507.71/share price level in target, as the three higher support levels are all Seller dominated & this resides in the window created in early May that needs to be filled.
Should this get retested, the 200 day moving average’s support will come into question & likely see a re-test, as the long-term trendline is beginning to look less stable.
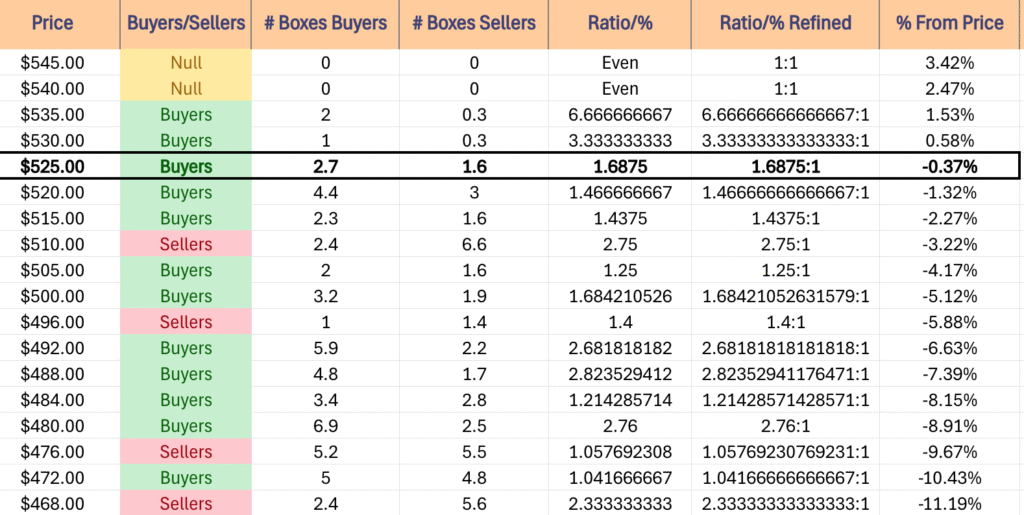
QQQ has support at the $513.98 (Volume Sentiment: Sellers, 2.75:1), $510.29 (Volume Sentiment: Sellers, 2.75:1), $510.29 (Volume Sentiment: Sellers, 2.75:1) & $507.71/share (Volume Sentiment: Buyers, 1.25:1) price levels, with resistance at the $529.19 (10 Day Moving Average, Volume Sentiment: Buyers, 1.69:1), $530.45 (Volume Sentiment: Buyers, 3.33:1), $533.03 (Volume Sentiment: Buyers, 3.33:1) & $536.78/share (Volume Sentiment: Buyers, 6.67:1) price levels.
QQQ ETF’s Price Level:Volume Sentiment Over The Past ~1 Year
IWM, the iShares Russell 2000 ETF declined -1.42% last week, as the small cap index fell back out of favor among market participants.
IWM ETF – iShares Russell 2000 ETF’s Technical Performance Over The Past Year
Their RSI is trending back towards the neutral 50-level, currently at 53.87, while their MACD is set to cross over bearishly on Monday’s open.
Volumes were +19.04% higher than the previous year’s average (36,244,000 vs. 30,446,096), which is cause for concern given that the declining volume on Friday eclipsed the rest of the week, hitting levels not seen since early April 2025.
Monday opened the week up on a gap up on the week’s second highest volume, but there was a major warning sign flashed as the volume indicates short-term profit taking & the day closed as a hanging man candle that closed lower than it opened.
Tuesday again gapped higher on the open, this time on less volume indicating skepticism in the strength behind the recent advances, and the gravestone doji candle signaled that there was about to be a risk-off move.
Wednesday confirmed this, as the open was on a gap up to above the resistance of the 200 day moving average, but quickly chips were taken off of the table & the long-term trendline prevailed.
Thursday opened on a gap lower & experienced a short-term pump intraday that forced the close to be higher than the open, but the low volume & nature of the previous few sessions did not make for a convincing bullish case.
Friday this continued, where a gap down open to below the support of the 10 day moving average occurred, IWM made a run to break above the short-term moving average & failed as intraday profits were collected, and the result was a -1.83% day on high declining volume, indicating that there’s more pain to come.
Heading into a new week, the bullish case requires a successful retest of the $210.13/share resistance level, which would then with enough advancing volume behind it lead to a retest of the $214.49/share level, which has two resistance levels, which happens to reside in a Seller dominated zone.
Should that test succeed, we see a long-term trendline retest on the horizon, but that’s getting ahead of ourselves, particiularly if we get there via gap ups
The consolidation case is an oscillation around the 10 DMA, while we await a catalyst to move SPY, QQQ or DIA & carry IWM with it.
To the downside, the primary focal point now is the 50 day moving avearge’s support, which is moving upwards which may help IWM prevent declines, but is certainly the gatekeeper to the downside.
If the 50 DMA breaks down, the 2025 year low price is the last test that matters.
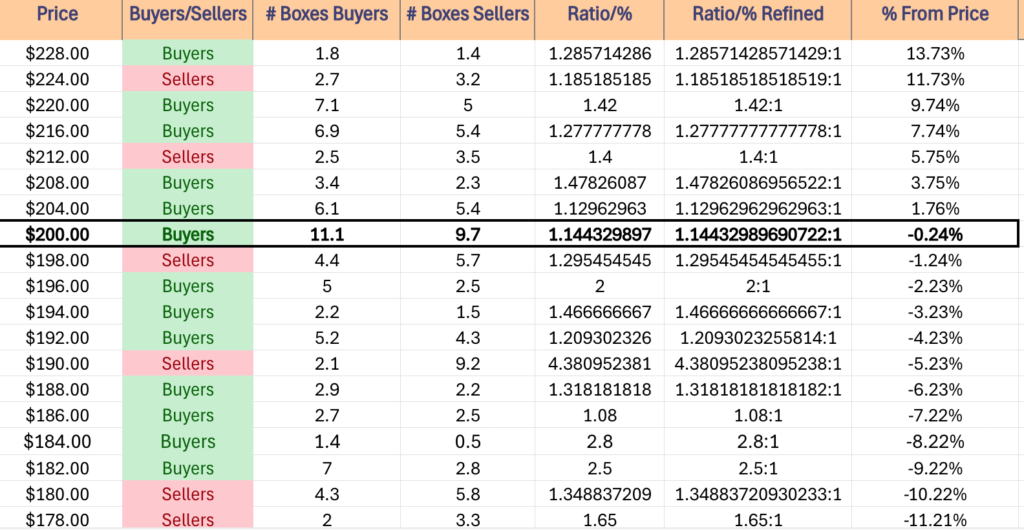
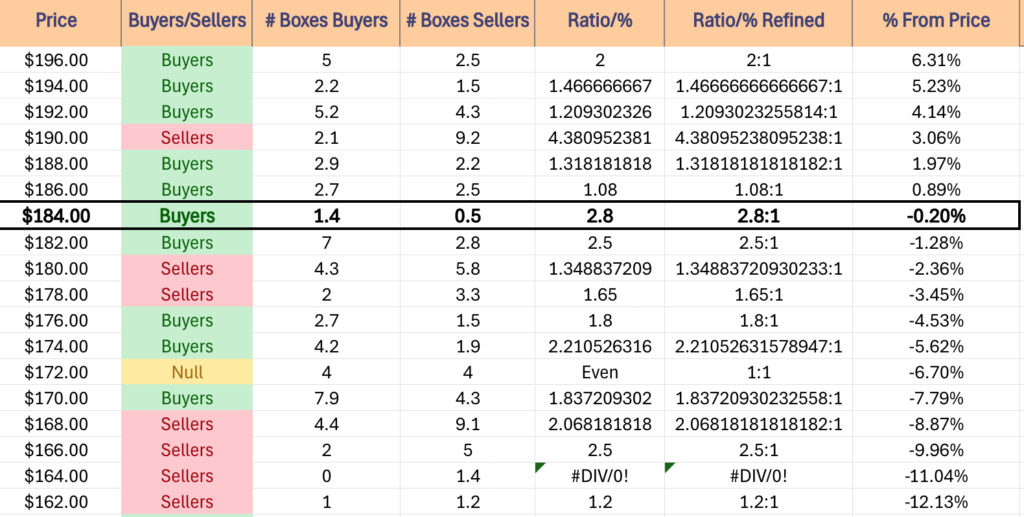
IWM has support at the $202.46 (Volume Sentiment: Buyers, 1.23:1), $199.65 (Volume Sentiment: Sellers, 1.25:1), $199.03 (50 Day Moving Average, Volume Sentiment: Sellers, 1.25:1) & $196.56/share (Volume Sentiment: Buyers, 2.17:1) price levels, with resistance at the $209.27 (Volume Sentiment: Buyers, 1.53:1), $210.13 (Volume Sentiment: Buyers, 1.53:1), $210.68 (10 Day Moving Average, Volume Sentiment: Buyers, 1.53:1) & $214.49/share (2 Touch-Points, Volume Sentiment: Sellers, 1.33:1) price levels.
IWM ETF’s Price Level:Volume Sentiment Over The Past ~2-3 Years
DIA ETF – SPDR Dow Jones Industrial Average ETF’s Technical Performance Over The Past Year
Their RSI is trending downwards & near neutral at 50.97, while their MACD crossed over the signal line bearishly on Friday.
Volumes were -4.79% lower than the previous year’s average (3,028,000 vs. 3,180,398), which like IWM is cause for concern based on Friday’s declining session’s volume eclipsing most of 2025’s volumes, only outdone by early April’s.
The week was marked by “wait & see”/”hold on” as Monday opened the week up with a high wave doji and mediocre volume indicating a sense of complacency & uncertainty among market participants.
Tuesday advanced on weak volume, before another high wave doji on Wednesday for a decline on the second highest volume of the week that marked the high water mark.
Thursday opened on a gap down that tested the support of the 10 day moving average, but was able to advance in the end to close above $430/share.
Friday showed the cracks in DIA where the gap down open below the 10 day moving avearge’s resistance only carried lower, testing the support of the 200 day moving average & breaking down through the long-term trendline to close below it on the day.
Currently the 200 DMA is DIA’s likely main place to stay this week, osciallating around waiting for a catalyst to the upside or downside.
They’re currently not set up for upside or downside breakouts as most of the blue chip index owners have been sitting on their hands waiting for an upside/downside catalyst, which will continue into this week.
To the downside if there’sa breakdown keep an eye on the 50 day moving average’s support.
DIA has support at the $419.60 (Volume Sentiment: Buyers, 1.7:1), $416.41 (Volume Sentiment: Buyers, 1.7:1), $413.83 (Volume Sentiment: Sellers, 2.43:1) & $412.91/share (Volume Sentiment: Sellers, 2.43:1) price levels, with resistance at the $423.05 (200 Day Moving Average, Volume Sentiment: Sellers, 1.5:1), $423.12 (Volume Sentiment: Sellers, 1.5:1), $426.25 (Volume Sentiment: Buyers, 1.83:1) & $426.79/share (10 Day Moving Average, Volume Sentiment: Buyers, 1.83:1) price levels.
DIA ETF’s Price Level:VOlume Sentiment Over The Past ~4 Years
The Week Ahead
Monday the week kicks off with Empire State Manufacturing Survey data at 8:30 am.
Lennar is the only major earnings report on Monday, which will take place after the session’s close.
U.S. Retail Sales, Retail Sales minus Autos, Import Price Index & Import Price Index minus Fuel data are scheduled for release at 8:30 am on Tuesday, before Industrial Production & Capacity Utilization data at 9:15 am, and Business Inventories & Home Builder Confidence Index data at 10 am.
Tuesday begins with Jabil & Wiley reporting earnings before the session’s open, before La-Z-Boy’s report comes after the closing bell.
Wednesday will be an important day to watch, with Housing Starts, Building Permits & Initial Jobless Claims data due out at 8:30 am, followed by the FOMC Interest Rate Decision at 2pm & Fed Chair Powell’s Press Conference at 2:30 pm.
GMS & Korn/Ferry report earnings before Wednesday’s opening bell, with Smith & Wesson Brands reporting after the session’s close.
There is no economic data nor earnings reports scheduled for release on Thursday.
Friday the week winds down with Philadelphia Fed Manufacturing Survey Data at 8:30 am.
Darden Restaurants, Accenture, CarMax & Kroger all report earnings before Friday morning’s opening bell.
See you back here next week!
*** I DO NOT OWN SHARES OR OPTIONS CONTRACT POSITIONS IN SPY, QQQ, IWM OR DIA AT THE TIME OF PUBLISHING THIS ARTICLE ***
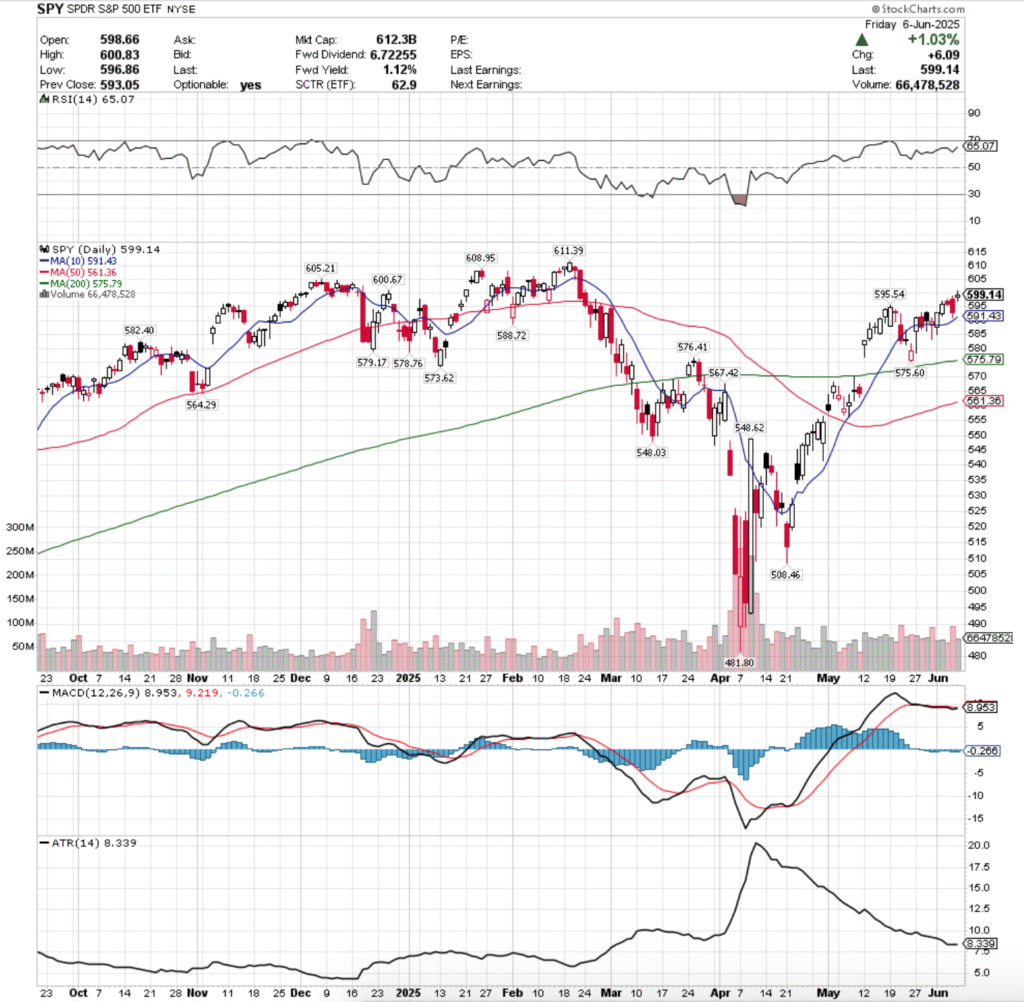
SPY, the SPDR S&P 500 ETF gained +1.65% last week, while the VIX closed the week at 16.77, indicating an implied move of +/-1.06% & an implied one month move of +/-4.85%.
SPY ETF – SPDR S&P 500 ETF’s Technical Performance Over The Past Year
Their RSI is trending higher towards overbought levels, sitting currently at 65.07, while their MACD is bearish, but is relatively flat in the wake of last week’s performance.
Volumes were +19.32% higher than the prior year’s average levels (68,316,000 vs. 57,254,701), which adds an interesting twist to the week, given that the highest volume session was a declining day.
Last week opened up on Monday in-line with the 10 day moving average, temporarily broke down through its support, before rallying into the close to close near the day’s high for a gain of +0.56%.
Tuesday that trend continued, as the session opened near Monday’s close & there was a risk-on appetite & SPY managed to close out +0.57%.
Wednesday is where trouble began to brew for SPY & market participants began to show a bit of anxiety & uncertainty, as the week’s lowest volume session resulted in a spinning top candle & closed -0.03% lower on the day after a gap up open.
The indecision marked by the spinning top is important, as SPY was <1% from that key resistance level of $600.67/share that we pointed out last week as an area of interest.
Thursday continued this, as SPY opened higher, before declining -0.48% on the strongest volume of the week & forming a bearish engulfing pattern with Wednesday’s candle.
While the support of the 10 day moving average managed to hold up, the day’s lower shadow indicates that there was a bit of unease among market participants & cracks were beginning to form.
Friday opened on a gap higher, but closed as a spinning top, indicating that there was quite a bit of indecision & uncertainty heading into the weekend, even though the session advanced +1.03%.
Friday’s high was able to temporarily break just above the previously noted $600.68/share resistance level, but was unable to gain any type of footing there & declined to close below it.
Heading into the new week, that will be a key area for any upside potential, as it is the gatekeeper for SPY’s all-time highs.
This level will likely be at least retested in the coming week, and as mentioned in prior months there will need to be a significant increase in consistent advancing volume to break above this resistance level.
Data for historic volume sentiment at these levels are skewed towards Buyers because of the nature of all-time highs, so it will require a more hands on approach to viewing trends in volume in the next week for any upside price movements.
There is a great deal of focus on today’s trade meeting between the US & China in London, as well as inflation data that comes in the form of CPI & PPI later this week.
There are also going to be clues about the state of the consumer when J.M. Smucker & Chewy report earnings, and Oracle’s report may also have potential to move the market in the short-term.
However, given that the Fed speakers have mostly all hinted at rates staying higher for longer/being in no rush to cut rates based on current data, it is difficult to see much of an upside catalyst in the near-term.
The consolidation case for SPY continues to be oscillations around the 10 day moving average until there is an upside or downside catalyst to force a breakout.
In the event that this is the way things play out, there is reason to watch the 50 day moving average’s approach to the 200 DMA, as a golden cross here may provide a temporary bump to SPY’s price as the medium-term trendline crosses over the long-term trend line bullishly.
In the event that his happens, pay attention to day-over-day volume trends to gain insight into how market participants are positioning themselves & what the future sentiment is likely to be.
To the downside there is an interesting set up, as over the past ~3 years the price zone that SPY is in has historically been dominated by the Sellers.
In the event that this trend continued they find support at the 10 day moving average, which is in a Buyer zone, as is their next support level as well.
Should these get tested though, the significance of the short-term trendline breaking down may force more selling in SPY (particularly if that 50 DMA golden cross doesn’t occur in the meantime) which then puts SPY’s next (4th) support level in a Seller zone.
In the event of decline, look at the 200 DMA’s support level, which sits -3.9% from the closing price of Friday’s session.
If the long-term trend is tested again & doesn’t hold up, we are likely going to see continued declines in the near-to-mid term.
The table below provides more volume sentiment data that may be useful in assessing the strength/weakness of support/resistance levels in re-tests.
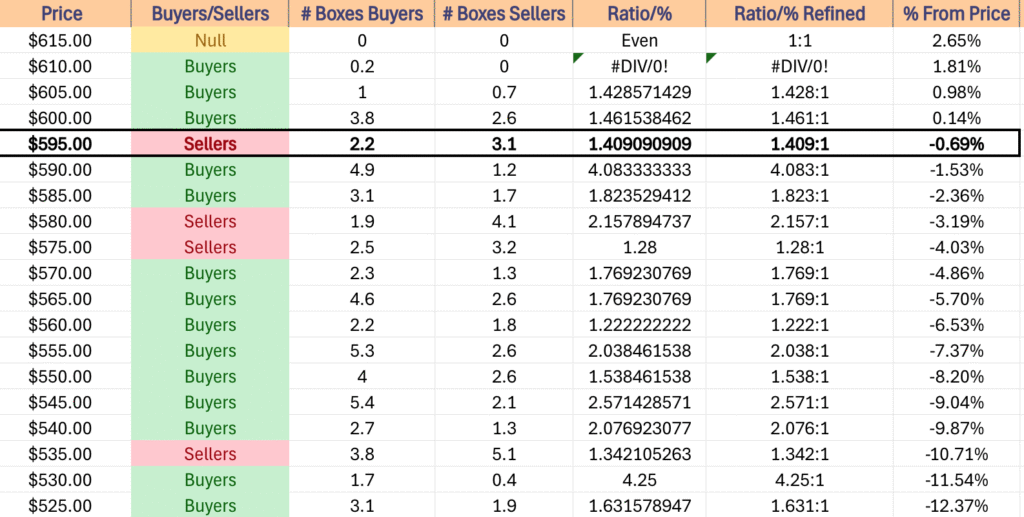
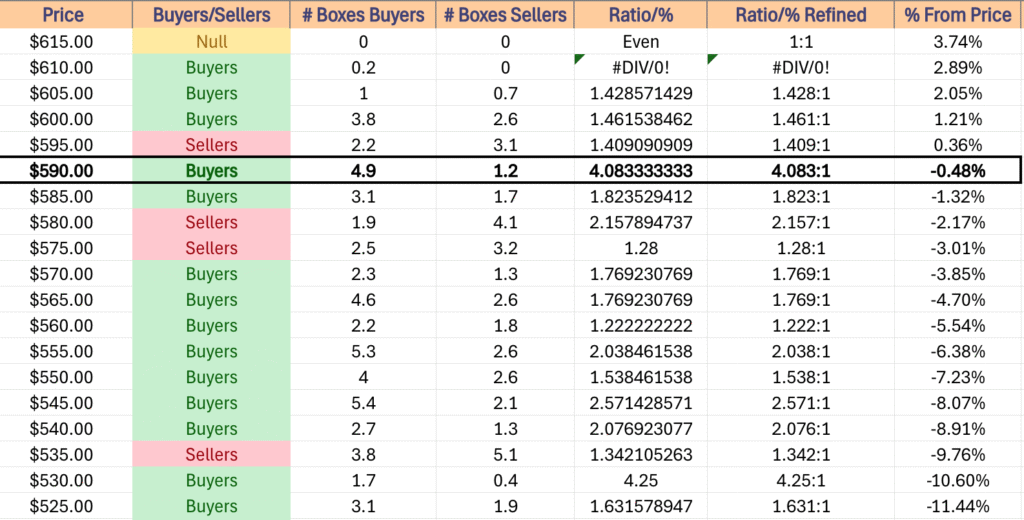
SPY has support at the $595.54 (Volume Sentiment: Sellers, 1.41:1), $591.43 (10 Day Moving Average, Volume Sentiment: Buyers, 4.08:1), $588.72 (Volume Sentiment: Buyers, 1.82:1) & $582.40/share (Volume Sentiment: Sellers, 2.16:1) price levels, with resistance at the $600.67 (Volume Sentiment: Buyers, 1.46:1), $605.21 (Volume Sentiment: Buyers, 1.43:1), $608.95 (Volume Sentiment: Buyers, 1.43:1) & $611.39/share (All-Time High, Volume Sentiment: Buyers, 1.43:1) price levels.
SPY ETF’s Price Level:Volume Sentiment Over The Past ~3 Years
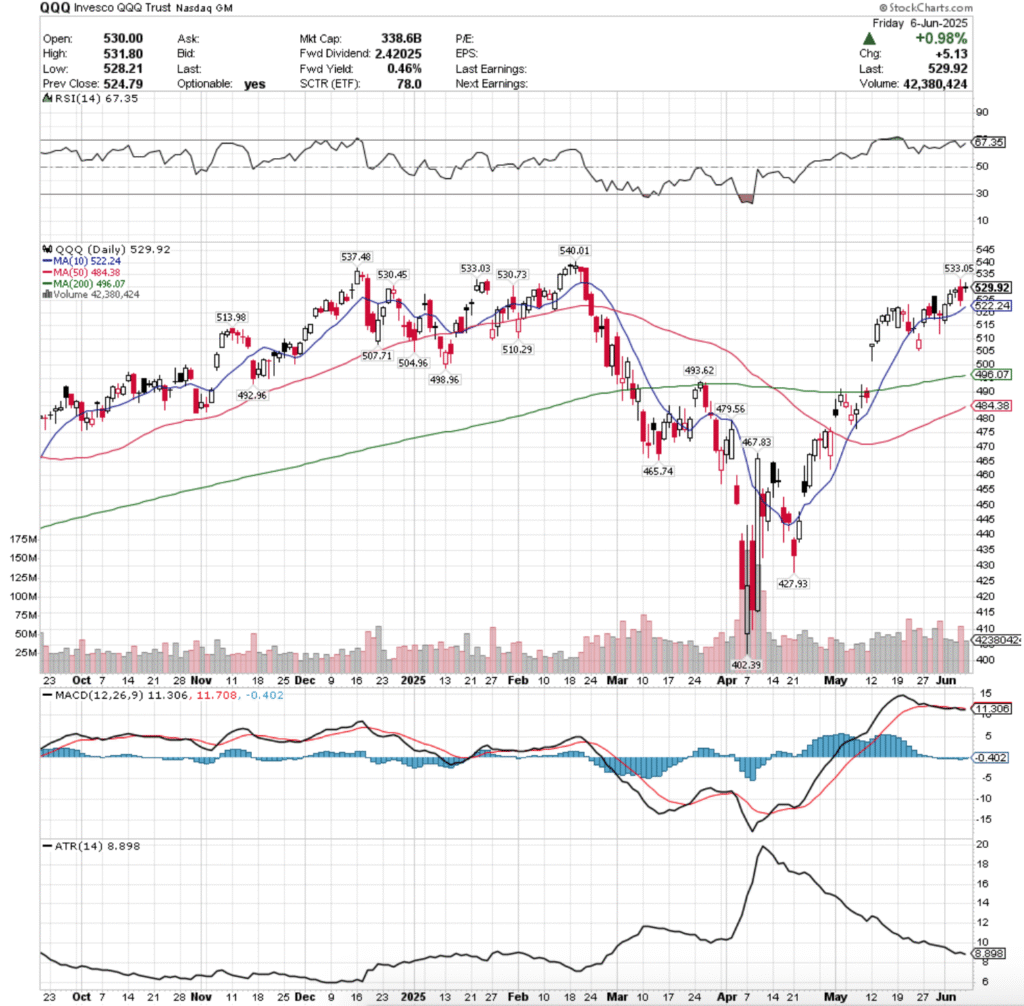
QQQ, the Invesco QQQ Trust ETF added +2.08% last week, as the tech-heavy index was able to muster some gains while closing in on its all-time high.
QQQ ETF – Invesco QQQ Trust ETF’s Technical Performance Over The Past Year
Their RSI is advancing towards the overbought level of 70, sitting currently at 67.35, while their MACD is bearish, but moving relatively flat after last week’s performance.
Volumes were +22.86% higher than the prior year’s average levels (46,790,000 vs. 38,083,028), which like SPY’s above has a little air of caution around it.
Monday QQQ opened just below the resistance of the 10 day moving average, but was able to break above it & close for an advancing session on the week’s second highest volume (highest for advancing sessions).
Tuesday opened on a gap higher & the march higher continued throughout the session, with the small lower shadow & longer upper shadow indicating that there had been a bit of profit taking during the session.
Wednesday though signaled a tale of caution on the horizon, as market participants began to be a little uneasy about how close QQQ had approached its all-time high & the session opened on a gap up, but closed as a hanging man candle (bearish).
Thursday confirmed this sentiment, when a gap higher open tested higher to reach $533.05/share, before profit taking commenced & QQQ formed a bearish engulfing pattern on a declining session with the week’s highest volume & QQQ closed down -0.75%.
The high volume can certainly be attributed to short-term & intraday profit taking, but it also is beginning to look like market participants are beginning to show signs of nervousness, as Friday’s candle showed.
Friday wound the week down in an interesting manner, as despite the session closing up +0.98%, there were many signs of weakness heading into the weekend.
Firstly, the session closed as a doji that’s real body was contained in the upper portion of Wednesday’s candle.
While the session advanced day-over-day, it closed lower than it opened, owing the adance to the jump in opening price from Thursday’s close.
This formed a bearish harami cross, indicating that there is still quite a bit of negative sentiment out there for QQQ & that there was a limited amount of risk being willing to be taken into the weekend.
This week, to the upside QQQ is still below the $530-530.99 & $533-533.99/share resistance zones as of Friday’s close, which will be the primary target to watch.
The good news, is that there is Buyer sentiment historically in these zones, but the bad news is that it is attributed to the fact that they’re so close to QQQ’s all-time high, so the ratio will ultimately be diluted over time & re-tests.
Like SPY, there will need to be sustainable, higher advancing volumes in the coming week to power through those zones higher & should they be broken above but volumes are weak the rally should be viewed with skeptical brow.
It will also be wise to watch the 50 DMA as it approaches the 200 DMA, as in the event of a golden cross there may be a bump to the upside as the mdeium-term trendline crosses bullishly through the long-term trend line.
The consolidation case is still oscillations around the 10 day moving average, with a keen eye open in the event that we see an island top from the gap in early May.
In the event that there is downside movement, look to see that window be filled, with a re-test of the 200 day moving average likely, especially given the Seller pressure below Friday’s closing price.
Should we get one, the 200 DMA is in a Seller dominated zone historically, which adds a bit of trouble for the long-term trend.
The table below can help assess the strength/weakness of QQQ’s support/resistance levels in the event of re-tests.
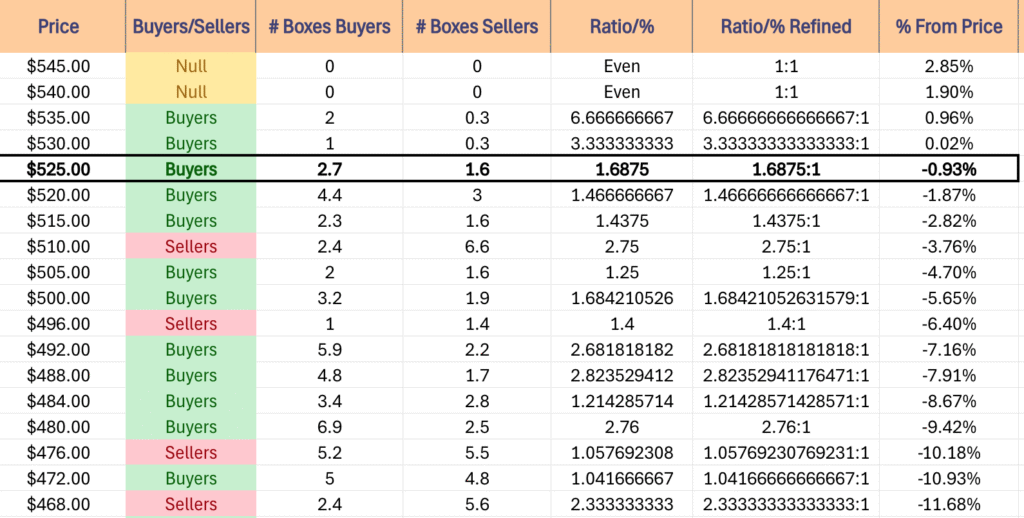
QQQ has support at the $522.24 (10 Day Moving Average, Volume Sentiment: Buyers, 1.47:1), $513.98 (Volume Sentiment: Sellers, 2.75:1), $510.29 (Volume Sentiment: Sellers, 2.75:1) & $507.71/share (Volume Sentiment: Buyers, 1.25:1) price levels, with resistance at the $530.45 (Volume Sentiment: Buyers, 3.33:1), $530.73 (Volume Sentiment: Buyers, 3.33:1), $533.03 (Volume Sentiment: Buyers, 3.33:1) & $533.05/share (Volume Sentiment: Buyers, 3.33:1) price levels.
QQQ ETF’s Price Level:Volume Sentiment Over The Past ~1 Year
IWM, the iShares Russell 2000 ETF advanced +3.33% last week, faring the strongest of the major four index ETFs after a few slumping weeks at the back of the pack.
IWM ETF – iShares Russell 2000 ETF’s Technical Performance Over The Past Year
Their RSI is trending higher towards overbought levels, sitting currently at 64.24, while their MACD crossed over bullishly on Friday on account of the day’s gap up session.
Volumes were +7.83% higher than the prior year’s average (32,636,000 vs. 30,265,697), which while IWM advanced the most last week, is not necessarily a great picture given the gappy nature of the week.
Monday the small cap index opened below the 10 DMA, tested down to ~$202.50, before ending the day as a hammer candle & signaling that there was a bit of juice in the tank for IWM after weeks of underperforming the 3 other majors.
Tuesday opened on a gap up, tested briefly down to the support of the 10 day moving average, before powering higher on the highest volume of the week.
Wednesday saw some profits taking after the gains of the previous two days, as the day’s high was $210.01 & from there saw losses, closing down day-over-day -0.28%.
Wednesday’s volume was the lowest of the week, but given the underperformance that IWM has had relative to the other major indexes that’s not necessarily a bad sign.
Thursday saw another high volume session similar to Monday’s, but the day closed +0.04% as a doji, indicating that there was a bit of uncertainty looming over IWM.
This was confirmed Friday when IWM opened on a gap up, stayed within a relatively tight range for the day & closed out as a hanging man.
This indicated that there was not much interest in carrying risk into the weekend, and also formed a window that will need to be closed in the coming week(s).
The upside case for IWM moving forward relies around whether or not they can break above the 200 day moving average, changing their long-term trend.
This brings with itself some challenges, as the 200 DMA & the resistance level between it & the price both reside in Seller dominated price zones, which will require a bit of advancing volume to get through.
The consolidation case looks currently like oscillations around the 10 DMA, dipping into the window caused by Friday & breaching closer to the 200 DMA until we see a downside or upside catalyst.
The downside case occurs if there is some declining momentum as IWM fills Friday’s gap, which in turn would turn attention to he $199.65/share support level & the 50 day moving average.
IWM has support at the $210.13 (Volume Sentiment: Buyers, 1.52:1), $209.27 (Volume Sentiment: Buyers, 1.52:1), $207.06 (10 Day Moving Average, Volume Sentiment: Buyers, 1.16:1) & $199.65/share (Volume Sentiment: Sellers, 1.25:1) price levels, with resistance at the $213.49* (2 Touch-Points, Volume Sentiment: Sellers, 1.33:1), $215.16 (200 Day Moving Average, Volume Sentiment: Sellers, 1.33:1), $216.24 (Volume Sentiment: Buyers, 1.26:1) & $217.36/share (Volume Sentiment: Buyers, 1.26:1) price levels.
IWM ETF’s Price Level:Volume Sentiment Over The Past ~2-3 Years
DIA ETF – SPDR Dow Jones Industrial Average ETF’s Technical Performance Over The Past Year
Their RSI is climbing higher & currently at 61.46, while their MACD is bearish but flat after the consolidation period of most of May that DIA’s been in.
Volumes were -16.28% lower than the prior year’s average (2,652,000 vs. 3,167,729), indicating that the “Buy & Hold” sentiment mentioned in the previous few weeks’ notes is still alive & well as the blue chip index investors are in a state of uncertainty.
DIA began the week just below its 10 day moving average’s resistance, tested below $420/share, before advancing to break out above all of its moving averages.
Tuesday followed suit & tested lower briefly, but support of the 10 & 200 DMA’s held up, enabling DIA to advance & close above $425/share.
Wednesday exposed that there was still some doubts about DIA’s strength, as the session opened higher, but profit taking quickly forced prices lower for a declining session.
Thursday was much the same, but market participants didn’t let DIA cross bearishly across the 10 & 200 day moving averages, but the day resulted in a decline, as the profit taking fueled the second highest volume session of the week.
Friday looked an awful lot like IWM’s chart (not surprising, as we’ve been noting now here weekly it seems), where DIA opened on a gap up, temporarily broke above the $430/share level, but ended the session as a spinning top candle on the week’s highest volume.
While that participation rate heading into a weekend might be seen by some as a sign of optimism & bullishness, looking at the declining volume of the two prior days doesn’t inspire a lot of confidence.
To the upside, the $428.65/share level will be an area of interest, along with the $429.52 & $431.49/share price levels.
These are historically Buyer dominated levels, but DIA has been more skewed towards Buyers in general as the Blue Chip index has maintained demand over the years as a safer haven than other indexes.
In the event that these levels are broken through, the $440-443.99/share zone is Seller dominated historically, which will pose an interesting problem for DIA, as it is the gatekeeper to their all-time high.
The consolidation case here looks interesting, as it involved oscillations around the 10 & 200 DMA’s simultaneously, awaiting the catalyst to the upside or the downside.
The overall market sentiment will be especially apparent based on what happens should that situation occur, as the proximity between the long & short term trend lines is quite narrow.
Any move towards the downside will be interesting to watch, as there’s solid Buyer sentiment at their next two support levels, before the following two enter Seller territory, and then the 50 day moving average comes into view.
If the 50 DMA is tested & breaks down, the $405.96/share level is the next place to begin looking for DIA, but this of course assumes a decline.
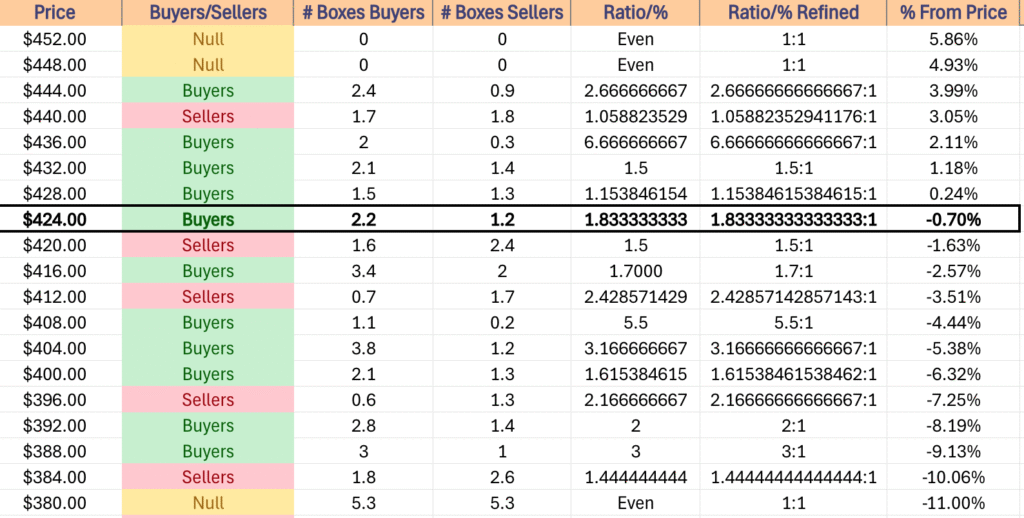
DIA has support at the $427.60 (Volume Sentiment: Buyers, 1.83:1), $426.25 (Volume Sentiment: Buyers, 1.83:1), $423.39 (10 Day Moving Average, Volume Sentiment: Sellers, 1.5:1) & $423.12/share (Volume Sentiment: Sellers, 1.5:1) price levels, with resistance at the $428.69 (Volume Sentiment: Buyers, 1.15:1), $429.52 (Volume Sentiment: Buyers, 1.15:1), $431.49 (Volume Sentiment: Buyers, 1.15:1) & $441.09/share (Volume Sentiment: Sellers, 1.06:1) price levels.
DIA ETF’s Price Level:Volume Sentiment Over The Past ~4-5 Years
The Week Ahead
Monday kicks the new week off with Wholesale Inventories data at 10 am.
Calavo Growers & Casey’s General report earnings after Monday’s close.
NFIB Optimism Index data is released on Tuesday at 6 am.
Academy Sports + Outdoors, Core & Main, J.M. Smucker & United Natural Foods report earnings before Tuesday’s opening bell, with GameStop, Dave & Buster’s, GitLab & Stitch Fix all reporting after the session’s close.
Wednesday gives us insight into inflation with Consumer Price Index, Core CPI, CPI Year-over-Year & Core CPI Year-over-Year data at 8:30 am, before Monthly U.S. Federal Budget data at 2pm.
Chewy & SailPoint report earnings before Wednesday’s opening bell, followed by Oracle & Oxford Industries after the closing bell.
Initial Jobless Claims, Producer Price Index, Core PPI, PPI Year-over-Year & Core PPI YEar-over-Year data are released Thursday at 8:30 am.
Lovesac reports earnings on Thursday before the session opens, followed by Adobe & RH after the session’s close.
Friday the week winds down with Consumer Sentiment (prelim) data at 10 am.
There are no major earnings reports due out of Friday.
See you back here next week!
*** I DO NOT OWN SHARES OR OPTIONS CONTRACT POSITIONS IN SPY, QQQ, IWM OR DIA AT THE TIME OF PUBLISHING THIS ARTICLE ***
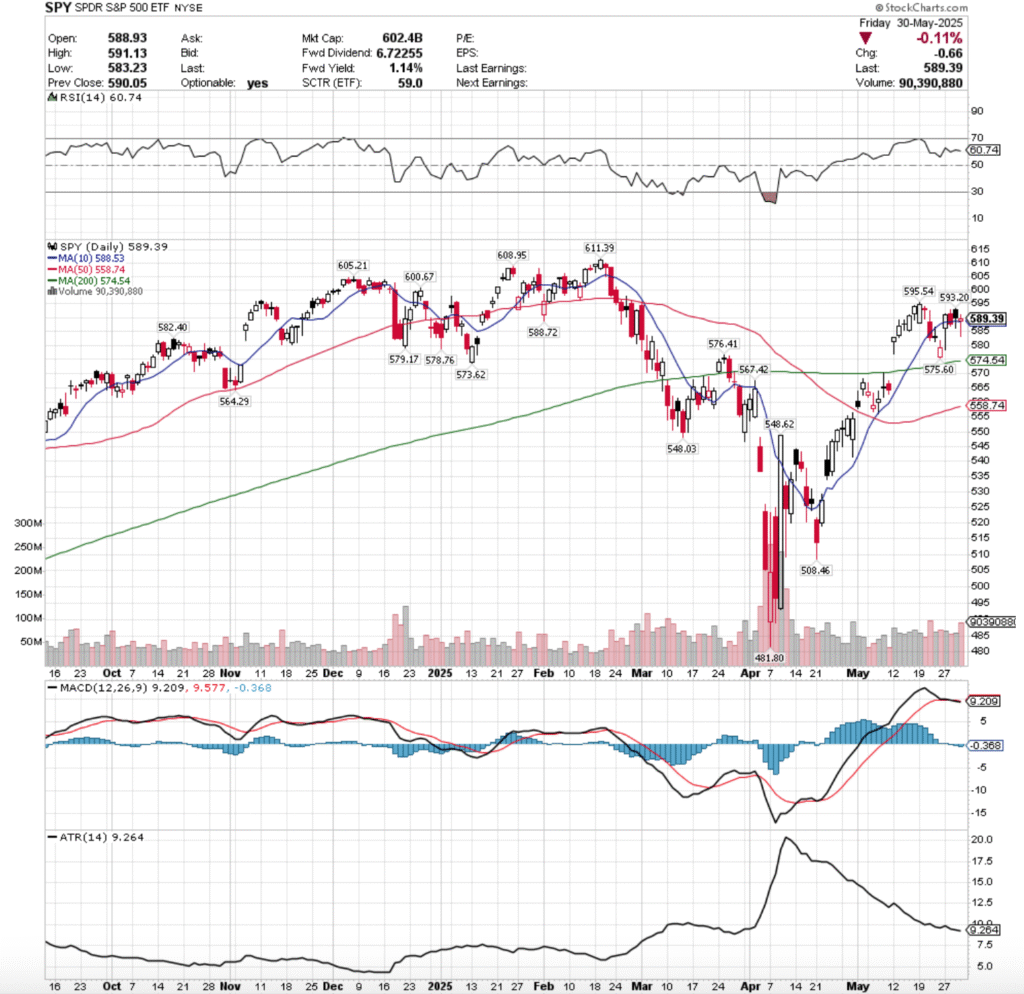
SPY, the SPDR S&P 500 ETF gained +1.78% last week, while the VIX closed the week at 18.57, indicating an implied one day move of +/-1.17% & an implied one month move of +/-5.37%.
SPY ETF – SPDR S&P 500 ETF’s Technical Performance Over The Past Year
Their RSI is relatively flat after last week’s limited price range, currently sitting at 60.74, while their MACD crossed over bearishly, but is also relatively flat.
Volumes were +32.73% above the prior year’s average (75,427,500 vs. 56,826,680), which is an area for concern given the highest volume session was Friday’s profit taking decline & two other sessions were cause for concern (75% of the week, given it was a holiday week).
Tuesday the week opened on a gap up, but with very shaky footing beneath it.
While the day closed as a +2.08% advancing session, the day’s low had retraced the entire gap range & into Friday’s candle’s body below Friday’s closing price.
While this occurred on the second highest volume of the week, it looked a lot more like an intra-day profit grab on a shortened week vs. an actual solid advancing session.
Wednesday opened slightly higher, but was pulled back down & ultimately broke down though the support of the 10 day moving average, indicating that the short-term trend is possibly in trouble.
Thursday reinforced this hazy outlook for SPY, when on an opening gap up there was no footing to be found & intraday the support of the 10 DMA broke down again as shown by the candle’s lower shadow.
The combination of the week’s second lowest volume, the deep intraday breakdown of the 10 DMA’s support, even if only temporary & the close being lower than the day’s open are all causes for concern, as market participants are clearly not thinking we’re out of the woods just yet.
Friday also did little to inspire confidence for SPY, as the week’s highest volume session opened below Thursday’s closing price, dropped temporarily intraday to below $585/share, before managing to advance above the day’s open into the close, but still resulted in a decline of -0.11%.
The high volume isn’t as bad in this instance as it may have been viewed in an outright declining day, given that there was a good amount of shares changing hands, folks taking profits & some folks buying back in in anticipation of this coming week, which will have aslew of Fed speakers & also some data points that will shed insight into the state of employment & manufacturing in the U.S..
What is alarming though is that the session opened just above the 10 DMA’s support, managed to break down through it -0.97% to the day’s low, and then saw the close wind up just marginally above the day’s open.
The Day-over-Day change in lows is also an area of concern heading into the new week, as it is exposing that there is more & more downside appetite among market participants.
In last week’s market review note we noted that there was going to be an interesting Seller zone cross through in order for price to re-test the 10 DMA & then ultimately if broken through, test the strength of it as a support level.
Most of that was accomplished by Tuesday morning’s gap up open, which should be tread carefully around given that the volume level was second highest of a 4 day week, but nothing that expressed proper conviction behind the move & it’s likely not sustainable.
This week, to the upside there will need to be the same sustainable high advancing volume levels mentioned over the past months now, but the $600.67 mark is an area to watch.
Should prices test this level it means having passed through a Seller zone to the upside, and there may be some high participation that forces prices to continue higher.
In the event of further consolidation, expect price to continue to oscillate around the 10 day moving average as we await a catalyst to the upside or downside.
In the event that it takes a few weeks to reach one (highly doubtful), there may be a slight bump to the upside from the 50 DMA crossing over the 200 DMA bullishly, but this is an extreme case example.
To the downside, the 200 day moving average is an area all eyes should be focused on, as the long-term trendline was only crossed over on a gap up, which was somewhat speculative.
How market participants think of the price in relation to the long-term trend is going to be a key area to watch.
While the past few years show that price zones down to $574.99/share have been Seller dominated, there may be some footing to be found once price has dropped below there, which would alleviate concerns of the 200 DMA being re-tested, but it is certainly an area to be watching.
Price will like oscillate between the 10 & 200 DMAs for a while while we await a further up/downside catalyst in the event that this decline takes place.
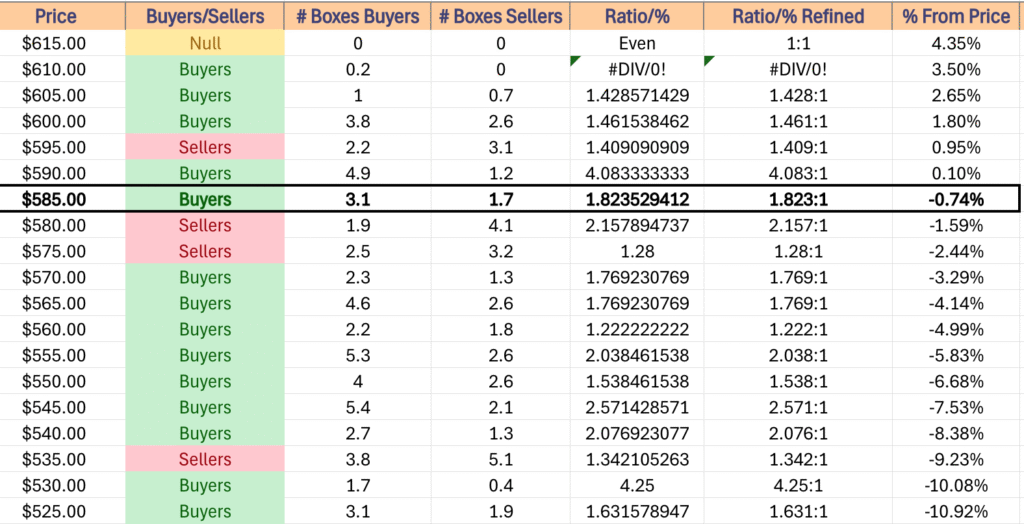
SPY has support at the $588.72 (Volume Sentiment: Buyers, 1.82:1), $588.53 (10 Day Moving Average, Volume Sentiment: Buyers, 1.82:1), $582.40 (Volume Sentiment: Sellers, 2.16:1) & $579.17/share (Volume Sentiment: Sellers, 1.28:1) price levels, with resistance at the $593.20 (Volume Sentiment: Buyers, 4.08:1), $595.54 (Volume Sentiment: Sellers, 1.41:1), $600.67 (Volume Sentiment: Buyers, 1.46:1) & $605.21/share (Volume Sentiment: Buyers, 1.43:1) price levels.
SPY ETF’s Price Level:Volume Sentiment Over The Past ~3 Years
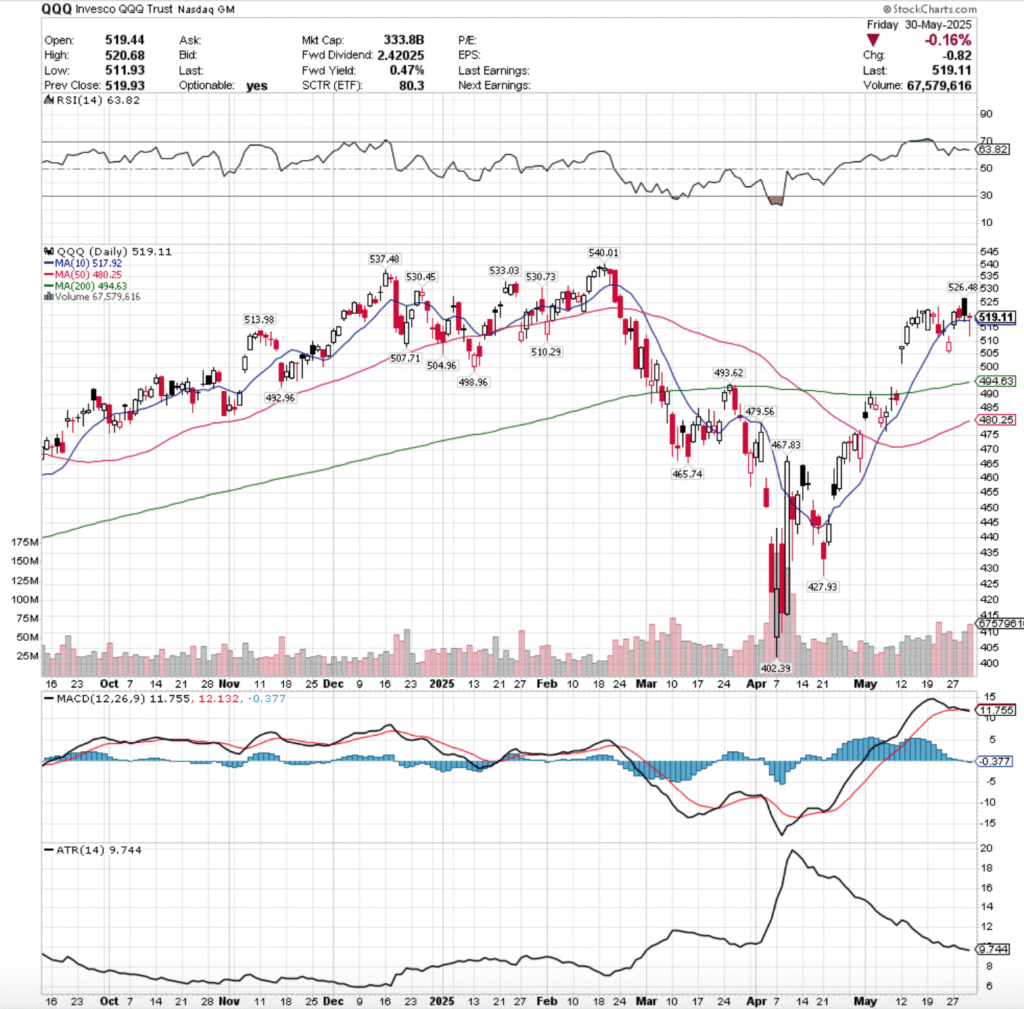
QQQ, the Invesco QQQ Trust ETF advanced +1.94% for the week, as the tech-heavy index was the favorite of the major four index ETFs.
QQQ ETF – Invesco QQQ Trust ETF’s Technical Performance Over The Past Year
Their RSI has flattened out following last week as well, but currently sits at 63.82, while their MACD is bearish.
Volumes were +45.75% higher than the prior year’s average (55,062,500 vs. 37,779,012), which paints a similar problem as the one mentioned above for SPY.
Tuesday the week opened up a similar gap up, gaining +2.35% on the day on the second lowest volume of the week.
It opened just beneath the 10 day moving average’s support, temporarily dipped below the $515/share level on the low end of the day’s range, before gaining some steam & powering higher to close setting the stage for the week to be above the 10 DMA.
Wednesday opened on a gap higher, tested slightly higher as displayed on their upper shadow, but declined the rest of the day to re-test the 10 day moving average’s support, which was able to hold up & force the day to close above it, despite declining -0.44% on the day.
Thursday is where the concern really began though & cracks began to show, as the session opened on a gap higher, but it was mostly downhill from there.
QQQ declined to dip beneath the support of the 10 day moving average, but was able to rally higher to close lower on the day than it opened, but still for a day-over-day gain of +0.2%.
Thursday was the second highest volume day of the week, and while it can be said that it covered a wide range of prices, it can also be said that it was a day of heavy profit-taking, which reflects negative sentiment & calls into question the strength of the short-term trend line (10 day moving average).
Friday confirmed that there was a bit of blood in the water, as QQQ opened lower, briefly tested to the upside, but was rejected near the close of Thursday’s session, and prices free-fell in a profit taking bonanza that dropped QQQ down to $511.93/share during the day’s low.
While prices climbed back to close the day as a dragonfly doji, this downside appetite doesn’t inspire confidence in the tech-heavy index.
Given the proximity of the short-term trend line & the new downside appetite that made a run at closing the window of Tuesday’s gap (assuming it closed near the lows), it is going to be worth watching for a rugpull in the coming week.
To the upside there are two place to watch, first being the $526.48 level & second being the resistance zone in the $530-531/share level.
While the table below shows that this is all Buyer oriented historically, this looks primed to be a time of ratio dilution with Sellers stepping in, so there will need to be some solid volume behind any upwards moves to make them sustain.
The consolidation case looks like a bit of oscillating around the 10 DMA awaiting an upside/downside catalyst, with a chance up a slight uptick when the 50 DMA crosses bullishly over the 200 DMA, but that’s weeks away, should it occur.
The downside view looks tricky, as in the event that the first support levels of $517.92 breaks down, we enter a Seller zone with two support levels, which should they break down may become problematic, given the window from early May that needs to be closed.
In the event that the gap begins to fill, the strength of the long-term trend line (200 DMA) is going to be key, but more likely to be determined by recent candles near the approach & their volume trends.
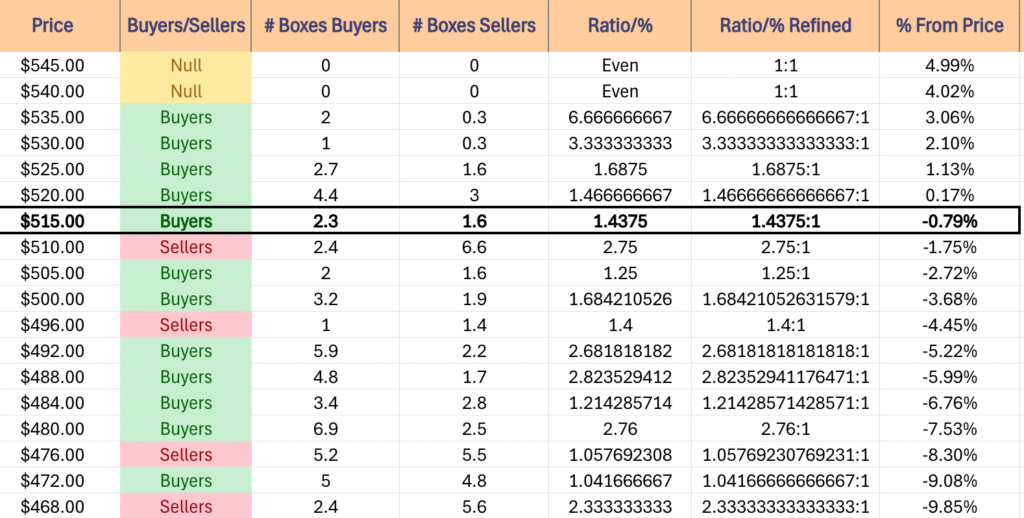
QQQ has support at the $517.92 (10 Day Moving Average, Volume Sentiment: Buyers, 1.44:1), $513.98 (Volume Sentiment: Sellers, 2.75:1), $510.29 (Volume Sentiment: Sellers, 2.75:1) & $507.71/share (Volume Sentiment: Buyers, 1.25:1) price levels, with resistance at the $526.48 (Volume Sentiment: Buyers, 1.69:1), $530.45 (Volume Sentiment: Buyers, 3.33:1), $530.73 (Volume Sentiment: Buyers, 3.33:1) & $533.03/share (Volume Sentiment: Buyers, 3.33:1) price levels.
QQQ ETF’s Price Level:Volume Sentiment Over The Past ~1 Year
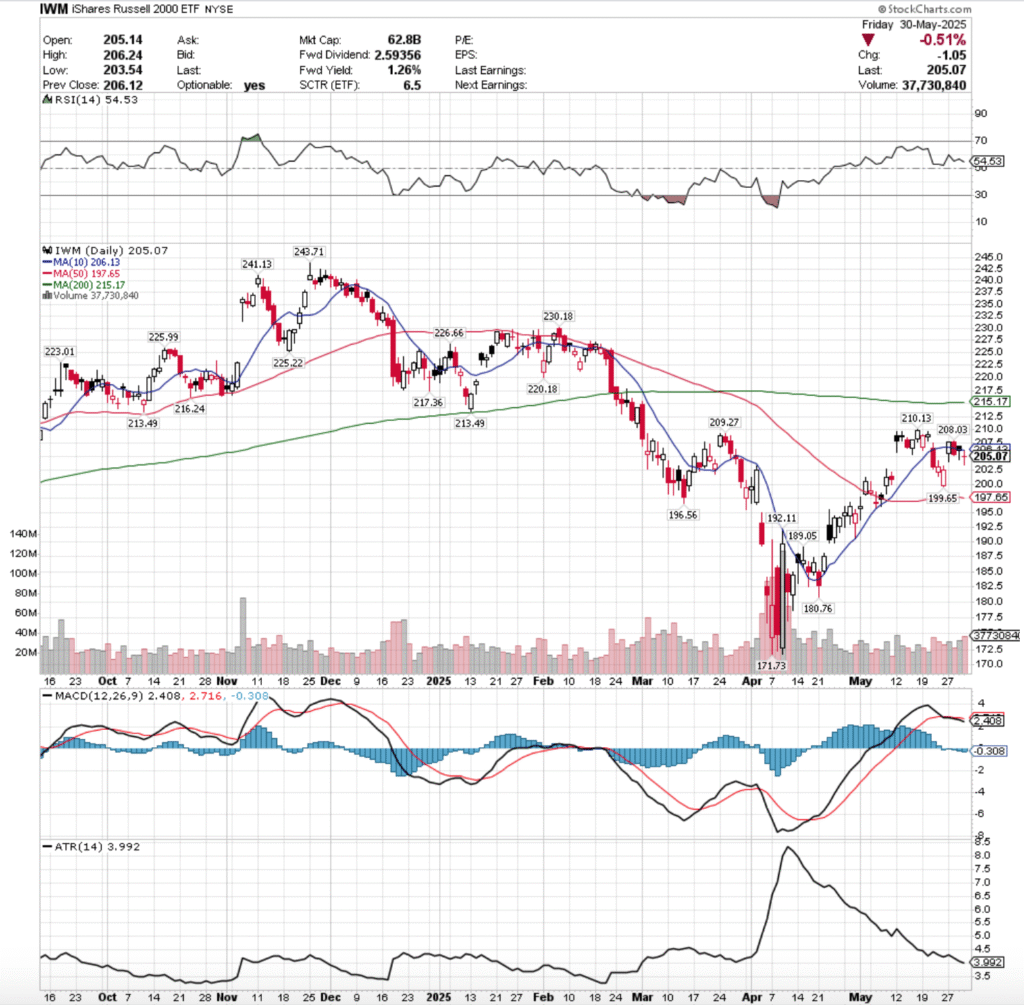
IWM ETF – iShares Russell 2000 ETF’s Technical Performance Over The Past Year
Their RSI is trending down towards the neutral 50-mark, currently sitting at 54.53, while their MACD is bearish, but has been relatively flat awaiting a catalyst for the past week.
Volumes were +6.82% above the prior year’s average level (32,070,000 vs. 30,022,411), which like the two aforementioned index ETFs is a cause for concern for IWM & its components.
The story of the week for IWM is similar to SPY & QQQ, however the 10 DMA did not prevail, which is slight cause for concern for the other two indexes.
While IWM is expected to lag them/be more of a slow grower with more oscillations on the way up, the short-term trendline’s breakdown paints a broad weak picture for the others.
Tuesday opened on a gap up, tested lower intra-day, but was able to power higher & close above the support of the 10 day moving average despite opening the day below it.
Wednesday opened in linen with Tuesday’s close, but made short work of sinking down through the 10 DMA’s support on the week’s weakest volume.
Thursday had a unique set up that signaled there was impending trouble on the horizon for IWM.
The session opened midway through Wednesday’s range, then broke out to the downside & was able to close lower than the open but above the day’s low & in-line with the 10 DMA.
Friday the week wound down on a week of skeptical uncertainty, as the week;s highest volume session resulted in a doji candle that opened on a gap lower, was unable to break out above the 10 DMA’s resistance to the upside, and a lot of profits were taken based on the amount of shares that exchanged hands over the last session of the week.
IWM is in a unique spot as it is more influenced by the larger cap indexes at the moment, as the uncertainty we’re surrounded by has folks not eager to jump into small cap names that are relatively unheard of.
As a result, the long-term trend line is the area of focus on the upside, given their state of limbo & that they’re trading below it.
Like SPY & QQQ, they’re going to need an influx in sustainable advancing volume to make a run at the 200 DMA’s resistance, so it’s something to keep an eye on, but not a focal point of IWM’s near-term performance.
In the consolidation case, we’ll see oscillations around the 10 DMA, which may wind up testing some of the other nearby support/resistance levels, which may cause the consolidation range to change, but the oscillations to continue.
The downside case brings all eyes on the 50 day moving average’s support, given that IWM is trading below its long & short-term trendlines.
Seller sentiment can bring IWM to the $197.99/share level, which would place it in the neighborhood of said re-test, which is a safe place to look in the coming week or two.
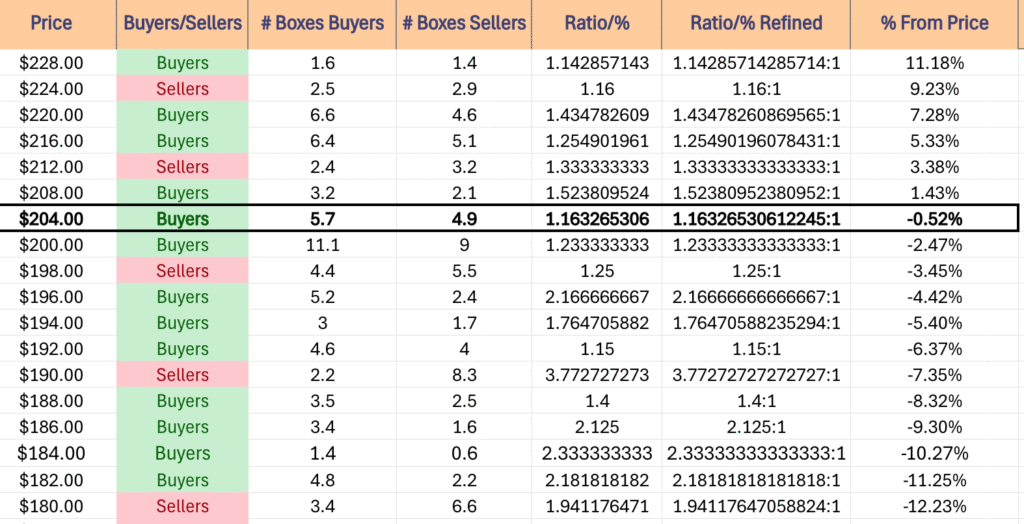
IWM has support at the $199.65 (Volume Sentiment: Sellers, 1.25:1), $197.65 (Volume Sentiment: Buyers, 2.17:1), $196.56 (Volume Sentiment: Buyers, 2.17:1) & $192.11/share (Volume Sentiment: Buyers, 1.15:1) price levels, with resistance at the $206.13 (10 Day Moving Average, Volume Sentiment: Buyers, 1.16:1), $208.03 (Volume Sentiment: Buyers, 1.52:1), $209.27 (Volume Sentiment: Buyers, 1.52:1) & $210.13/share (Volume Sentiment: Buyers, 1.52:1) price levels.
IWM ETF’s Price Level:Volume Sentiment Over The Past ~2-3 Years
DIA, the SPDR Dow Jones Industrial Average ETF climbed +1.57% last week, but there was an air of caution based on volume levels, as we continue to see a more “buy & hold”/”wait & see” approach from the blue chip index.
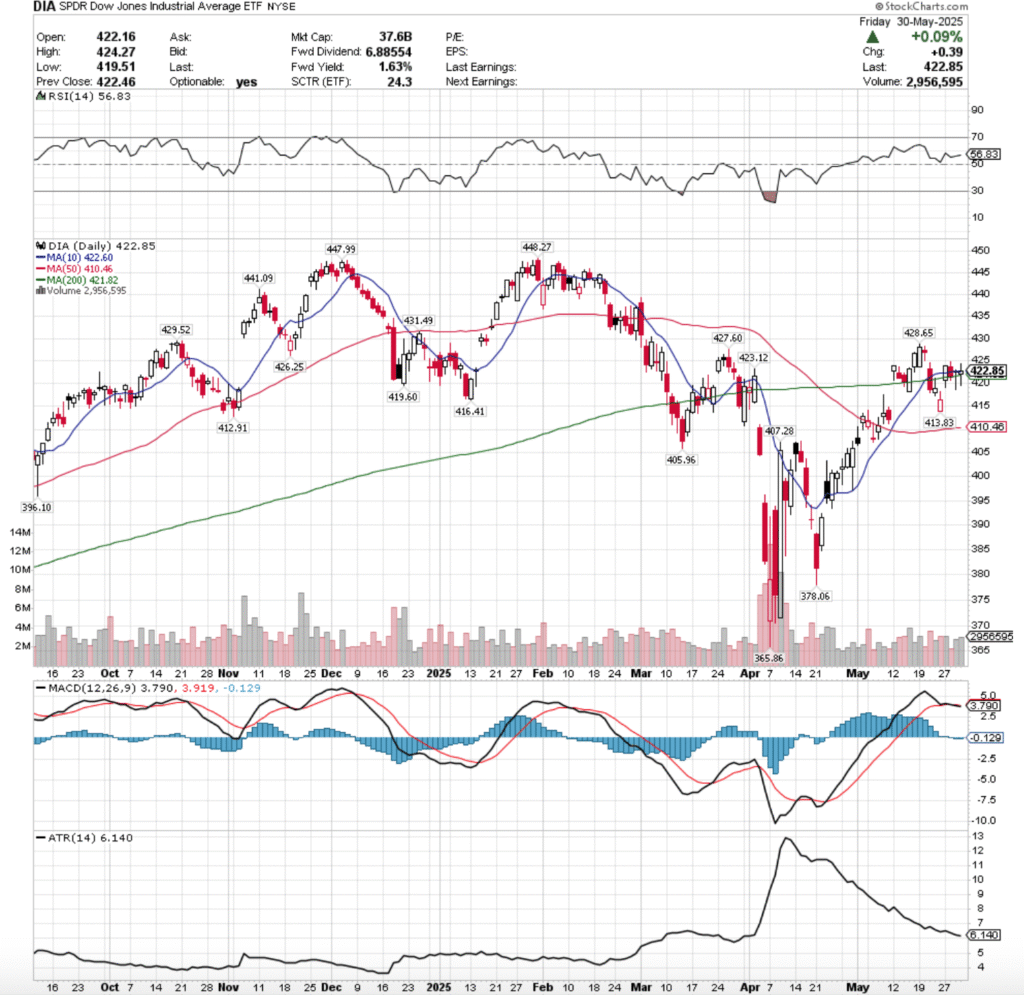
DIA ETF – SPDR Dow Jones Industrial Average ETF’s Technical Performance Over The Past Year
Their RSI is currently 56.83, while their MACD is bearish, but relatively flat following last week’s consolidation range.
Volumes were -16.39% lower than the prior year’s average level (2,657,500 vs. 3,178,498), signaling that there are a lot of market participants in “wait & see” mode with the blue chip index & its components.
DIA’s week opened Tuesday with more volume than its peers comparitively speaking & was a gap up open that was able to break above the resistance of the 200 day moving average, but not until after it showed that it had a bit of downside appetite down to the $419.19/share level.
Wednesday opened slightly lower, tried to rip higher, but ultimately sank down to close just above the 200 DMA, after briefly breaking through it to the downside, but forming a bearish harami pattern with Tuesday’s candle.
Thursday things continued to be interesting, as the day opened & closed as technically a bullish harami cross, but there was a major catch.
While the daily candle is a dragonfly doji, looking closely there are a few causes for concern, namely that the session opened & closed in-line with the short-term trendline, but intraday its support broke down, as did the support of the long-term trend line.
Given that the volume was the second lowest of the week but that wide of a price range was covered there is reason for doubt regarding the near-term for DIA.
Friday didn’t settle this fear, opening lower near the 200 DMA’s support, dropping below the $420/share level, before advancing to just short of the $425/share price level & closing just beneath it as a spinning top candle.
The indecision marked by the day’s candle sets the stage for an interesting week.
To the upside, the first resistance levels is in a Seller dominated zone (table below), which as mentioned now for months will require a steady, consistent uptick in advancing volume to break above, even if this past week’s consolidation does become a launch pad.
From there, the high water mark becomes the $431.49/share level, which while there is historic Buyer sentiment all the way up to it, it wanes after the next price level, which makes it worth keeping an eye out to see if Sellers step in, rejecting an advance & diluting the historic ratio.
The consolidation case should prices not break the next resistance levels looks similar to what last week delivered, and shows DIA oscillating around the 10 & 200 day moving averages until we see an upside or downside catalyst.
An area of caution though for that scenario is that we are in a Buyer dominated price zone historically, and that may mean that any slight slips wind up leading to larger declines than expected.
In the event of a downside catalyst, the next two support levels are in a Seller dominated historic price zone.
Should both the long & short term trendlines (10 & 200 DMAs) break down & these levels can’t foot support, watch for the windows created in May to be filled & prices revert towards the 50 day moving average’s support.
Watching Volume levels & comparing them with the historic sentiments in the table below will be beneficial in navigating these markets.
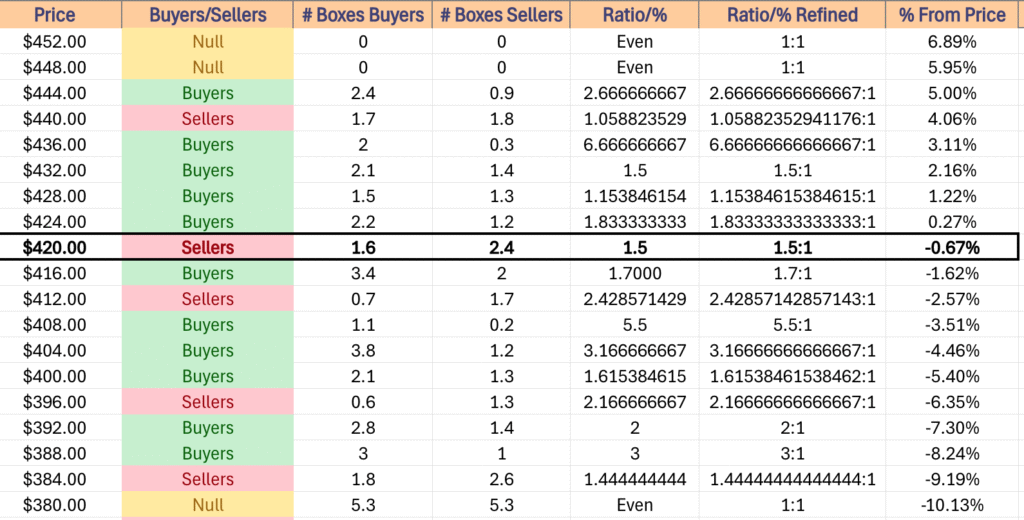
DIA has support at the $422.60 (10 Day Moving Average, Volume Sentiment: Sellers, 1.5:1), $421.82 (200 Day Moving Average, Volume Sentiment: Sellers, 1.5:1), $419.60 (Volume Sentiment: Buyers, 1.7:1) & $416.41/share (Volume Sentiment: Buyers, 1.7:1) price levels, with resistance at the $423.12 (Volume Sentiment: Sellers, 1.5:1), $426.25 (Volume Sentiment: Buyers, 1.83:1), $427.60 (Volume Sentiment: Buyers, 1.83:1) & $428.65/share (Volume Sentiment: Buyers, 1.15:1) price levels.
DIA ETF’s Price Level:Volume Sentiment Over The Past ~4-5 Years
The Week Ahead
Monday kicks the week off with S&P Final Manufacturing PMI data at 9:45 am, ISM Manufacturing data comes out at 10 am along with Construction Spending data, Fed President Logan speaks at 10:15 am, Fed President Goolsbee speaks at 12:45 pm & Fed Chair Powell speaks at 1 pm.
Before Monday’s opening bell Campbell’s Soup & Science Applications Report Earnings, before Credo Technology Group after the close.
Factory Orders & Job Openings data come out Tuesday at 10 am, before Fed President Goolsbee speaks at 12:45 pm, Fed Governor Cook speaks at 1 pm & Fed President Logan speaks at 3:30 pm.
Tuesday morning’s earnings calls include Dollar General, Donaldson, Ferguson, NIO, Ollie’s Bargain Outlet & Signet Jewelers, before CrowdStrike Holdings, Asana, Couchbase, Guidewire Software, Hewlett Packard Enterprise & Yext after the session’s closing bell.
Wednesday morning brings us ADP Employment numbers at 8:15 am, Fed Presidents Bostic & Cook speak at 10:15 am, S&P Final U.S. Services PMI data comes out at 9:45 am, ISM Services data comes out at 10 am & the Fed’s Beige Book is released at 2pm.
Dollar Tree, Genesco, REV Group, Sprinklr & Thor Industries report earnings before the opening bell on Wednesday, while Argan, Descartes, Five Below, Greif, MongoDB, PVH & Verint Systems report earnings following the session’s close.
Thursday brings us Initial Jobless Claims, U.S. Trade Deficit & U.S. Productivity data at 8:30 am, before Fed Governor Kugler speaks at 12 pm & Fed President Harker speaks at 1:30 pm.
Brown-Forman, Ciena, Cracker Barrell, Hello Group, Toro & Victoria’s Secret all report earnings before Thursday’s open, before Broadcom, Braze, DocuSign, Lululemon Athletica, Mission Produce, Petco Health & Welness, Rubrik, Samsara, Service Titan, Vail Resorts & Zumiez report after the closing bell.
U.S. Employment Report, U.S. Unemployment Rate, U.S. Hourly Wages & Hourly Wages Year-over-Year are all due Friday morning at 8:30 am, followed by Consumer Credit at 3pm.
Friday features ABM Industries reporting earnings after the session’s close.
See you back here next week!
*** I DO NOT OWN SHARES OR OPTIONS CONTRACT POSITIONS IN SPY, QQQ, IWM OR DIA AT THE TIME OF PUBLISHING THIS ARTICLE ***
SPY, the SPDR S&P 500 ETF declined -2.54% last week, while the VIX closed the week out at 20.57, indicating an implied one day move of +/-1.3% & an implied one month move of +/-5.95%.
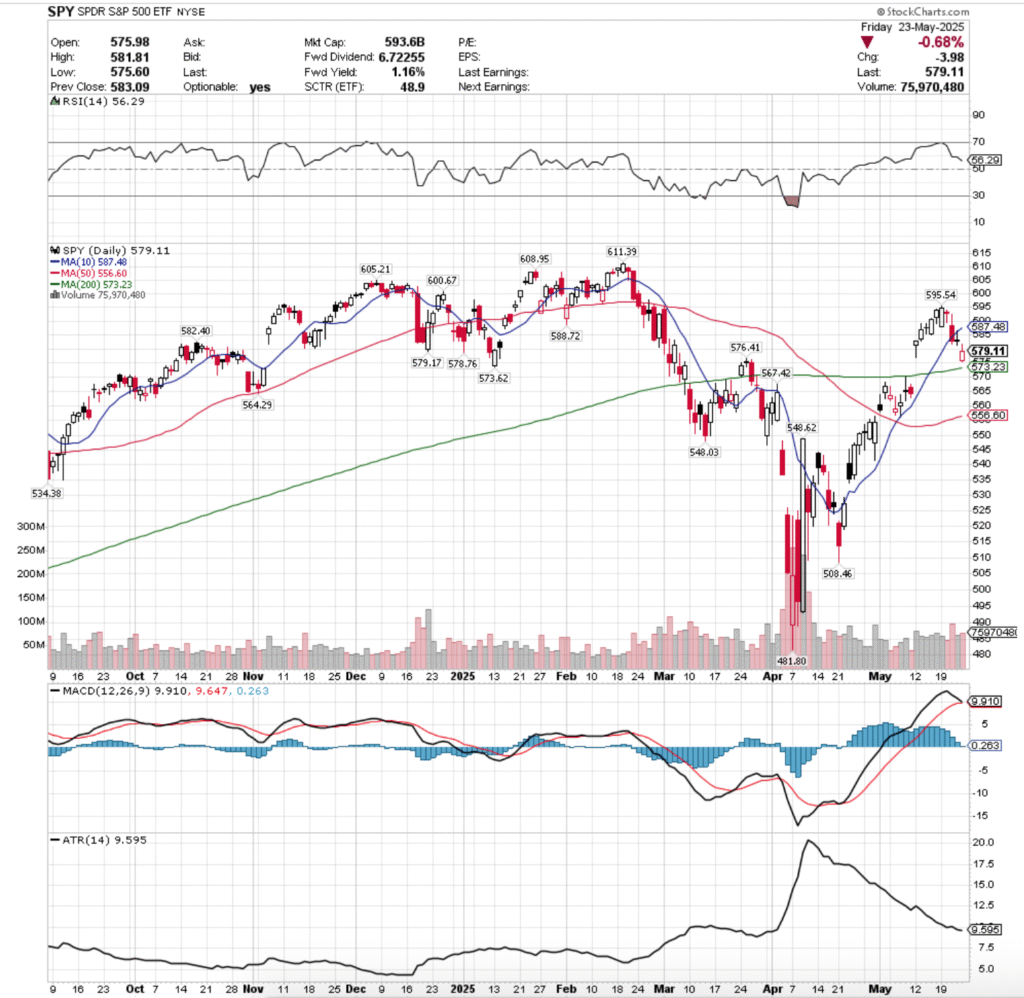
SPY ETF – SPDR S&P 500 ETF’s Techincal Performance Over The Past Year
Their RSI is trending down towards the neutral 50 level & sits currently at 56.29, while their MACD is set to cross over bearishly on Tuesday or Wednesday of this coming week (barring any unusual jumps in price).
Volumes were +31.36% higher than the prior year’s average levels (74,174,000 vs. 56,466,920), which certainly does not inspire near-term confidence, especially heading into a shortened holiday week.
Monday saw SPY walk up to the edge of the diving board, as the week’s second lowest volume session formed a bullish engulfing pattern with the previous Friday’s session, but SPY’s oscillators had begun to show fatigue as we noted last week.
Tuesday is when the breakdown began, as the session opened & formed a dragonfly doji that also created a bearish harami with Monday’s candle on the lowest volume of the week.
While many analysts think of the dragonfly doji as indicating that there is a spike on the horizon & maybe a reversal occuring, the low volume paired with the lower shadow’s range set the stage for more pain throughout the week, particularly given SPY’s proximity to their 10 day moving average.
Wednesday confirmed this, when SPY opened on a gap down, attempted to retrace back towards its closing price level on Tuesday, only to on the highest volume of the week see market participants head towards the exits, and SPY declined -1.69% on the day, closing down by the support of their 10 DMA.
It is worth noting that the 10 DMA temporarily broke down during the session as well, as there was quite a bit of selling pressure surrounding SPY.
Thursday saw SPY opened below the resistance of the 10 day moving average, attempt a run up at it, but it was unable to break out above it & the session closed as a gravestone doji for a gain of +0.04% for the day.
Thursday’s lower shadow also signaled that there was slightly more appetite to the downside day-over-day, which while it was a small amount, isn’t something to be ignored.
Friday showed a risk-off into the holiday weekend theme, as the week’s second highest volume session opened on a gap down, managed to briefly break above Thursday’s low price, and wound up settling higher than it opened, but for a day-over-day loss of -0.68%.
The support of the 200 day moving average was not tested, but prices were trending more in that direction than higher by the end of the week.
Heading into the new week the upside will be contingent on the strength or weakness of the 10 day moving average’s resistance.
What will make this even more interesting to watch is that the current price zone that the 10 DMA is in is historically a Buyer dominated zone, but SPY must first travel through the Seller dominated zone in the middle to earn said re-test, which may wind up showing signs of Buyer-fatigue even in the even that prices make it to that level.
SPY will still need to show strong, consistent advancing volume in order to begin to appear like a base that can be built off of is forming for a reversal.
Should the 10 DMA dip into the Seller dominated zone just above Friday’s closing price it is unlikely that there will be a successful retest of the 10 DMA this week.
The consolidation case involves oscillating between the 200 & 10 day moving averages, while staying around the window created by the gap up open from two Monday’s ago while awaiting a catalyst to the upside or the downside.
There are still some highly anticipated earnings calls this week, including the likes of NVDIA & Salesforce, a slew of Federal Reserve speakers on tap for the week & we’ll get a read on inflation based on PCE data that comes out Friday.
Without any meaningful catalyst in either direction & without some strong volume the consolidation & “wait & see” heading into next week seems the most likely.
In the event of downside action, should the 200 day moving average’s support break down then we will likely see a drop below $570/share & since there are only two support touch-points in the $560’s price range all eyes will be looking towards the 50 day moving average’s support, which will be moving higher to greet SPY’s price.
Given that this week is a short one, unless there is a major catalyst to the upside or downside it seems most likely that things will remain relatively quiet, barring any extreme news or surprises.
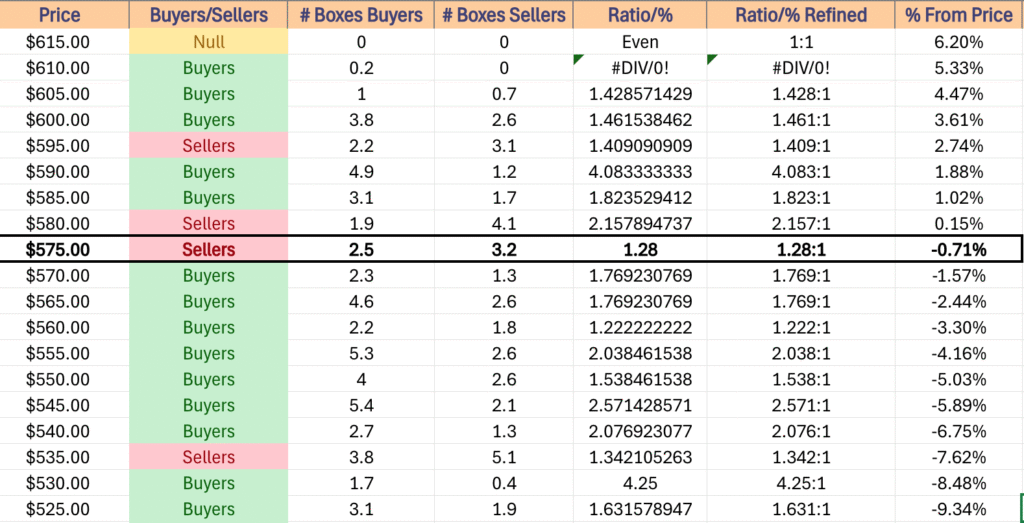
SPY has support at the $578.76 (Volume Sentiment: Sellers, 1.28:1), $576.41 (Volume Sentiment: Sellers, 1.28:1), $573.62 (Volume Sentiment: Buyers, 1.77:1) & $573.23/share (200 Day Moving Average, Volume Sentiment: Buyers, 1.77:1) price levels, with resistance at the $579.17 (Volume Sentiment: Sellers, 1.28:1), $582.40 (Volume Sentiment: Sellers, 2.16:1), $587.48 (10 Day Moving Average, Volume Sentiment: Buyers, 1.82:1) & $588.72/share (Volume Sentiment: Buyers, 1.82:1).
SPY ETF’s Price Level:Volume Sentiment Over The Past ~2-3 Years
QQQ, the Invesco QQQ Trust ETF dipped -2.35% last week, as the tech-heavy index managed to log the best performance of the four majors.
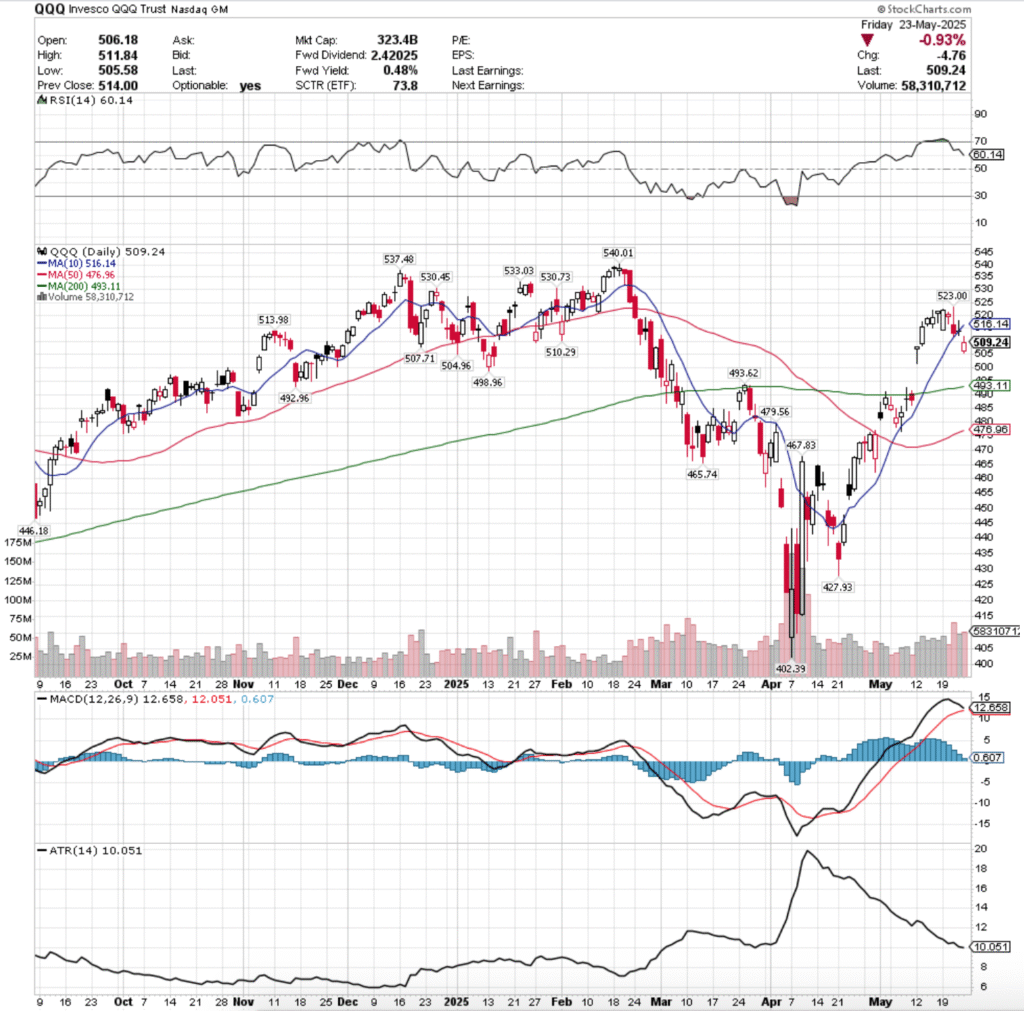
QQQ ETF – Invesco QQQ Trust’s Technical Performance Over The Past Year
Their RSI dropped back below overbought levels last week & is currently trending lower at 60.14, while their MACD is set to crossover bearishly either Tuesday or Wednesday of this week following last week’s declines.
Volumes were +49.63% higher than the prior year’s average levels (56,066,000 vs. 37,470,0040), which while it shows that there was certainly a degree of profit taking during a week when all major index ETF’s declined, also shows that there is still a decent degree of hopes & optimism attached to Wednesday’s earnings calls for NVDA & Salesforce.
Monday opened the week up for QQQ in a similar manner to SPY, setting the stage for price to jump off of the diving board into the rest of the week.
Tuesday opened lower, tested to below the midway point of Monday’s session before recovering to close higher than it opened, but as a hanging man candle (bearish).
Tuesday also featured the week’s lowest volume, indicating that there was not much positive sentiment behind the day’s price action, even though it did manage to close above its opening price level.
Wednesday saw a shimmer of optimism, as despite a gap down open QQQ’s price was able to rally back to touch $523/share temporarily, but intraday profits were taken quickly, forcing QQQ to retreat & close in-line with the support of their 10 day moving average.
Thursday it was clear that market participants didn’t know which way was up, but they did know that they were only willing to go so much higher up from Wednesday’s close.
The session opened nearly in-line with Wednesday’s close & the 10 day moving average, attempted to rally higher, but was thwarted not much higher than Wednesday’s open, and the support of the 10 day moving average was temporarily broken through.
Friday this carried into the weekend, when the week’s second highest session by Volume opened on a gap lower, tested but managed to stay above the $505/share level, closing the day above its open at $509.24/share.
QQQ is in a similar boat to SPY (as they’ve been relatively similar for years), any upside movement is going to require some stable, strong advancing volume & some form of an upside catalyst, at which point all eyes will be on the 10 day moving average.
Without those conditions, at best any upside move will result in oscillations around the 10 day moving average while awaiting something to move the market.
The consolidation case features oscillations in between the 10 & 200 day moving averages while awaiting news to propel QQQ higher or to break down the 200 day moving average’s support.
In the event of a move lower, the $496-499.99/share price level is Seller dominated over the past year, which would walk prices up with some momentum behind them to retest that 200 DMA.
The window formed at the end of April/early May would then become of interest, as it was never fully closed.
It would also then see the 50 day moving average’s support be tested, which is interesting given that said gap up occurred last time that QQQ’s price tested the 50 DMA.
The table below will be handy for navigating these re-tests.
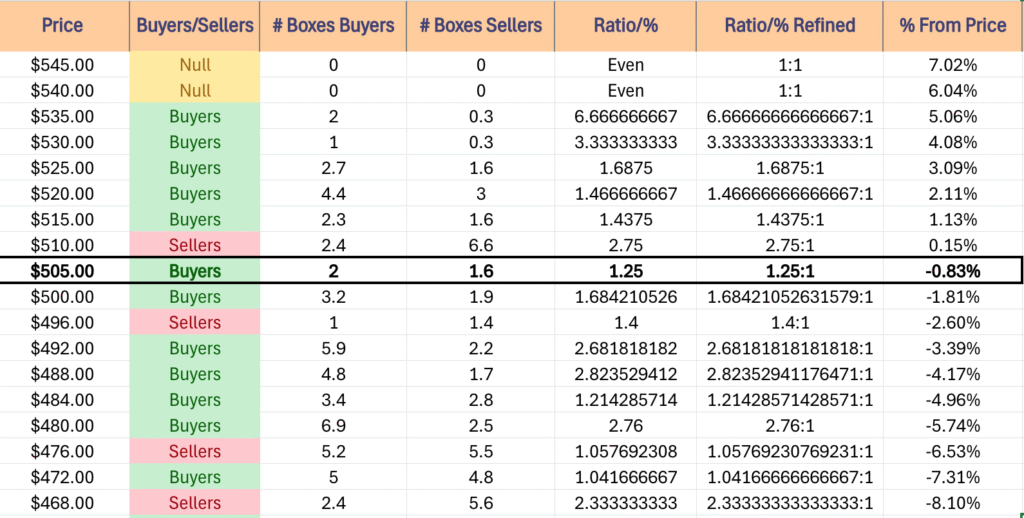
QQQ has support at the $507.71 (Volume Sentiment: Buyers, 1.25:1), $504.96 (Volume Sentiment: Buyers, 1.68:1), $498.96 (Volume Sentiment: Sellers, 1.4:1) & $493.62/share (Volume Sentiment: Buyers, 2.68:1) price levels, with resistance at the $510.29 (Volume Sentiment: Sellers, 2.75:1), $513.98 (Volume Sentiment: Sellers, 2.75:1), $516.14 (10 Day Moving Average, Volume Sentiment: Buyers, 1.44:1) & $523/share (Volume Sentiment: Buyers, 1.47:1).
QQQ ETF’s Price Level:Volume Sentiment Over The Past ~1 Year
IWM, the iShares Russell 2000 ETF fell -3.47% last week, as market participants shunned the small cap index in favor of the other four major indexes.
IWM ETF – iShares Russell 2000 ETF’s Techincal Performance Over The Past Year
Their RSI has flattened out just above the neutral 50 level & is currently at 52.21, while their MACD just crossed over bearishly late last week.
Volumes were -2.8% lower than the prior year’s average level (29,110,000 vs. 29,949,360), which indicates that there is certainly a bit of negative sentiment attached to the small cap index currently amidst market volatility.
Small cap names are not going to have an easy time recovering in the event that weakness is shown by SPY, QQQ or DIA in the next week or two, given how much uncertainty market participants are showing around those larger, more household names.
Monday the small cap index opened on a gap down, but managed to rally back to close above its open, but the session occurred on very weak volume.
Tuesday the uncertainty continued, when prices closed as a spinning top candle, indicating indecision on the weakest volume of the week (which only added to said sense of uncertainty).
Wednesday is when the damn gave way, opening on a gap down in-line with the 10 day moving average, briefly testing higher, but ultimately sliding back beneath the resistance of the 10 day moving average & declining -2.81% for the day.
Given the week’s highest volume occurred Wednesday, this should be taken as a sign of “everybody out of the pool” & that there is slipping levels of confidence in IWM.
The rest of the week IWM moved almost as though it was on stairs, opening Thursday on a gap down & closing the day as a spinning top, which indicates that there was indecision in the air, and lots of it given it occurred on the week’s second strongest volume.
This is especially true given the nature in how much profit taking (and loss cutting) was taking place intra-day when you look at the price levels that IWM was circling around all day.
Friday the week wound down on another gap down open to $199.78, but prices managed to find footing heading into the holiday weekend & closed at $202.56/share.
Heading into the fresh, shortened holiday week IWM has less upside potential of the index ETF’s listed so far, mostly as they have little to do with the major earnings calls of the week & the general uneasiness of market participants is not very telling of the strength of the small cap index.
However, in the event that a rising tide comes along to lift all boats, the 10 day moving average will be an interesting test for IWM, as even if they manage to break above it, they’ve got a Seller dominated zone right above it that seperates them from the long-term trend line.
IWM’s consolidation case revolves around price oscillating between the 10 & 50 day moving averages for the rest of the week, awaiting a nudge to the upside or downside.
The downside case involves a test of the 50 day moving average’s support, which is in a Buyer dominated price zone that falls just below a Seller zone.
If this does happen, all eyes should go to the windows that were created by gap up sessions on the bookends of April 2025, as those levels will likely be retested to formally close the window.
The table below is useful for assessing the strength/weakness of IWM’s support/resistance levels if they are approached again for re-tests.
IWM has support at the $202.46 (Volume Sentiment: Buyers, 1.23:1), $197.50 (50 Day Moving Average, Volume Sentiment: Buyers, 2.17:1), $196.56 (Volume Sentiment: Buyers, 2.17:1) & $192.11/share (Volume Sentiment: Buyers, 1.15:1) price levels, with resistance at the $206.83 (10 Day Moving Average, Volume Sentiment: Buyers, 1.16:1), $209.27 (Volume Sentiment: Buyers, 1.52:1), $210.13 Volume Sentiment: Buyers, 1.52:1) & $213.49/share (2 Touch-Points, Volume Sentiment: Sellers, 1.33:1).
IWM ETF’s Price Level:Volume Sentiment Over The Past ~2-3 Years
DIA, the SPDR Dow Jones Industrial Average ETF lost -2.4% last week, as the blue chip index managed to continue to be a fan favorite among market participants & the “buy & hold” remained alive and well to a degree.
DIA ETF – SPDR Dow Jones Industrial Average ETF’s Techincal Performance Over The Past Year
Their RSI is trending back down towards the neutral 50-level, sitting currently at 51.65, while their MACD is primed to cross over bearishly on Tuesday or Wednesday of this week.
Volumes were -9.06% lower than the previous year’s average though (2,894,000 vs. 3,182,400), showing that the “Buy & Hold” crowd is beginning to reassess their holdings & may be taking some profits down from the table.
Monday the week opened on a strong note for DIA, as it bravely walked up to the top of the diving board, ready to descend into the week.
Tuesday formed a bearish harami pattern with Monday’s candle and the day’s low signaled that the <$425/share level was on the menu in the coming days.
Wednesday the legs gave out for DIA, opening with a gap down that was able to below through the support of the 10 & 200 day moving averages & close -1.93% on the day on the highest volume of the week.
Thursday confirmed what the majority said with their sell buttons the previous day, when DIA was unable to break above the 200 DMA’s resistance & wound up resulting in a spinning top, indicating that there was a bit of indecision in the market, but that it should not be mistaken for optimism.
Friday showed another gap down open, but was able to rally higher & close at $416.33/share heading into the weekend.
For DIA this week, the upside will require a breakthrough of the 10 & 200 day moving averages, which may prove difficult given that both reside in Seller dominated price levels.
In the event of consolidation while awaiting positive or negative news to dictate market direction, DIA is primed to oscillate between the 10/200 & 50 day moving averages while it closes the window that it created back earlier in May.
To the downside, in the event that the 50 DMA’s support breaks down, there is looking to be a bit of trouble for DIA, as that would leave only 5 support levels on their past year chart (one of which will be knocked off of it on next Monday’s session).
DIA has support at the $412.91 (Volume Sentiment: Sellers, 2.43:1), $409.97 (50 Day Moving Average, Volume Sentiment: Buyers, 5.5:1), $407.28 (Volume Sentiment: Buyers, 3.17:1) & $405.96/share (Volume Sentiment: Buyers, 3.17:1) price levels, with resistance at the $ 416.41(Volume Sentiment: Buyers, 1.7:1), $419.60 (Volume Sentiment: Buyers, 1.7:1), $421.12 (200 Day Moving Average, Volume Sentiment: Sellers, 1.5:1) & $422.39/share (10 Day Moving Average, Volume Sentiment: Sellers, 1.5:1).
DIA ETF’s Price Level:Volume Seniment Over The Past ~4-5 Years
The Week Ahead
Monday has no economic news or earnings reports as it is Memorial Day.
Fed President Kashkari speaks in Tokyo at 4 am on Tuesday, before Durable-Goods Orders & Du rable-Goods minus Transportation data at 8:30 am, S&P CoreLogic Case Shiller Home Price Index (20 cities) data at 9 am, Consumer Confidence data at 10 am & FEd President Williams speaking at 8 pm.
AutoZone, Bank of Nova Scotia & Skyline Champion all report earnings before Tuesday’s opening bell, followed by Box, Okta, Semtech & Sociedad Quimica y Minera after the session’s close.
Wednesday begins with Fed President Kashkari speaking at 4 am again, followed by May’s FOMC Minutes at 2 pm.
Abercrombie & Fitch, Bank of Montreal, Capri Holdings, Columbus McKinnon, Dick’s Sporting Goods, Kingsoft Cloud, Macy’s, Monro Muffler, Photronics & Phressia all report earnings before Wednesday’s session’s opening bell, before NVDIA, SalesForce, Agilent Technologies, C3.ai, e.l.f. Beauty, HP Inc., nCino, Nordson, Nutanix, Pure Storage, SentinelOne, Synopsys & Veeva Systems are due to report after the closing bell.
Initial Jobless Claims, GDP (First Revision) & Fed President Barkin speak at 8:30 am on Thursday, before Pending Home Sales at 10 am, Fed President Goolsbee speaking at 10:40 pm, Fed President Kugler Speaking at 2pm, Fed President Daly speaking at 4pm & Fed President Logan speaking at 8:25 pm.
Thursday morning’s earnings reports include American Woodmark, ATS Corp., Bath & Body Works, Best Buy, Burlington Stores, Caleres, CIBC, Foot Locker, Hamilton Lane, Hormel Foods, Kohl’s, Li Auto, Roivant Sciences, Royal Bank of Canada & SpartanNash, before Costco Wholesale, Ambarella, American Eagle, Cooper, Dell Technologies, Elastic, Gap, Marvell Technology, NetApp, PagerDuty, UiPath, Ulta Beauty & Zscaler all report following the closing bell.
Friday morning is a busy one, with Personal Income, Consumer Spending, PCE Index, PCE Year-over-Year, Core PCE Index, Core PCE YEar-over-Year, Advanced U.S. Trade Balance in Goods, Advanced Retail Inventories & Advanced Wholesale Inventories data at 8:30 am, followed by Chicago Business Barometer (PMI) data at 9:45 am, Consumer Sentiment (final) data at 10 am & Fed President Daly speaking at 4:45pm.
Shoe Carnival reports earnings after Friday afternoon’s closing bell.
See you back here next week!
*** I DO NOT OWN SHARES OR OPTIONS CONTRACT POSITIONS IN SPY, QQQ, IWM OR DIA AT THE TIME OF PUBLISHINGTHIS ARTICLE ***
Since our last Volume Sentiment Analysis at the beginning of April the major four indexes have advanced, but there has still been plenty of volatility & a good amount of gap activity.
Last night the VIX closed at 18.09, indicating an implied one day move of +/-1.14% & an implied one month move of +/-5.23% for the S&P 500.
Volumes have been more elevated than they had been for much of the past year, however as we’ve noted many times over the past year, volumes Y-o-Y between 2025-2024 are still below the prior year’s average levels from 2023 & earlier.
While some may take this as a sign of confidence, given the market’s actual price movements it appears more like uncertainty & profit grabbing than any actual change in long-term sentiment.
With that said, there is still a lot of uncertainty in the air regarding tariffs & foreign relations, as well as with the future state of corporate earnings, which makes it an important time to have an understanding of how market participants have behaved historically at different price levels as we begin to see re-tests.
This is especially true in the wake of this week’s performance, where stretched out MACDs have begun to show weakness & that there is likely a breather on the horizon for markets, which will make the strength/weakness of support/resistance levels even more important.
This can be valuable when assessing risk in the event of retests of any of these levels.
Each section below contains a view of each index ETF’s chart (for a technical breakdown of each ETF’s chart please see this past weekend’s market review note), as well as a list of their current one year support & resistance levels with the volume sentiment noted beneath it on the table.
There is an additional table beneath this table with each price level’s sentiment, as well as a typed text version below that is able to be copied & pasted.
Note that “NULL, 0:0*” values denote areas that each name has traded at but with limited volume data to work with from a comparison standpoint in terms of creating a ratio of buyers:sellers (or vice versa) or is the outlier above the highest/lowest level with price data.
Also, prices that do have a ratio of Buyers:Sellers (Sellers:Buyers) where the denominator is 0 are denoted with an asterisk “*” as well.
In the written lists of the price levels & volume sentiments the price levels that contain support & resistance levels are marked in BOLD.
Recall that at price extremes such as the highs that we have recently hit there will tend to be skewed data due to the small sample size & factor that into how you interpret each price level’s reported sentiment.
This is intended to serve as an additional tool, similar to a barometer to use during your due diligence process & is not meant to replace doing your own research & is not financial advice.
Price Level:Volume Sentiment Analysis For SPY, The SPDR S&P 500 ETF
SPY ETF – SPDR S&P 500 ETF’s Technical Performance Over The Past Year
SPY, the SPDR S&P 500 ETF has shaken off the declines of late March, but based on the number & size of gaps & the proximity of SPY’s long & short-term trend lines to one another & price, we may see some profit taking on the near-term horizon.
While SPY’s recent gains have placed it back within 5 resistance levels of its all-time high, its oscillators above are signaling there is likely to be a cool-down period soon.
This will be interesting, as five of the next 6 support levels are historically Seller zones, and the window left open by last Monday’s gap up is primed to close, which will also involve a re-test of the long-term moving average.
For a deeper dive into the near-term horizon for SPY see the market review in the link in the section above.
SPY ETF’s Price Level:Volume Sentiment Over The Past ~3 Years At Their One Year Support/Resistance Levels
SPY ETF’s Price Level:Volume Sentiment Over The Past ~3 Years
Price Level:Volume Sentiment Over The Past ~3 Years For SPY ETF
Price Level:Volume Sentiment Over The Past ~3 Years For SPY ETF
SPY ETF’s Price Level:Volume Sentiment Over The Past ~3 Years
$610 – Buyers – 0.2:0*, +2.89% From Current Price Level
$615 – NULL – 0:0*, +3.74% From Current Price Level
$605 – Buyers – 1.43:1, +2.05% From Current Price Level
$600 – Buyers – 1.46:1, +1.21% From Current Price Level
$595 – Sellers – 1.41, +0.36% From Current Price Level
$590 – Buyers – 4.08:1, -0.48% From Current Price Level – Current Price Level*
$585 – Buyers – 1.82:1, -1.32% From Current Price Level
$580 – Sellers – 2.16:1, -2.17% From Current Price Level – 10 Day Moving Average*
$575 – Sellers – 1.28:1, -3.01% From Current Price Level
$570 – Buyers – 1.77:1, -3.85% From Current Price Level – 200 Day Moving Average*
$565 – Buyers – 1.77:1, -4.7% From Current Price Level
$560 – Buyers – 1.22:1, -5.54% From Current Price Level
$555 – Buyers – 2.08:1, -6.38% From Current Price Level
$550 – Buyers – 1.54:1, -7.23% From Current Price Level – 50 Day Moving Average*
$545 – Buyers – 2.57:1, -8.07% From Current Price Level
$540 – Buyers – 2.08:1, -8.91% From Current Price Level
$535 – Sellers – 1.34:1, -9.76% From Current Price Level
$530 – Buyers – 4.25:1, -10.6% From Current Price Level
$525 – Buyers – 1.63:1, -11.44% From Current Price Level
$520 – Buyers – 1.71:1, -12.29% From Current Price Level
$515 – Sellers – 1.09:1, -13.13% From Current Price Level
$510 – Buyers – 1.25:1, -13.97% From Current Price Level
$505 – Sellers – 1.96:1, -14.82% From Current Price Level
$500 – Sellers – 1.59:1, -15.66% From Current Price Level
$496 – Sellers – 1.96:1, -16.34% From Current Price Level
$492 – Sellers – 1.75:1, -17.01% From Current Price Level
$488 – Buyers – 1.11:1, -17.69% From Current Price Level
$484 – Sellers – 1.15:1, -18.36% From Current Price Level
$480 – Buyers – 4.75:1, -19.04% From Current Price Level
$476 – Buyers – 1.83:1, -19.71% From Current Price Level
$472 – Buyers, 1.6:1, -20.38% From Current Price Level
$468 – Buyers – 5.67:1, -21.06% From Current Price Level
$464 – Sellers – 1.23:1, -21.73% From Current Price Level
$460 – Sellers – 1.12:1, -22.41% From Current Price Level
$456 – Sellers – 0.8:0*, -23.08% From Current Price Level
$452 – Buyers – 1.1:0*, -23.76% From Current Price Level
$448 – Buyers – 2:0*, -24.43% From Current Price Level
$444 – Buyers – 1.51:1, -25.11% From Current Price Level
$440 – Buyers – 4.31:1, -25.78% From Current Price Level
$436 – Sellers – 1.05:1, -26.46% From Current Price Level
$432 – Sellers -1.04:1, -27.13% From Current Price Level
$428 – Buyers – 1.13:1, -27.81% From Current Price Level
$424 – Buyers – 1.61:1, -28.48% From Current Price Level
$420 – Sellers – 1.09:1, -29.16% From Current Price Level
$416 – Even – 1:1, -29.83% From Current Price Level
$412 -Sellers – 2.71:1, -30.51% From Current Price Level
$408 – Buyers – 3.54:1, -31.18% From Current Price Level
$404 – Sellers – 1.06:1, -31.85% From Current Price Level
$400 – Buyers – 1.71:1, -32.53% From Current Price Level
$396 – Sellers – 1.52:1, -33.2% From Current Price Level
$392 – Sellers – 1.29:1, -33.88% From Current Price Level
$388 – Buyers – 2.95:1, -34.55% From Current Price Level
$384 – Buyers – 1.55:1, -35.23% From Current Price Level
$380 – Buyers – 1.24:1, -35.9% From Current Price Level
$376 – Sellers – 2.32:1, -36.58% From Current Price Level
$372 – Sellers – 2.17:1, -37.25% From Current Price Level
$368 – Sellers – 1.73:1, -37.93% From Current Price Level
$364 – Sellers – 1.5:1, -38.6% From Current Price Level
$360 – Sellers – 2.25:1, -39.28% From Current Price Level
$356 – Buyers – 3:1, -39.95% From Current Price Level
$352 – Buyers – 1.22:1, -40.63% From Current Price Level
$348 – Sellers – 3.4:0*, -41.3% From Current Price Level
$344 – Sellers – 4.3:0*, -41.98% From Current Price Level
$340 – NULL – 0:0*, -42.65% From Current Price Level
Price Level:Volume Sentiment Analysis For QQQ, The Invesco QQQ Trust ETF
QQQ ETF – Invesco QQQ Trust ETF’s Technical Performance Over The Past Year
QQQ, the Invesco QQQ Trust ETF has had a similar past month & a half to SPY, as the two indexes have moved together for the past few years for the most part.
Their volume trends have also had some similarities, with neither at the moment appearing to be ready for a convincing lift-off that has sustainable support.
With that said, the data below when combined with the near-term outlook in this week’s market review note in the link in section one can be beneficial to identify where QQQ & its component stocks wind up heading next.
QQQ ETF’s Price Level:Volume Sentiment Over The Past ~1 Year At Their One Year Support/Resistance Levels
Price Level:Volume Sentiment For QQQ ETF Over The Past ~1 Year
QQQ ETF’s Price Level:Volume Sentiment Over The Past ~1 Year
$545 – NULL – 0:0*, +4.75% From Current Price Level
$540 – NULL – 0:0*, +3.79% From Current Price Level
$535 – Buyer s- 6.67:1, +2.83% From Current Price Level
$530 – Buyers – 3.33:1, +1.87% From Current Price Level
$525 – Buyers – 1.69:1, +0.91% From Current Price Level
$520 – Buyers – 1.47:1, -0.05% From Current Price Level – Current Price Level*
$515 – Buyers – 1.44:1, -1.01% From Current Price Level
$510 – Sellers – 2.75:1, -1.97% From Current Price Level
$505 – Buyers – 1.25:1, -2.94% From Current Price Level – 10 Day Moving Average*
$500 – Buyers – 1.68:1, -3.9% From Current Price Level
$496 – Sellers – 1.4:1, -4.66% From Current Price Level
$492 – Buyers – 2.68:1, -5.43% From Current Price Level – 200 Day Moving Average*
$488 – Buyers – 2.82:1, -6.2% From Current Price Level
$484 – Buyers – 1.21:1, -6.97% From Current Price Level
$480 – Buyers – 2.76:1, -7.74% From Current Price Level
$476 – Sellers – 1.06:1, -8.51% From Current Price Level
$472 – Buyers- 1.04:1, -9.28% From Current Price Level – 50 Day Moving Average*
$468 – Sellers – 2.33:1, – 10.05% From Current Price Level
$464 – Buyers – 5.38:1, -10.82% From Current Price Level
$460 – Buyers – 1.78:1, -11.58% From Current Price Level
$456 – Sellers – 1.11:1, -12.35% From Current Price Level
$452 – Buyers – 2.33:1, -13.12% From Current Price Level
$448 – Sellers – 1.31:1, -13.89% From Current Price Level
$444 – Sellers – 3.47:1, -14.66% From Current Price Level
$440 – Buyers – 3.23:1, -15.43% From Current Price Level
$436 – Buyers – 3.44:1, -16.2% From Current Price Level
$432 – Sellers – 2.13:1, -16.97% From Current Price Level
$428 – Even – 1:1, -17.74% From Current Price Level
$424 – Buyers – 0.7:0*, -18.5% From Current Price Level
$420 – Sellers – 1.46:1, -19.27% From Current Price Level
$416 – Sellers – 2.56:1, -20.04% From Current Price Level
$412 – Sellers – 1.3:0*, -20.81% From Current Price Level
$408 – NULL – 0:0*, -21.58% From Current Price Level
Price Level:Volume Sentiment Analysis For IWM, The iShares Russell 2000 ETF
IWM ETF – iShares Russell 2000 ETF’s Technical Performance Over The Past Year
IWM, the iShares Russell 2000 ETF has also recovered a bit from the declines of late-March, but at a more muted pace that SPY or QQQ.
They’re still closer to the bottom of their one year chart & are still lagging their 200 day moving average (long-term trend line), with less support levels on the one year chart than resistance levels.
The small cap index has moved in a similar, but less resilient manner to DIA, but given that the blue chip index is more likely to be bought & held than the small cap index it would be wise to monitor them both independently of one another.
Combining the data below with the past week’s near-to-mid-term horizon for IWM is beneficial for gaining insight into how market participants may behave in the coming weeks-to-months.
IWM ETF’s Price Level:Volume Sentiment Over The Past ~2-3 Years At Their One Year Support/Resistance Levels
IWM ETF’s Price Level:Volume Sentiment Over The Past ~2-3 Years
Price Level:Volume Sentiment For IWM ETF Over The Past ~2-3 Years
$244 – NULL – 0:0*, +16.7% From Current Price Level
$240 – Buyers – 5:1, +14.79% From Current Price Level
$236 – Buyers – 1.23:1, +12.88% From Current Price Level
$232 – Buyers – 1.46:1, +10.96% From Current Price Level
$228 – Buyers – 1.14:1, +9.05% From Current Price Level
$224 – Sellers – 1.16:1, +7.14% From Current Price Level
$220 – Buyers – 1.44:1, +5.22% From Current Price Level
$216 – Buyers – 1.26:1, +3.31% From Current Price Level
$212 – Sellers – 1.33:1, +1.4% From Current Price Level – 200 Day Moving Average*
$208 – Buyers – 1.52:1, -0.52% From Current Price Level – Current Price Level*
$204 – Buyers – 1.16:1, -2.43% From Current Price Level – 10 Day Moving Average*
$200 – Buyers – 1.23:1, -4.34% From Current Price Level
$198 – Sellers – 1.25:1, -5.3% From Current Price Level
$196 – Buyers – 2.17:1, -6.26% From Current Price Level – 50 Day Moving Average*
$194 – Buyers – 1.77:1, -7.21% From Current Price Level
$192 – Buyers – 1.15:1, -8.17% From Current Price Level
$190 – Sellers – 3.77:1, -9.13% From Current Price Level
$188 – Buyers – 1.4:1, -10.08% From Current Price Level
$186 – Buyers – 2.13:1, -11.04% From Current Price Level
$184 – Buyers – 2.33:1, -12% From Current Price Level
$182 – Buyers – 2.18:1, -12.95% From Current Price Level
$180 – Sellers – 1.94:1, -13.91% From Current Price Level
$178 – Sellers – 2.79:1, -14.87% From Current Price Level
$176 – Buyers – 1.73:1, -15.82% From Current Price Level
$174 – Buyers – 1.81:1, -16.78% From Current Price Level
$172 – Sellers – 1.12:1, -17.73% From Current Price Level
$170 – Buyers – 1.92:1, -18.69% From Current Price Level
$168 – Sellers – 1.94:1, -19.65% From Current Price Level
$166 – Sellers – 2.1:1, -20.6% From Current Price Level
$164 – Sellers – 1.1:0*, -21.56% From Current Price Level
$162 – Even – 1:1, -22.52% From Current Price Level
$160 – Buyers – 1.56:1, -23.47% From Current Price Level
$158 – NULL – 0:0*, -24.43% From Current Price Level
Price Level:Volume Sentiment Analysis For DIA, The SPDR Dow Jones Industrial Average ETF
DIA ETF – SPDR Dow Jones Industrial Average ETF’s Technical Performance Over The Past Year
Volumes though show a more cautious buy & hold approach happening to the blue chip index vs. the other three majors, but any downside catalyst can at this point in time cause that to break down.
With a lot of uncertainty on the horizon, knowing how market participants have behaved in the past is beneficial for understanding how DIA may behave in the future.
DIA ETF’s Price Level:Volume Sentiment Over The Past ~4 Years At Their One Year Support/Resistance Levels
DIA ETF’s Price Level:Volume Sentiment Over The Past ~4 Years
Price Level:Volume Sentiment For DIA ETF Over The Past ~4 Years
DIA ETF’s Price Level:Volume Sentiment Over The Past ~4 Years
$452 – NULL – 0:0*, +5.86% From Current Price Level
$448 – NULL – 0:0*, +4.93% From Current Price Level
$444 – Buyers – 2.67:1, +3.99% From Current Price Level
$440 – Sellers – 1.06:1, +3.05% From Current Price Level
$436 – Buyers – 6.67:1, +2.11% From Current Price Level
$432 – Buyers – 1.5:1, +1.18% From Current Price Level
$428 – Buyers – 1.15:1, +0.24% From Current Price Level
$424 – Buyers – 1.83:1, -0.7% From Current Price Level – Current Price Level*
$420 – Sellers – 1.5:1, -1.63% From Current Price Level – 10 & 200 Day Moving Averages*
$416 – Buyers – 1.7:1, -2.57% From Current Price Level
$412 – Sellers – 4.42:1, -3.51% From Current Price Level
$408 – Buyers – 5.5:1, -4.44% From Current Price Level – 50 Day Moving Average*
$404 – Buyers – 3.17:1, -5.38% From Current Price Level
$400 – Buyers – 1.62:1, -6.32% From Current Price Level
$396 – Sellers – 2.17:1, -7.25% From Current Price Level
$392 – Buyers – 2:1, -8.19% From Current Price Level
$388 – Buyers – 3:1, -9.13% From Current Price Level
$384 – Sellers – 1.44:1, -10.06% From Current Price Level
$380 – Even – 1:1, -11% From Current Price Level
$376 – Sellers – 1.27:1, -11.94% From Current Price Level
$372 – Buyers – 1.38:1, -12.87% From Current Price Level
$368 – Buyers – 1.75:1, -13.81% From Current Price Level
$364 – Buyers – 1.58:1, -14.75% From Current Price Level
$360 – Even – 1:1, -15.68% From Current Price Level
$356 – Buyers – 0.2:0*, -16.62% From Current Price Level
$352 – Buyers – 1.09:1, -17.56% From Current Price Level
$348 – Buyers – 0.3:0*, -18.5% From Current Price Level
$344 – Buyers – 7:1, -19.43% From Current Price Level
$340 – Buyers – 1.08:1, -20.37% From Current Price Level
$336 – Buyers – 1.79:1, -21.31% From Current Price Level
$332 – Buyers – 1.84:1, -22.24% From Current Price Level
$328 – BUyers – 2.18:1, -23.18% From Current Price Level
$324 – Sellers – 1.06:1, -24.12% From Current Price Level
$320 – Buyers – 1.34:1, -25.99% From Current Price Level
$316 – Sellers – 1.5:1, -25.99% From Current Price Level
$312 – Sellers – 1.03:1, -26.93% From Current Price Level
$308 – Sellers – 1.12:1, -27.86% From Current Price Level
$304 – Sellers – 2.63:1, -28.8% From Current Price Level
$300 – Buyers – 1.24:1, -29.74% From Current Price Level
$296 – Sellers – 1.56:1, -30.67% From Current Price Level
$292 – Sellers – 3.14:1, -31.62% From Current Price Level
$288 – Sellers – 1.3:1, -32.55% From Current Price Level
$284 – Sellers – 1.14:1, -33.48% From Current Price Level
$280 – Sellers – 1.57:1, -34.42% From Current Price Level
$276 – Sellers – 6.67:1, -35.36% From Current Price Level
$272 – NULL – 0:0*, -36.3% From Current Price Level
*** I DO NOT OWN SHARES OR OPTIONS CONTRACT POSITIONS IN SPY, QQQ, IWM OR DIA AT THE TIME OF PUBLISHING THIS ARTICLE ***
SPY, the SPDR S&P 500 ETF gained +5.33% last week, while the VIX closed at 17.24, indicating an implied one day move of +/-1.09% & an implied one month move of +/-4.98% for the S&P 500.
SPY ETF – SPDR S&P 500 ETF’s Technical Performance Over The Past Year
Their RSI is just beneath the overbought level & currently sits at 69.34, while their MACD is bullish, but looking overextended following Monday’s gap up session.
Volumes were +24.32% above the prior year’s average level (69,454,000 vs. 55,866,349), which while it sounds like a lot, is still below the levels seen in the years prior, which doesn’t mean we’re out of the woods just yet.
Monday opened the week up on a gap up open that enabled the week to begin above the support of both the 10 & 200 day moving averages.
Monday’s session was also the highest volume of the week & it set the stage for the increased volume mentioned above, but as noted over prior months in our weekly review notes, there will need to be continued elevated levels of volume before this looks like a sustainable uptrend.
This holds especially true given how far market participants were willing to trade SPY during Monday’s session, as noted by the lower shadow that dropped ~1% from the day’s opening price into the window it created.
Tuesday opened on another gap up, this time on weaker volume for the day, and while SPY proceeded to march higher, the upper shadow on the day’s session indicates that there was a bit of profit taking during the session & market participants were not fully at ease with the current price level of SPY.
Wednesday confirmed this, where another gap up open on un-noteworthy volume resulted in a doji candle, indicating that there was a bit of discomfort & indecisiveness in the market, but that participants found temporary equilibrium at the $587.59-.81 range (closing-opening prices, day ended slightly down).
Thursday is really the most important session of the week, as it had the second highest volume & formed a bearish engulfing pattern with Wednesday’s session, while covering a daily range of >1% with little upper/lower shadows.
While the result of the day as an advancing session is certainly bullish & the high volumes confirm it, but they also tell another story, one about profit taking, which if that narrative flakes out & less people are willing to continue to accept risk at this level -2.81% below SPY’s all time high, we will see gains of the week slip away.
Friday the week wound down on a note that did not inspire confidence heading into the weekend, as on the week’s lowest volume SPY opened on a gap up, retraced down into Thursday’s price range, before powering higher to close near the top of the session’s range.
Looking ahead into this upcoming week there are a few focal points to keep in mind.
Firstly, to the upside, SPY has managed to climb over the past week, and is now back within -2.81% from the all-time high price level, but while volume has been better, when compared to previous years’ volume levels (roughly one year ago was much lower, as the volume trend was in serious decline after years of higher levels).
Unless we see increased, sustainable volume levels it will take longer & some more volatility before a base is formed that can be built upon.
Particularly as while the long-term trend line was broken & the 10 day moving average crossed bullishly through it, they now have become important support levels that will more than likely be retested when the gap fills.
While the resistance levels that remain from here for SPY are all Buyer dominated over the past year, it is wise to recall that they are currently including SPY’s most recent 52-week highs, which skewes the data.
Re-tests are likely to dilute the Buyer dominated ratios shown in the table below, which would lead to consolidation or declining outcomes.
The consolidation case revolves on a retest of the $577.04 price level, which would most likely lead to further declines to attempt to close Monday’s window & test the support of the long-term & short-term moving averages (we’ll get into next) & or it will likely involve oscillations around the 10 & 200 day moving averages until we get an upside or downside catalyst.
This week we’ll get some insight into the state of consumers based on earning’s reports from the likes of Home Depot & Target, as well as BJ’s Wholesale & Advanced Auto Parts.
There will also be PMI data coming out along with a slew of Fed speakers to lend insight into the health of the economy.
To the downside, if the $588.72/share level breaks down, we see the $577.04 retest mentioned above, which should that break down we discover whether market participants believe the long-term trend is stronger than SPY’s current price or not.
There is quite a bit of Seller pressure historically to help get SPY into that window created on Monday & once it’s in there it will have to retest both the long & short term trend lines, which will give a real look into how market participants are viewing the state of current & future economic news.
In the event of further declines, using the table below at support levels or specific price levels you’re targeting is worthwile to understand the market sentiment of each price level SPY traded at over the past ~3 years.
SPY has support at the $588.72 (Volume Sentiment: Buyers, 2.15:1), $582.40 (Volume Sentiment: Sellers, 2.12:1), $579.17 (Volume Sentiment: Sellers, 1.33:1) & $576.41/share (Volume Sentiment: Sellers, 1.33:1) price levels, with resistance at the $600.67 (Volume Sentiment: Buyers, 1.38:1), $605.21 (Volume Sentiment: Buyers, 1.5:1), $608.95 (Volume Sentiment: Buyers, 1.5:1) & $611.39/share (All-Time High, Volume Sentiment: Buyers, 0.2:0*) price levels.
SPY ETF’s Price Level:Volume Sentiment Over The Past ~3 Years
QQQ, the Invesco QQQ Trust ETF had the best week of the four majors, advancing +6.88%, mostly due in large part to Monday’s gap up.
QQQ ETF – Invesco QQQ Trust ETF’s Technical Performance Over The Past Year
Their RSI is in overbought territory following the massive gap up on Monday and sits currently at 71.69, while their MACD is bullish still, but beginning to look overextended.
Volumes were +30.63% above the previous year’s average (48,262,000 vs. 36,945,556), which much like SPY brings reasons for caution heading into a new week.
Monday saw a gap up open above the 200 & 10 day moving averages, which retraced ~1.09% into the window to the $501.48/share level, before rallying to close at $507.85/share.
Tuesday QQQ saw a gap up open on the week’s highest volume, one a session that covered ~1.73% top to bottom, and likely featured a bit of short-term profit taking from eager buyers in the wake of the prior day’s gap up.
Wednesday is where things began to look a little dicey for QQQ, as while volumes dropped day-over-day they weren’t far from Tuesday’s, but the day resulted in a spinning top candle after a gap up, indicating uncertainty & that the bullish sentiment was beginning to wear out.
Thursday’s candle opened lower, but closed higher than Wednesday’s, forming a bullish engulfing pattern, while logging the week’s second highest volume.
While this may be regarded by many to normally be an encouraging sign, the day’s shadows tell a different story.
Firstly, while the $515/share level held up & was not broken through to the downside, the day’s upper shadow signals that there was a bit of profit taking, as prices ran up much higher than they tested to the downside, but the day’s close was only +0.11% day-over-day.
The $515/share level is not a support level, so while sentiment held up there, it is not associated with any trend, and while it should be noted, should not be used in making decisions until other clusters of information emerge.
The high volume therefore is likely more associated with the profit taking shown by the upper shadow, and not the day’s actual advance.
Friday the week ended on another haunting feeling, when a gap up open retraced almost all the way through Thursday’s candle’s real body to the downside, before the day advanced slightly & closed as a hanging man candle.
While that in & of itself is a bearish signal, the fact that it occurred on the week’s second weakest volume is also an indicator that there is still not bullish sentiment abound in the market right now.
Looking into the coming week, QQQ’s upside potential revolves around breaking through the $521.93/share resistance level.
Much like SPY’s resistance levels, QQQ’s are mostly Buyer dominated over the past ~4 years, but there are only 5 resistance levels above Friday’s close, all of which have been prior 52-week highs, so the data is skewed towards Buyers.
This means that we may see the ratios on the table below become more even in the event of a rejected re-test.
Without continued high, advancing volume the upside case is still largely TBD based on how close to the all-time High QQQ is.
The consolidation case is quite similar to SPY’s; $501.48/share is not a support levels, but will be an area to focus on, as if it holds up then the window formed by Monday’s gap up open will be preserved for a while longer, likely waiting to fill until there’s a downside catalyst.
However, give that the 10 & 200 DMA’s are both in near proximity to QQQ’s closing price on Friday, the consolidation case looks awfully similar to SPY’s above, where QQQ’s price oscillates around the long & short-term trend lines waiting for an upside or downside catalyst.
The $493.62/share support levels also looks interesting here, as while there has clearly been a lot of optimism among the Buyers at this price level, given its proximity to the long-term trend line, a breakdown of it will make the 200 DMA appear a bit weaker & make long-term sentiment appear less optimistic.
To the downside, there is a bit of selling pressure in QQQ’s near viscininty, which signals likely weakness for its next two support levels.
However, like the dilution of extreme Buyers near the top, we may see some consolidation in these zones, diluting the Seller pressure levels.
This doesn’t mean that they’re likely to hold up, but should be mentioned as this & the consolidation case do somewhat overlap on it.
If the first four support levels buckle, the 10 day moving average is next at bat, which will give us the market’s view on short-term sentiment.
If it breaks down, expect the 200 DMA’s support to be key in determining whether QQQ can continue to climb higher, or if it’s going to break down & revert back to the long-term trend that we’ve been experiencing since March.
This is especially interesting, as the gap up propelling QQQ higher on the volume levels that it had are not exactly indicative of a major long-term trend change & look a lot like a shorter term squeeze higher.
The table below provides insight into how QQQ may perform when it re-tests it’s near-term support/resistance levels based on the based ~4 years.
QQQ has support at the $513.98 (Volume Sentiment: Sellers, 2.79:1), $510.29 (Volume Sentiment: Sellers, 2.79:1), $507.71 (Volume Sentiment: Buyers, 1.25:1) & $501.26/share (Volume Sentiment: Buyers, 1.65:1) price levels, with resistance at the $521.93 (Volume Sentiment: Buyers, 1.53:1), $530.45 (Volume Sentiment: Buyers, 3.33:1), $533.03 (Volume Sentiment: Buyers, 3.33:1) & $537.48/share (Volume Sentiment: Buyers, 6.67:1) price levels.
QQQ ETF’s Price Level:Volume Sentiment Over The Past ~4 Years
IWM, the iShares Russell 2000 ETF climbed +4.5% last week, as small caps performed better than blue chips, but were the second worst weekly performing index.
IWM ETF – iShares Russell 2000 ETF’s Technical Performance Over The Past Year
Their RSI is advancing towards overbought conditions & sits currently at 65.89, while their MACD is bullish, but beginning to show signs of weakness after the consolidation period of last week.
Volumes were -4.75% lower than the previous year’s average (28,424,000 vs. 29,841,389), which isn’t particularly noteworthy given the performance of IWM throughout the week & how their volumes have held up over the past year vs. the previous year.
Monday was really the only important day for the small-cap index, gap up open, highest volume of the week, but a major issue given that the day closed lower than it opened, and despite at it’s daily low point losing -1.45% from its opening price, it gained +3.82% day-over-day.
While a ~+4% gap up session is always nice, the consolidation range that the rest of the week was spent in wasn’t difficult to see coming by Monday’s close.
Tuesday opened slightly higher, but closed as a doji candle that closed lower than it opened, which confirmed the cautious sentiment Monday gave.
Additionally, there was a bit of profit taking to the upside on IWM, but not enough actual will among market participants for Tuesday to break Monday’s session’s high.
Wednesday is where the weakness became more evident, as the day opened on a gap down, tested slightly higher, before tanking to close near it’s daily low as market participants were eager to pile out of the pool & take their near-term profits.
Thursday didn’t give much extra confidence, as IWM opened lower, tested down to the $205.39/share price level, before managing to come back & close marginally higher than Wednesday’s open on the lowest volume of the week.
Friday managed to open on a gap higher, before testing the low point of $207.78/share & ending the day up +0.83%, but the week’s chart closed showing some exhaustion for the small cap names.
IWM, much like DIA has been performing quite differently than SPY & QQQ over the past couple of years, a trend that still continues.
The upside scenario for IWM really focuses first on $213.49/share, which contains two resistance touch-points & will act as one of two gatekeepers for the 200 Day Moving Average’s resistance.
This is problematic, as both that level & the next resistance levels of $213.53/share (and the 200 Day Moving Average) are all in a historically Seller dominated price zone.
This makes the long-term trend line across the major indexes appear weaker, as there is far less enthusiasm in small cap names, indicating that there is more “fish chasing” than active investment enthusiasm.
Should the 200 DMA break down & we see sustainable volume levels, then there may be the ability to rally a bit higher temporarily (particularly in the event that there is some buying into the short holiday week next week), as it means the resistance zone of $213-214/share broke down & there is Buyer sentiment above.
Consolidation case here looks like a slow window fill from Monday’s gap up with some oscillating around the 10 DMA while awaiting a catalyst to the upside or downside.
To the downside, the next four support levels are all primarily in favor of the Buyers over the past ~2-3 years, but not at particularly strong ratios, which makes the 50 day moving average’s support level key to watch, before IWM likely finds some relief in the support zone before $195.01-197.05.
Assuming that the window closes, the 10 day moving average will likely also not be particularly strong, which would lead to a breakdown that is shown in that scenario.
The table below can aid in assessing the strength & weakness of support/resistance levels that IWM tests/re-tests in the coming week.
IWM has support at the $209.27 (Volume Sentiment: Buyers, 1.48:1), $205.49 (Volume Sentiment: Buyers, 1.13:1), $203.64 (10 Day Moving Average, Volume Sentiment: Buyers, 1.14:1) & $202.46/share (Volume Sentiment: Buyers, 1.14:1) price levels, with resistance at the $213.49 (2 Touch-Points, Volume Sentiment: Sellers, 1.4:1), $213.53 (Volume Sentiment: Sellers, 1.4:1), $215.22 (200 Day Moving Average, Volume Sentiment: Sellers, 1.4:1) & $216.24/share (Volume Sentiment: Buyers, 1.28:1) price levels.
IWM ETF’s Price Level:Volume Sentiment Over The Past ~2-3 Years
DIA, the SPDR Dow Jones Industrial Average ETF added +3.43% last week, faring the worst of the four majors, but volume indicates that market participants are likely holding DIA component names at the moment.
DIA ETF – SPDR Dow Jones Industrial Average ETF’s Technical Performance Over The Past Year
Their RSI is trending higher following Monday’s gap up open and sits currently at 63.65, while their MACD is still bullish & looks heavily extended following the mid-April rally.
Volumes were -7.42% below the prior year’s average (2,938,000 vs. 3,173,413), which is also an area of concern, as the blue chip index had shown more sustainable week-over-week participation than the other major indexes, but now it seems to be more in “buy & hold” mode.
One key area to note is that on Monday the resistance of the 200 day moving average (long-term trend line) was broken through on the gap up open, but that the candle for the day resulted in a hanging man (bearish).
While the support of the 200 DMA held up, the candle’s lower shadow retraced down -0.44% to just above the long-term trend line & moved forward for an advancing session.
This is important to note, as it was on the week’s second lowest volume, indicating a bit of fluff, or uncertainty that continued to move higher.
Tuesday the window began to fill on a gap down open, tested most of the way through Monday’s candle’s real body, but ultimately sunk to decline for the day, while managing to stay above the support of the 200 day moving average.
Wednesday opened higher, but the song remained the same, except the week’s second highest volume session managed to break down the 200 DMA’s support temporarily, while settling for the day just above it.
Thursday was where the real lack of confidence in DIA became evident, as it opened on a gap down & while it was able to break above the resistance of the 200 day moving average & close for an advance that was above the new support level forming a bullish engulfing pattern, Friday’s follow up was unable to confirm the “bullish signals”.
Friday opened on a gap up, briefly tested near the high/close of Thursday to the downside before breaking out above the $425/share level to close at $426.55/share, but the volume expressed extreme skepticism heading into the weekend, which did not align with Thursday’s sentiment.
DIA’s chart looks like a hybrid between SPY/QQQ’s & IWM’s, as it tightly consolidated after the gap up like IWM did, but the blue chip names have the same strong sentiment that is keeping them above the long-term trend line still after gapping above it on Monday’s open.
To the upside this week, the $429.52 resistance level will be an interesting area to watch, as it resides in a price zone that is historically “Even” between the Buyers & Sellers over the past ~4-5 years, meaning that it will be another long-term trend bellwether like the 200 DMA.
This is especially true given that next higher resistance levels is Buyer oriented & the following is still “NULL”, as it is the current all-time high.
Any run at this level will require a severe uptick in advancing volume that holds sustainable for weeks-to-months.
The consolidation case here revolved around DIA oscillating around its 200 day moving average awaiting an upside or downside catalyst.
Given that the blue chip index seems to be in “buy & hold” mode currently, this is likely what we will see, before a massive swing one way or the other (pending earnings reports/news reports, as noted above).
To the downside, there is a chance of oscillation between the 10 & 200 day moving averages while market participants digest news/earnings & assess their risk tolerance among the blue chip names, but should that break down the chart below will become even more important to understand how strong/weak the coming support levels are.
When you factor in the DIA represents the blue chip names that are sold to investors of all size & that their data below is covering the past ~4-5 years it will paint a stronger picture of not just DIA’s future, but the other major indexes listed above.
DIA has support at the $420.38 (200 Day Moving Average, Volume Sentiment: Sellers, 1.15:1), $417.13 (10 Day Moving Average, Volume Sentiment: Buyers, 1.63:1), $416.41 (Volume Sentiment: Buyers, 1.63:1) & $412.91/share (Volume Sentiment: Sellers, 3.75:1) price levels, with resistance at the $427.60 (Volume Sentiment: Buyers, 1.33:1), $429.52 (Volume Sentiment: Even, 1:1), $447.49 (Volume Sentiment: Buyers, 2.3:0*) & $448.27/share (All-Time High, Volume Sentiment: NULL, 0:0*) price levels.
DIA ETF’s Price Level:Volume Sentiment Over The Past ~4-5 Years
The Week Ahead
Monday morning kicks off with Fed President Williams & Fed President Jefferson each giving speeches at 8:45 am, followed by U.S. Leading Economic Indicators at 10 am.
Target Hospitality reports earnings Monday before the session opens, followed by 8×8, Agilysys & Transcat after the closing bell.
Fed President Barkin speaks Tuesday at 9 am, before Fed President Collins speaks at 9:30 am, Fed President Musalem speaks at 1 pm & Fed President Kugler speaks at 5 pm.
Home Depot, Amer Sports, Bilibili, Eagle Materials, GDS Holdings & Viking Holdings all report earnings before Tuesday’s opening bell, followed by James Hardie, Keysight Technologies, Modine Manufacturing, Palo Alto Networks, Toll Brothers, Viasat & ZTO Express after the session’s closing bell.
Wednesday is relatively quiet, with only Fed President Barkin & Fed Governor Bowman taking part in a Fed Listens event at 12:15 pm.
Target, Canada Goose, Dycom, Lowe’s, Medtronic, TJX, V.F. Corp., Weibo & Wix all report earnings Wednesday morning, followed by Snowflake, Domo, Enersys, LiveRamp, Urban Outfitters & Zoom Communications at the session’s closing bell.
Initial Jobless Claims data comes out Thursday morning at 8:30 am, before S&P Flash U.S. Services PMI & S&P Flash U.S. Manufacturing PMI data come out at 9:45 am, Existing Home Sales Data is released at 10 am & Fed President Williams speaks at 2 pm.
Thursday morning’s earnings calls include Advanced Auto Parts, Analog Devices, ATS Corp., BJ’s Wholesale, Lightspeed, Ralph Lauren & Toronto-Dominion Bank, before Autodesk, Copart, Deckers Outdoor, Intuit, Lions Gate Entertainment, Ross Stores, StepStone Group & Workday after the closing bell.
Friday morning the week winds down with Fed President Schmid speaking at 9:35 am, New Home Sales data at 10 am & Fed Governor Cook speaking at 12 pm.
Booz Allen Hamilton & Buckle both report earnings before Friday’s opening bell.
See you back here next week!
*** I DO NOT OWN SHARES OR OPTIONS CONTRACT POSITIONS IN SPY, QQQ, IWM OR DIA AT THE TIME OF PUBLISHING THIS ARTICLE***
SPY, the SPDR S&P 500 ETF gained +2.93% last week, while the VIX closed the week out at 22.68, indicating an implied one day move of +/-1.43% & an implied one month move of +/-6.56%.
SPY ETF – SPDR S&P 500 ETF’s Technical Performance Over The Past Year
Their RSI is trending higher in the wake of last week & sits currently at 59.37, while their MACD is very bullish, but beginning to look a bit overextended, which will be something to keep an eye on heading into this week.
Volumes were +12.4% higher than the prior year’s average level (62,480,000 vs. 55,589,562), which paints an interesting set up to start the new week for a couple of reasons.
Mind you, in previous weeks/months’ notes (minus last week, as there was no note due to a charity event) I’ve mentioned how for there to be any type of uptrend it needs to find sustainable footing & steady advancing volume that is heavier than we’ve seen.
Last week’s volume was indeed higher, but but when we break down the day-over-day price action things aren’t quite spelling “liftoff” just yet.
Starting with Monday, SPY opened on a gap up with low volume that resulted in a high wave doji candle, covering a wide range of prices during the session, but indicating indecision/a point of “equilibrium” based on the opening/closing prices.
SPY was favoring the downside more than the upside based on the size of the day’s lower shadow, which dipped down as low as $545.02/share, indicating that there was still an appetite that low, despite the day opening on a gap up from Friday’s session.
Tuesday also flashed warning signals, as on yet another low volume session the day opened on a gap lower, but that managed to power higher & form a bullish engulfing candle for the day.
Granted, the preceding day was a doji & the volumes were low, but the day covered a wide range of prices making the bullish engulfing pattern inevitable, and the low volume on a wide-range day is not exactly something that screams “confidence” or “excitement” among market participants.
Wednesday also signaled caution, where another daily bullish engulfing candle pattern occurred on the week’s highest volume session, but again there was a twist.
The session opened on a gap down, before it declined down to the $541.52/share price level, which happened to be just above the support of the 10 day moving average.
Prices then climbed higher to flirt with just below the 50 day moving average’s resistance, and only managed to close just above Tuesday’s closing price.
This is where things get interesting, as there was clearly short-term/intra-day profit taking going on based on the volume, and this session covered the widest range of prices of the entire week.
While a high volume bullish engulfing day tends to be a good sign, the rest of the week casts shadows of doubt upon it.
Thursday opened on a gap up that opened above the 50 DMA’s resistance, went higher to $564.07, but ultimately profits were taken & the price was drive to close lower than the open, but still above the 50 DMA’s support.
While this occurred on the second highest volume of the week, the lower close than opening price & shooting star appearance of the day’s candle cast doubt onto how sustainable the move was.
Friday also added an interesting layer of complexity, as the day opened on a gap higher, but was unable to reach the resistance of the 200 day moving average, indicating that the long-term trend is still in tact.
The day closed on the third highest volume of the week as a spinning top candle, indicating that there’s a lot of indecision in the market.
With that, heading into this week there are a few interesting catalysts to watch, including a notable number of earnings reports due out & the FOMC decision/Powell Press Conference Wednesday.
Tuesday’s trade balance data may also be interesting given how much attention has been being paid to the tariff situation recently, but of the three listed events I’d guess earnings will be the most likely catalyst for market movement in any direction.
Looking into next week’s SPY performance, the big story is the long-term trend line & how sturdy it is.
Currently the 200 day moving average is the next resistance level, and it resides in a Buyer dominated zone (1.54:1), along with the next highest resistance level ($573.62).
The most likely way that the long-term trend is broken to the upside will be temporarily & because of a gap up that opens above the 200 DMA’s resistance.
There are a couple of windows to be closed from last week, which will bring the 50 day moving average’s support into question; but unless we get squeezed higher & rally it seems the most likely upside case is oscillation around SPY’s 200 DMA while awaiting a larger upside or downside catalyst.
There’s quite a bit of uncertainty out there still, as mentioned above, and even in the event of a little bit of positive momentum developing, the $575-548.99/share price zones are Seller dominated, which are another reason that there will need to be significant increases in advancing volume for an uptrend to take place & prevail.
The $576.41/share is the upside point of interest if the long-term trend line is broken out above, as the way that market participants greet that resistance level will lend clues into the higher, but also Seller dominated near-term resistance points in an attempt at an uptrend.
Consolidation from where we sit now looks like filling in of the gaps that were just created on Thursday & Friday, before some type of oscillation around the 50 DMA & 200 DMA to the upside while awaiting a similar catalyst, but this will also be dependent on how price moves due to the changes of the 10 day moving average.
To the downside there will also need to be extra attention paid to the large window created on 4/23/2025, as when that fills in the $508.46, $505.48 & $481.80 marks will all become focal points in terms of range on a one year chart.
The table below lends insight into how market participants may behave at all of the retests listed above based on their behavior over the past ~3 years.
SPY has support at the $564.29 (Volume Sentiment: Sellers, 1.46:1), $559.86 (Volume Sentiment: Buyers, 1.46:1), $558.91 (Volume Sentiment: Buyers, 1.46:1) & $556.01/share (50 Day Moving Average, Volume Sentiment: Buyers, 1.46:1) price levels, with resistance at the $570.13 (200 Day Moving Average, Volume Sentiment: Buyers, 1.54:1), $573.62 (Volume Sentiment: Buyers, 1.54:1), $576.41 (Volume Sentiment: Sellers, 1.33:1) & $579.17/share (Volume Sentiment: Sellers, 1.33:1) price levels.
SPY ETF’s Price Level:Volume Sentiment Over The Past ~3 Years
QQQ ETF – Invesco QQQ Trust ETF’s Technical Performance Over The Past Year
Their RSI is trending higher & is currently at 60.78, while their MACD is bullish, but beginning to show signs of possible over extension following the two gaps at the end of last week.
Volumes were +5.79% higher than the prior year’s average level (38,702,000 vs. 36,584,821), which like SPY, is not sufficient to claim a sustainable uptrend & last week’s performance leaves many questions about the near-term future for QQQ.
QQQ’s week began on a slow note as well, as a low volume session resulted in a high-wave doji, which while the body resided near the top, did not leave market participants with a strong sense of optimism.
The muted optimism based on the low participation was not a great sign, confirmed by Tuesday opening on a gap down lower.
On even lower volume QQQ was able to power higher despite the soft opening, forming a bullish engulfing pattern with Monday’s candle; however it was not convincing.
Wednesday also signaled frailty for QQQ, as the session opened on a gap lower that was near the low end of Monday’s range, broke down below the $465/share level to reach an intraday low of $462.43, before the week’s strongest volume power it higher to temporarily break above the resistance of the 50 day moving average.
QQQ closed just below the 50 DMA, indicating that the medium-term trend line was still serving as a ceiling & dimming the optimism on true market sentiment.
Thursday opened on a gap up, well above the 50 DMA, broke above the $485/share level intraday, before crumbling to close below its opening price level of the day, forming a shooting star candle & signaling that there was still blood in the water.
Friday the week ended on a note confirming this, as despite a gap up open & brief breakout above the 200 day moving average, QQQ sunk lower to close beneath it & as a spinning top candle, indicating indecision among market participants.
Heading into this week the long-term trend line is going to be in focus, as it managed to close the week as a resistance level.
Should QQQ break out above it the $493.62/share level is the next area of interest, as the $496-499.99/share price zone is a Seller dominated one over the past ~2-3 years, which will pose an issue for QQQ as it tries to climb higher.
Again, as has been noted extensively over the past couple of months, this will require an influx in sustainable advancing volume to actually be meaningful & last.
More likely is that we see a consolidation as the windows caused by the end of week gaps close & prices oscillate between the 50 & 200 day moving averages while we await an upside or downside catalyst.
In terms of declines, should the 50 DMA’s support break down during those window closings, all eyes should direct towards the $445/share price level, as that is the low end of the window from mid-April, with next priority going to $427.93, $421.55 & $402.39/share.
In the meantime, the table below is valuable for assessing the strength & weakness of QQQ’s support/resistance levels when they come back for retests in the near-term based on the past ~2-3 years.
QQQ has support at the $483.36 (Volume Sentiment: Buyers, 2.3:1), $473.91 (50 Day Moving Average, Volume Sentiment: Sellers, 1.19:1), $473.41 (Volume Sentiment: Sellers, 1.19:1) & $466.60/share (10 Day Moving Average, Volume Sentiment: Buyers, 2:1) price levels, with resistance at the $489.81 (200 Day Moving Average, Volume Sentiment: Buyers, 2.16:1), $492.96 (Volume Sentiment: Buyers, 2.61:1), $493.62 (Volume Sentiment: Buyers, 2.61:1) & $498.96/share (Volume Sentiment: Sellers, 1.4:1) price levels.
QQQ ETF’s Price Level:Volume Sentiment Over The Past ~2 Years
IWM, the iShares Russell 2000 ETF climbed +3.28% last week, as small caps were the second favorite names by market participants for the week.
IWM ETF – iShares Russell 2000 ETF’s Technical Performance Over The Past Year
Their RSI is also trending higher & currently is 58.41, while their MACD is bullish, but has shown undulations in its histogram, indicating that there is some weakness due to the consolidation range of the past two weeks (sans Thursday & Friday).
Volumes were -9.32% lower than the previous year’s average (27,004,000 vs. 29,778,606), which casts a shadow of doubt onto the weekly gains, as there was limited participation behind the move.
Monday the week opened on low volume for IWM & signaled immediately that there was uncertainty as to which direction the small cap index would go, as the day resulted in a spinning top candle nestled in the high end of their recent consolidation range.
Tuesday produced a bullish engulfing pattern for IWM, but again on very weak volume, indicating that there was still quite a bit of uncertainty, especially given that Monday’s candle was a spinning top.
The length of the session’s lower shadow also signaled that there was still significant downside appetite, almost to as low as the previous day.
Wednesday followed suit with SPY & QQQ, opening on a gap lower, testing down to the support of the 10 day moving average, before powering higher to briefly break out above the $195/share level & close above the day’s open.
While volumes were higher than Monday & Tuesday, they were still muted for the size of the range that the day’s price action covered.
Thursday opened on a gap up, but resulted in a high wave spinning top that closed on the week’s highest volume.
While this means that there is clearly some high range appetite, the profit taking that drove prices lower both early on in the session & after the highs of the day were hit show that there is more of an interest in preserving capital right now in terms of market participants & the small cap index.
Friday the week wound down on an interesting note, as the session opened on a gap higher to just below the resistance of the 50 day moving average, before on the second highest volume of the week breaking out above it to close above the $200/share price level.
This week will be interesting to see how IWM & the 50 DMA interact, given that their 200 DMA is still rather far above them, indicating that the long-term trend looks stable & won’t change for some time.
In terms of an upside move, while it’s not an official resistance level, the $203.33/share level will be an area of interest to see if the scallop can become a cup & handle & take off, or if we see a denial & consolidation.
If it breaks out to the upside, the $209.27/share level will be the next area of interest, due to its proximity to the 200 day moving average’s resistance.
Like SPY & QQQ, there will need to be an influx in advancing volume that remains consistent before anything on this front is considered possibly more than just a brief pump/squeeze.
The consolidation case from Friday’s close involved the Thursday-Friday window being closed & an oscillation around the 50 day moving average while waiting on an upside or downside catalyst, which will become interesting the closer that the 10 day moving average gets to both levels.
In terms of the downside, the 10 DMA’s support will be a key area to watch, as should prices break down & meet the 10 DMA, controlled bleeding will come from IWM oscillating around it while consolidating lower, else, more dramatic declines call into play the two lowest support levels on their one year chart, $180.76 & $171.71/share.
Using the table below will help navigate these retests as it is all volume sentiments from each price level IWM has traded at over the past ~3 years.
IWM has support at the $198.65 (50 Day Moving Average, Volume Sentiment: Sellers, 1.3:1), $196.56 (Volume Sentiment: Buyers, 2:1), $195.72(Volume Sentiment: Buyers, 1.47:1) & $195.01/share (Volume Sentiment: Buyers, 1.47:1) price levels, with resistance at the $202.46 (Volume Sentiment: Buyers, 1.14:1), $205.49 (Volume Sentiment: Buyers, 1.13:1), $207.39 (Volume Sentiment: Buyers, 1.13:1) & $209.27/share (Volume Sentiment: Buyers, 1.48:1) price levels.
IWM ETF’s Price Level:Volume Sentiment Over The Past ~2-3 Years
DIA ETF – SPDR Dow Hones Industrial Average ETF’s Technical Performance Over The Past Year
Their RSI is trending higher & currently sits at 56.26, while their MACD is beginning to show signs of being over-extended (which history has shown is less important for DIA vs. other indexes).
Volumes were -36.72% lower than the prior year’s average level (2,022,000 vs. 3,195,498), which is showing a severe level of distrust/caution by market participants, given that the bluechip index was the favorite among market participants for so long, regardless of what the other indexes were doing.
Now we’r not seeing that steady buying anymore, but DIA has still proven to be more closely tied to how IWM is trading, but with more advances as it is still seen as a safer haven for money compared to the small cap names.
Monday DIA opened up on ultra-weak volume & closed as a narrow range, high wave spinning top candle, indicating that there was a lot of indecision, pumping & profit taking.
Tuesday featured less volume, but managed to open higher & break above the $405/share level & stay there to close higher, but the limited participation signals that there is a hefty amount of skepticism in the index that was previously the safe haven among the major four indexes.
Wednesday opened in-line with Tuesday’s opening price, tested much lower down to the 10 day moving average, before reversing to trend higher & close out the session as an advance.
Thursday opened on a gap up, tested above the $410/share level, but was swatted back down to below the high of Wednesday to close in a shooting star candle that closed lower than it opened, indicating that there is still a bit of bearishness creeping in, despite the optimistic squeeze higher.
Friday followed the other index ETFs & saw a squeeze pinched higher gap up open for DIA, that managed to break above the resistance of the 50 day moving average & close just above it, but the lowest shadow & proximity away from the long-term trend line is cause for concern.
While the lower shadow can possibly be attributed to profit taking based on it being the second highest volume session of the week, there seems to be other explanations.
DIA has a unique position due to how it has proven resilient when other indexes were consolidating or declining over the past year as times became more volatile.
However, upside case to watch this week is revolving around the 200 day moving average, and whether or not DIA gaps above it, and if so how strongly supported the move is by their volume.
Consolidation case is DIA dips back below the 50 DMA & closes the window from Friday, before oscillating around the 50 DMA waiting for a catalyst one way or the other, and or the bear case.
The bear case here has its target on the 10 day moving average, as it will continue moving higher, and unless folks actually begin jumping out of the pool, there’s still going to be consistent, but muted demand for blue chip names.
When referencing the table below it is wise to keep in mind that DIA has been the most resilient of the four majors, and as a result has a Buyers bias at most price levels from their last ~4-5 years of data for volume sentiment.
If there is a larger reason for folks to jump from the pool then the 10 DMA will certainly break down, but for now it is too ambiguous to tell what may happen.
Regardless, when interpreting the data, read the ratios as “Hotter” or “Colder” compared to one another when seeing a list of multiple Buyer zones in a consecutive series, as from there you can rank the relative strengths of each price level despite being in a swamp of “Buyers”.
DIA has support at the $412.46 (50-Day Moving Average, Volume Sentiment: Sellers, 3.75:1), $411.96 (Volume Sentiment: Buyers, 3.67:1), $408.78 (Volume Sentiment: Buyers, 3.67:1) & $407.82/share (Volume Sentiment: Buyers, 3.17:1) price levels, with resistance at the $413.22 (Volume Sentiment: Sellers, 3.75:1), $416.73 (Volume Sentiment: Buyers, 1.63:1), $419.82 (200 Day Moving Average, Volume Sentiment: Buyers, 1.63:1) & $427.93/share (Volume Sentiment: Buyers, 1.33:1) price levels.
DIA ETF’s Price Level:Volume Sentiment Over The Past ~4 Years
The Week Ahead
Monday the week kicks off with S&P Final U.S. Services PMI at 9:45 am, followed by ISM Services at 10 am.
Ares Management, BioCryst Pharma, BioNTech, CNA Financial, Cummins, Freshpet, Henry Schein, Integra, JBT Marel, Ocular Therapeutix, onsemi, Park Hotels & Resorts, Recursion Pharmaceuticals, RLJ Lodging, Twist Bioscience, Tyson Foods & Zimmer Biomet all report earnings before Monday’s opening bell, with Addus HomeCare, Aecom Tech, Air Lease, Ameresco, Atlas Energy Solutions, BellRing Brands, Bright Horizons, BWX Technologies, Cabot, Celanese, Clorox, Corcept Therapeutics, Corebridge Financial, Coterra Energy, Denny’s, Diamondback Energy, Dorman Products, Douglas Dynamics, Ethan Allen, EverQuote, Fabrinet, Ford Motor, Golub Capital, Hims & Hers Health, IAC, ICHOR, Ingevity, Inspire Medical Systems, Interparfums, JELD-WEN, Kilroy Realty, Lattice Semi, Limbach, LTC Properties, Matson, Mattel, Mueller Water, National Health, National Storage Affiliates, Navitas Semiconductor, Neurocrine Biosciences, New Mountain Finance, NJ Resources, ONE Gas, Otter Tail Power, Palantir Technologies, Palomar Holdings, Paymentus, Playa Hotels & Resorts, PRA Group, Primoris Services, Realty Income, Regal Rexnord, Relay Therapeutics, Sabra Health Care REIT, Sun Communities, Syndax Pharmaceuticals, Talos Energy, Tidewater, Titan America, Upwork, V2X, Vertex Pharma, Vimeo, Viper Energy Partners, Vornado Realty Trust & Williams Cos. all reporting after the closing bell.
U.S. Trade Deficit data is released on Tuesday at 8:30 am.
Tuesday morning’s earnings reports include AdaptHealth, ADM, American Electric, Aramark, Array Tech, Atkore International, Avanos Medical, Avient, Axcelis Tech, Ball Corp, CCC Intelligent Solutions, Colliers, Constellation Energy, Cormedix, Datadog, DigitalOcean, Driven Brands, Ducommun, Duke Energy, Embraer, Energizer, Enpro, EVgo, Ferrari, Fidelity National Info, First Watch Restaurant Group, Gartner, Genius Sports, Global Payments, GlobalFoundries, Harmony Biosciences, Ingredion, IPG Photonics, IQVIA, Jacobs Solutions, KBR, Knife River, Kontoor Brands, Krystal Biotech, Kulicke & Soffa, LCI Industries, Lear, Leidos, Lemonade, Louisiana-Pacific, Marathon Petroleum, Marriott, MFA Financial, MPLX LP, Northwest Natural, Novanta, Omnicell, Peabody Energy, Pediatrix Medical Group, Philips, Portillo’s, Premier, Sealed Air, Shoals Technologies, SolarEdge Technologies, Sunoco LP, Sunstone Hotel, TopBuild, Transdigm Group, TreeHouse Foods, UBS, UL Solutions, Uniti Group, Waters, WEC Energy Group, WK Kellogg, Xometry, XPEL & Zoetis, with Advanced Micro Devices, Agilon Health, Allegiant Travel, Amentum Holdings, American Financial, Andersons, Arcosa, Arcus Biosciences, Arista Networks, Assurant, Astera Labs, AZEK, BlackLine, Cadre Holdings, California Resources, Chemours, Chord Energy, Cirrus Logic, Corpay, Corsair Gaming, Coty, Coupang, Cytokinetics, Devon Energy, DHT, Douglas Emmett, Electronic Arts, Energy Transfer, eXp World Holdings, Flywire, Fortune Brands Innovations, Gen Digital, Grand Canyon Education, Grocery Outlet, Halozyme Therapeutics, Helios Technologies, Horace Mann, Innovex International, Intapp, International Flavors, Jack Henry, Jamf Holding, Jazz Pharma, Kinross Gold, Klaviyo, Lucid Group, Lumentum, Manitowoc, Maravai Life Sciences, Masimo, Mercury, Mosaic, MRC Global, NerdWallet, Ovintiv, Par Pacific, Powell Industries, PTC Therapeutics, Qualys, Redfin, Resideo, Revolve Group, Rivian Automotive, Sarepta Therapeutics, Select Water Solutions, Supernus Pharma, Tempus AI, Teradata, The Baldwin Group, Upstart, Varonis Systems, Vestis, Voya Financial, VSE Corp & Wynn Resorts all due to report after the session’s closing bell.
Wednesday features the FOMC Meeting at 2pm, Chair Powell’s Press Conference at 2:30 pm, & Consumer Credit data at 3pm.
Walt Disney, Acushnet, Adient, Ardmore Shipping, ATS, AvidXchange, Avista, Axalta Coating Systems, Azenta, Bandwidth, Barrick, BeiGene, Bentley Systems, Bio-Techne, Bloomin’ Brands, BorgWarner, Bruker, Bunge, CDW, Cencora, Centuri Holdings, Ceva, Charles River, Conduent, Dayforce, Delek US Holdings, Dine Brands, DNOW, Edgewell Personal Care, Elanco Animal Health, Emerson, Entegris, Fiverr, Flex, Fortis, Geo Group, Geron, Hain Celestial, HNI, Johnson Controls, Jones Lang LaSalle, Kennametal, Lantheus Holdings, LifeStance Health Group, LivaNova, Magnera, MarketAxess, MasterCraft, Middleby, National Vision, New York Times, NiSource, ODP, Oscar Health, Owens Corning, Pagaya, Payoneer, Performance Food Group, Perrigo, Rhythm Pharmaceuticals, Rockwell Automation, RXO, Sabre, Shopify, Southwest Gas, Steve Madden, Taboola, Teva Pharma, TPG, Trimble, TripAdvisor, Uber, Unity Software, Verisk Analytics & Vertex all report earnings before Wednesday’s opening bell, followed by ACADIA Pharmaceuticals, ACV Auctions, ADTRAN, Alpha and Omega Semi, AMC Entertainment, Amdocs, American States Water, Amplitude, APA, AppLovin, Arm Holdings, Atmos Energy, Avis Budget, Axon, B&G Foods, B2Gold, Barrett Business, Beyond Meat, Black Hills, Blue Bird, Brighthouse Financial, BrightView, Bumble, Carvana, Centrus Energy, CF Industries, Chesapeake Utilities, Civitas Resources, Cleveland-Cliffs, Coeur Mining, Coherent, Compass Materials, Concentra, Copa Holdings, Core Scientific, CoreCivic, Corteva, Crane NXT, CSG Systems, Curtiss-Wright, Digi International, DoorDash, Dutch Bros, Encore Capital, Energy Recovery, EPR Properties, Esco Tech, Establishment Labs, EVERTEC, Evolus, Excelerate Energy, Fastly, Fidelity National, Fluence, Flutter Entertainment, Fortinet, Forward Air, FS KKR Capital, Genco Shipping & Trading, Genpact, GoodRx, GXO Logistics, H&R Block, Houlihan Lokey, Howard Hughes Holdings, Informatica, Innovative Industrial Properties, IonQ, Jackson Financial, Joby Aviation, Kinetik, Kodiak Gas Services, Kratos Defense and Security, Kyndryl, LandBridge, LegalZoom, Light & Wonder, Magnite, Manulife Financial, Marqeta, Marriott Vacations, MKS Instruments, Murphy Oil, Murphy USA, NCR Atleos, Occidental Petroleum, OPENLANE, Orion Engineered Carbons, Ormat Technologies, Pan Am Silver, Paycom Software, Permian Resources, Pitney Bowes, Primerica, Q2 Holdings, Qiagen, QuidelOrtho, QuinStreet, Radware, RB Global, Remitly Global, Root, Royal Gold, RxSight, Schrodinger, Sinclair Broadcast, SiTime, Sitio Royalties, Skyworks, Sonos, STAAR Surgical, Suncor Energy, Sunrun, Symbotic, Tetra Tech, U.S. Physical Therapy, UGI, Veeco Instruments, Veracyte, Verra Mobility, Vishay, Watts Water Technologies, Western Midstream & Zillow after the closing bell.
Initial Jobless Claims & U.S. Productivity data are released on Friday at 8:30 am, before Wholesale Inventories data comes out at 10 am.
Thursday morning’s earnings reports include ACI Worldwide, ACM Research, Alight, Allegro Microsystems, Allete, Altice USA, Americold Realty Trust, Appian, Aspen Aerogels, Autohome, BCE, BigCommerce, Canada Goose, Cars.com, Cheniere Energy, Choice Hotels, Clear Secure, Cogent Communications, ConocoPhillips, Core Natural Resources, Crocs, Enovis, EPAM Systems, Evergy, First Advantage, Genesis Energy LP, Gray Media, Green Plains, Haemonetics, Hanesbrands, Insmed, Installed Building Products, International Seaways, Janus International Group, Kenvue, Kimbell Royalty Partners, Krispy Kreme, Lamar Advertising, Life Time, Ligand Pharmaceuticals, Lincoln National, MACOM Tech, Malibu Boats, Match Group, MAXIMUS, MDU Resources, Millicom International Cellular, Molson Coors Brewing, N-able, NCR Voyix, NetScout Systems, Nexstar, Nomad Foods, Nova Measuring, Nutrien, Olaplex, Papa John’s, Peloton, PENN Entertainment, Planet Fitness, Playtika, Prestige Consumer, Primo Brands, Privia Health, Restaurant Brands International, Sapiens, ScanSource, Sempra Energy, SharkNinja, Six Flags Entertainment, Somnigroup International, Spectrum Brands, Stagwell, Stevanato Group, Stratasys, Tapestry, Tecnoglass, TEGNA, US Foods, Valvoline, Vericel, Viatris, Vital Farms, Warby Parker, Warner Bros. Discovery, Warner Music Group, Wolverine & YETI Holdings, with Coinbase Global, 1-800-FLOWERS, 10x Genomics, Adtalem Global Education, Affirm, Akamai Technologies, Alarm.com, Alliant Energy, American Healthcare REIT, AMN Healthcare, Applied Optoelectronics, Arlo Technologies, Assured Guaranty, Astrana Health, AvePoint, Barings, Bill.com, CarGurus, Clean Energy Fuels, Cloudflare, Collegium Pharmaceutical, Crinetics Pharmaceuticals, Definitive Healthcare, Diodes, DoubleVerify, DraftKings, Dropbox, EverCommerce, Evolent Health, Expedia Group, Federal Realty Investment Trust, FIGS, Fox Factory Holding, Franco-Nevada, Funko, Globus Medical, Green Dot, Hub Group, HubSpot, ICU Medical, Illumina, Innodata, Innospec, Insulet, JFrog, Lions Gate Entertainment, LPL Financial, Lyft, MARA Holdings, McKesson, Metallus, Microchip, Mitek Systems, MP Materials, News, nLIGHT, Olo, OneStream, Onto Innovation, OUTFRONT Media, Pacira BioSciences, Paramount Global, Pinterest, Post, Progyny, PubMatic, Rackspace Technology, RingCentral, Rocket Companies, Rocket Lab USA, Sensata Technologies, Solventum, SoundHound AI, Sprout Social, Sweetgreen, Synaptics, Texas Roadhouse, The Trade Desk, TKO Group Holdings, Toast, TransMedics Group, Treace Medical Concepts, Trex, Varex Imaging, Victory Capital, Westrock Coffee Company, Wolfspeed, Xponential Fitness, YELP, Ziff Davis, ZipRecruiter & Zymeworks all reporting after the session’s closing bell.
Friday the week winds down with Fed Governor Barr speaking at 6:45 am, Fed Governor Kugler speaking at 8:30 am, Fed Governor Waller & Fed President Williams on a panel at 11:30 am, Fed Governor Cook speaking at 6:45 pm & Fed Governor Bowman, Fed President Musalem & Fed President Hammack speaking on a panel at 7:45 pm.
Algonquin Power & Utilities, Alpha Metallurgical Resources, AMC Networks, ANI Pharmaceuticals, Calumet Specialty Products, Construction Partners, Embecta, Enbridge, Essent Group, Gogo, Hawaiian Electric, Koppers Holdings, Kymera Therapeutics, PAR Technology, Pembina Pipeline, Plains All American, Starwood Property Trust, Sun Life, Sylvamo, TeraWulf & TXNM Energy all report earnings before Friday morning’s opening bell.
See you back here next week!
*** I DO NOT OWN SHARES OR OPTIONS CONTRACT POSITIONS IN SPY, QQQ, IWM OR DIA AT THE TIME OF PUBLISHING THIS ARTICLE ***
SPY, the SPDR S&P 500 ETF fell -1.41% last week, while the VIX closed the week at 29.65, indicating an implied one day move of +/-1.87% & a one month implied move of +/-8.57%.
SPY ETF – SPDR S&P 500 ETF’s Technical Performance Over The Past Year
Their RSI is flat & currently at 42.43, while their MACD is dolphining & looks ready to cross back over bearishly in the coming day or two, as their histogram is waning.
Volumes were +29.18% above the prior year’s average (72,067,500 vs. 55,786,349), indicating that the mood is clearly still bearish, with a side of undecided.
Monday began on a gap up open above the 10 day moving average’s support, but it flashed some warning signs that set the tone for the rest of the week.
The gap up opened just below the $545/share price level, but declined into the day, at one point touching as low as $533.66/share, indicating that there was more downside appetite than upside.
SPY also closed lower than it opened on the day on the second lowest volume of the week, which was not a vote of confidence in the market.
Tuesday confirmed that there was not much excitement, nor bullish sentiment for SPY, as the session tried to advance early, but was unable to reach Monday’s high & the day went downhill from there.
Granted Tuesday had the lowest volume of the week, but it showed that market participants were not interested in the $545/share price level & set the stage for the declines of later in the week.
On Wednesday the floodgates opened, as SPY opened on a gap down, tested up towards Tuesday’s close, but was unable to & collapsed to form a high wave candle with a 3%+ range on the day that closed in-line with the 10 day moving average.
Thursday indicated that there would be further pain on the horizon, as it resulted in a bearish harami pattern, with a spinning top candle that closed lower than it opened; not exactly strong sentiment or a vote of confidence for the coming week.
While the day’s low managed to be supported by the 10 DMA, there was not much strength heading into Easter weekend.
Heading into the new week, the upside case remains the same as it’s been for past month or two; without a consistent uptick in advancing volume there will be no floor build for SPY to rally off of.
Even with a higher open, volume sentiment is not indicating that SPY’s next handful of price levels will be a cakewalk higher through, making it more imperative that a surge in advancing volume accompanies any move higher.
To the downside, things have become interesting after SPY set a new support level at $481.80/share last week, which happens to be the lowest level on their one year chart.
While the $520-524.99/share price level has strong Buyer oriented sentiment historically, should it be retested & broken through that $481.80/share mark is where to be looking next.
The base case for the coming week is to see SPY hug & oscillate around the 10 day moving average, until given a reason to break out one way or the other, which will likely come as a results of earnings reports (particularly the number of companies that pull guidance).
The should the low end of the range break below 4/9/2025’s low, that $481.80/share support level becomes the linchpin that keeps SPY from tumbling lower.
Even more troubling, there’s quite a bit of Seller dominated price zones between SPY’s current price & that level, so while that price level is a stronghold for Buyers at a rate of 5.67:1, it could very well break down & we see that strong ratio dilute given the amount of steam it has & amount of negative sentiment.
Again, this will likely come from earnings calls in the next week or two, else based on tariff news.
SPY has support at the $ 524.21(10 Day Moving Average, Volume Sentiment: Buyers, 4.43:1), $505.48 (Volume Sentiment: Sellers, 1.2:1), $487.65 (Volume Sentiment: ) & $481.80/share (Volume Sentiment: Buyers, 5.67:1) price levels, with resistance at the $534.38 (Volume Sentiment: Sellers, 1.41:1), $548.03 (Volume Sentiment: Buyers, 1.44:1), $548.62 (Volume Sentiment: Buyers, 1.44:1) & $558.91/share (Volume Sentiment: 1.46:1) price levels.
SPY ETF’s Price Level:Volume Sentiment Over The Past ~3 Years
QQQ, the Invesco QQQ Trust ETF dipped -2.27%, as the tech-heavy index was not immune from the week’s declines heading into the holiday three day weekend.
QQQ ETF – Invesco QQQ Trust ETF’s Technical Performance Over The Past Year
Their RSI is also flat at the 42.11 level, while their MACD has a waning histogram & is dolphining, looking primed to cross the signal line bearishly in the next couple of days.
Volumes were +17.34% higher than the previous year’s average levels (43,290,000 vs. 36,892,302), indicating that there is still quite a bit of bearish sentiment around QQQ’s component stocks & money looking to be taken out of the market.
QQQ’s Monday looked a lot like SPY’s, a gap higher to the $465/share level, followed by a retreat that brought it below $455 temporarily, before it was able to rally & close at $457.48/share.
Tuesday the diving board was set up, when a bearish harami pattern emerged from two advancing, but filled candles on weak volumes & the session closed as a doji.
This doji favored the lower end of the day’s range though, indicating that there would be difficult times heading into the end of the week.
Sure enough, Wednesday opened on a gap down, tested above the $450/share level, but was promptly sent lower & broke down below $440/share, which is now in play, and closed the day at $444.18/share, in-line with the 10 day moving average, on the week’s highest volume session.
Bearish confirmation arrived further on Thursday, when QQQ opened in the middle of Wednesday’s range, proceeded to break down through the 10 DMA’s support, before managing to close just above it.
Much like SPY, QQQ’s chart needs a major uplift in advancing volume before it will be able to build a sustainable base to spring up from.
In reality, the next week or two should have all eyes on the 10 day moving average, watching price oscillate around it in reaction to the earnings reports that we get & the Fed speakers this week.
The $402.39/share mark is like SPY’s low water mark of $481.80/share, being the lowest 1 year chart support level & occurring on the same day.
In the event of a downside move of greater than- 1.82%, QQQ enters Seller territory & will have the momentum to carry it lower, where it will encounter a similar situation to SPY on the route to the low support level once it hits the $411.99/share level & we watch the high Buyer ratios potentially dilute.
The $400-403.99/share level is also going to be a questionable range, as there is limited Seller pressure at all over the past ~2 years.
The chart below will help guide through volatility in QQQ & retests of support/resistance levels in the near-term.
QQQ has support at the $443.27 (10 Day Moving Average, Volume Sentiment: Buyers, 3.27:1), $440.36 (Volume Sentiment: Buyers, 3.27:1), $421.55 (Volume Sentiment: Sellers, 1.5:1) & $410.56/share (Volume Sentiment: Buyers, 4:1) price levels, with resistance at the $446.18 (Volume Sentiment: Sellers, 3:1), $457.78 (Volume Sentiment: Sellers, 1.94:1), $465.74 (Volume Sentiment: Buyers, 2:1) & $467.83/share (Volume Sentiment: Buyers, 2:1) price levels.
QQQ ETF’s Price Level:Volume Sentiment Over The Past ~2 Years
IWM ETF – iShares Russell 2000 ETF’s Technical Performance Over The Past Year
Their RSI is trending towards the neutral 50 mark after a brief flat period, while their MACD is dolphining & looking ready to cross back bearishly through the signal line by mid-week.
Volumes were +27.89% above the prior year’s average (38,262,500 vs. 29,917,778), indicating that small cap names are out of favor & that markets in general are beginning to look ready for further cooling down across the board.
IWM’s chart reads similar to SPY & QQQ’s, but duller & more committed to straddling the 10 DMA than the prior two indexes, in terms of last week’s performance.
Monday opened on a squeeze gap up in-line with the 10 DMA, before testing near to the $182.50/share level to the downside & closing above it, but lower than its open, setting the stage for a weak week.
The next day showed the oxygen was out of the room when a spinning top/shooting star emerged as Tuesday’s candle that opened lower, tested to $189/05, before settling at $186.76, but spreading the notion of uncertainty & fear being abound.
Sure enough, Wednesday opened lower, could not break above Tuesday’s close, but managed to break below the 10 DMA after the test & flirt with the $182.50/share mark before closing in-line with the 10 DMA’s support on the second highest volume of the week.
Thursday had the highest volume heading into the weekend on a +0.82% advancing day, but was capped out at $187.43/share at the day’s high, further indicating that there will likely not be many folks seeking refuge in small cap names anytime soon.
Heading into this week the upside case is the same as for SPY & QQQ; no major, consistent advancing volume inflows, no floor to build gains from.
Most likely case is to watch IWM flutter & oscillate nearby the 10 DMA, with all eyes on the $171.73/share level to see if & when that breaks down.
What’s unique here for IWM is that per the table below, once $173.99/share is broken down through, it passes through an “Even” Buyers:Sellers zone before one last attempt at support & then entertains breaking down below the lowest support level on a two year chart, based on Seller zones walking it down.
While Buyers may come out in droves to prevent this from happening, this event seems like something that would happen that would be more indicative of a broader market selloff/crash, so the way down may not be where market participants decide to find their footing on a two year chart support level.
Using the table below & our Volume Sentiment table from SPY’s link in the “Volume Sentiment” text above will help add guidance to navigating this scenario.
IWM has support at the $183.61 (10 Day Moving Average, Volume Sentiment: Buyers, 2.5:1), $171.73 (Volume Sentiment: Buyers, 1.84:1), $164.61 (2 Year Chart, Volume Sentiment: Sellers, 1.4:0*) & $158.85/share (Lowest Support On 2 Year Chart, Volume Sentiment: NULL, 0:0*) price levels, with resistance at the $189.17 (Volume Sentiment: Buyers, 1.32:1), $195.01 (Volume Sentiment: Buyers, 1.47:1), $195.72 (Volume Sentiment: Buyers, 1.47:1) & $196.56/share (Volume Sentiment: Buyers, 2:1) price levels.
IWM ETF’s Price Level:Volume Sentiment Over The Past ~2-3 Years
DIA, the SPDR Dow Jones Industrial Average ETF lost -2.62% last week, as the blue chip index has continued to signal that market participants are becoming heavily risk averse, after so much time being the “outperforming outlier” of the majors.
DIA ETF – SPDR Dow Jones Industrial Average ETF’s Technical Performance Over The Past Year
Their RSI is trending towards the oversold level, in a shift from the prior three indexes, while their MACD has just completed a dolphin, plunging back below the signal line after a brief jump above it for air.
Volumes were -6.39% lower than the previous year’s average level (3,055,000 vs. 3,263,452), which is expected, given how many DIA components are staples in people’s long-term portfolios.
Their week was far more risk off compared to the aforementioned three majors, in that Monday gapped up & closed lower with a clear “risk off” signal from its lower shadow, followed by a “shooting star” (bearish) of sorts candle & a breakdown of the 10 DMA’s support in the wake of Wednesday’s gap down session that closed in line with it.
Thursday the volume was cranked compared to the other days, and people were jumping out of the pool, resulting in a gap down open high wave candle that closed as a doji, implying that there may be a lot more downside movement in the near-term for all indexes, given the resilience of DIA.
Much like the indexes above, DIA should straddle/oscillate around its 10 day moving average moving into this week, barring any major earnings issues or anything bad from Fed speakers.
Upside isn’t really a talking point until it gets volume support on advancing sessions at this time, even for the most resilient index.
Their downside looks problematic, ad while this is a lot of support with Buyer Dominated volume, current sentiment suggests that if we retest the support levels listed below that we’re looking at a larger systemic issue, which would compound the losses for DIA given the resilience noted prior that it’s experience vs. other indexes.
Like the other indexes though, the $366.16/share support level fell on the same day as their most recent support level, which also happens to be the lowest on their chart, and will be a focal point on their chart in the coming weeks.
DIA has support at the $380.39 (Volume Sentiment: Buyers, 1.05:1), $374.90 (Volume Sentiment: Buyers, 1.06:1), $369.95 (Volume Sentiment: Buyers, 1.6:1) & $366.14/share (Volume Sentiment: Buyers, 1.92:1) price levels, with resistance at the $393.38 (Volume Sentiment: Buyers, 2.33:1), $393.84 (10 Day Moving Average, Volume Sentiment: Buyers, 2.33:1), $394.92 (Volume Sentiment: Buyers, 2.33:1) & $396.40/share (Volume Sentiment: Sellers, 1.75:1) price levels.
DIA ETF’s Price Level:Volume Sentiment Over The Past ~4 Years
The Week Ahead
The week begins with U.S. Leading Economic Indicators on 10 am on Monday.
Monday morning’s earnings calls include Bank of Hawaii & Comerica, before AZZ, BOK Financial, Cadence Bank, Calix Networks, Cathay Bancorp, Equity Lifestyle Properties, Hexcel, Medpace, W.R. Berkley, Western Alliance Bancorp, Western Alliance Bancorp & Zions Bancorp report after the closing bell.
Tuesday morning Fed President Harker speaks at 9:30 am.
3M, Danaher, Elevance Health, Equifax, Forestar, GE Aerospace, Genuine Parts, Herc Holdings, Hope Bancorp, Invesco, Iridium Communications, Kimberly-Clark, Lockheed Martin, Moody’s, MSCI, Northern Trust, Northrop Grumman, Old National Bancorp, Pentair, PulteGroup, Quest Diagnostics, RTX, Synchrony Financial, United Community Banks, Valmont Industries & Verizon Communications all report earnings before Tuesday’s opening bell, followed by Tesla, Agree Realty, Baker Hughes, Capital One, Chubb, East West Bancorp, Enphase Energy, EQT Corp., Intuitive Surgical, Manhattan Associates, National Bank, Packaging Corp. of America, Pathward Financial, Pegasystems, PennyMac, Range Resources, Renasant, SAP SE, Steel Dynamics, Trustmark, Veritex Holdings & Zurn Elkay Water Solutions.
Fed President Goolsbee speaks on Wednesday at 9 am, before Fed Presidents Musalem & Waller speak at 9:30 am, S&P Flash U.S. Services PMI & S&P Flash U.S. Manufacturing PMI data comes out at 9:45 am, New Homes sales data is released at 10 am, the Fed Beige Book comes out at 2 pm & at 7:40 pm Fed President Bostic speaks.
Wednesday morning begins with earnings calls from Amphenol, AT&T, Avery Dennison, Boeing, Boston Scientific, Check Point Software, CME Group, First Hawaiian, GATX, GE Vernova, General Dynamics, Healthcare Services Group, Lennox International, Lithia Motors, M/I Homes, Masco, Mr. Cooper Group, New Oriental Education & Technology, NextEra Energy, Norfolk Southern, OFG Bancorp, Old Dominion, Otis Worldwide, Philip Morris International, Popular, PROG Holdings, Prosperity Bancshares, Ryder System, Stifel Financial, Taylor Morrison Home, TE Connectivity, Teledyne Tech, Thermo Fisher, Travel + Leisure Co, Vertiv, Virtu Financial, Wabtec & Watsco, followed by Chipotle Mexican Grill, Alaska Air, ASGN Inc, Banc of California, Bank of N.T. Butterfield & Son, CACI International, Carlisle Companies, Century Communities, Chemed, Churchill Downs, Community Health, Core Labs, Discover Financial Services, EastGroup, Edwards Lifesciences, Element Solutions, Essential Properties Realty Trust, First American Financial, FirstEnergy, Goosehead Insurance, Graco, International Business Machines, IMAX, Impinj, Kaiser Aluminum, Knight-Swift Transportation Holdings, Lam Research, Las Vegas Sands, Matador Resources, MaxLinear, Meritage Homes, Moelis, Molina Healthcare, Newmont Corp, O’Reilly Automotive, Oceaneering International, Penumbra, Plexus, QuantumScape, Raymond James, Reliance, RenaissanceRe, ResMed, ResMed, Robert Half, Rollins, SEI Investments, Selective Insurance, ServiceNow, Stewart Info, Texas Instruments, Tyler Technologies, United Rentals, Viking Therapeutics, Western Union & Whirlpool after the session’s close.
Thursday begins with Initial Jobless Claims, Durable-Goods Orders & Core Durable Orders (business investment) at 8:30 am.
ADT, Allegion, AllianceBernstein, American Airlines, Ameriprise Financial, Apogee Enterprises, Ardagh Metal Packaging, Atlantic Union Bankshares, Balchem, Berkshire Hills Bancorp, Bread Financial, Bristol Myers Squibb, Brunswick, Carpenter Technology, CBIZ, CBRE Group, CenterPoint Energy, CMS Energy, CNX Resources, Curbline Properties, Darling Ingredients, Dover, Dow, Euronet, First Bancorp, First Merchants, FirstCash, Fiserv, Freeport-McMoRan, FTI Consulting, Gentherm, Group 1 Auto, Hasbro, Helen of Troy, Integer Holdings, Interpublic, Keurig Dr Pepper, L3Harris, Ladder Capital, LKQ, MarineMax, Merck, Mobileye Global, NASDAQ, NovoCure, Old Republic, Pacific Premier, PepsiCo, PG&E, Pool, PROCEPT BioRobotics, Procter & Gamble, RPC, Sanofi, Sonic Automotive, Southwest Air, STMicroelectronics, Strategic Education, TechnipFMC, Textron, Tractor Supply, TransUnion, TRI Pointe Homes, Union Pacific, Valero Energy, Valley National, Visteon, Webster Financial, West Pharmaceutical Services, Willis Towers Watson, WNS & Xcel Energy all report earnings before Thursday’s opening bell, before Alphabet, AppFolio, Associated Banc-Corp, Boston Beer, Boyd Gaming, Columbia Banking, Coursera, Customers Bancorp, Digital Realty Trust, Eastman Chemical, Encompass Health, Federated Hermes, First Financial Bancorp, Gaming and Leisure Properties, Gilead Sciences, Glacier Bancorp, Hartford Financial, Healthpeak Properties, Intel, Kinsale Capital, Knowles, McGrath RentCorp, Merit Medical, Minerals Technologies, Phillips Edison, Principal Financial Group, Provident Financial Services, Republic Services, Sallie Mae, Seacoast Banking, Skechers USA, SkyWest, South State, SPS Commerce, SS&C Techs, T-Mobile US, VeriSign, Weyerhaeuser & WSFS Financial report after the closing bell.
Consumer Sentiment (final) is released at 10 am Friday.
AbbVie, Aon, AutoNation, Avantor, Centene, Charter Communications, Colgate-Palmolive, Flagstar Financial, Gentex, HCA, Hilltop Holdings, Lazard, LyondellBasell, Moog, Phillips 66, PHINIA, Portland General Electric, Saia, Sensient, SLB, Stellar Bank & TriNet Group are all scheduled to report earnings on Friday Morning.
See you back here next week!
*** I DO NOT OWN SHARES OR OPTIONS CONTRACT POSITIONS IN SPY, QQQ, IWM OR DIA AT THE TIME OF PUBLISHING THIS ARTICLE ***
SPY, the SPDR S&P 500 ETF gained +5.67% last week, while the VIX closed the week out at 37.56, indicating an implied one day move of +/-2.37% & an implied one month move of +/-10.86%.
SPY ETF – SPDR S&P 500 ETF’s Technical Performance Over The Past Year
Their RSI is trending towards the neutral 50 level, sitting currently at 44.42, while their MACD is bearish, but approaching the signal line & the histogram is waning.
This isn’t indicative of a bullish crossover with strength on the horizon though, especially given that SPY’s 50 day moving average is poised to bearishly break through their 200 DMA forming a death cross by Wednesday.
Volumes were +230.5% higher than the previous year’s average (184,900,000 vs. 55,944,960), which is also cause for concern, as while Wednesday’s squeeze play resulted in a great deal of advancing volume, there’s still a significant amount of outflows for SPY & the other index ETFs.
Monday opened on a gap down & went as low as $481.80/share during the session, before rallying back to break above the $520/share level temporarily & close higher on the day at $504.38/share, which was higher than it opened.
Volumes that day were pronounced, which makes sense given the range that the day covered & the profit taking/pumping for later in the week that was taking place.
Tuesday SPY opened on a gap up & again made a run at the $525/share level, but was unable to find the footing & wound up closing for a decline on the session
Wednesday saw a major spike in both price & advancing volume for SPY, as a gap down open recovered to rally back +10.5% on the day, due to a whipsaw caused by tariff talk & the March FOMC minutes.
While the day’s volume was certainly high, it is not enough to constitute the consistent high volume SPY needs to form a base & while it can be enjoyed, it is not a signal that all has recovered & to be bullish.
The bullish engulfing candle did manage to break above & close above the 10 day moving average’s support, which hadn’t happened in weeks.
Along came a bearish harami pattern with Thursday’s session though, where elevated volumes led to a decline.
Thursday’s lower end of the day’s range is something to be concerned about, as it temporarily dipped below the $510/share level before recovering to close at $524.58/share, indicating that there is still a lot of bearish sentiment in the market.
Mixed signals continued into the weekend, as Friday’s session closed with a +1.78% gain, just a hair above the 10 day moving average’s support, but on less than half of the volume that Wednesday’s advancing session had, so there is no consistent elevated bullish volume sentiment, despite two bullish days.
Heading into this week the bullish case stays the same as it has over the past month now, without substantial, consistent higher advancing volumes there is unlikely to be a base formed where SPY can take off from to rally higher.
Should we see higher levels of consistent participation in the market on advancing days then we can begin to look at resistance levels being tested & broken, but for now we’re not set up for that yet.
What is more likely to happen is there will be some consolidation & oscillation around the 10 DMA, until the death cross of the 50 & 200 DMAs takes place, at which point we see some support levels tested.
The consolidation would likely remain within the wide range of Wednesday’s candle (10.5% is a lot of wiggle room, granted), while any downside moves will be interesting, as Buyers have historically liked the price level that SPY is in now & its next two support levels, but if we break down through those we enter Seller territory again, as shown below.
SPY has support at the $533.49 ( 10 Day Moving Average, Volume Sentiment: Buyers, 2.67:1), $532.41 (Volume Sentiment: Buyers, 2.67:1), $505.48 (Volume Sentiment: Sellers, 1.2:1) & $487.56/share (Volume Sentiment: Sellers, 1.1:1) price levels, with resistance at the $534.38 (Volume Sentiment: Buyers, 2.67:1), $548.03 (Volume Sentiment: Buyers, 1.44:1), $548.62 (Volume Sentiment: Buyers, 1.44:1) & $549.67/share (Volume Sentiment: Buyers, 1.44:1) price levels.
SPY ETF’s Price Level:Volume Sentiment Over The Past ~3 Years
QQQ, the Invesco QQQ Trust ETF advanced +7.51%, as the tech-heavy index was the favorite among the major four for the week.
QQQ ETF – Invesco QQQ Trust ETF’s Technical Performance Over The Past Year
Their RSI is climbing towards the neutral 50 mark, while the MACD looks primed to cross the signal line bullishly by Tuesday, but given their volume situation it may be more of a temporary dolphin jump for air than an actual bullish move.
Volumes were +305.92% above the prior year’s average level (113,310,000 vs. 37,039,286), which like SPY’s has a lot of questions to be asked about it, particularly as they both have seen similar performance, but with different volume trends.
QQQ’s past week also closely resembled SPY’s across the board, leading off on Monday with a gap down that tested as low as $402.39/share where it found support to bounce from & test higher to above the $440/share level & to close higher than it opened on the day at $423.69/share.
This occurred on the week’s highest volume, which is important as the day covered a wide range of prices, so it shows market participants were highly engaged & that the day wasn’t just fluff tape.
Tuesday opened on a gap up, tested higher to about Monday’s high & it all went south from there, quickly, leading to declines on the week’s second lowest volume, but still still ~2x the prior year’s average, indicating that there was a lot of risk-off sentiment to bag up Monday’s gains.
Wednesday mirrored SPY’s performance to a degree, where the second highest volume session of the week broke above the short-term trend line to close above $465/share.
What’s troubling about it though is that Thursday’s session produced a bearish harami pattern with a long lower shadow as well that showed support really wasn’t until the $432.63/share level & that the short-term trend line will likely not hold up.
Friday brought along a bullish engulfing candle, but on volume so weak that it was hardly a drop in the bucket compared to the previous four days (it was ~50% of the second lowest session’s volume).
Like SPY, QQQ’s upside story lies solely in what happens when they get some sustainable higher volume, which doesn’t look like it’s going to happen anytime soon still, particularly with their 50 & 200 DMA’s set to death cross by Tuesday.
While some might say Monday was a major volume spike that could signal a reversal, there is not yet enough confirmation, and the rest of their chart & data don’t suggest that confirmations coming just yet.
Their death cross-over is coming between today & tomorrow, which will apply downward pressure on QQQ, along with potential bad news coming from earnings reports (Tuesday features a handful of names that while not in the NASDAQ, may cause problems wider-spread).
It’s likely we see QQQ consolidate within the confines of Wednesday’s candle’s range while oscillating around the 10 DMA, like we’ve been expecting most weeks over the past month+.
Downside breakdowns will get interesting, particularly when you reference the support level Buyer:Seller sentiment in the table & paragraph below.
This doesn’t look like we’re near out of the woods just yet, and the $402.39/share level has now become a new area of focus should it be tested, as its the lowest 1 year support level, a freshly established level & volume has really turned up since it was tested, indicating that there’s fish biting around there.
Whether we actually sink that far is still TBD, but again, when the fish are biting that aggressively, its usually a sign that that’s going to be a place to keep your eyes on.
It’s also worth referencing the Volume Sentiment table for QQQ, as well as SPY, IWM & DIA when looking at these volume levels for historical context.
QQQ has support at the $449.74 (10 Day Moving Average, Volume Sentiment: Buyers, 1.17:1), $446.18 (Volume Sentiment: Sellers, 3:1), $440.36 (Volume Sentiment: Buyers, 3.27:1) & $421.55/share (Volume Sentiment: Sellers, 1.5:1) price levels, with resistance at the $457.78 (Volume Sentiment: Sellers, 1.94:1), $465.74 (Volume Sentiment: Buyers, 2:1), $467.83 (Volume Sentiment: Buyers, 2:1) & $473.41/share (Volume Sentiment: Sellers, 1.19:1) price levels.
QQQ ETF’s Price Level:Volume Sentiment Over The Past ~2 Years
IWM, the iShares Russell 2000 ETF climbed +1.75%, as market participants squeezed into the small cap index heavily on Wednesday, setting the stage for weekly gains.
IWM ETF – iShares Russell 2000 ETF’s Technical Performance Over The Past Year
Their RSI is chopping back towards the neutral 50 mark, sitting currently at 38.6, while their MACD is flat.
While their MACd histogram is waning, they’ve got a lot of trouble under the hood given the nature of how small cap names will move in relation to their larger peers & the volume trends noted above.
Volumes were +162.43% above the prior year’s level (78,654,000 vs. 29,971,786), which is an interesting thing to note as IWM & DIA have relatively moved decoupled from SPY & QQQ who move in similar fashions to one another, but the lack of an idea as to where the market is going right now seems to have impacted everyone from the small caps to the blue chips.
Monday the week began on uncertain, but negative terms, as a gap down open was able to muster up a higher close, but the upper shadow of the day’s candle broke above the $190/share level on the second highest volume of the week.
Tuesday opened on a gap higher, but quickly showed that there was a bit our sour sentiment out & prices declined rapidly to show appetite below the $172.50/share level, but closed above it.
Wednesday followed SPY & QQQ’s lead, seeing a major influx of volume that accounted for the week’s highest level, but IWM was rejected by their 10 DMA’s resistance & closed below it, a major bearish signal.
Thursday’s menu included bearish harami candles with long lower shadows indicating that there was still a bit of downside appetite that needed to be examined.
Friday continued this with a gap down open that retraced most of Thursday’s lower range, but ultimately there was a small rally into the weekend hat resulted in a +1.46% advance for the day.
It should be noted though that this came on very weak volume, indicating that there was more of a pump/head-fake going into the weekend vs. some actual bullish sentiment.
IWM suffers from the same bullish case as the two aforementioned index ETFs, there’s no volume for a base case to be built upon & there’s a lot of sentiment troubles they’ll be faced with in the near-term as well.
In the meantime expect a similar consolidation as to what’s described above as we see what guidance changes from earnings calls change broader market sentiment.
One area of caution with IWM; there is only one support price level from their one year chart & the other 3 of the top 4 are from the two year chart.
While that isn’t a big deal given the data on sentiment below covers all of these areas, it is something to consider in the near-term, as many of these levels could have fallen out of favor over time & it should be approached with caution heading into the next few weeks.
IWM has support at the $177.61 (2 Year Chart, Volume Sentiment: Buyers, 1.8:1), $171.73 (Volume Sentiment: Buyers, 1.84:1), $164.61 (2 Year Chart, Volume Sentiment: Sellers, 1.4:0*) & $158.85/share (2 Year Chart, Volume Sentiment: NULL, 0:0*) price levels, with resistance at the $188.26 (10 Day Moving Average, Volume Sentiment: Buyers, 1.32:1), $189.17 (Volume Sentiment: Buyers, 1.32:1), $195.01 (Volume Sentiment: Buyers, 1.47:1) & $195.56/share (Volume Sentiment: Buyers, 1.47:1) price levels.
IWM ETF’s Price Level:Volume Sentiment Over The Past ~2-3 Years
DIA ETF – SPDR Dow Jones Industrial Average ETF’s Technical Performance Over The Past Year
Their RSI is at 44.86 trending higher towards the neutral 50 mark, while their MACD is trending towards the signal line with its histogram waning,
Volumes were +144.91% above the prior year’s average level (8,054,000 vs. 3,288,492), which like the aforementioned examples isn’t exactly a vote of confidence.
DIA’s week was highly similar to the three above examples & as a result it’s really not worth diving into deeply, given the blue chip index has been the most resilient of the bunch over the past few years.
The same issue apply, we can’t form a base to spring upward from without an increase in advancing volume, and last week was still most declining volume.
DIA has the safest chart from a support perspective, but when all’s breaking down it’s not necessarily something to be bragging about…
My eyes are peeled for the $366.32 support level, it’s where over the past ~4-5 years Buyers have stepped in strongly, but it’s the most recent support level & coincidentally the lowest on their one year chart… not inspiring in the least & as such it’s worth watching this week for a test & a potential breakdown, as if it breaks down it’s going to be a harbinger of more big issues to come.
DIA has support at the $400.97 (10 Day Moving Average, Volume Sentiment: Buyers, 1.22:1), $396.59 (Volume Sentiment: Sellers, 1.75:1), $395.11 (Volume Sentiment: Buyers, 2.33:1) & $393.57/share (Volume Sentiment: Buyers, 2.33:1) price levels, with resistance at the $406.47 (Volume Sentiment: Buyers, 3.17:1), $407.35 (Volume Sentiment: Buyers, 3.17:1), $413.42 (Volume Sentiment: Sellers, 3.75:1) & $416.93/share (Volume Sentiment: Buyers, 1.63:1) price levels.
DIA ETF’s Price Level:Volume Sentiment Over The Past ~4-5 Years
The Week Ahead
Monday the week kicks off with Fed President Harker speaking at 6 on & Fed President Bostic speaking at 7:40 pm.
Goldman Sachs & M&T Bank report earnings on Monday morning before the session opens, followed by Applied Digital, FB Financial & Pinnacle Financial after the closing bell.
Import Price Index, Import Price minus Fuel & Empire State Manufacturing Survey data are all due for release on Tuesday morning at 8:30 am.
Tuesday morning’s earnings calls feature Johnson & Johnson, Albertson’s, Bank of America, Citigroup, Ericsson & PNC, before Fulton Financial, Hancock Whitney, Interactive Brokers, J.B. Hunt Transport & United Airlines after the session’s close.
Wednesday begins with U.S. Retail Sales & Retail Sales minus Autos at 8:30 am, followed by Industrial Production & Capacity Utilization data at 9:15 am, Business Inventories & Home Builder Confidence Index data at 10 am & Fed President Hammack speaking at 12 pm.
Abbott Labs, ASML, Autoliv, Citizens Financial Group, First Horizon, Prologis, Travelers & U.S. Bancorp all report earnings before Wednesday morning’s session, before Alcoa, Bank OZK, CSX, F.N.B., First Industrial Realty, Home Bancshares, Liberty Energy, Rexford Industrial Realty, Simmons First National, SL Green Realty, Synovus & Triumph Financial report after the closing bell.
Initial Jobless Claims, Housing Starts, Building Permits & Philadelphia Fed Manufacturing Survey data are all released Thursday at 8:30 am.
Thursday morning’s earnings calls kick off with UnitedHealth Group, Ally Financial, American Express, Badger Meter, Charles Schwab, D.R. Horton, Fifth Third, Huntington Banc, Insteel Industries, KeyCorp, Manpower, Regions Financial, Snap-On, State Street, Texas Capital & Truist.
Friday begins with Fed President Daly speaking at 8 am & there are no noteworthy earnings reports scheduled.
See you back here next week!
*** I DO NOT OWN SHARES OR OPTIONS CONTRACT POSITIONS IN SPY, QQQ, IWM OR DIA AT THE TIME OF PUBLISHING THIS ARTICLE ***