XLK, the Technology Select Sector SPDR Fund ETF has gained +31.54% over the past year, advancing +32.99% from their 52-week low in December of 2023 & sitting just -0.04% below their 52-week high (all figures exclude distributions).
This has been an interesting year for technology related stocks, as the AI craze has caused a lot of the market’s upward movement, causing investors & speculators to dive into the market in hopes of not missing the boat.
With high flying names such as Apple Inc. (AAPL), NVIDIA Corp. (NVDA), Microsoft Corp. (MSFT), Broadcom Inc. (AVGO), Salesforce Inc. (CRM), Oracle Corp. (ORCL), Cisco Systems Inc. (CSCO), Adobe Inc. (ADBE), Advanced Micro Devices (AMD) & ServiceNow Inc. (NOW) it is easy to see how they’ve enjoyed such a strong year, given that these names have dominated financial media & headlines for 2024.
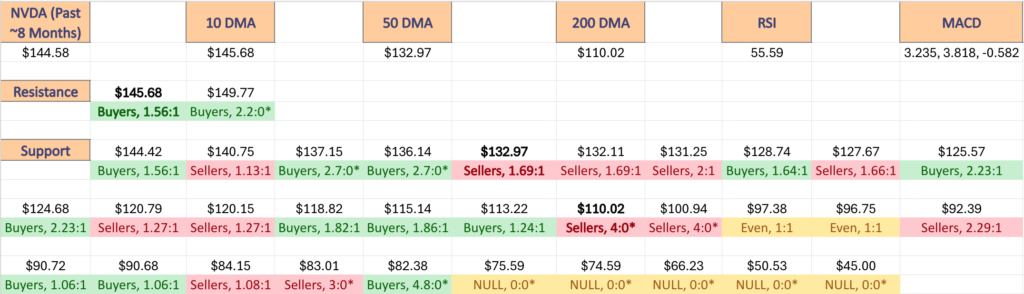
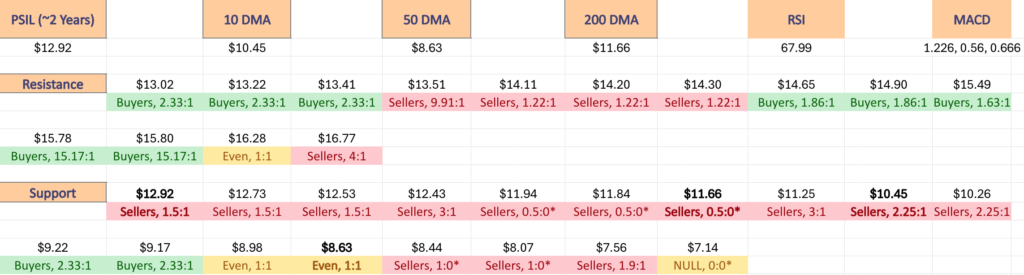
Given how close XLK is to its all time high it is worth checking in to see how market participants have behaved at their recent price levels in order to assess the strength or weakness of their current support levels in the event of a downside retest on the horizon.
Below is a brief technical analysis of XLK, as well as a price level:volume sentiment analysis of the price levels XLK has traded at over the ~2 years.
Included in this data is also their recent support & resistance levels so that readers can gain insight into how strong/weak these support/resistance levels may be in the future, based on past investor behavior.
It is not intended to serve as financial advice, but rather as an additional tool to reference while performing your own due diligence on XLK.
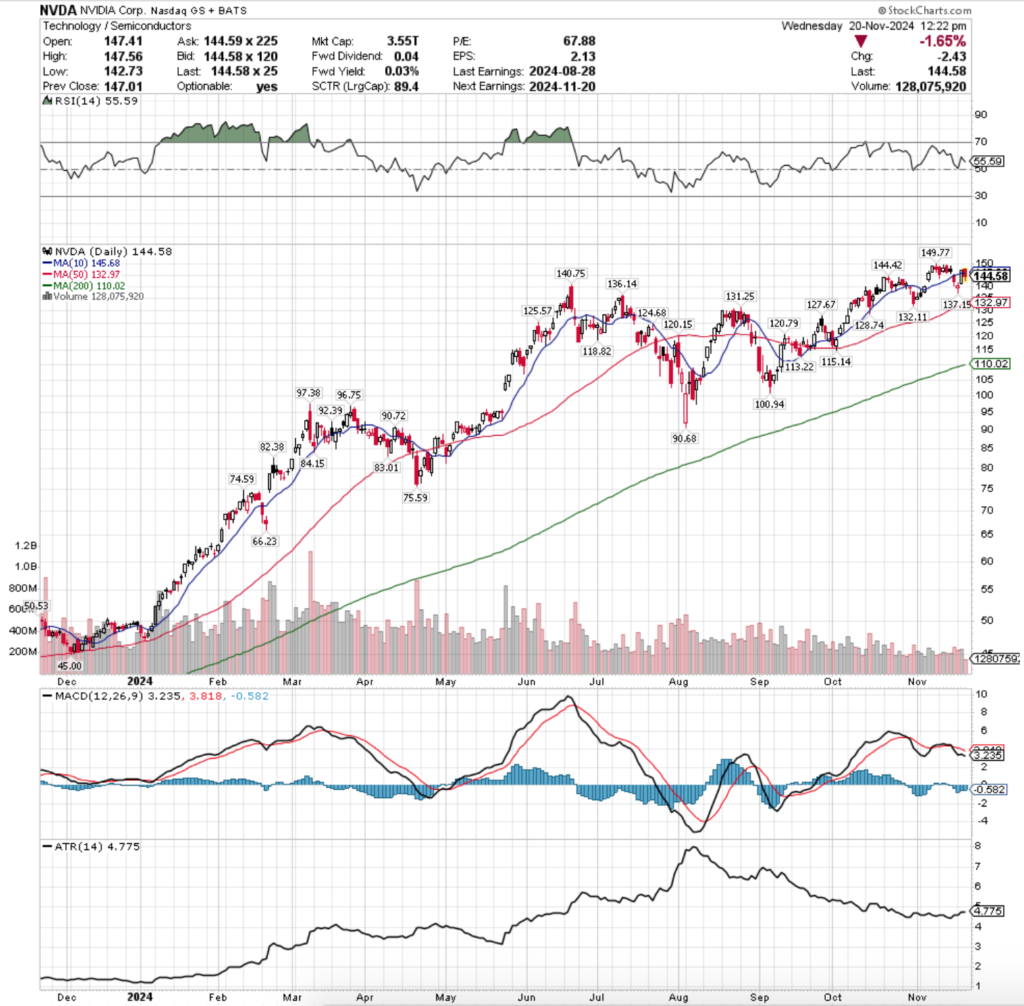
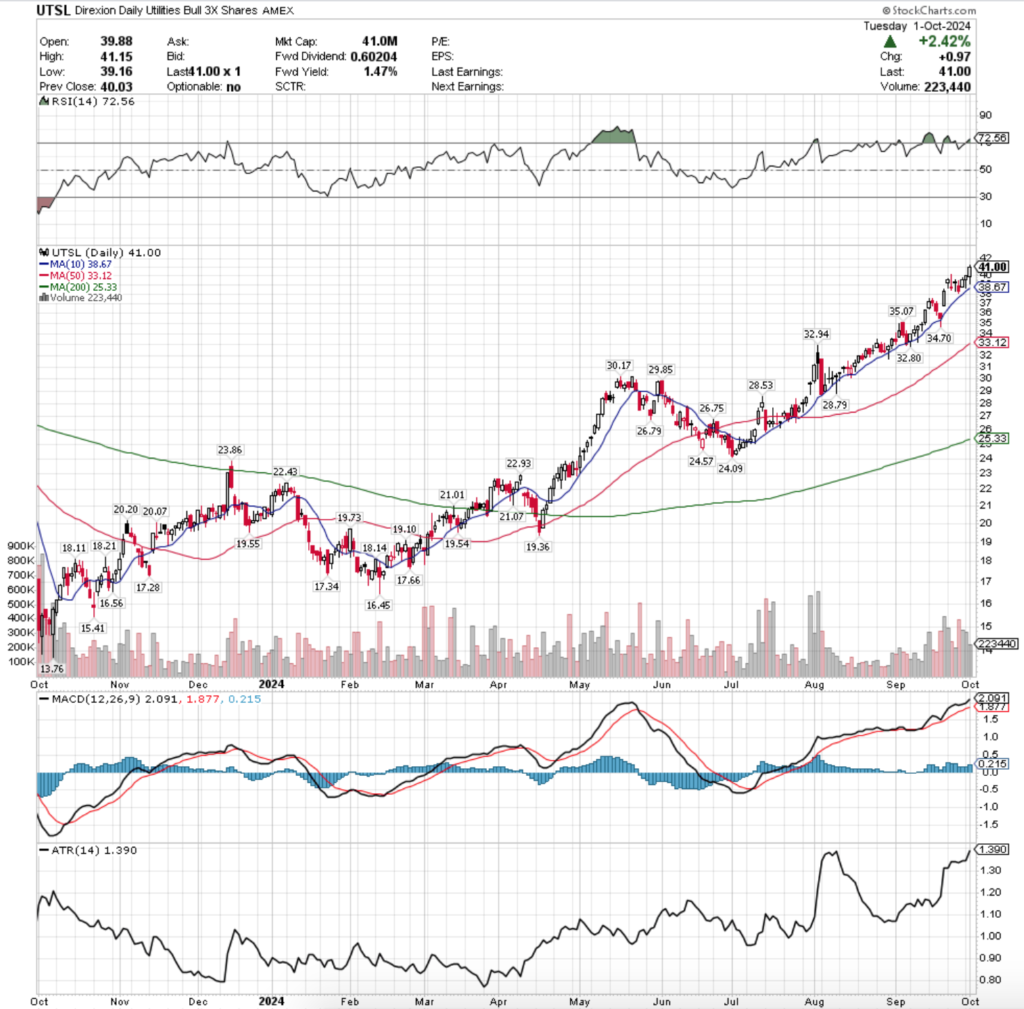
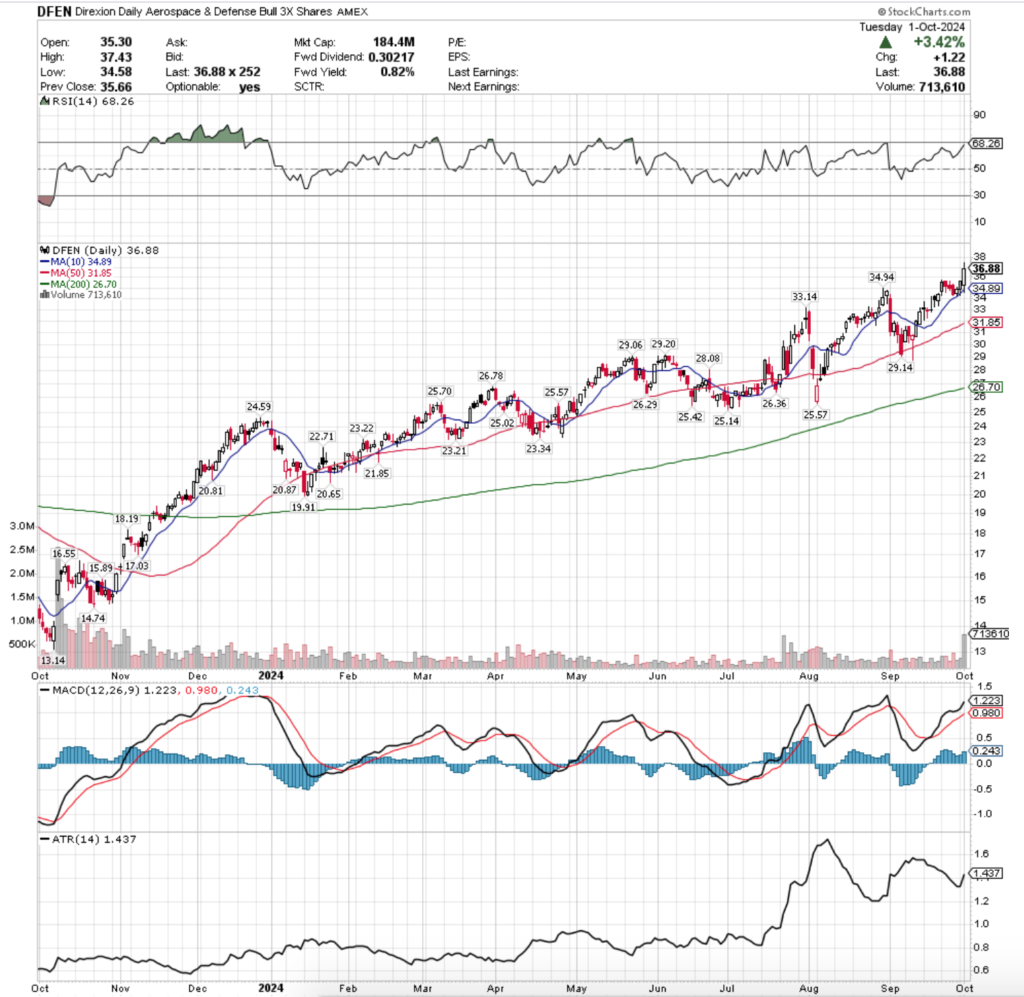
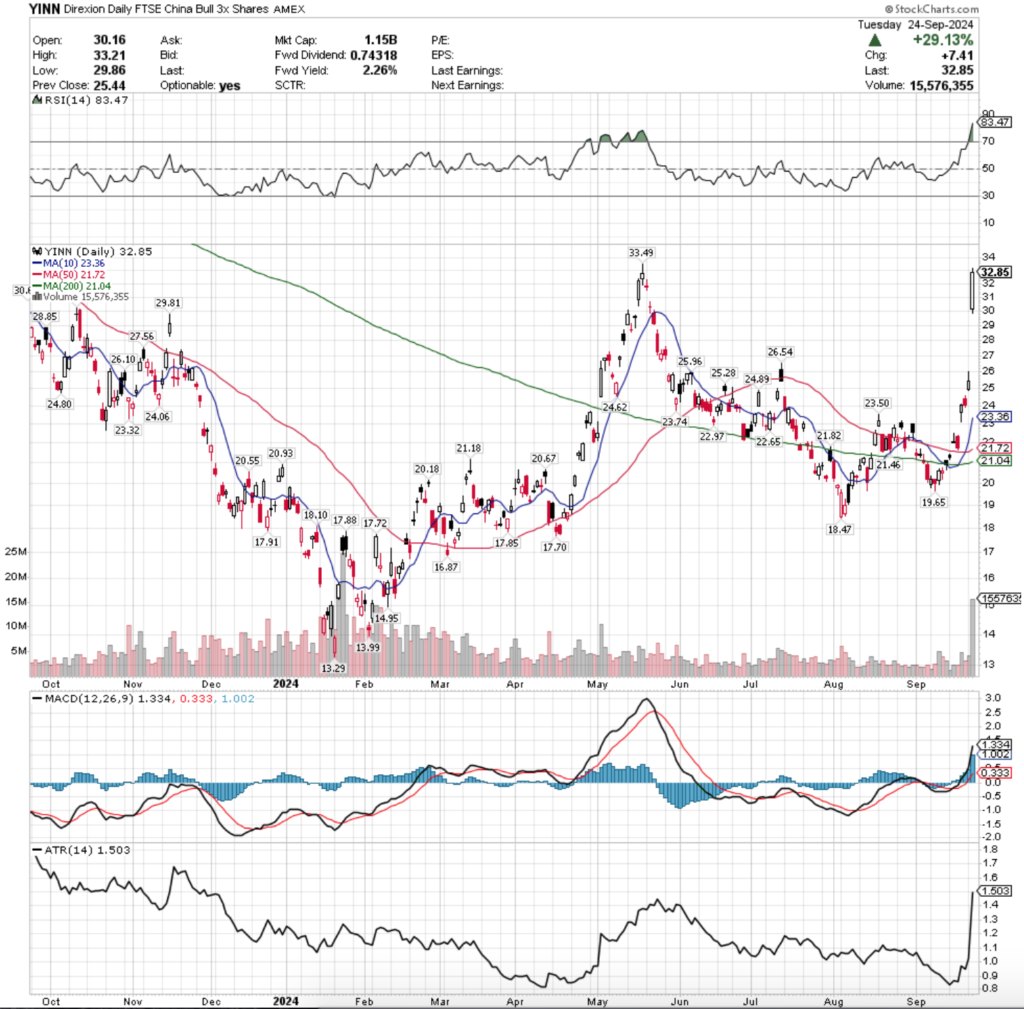
XLK, The Technology Select Sector SPDR Fund ETF’s Technical Performance Broken Down

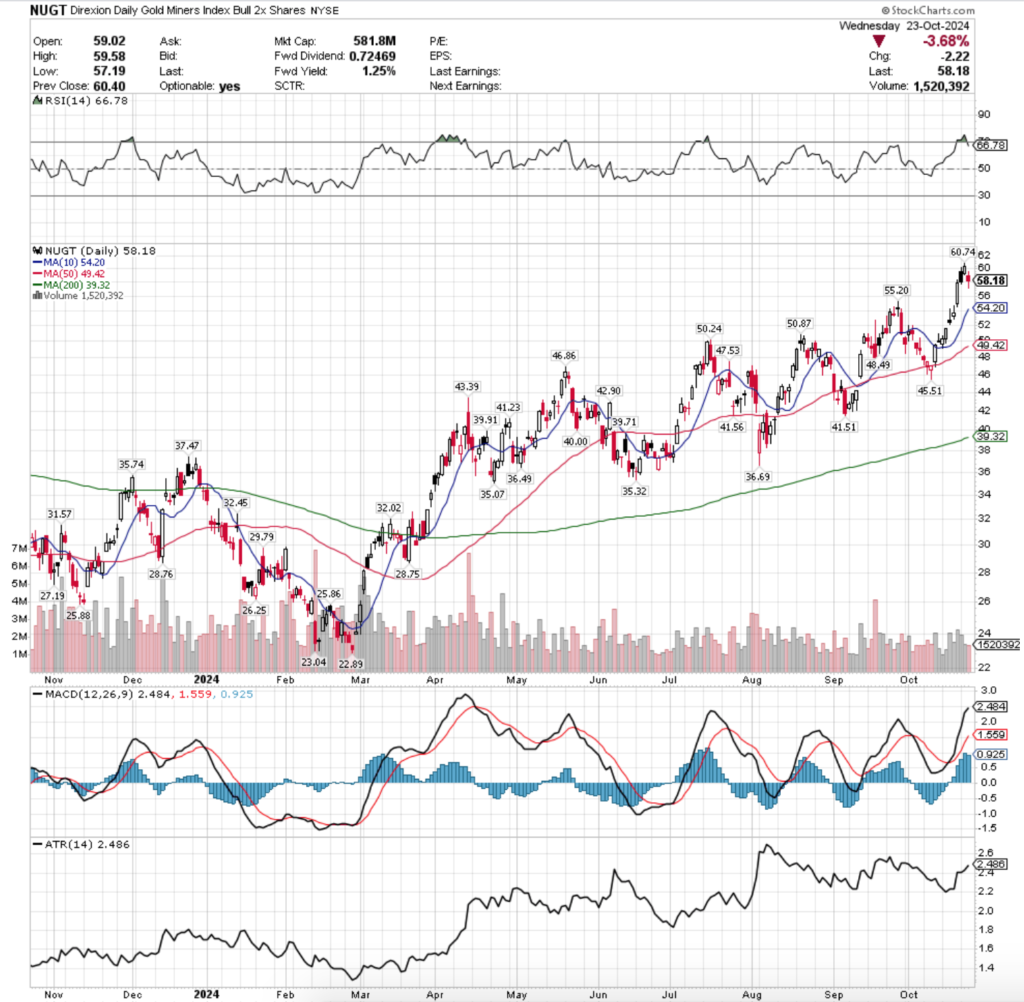
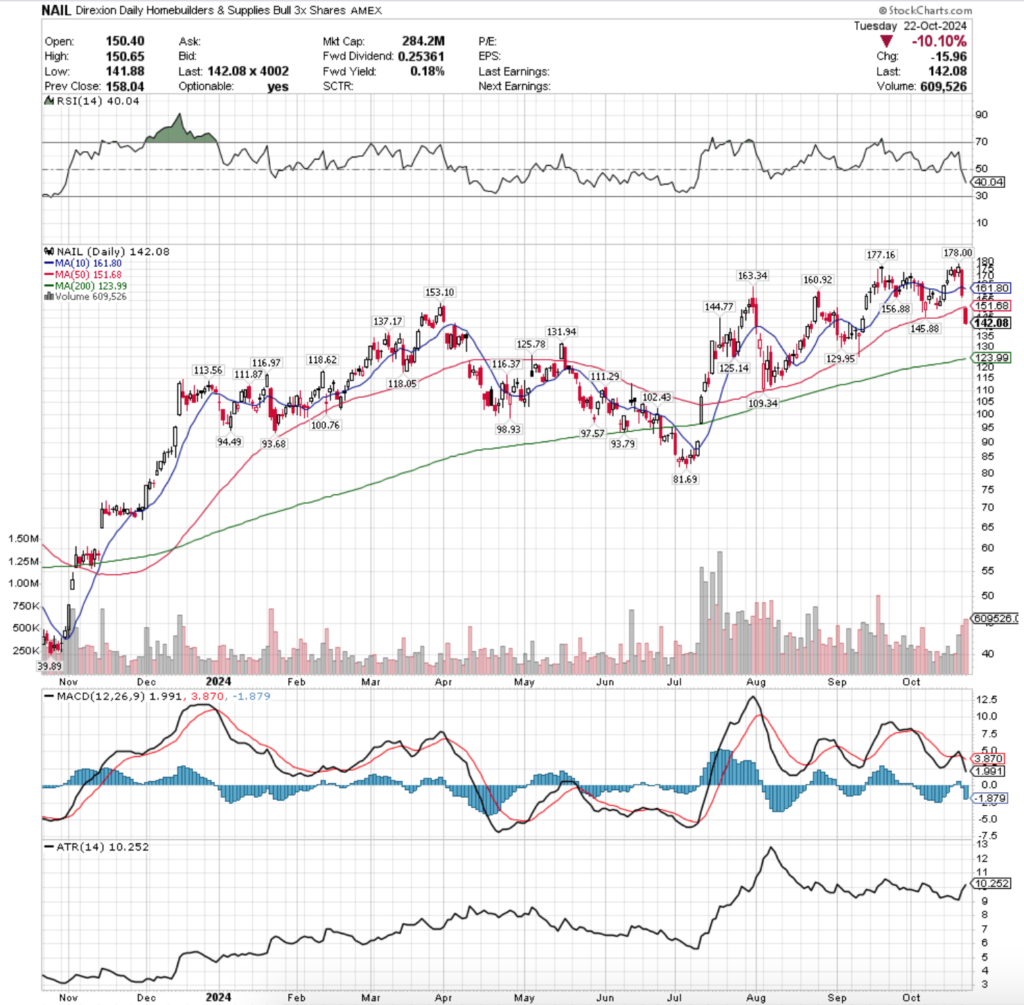
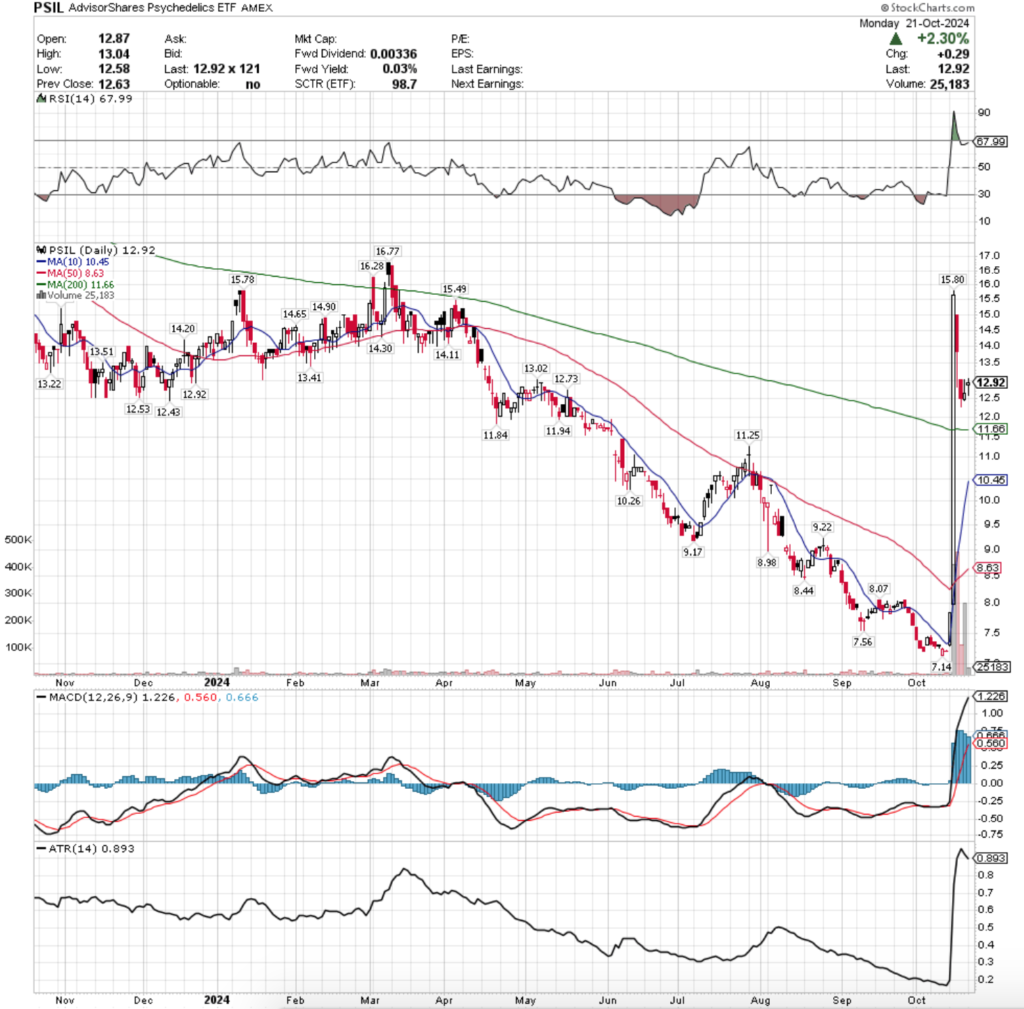
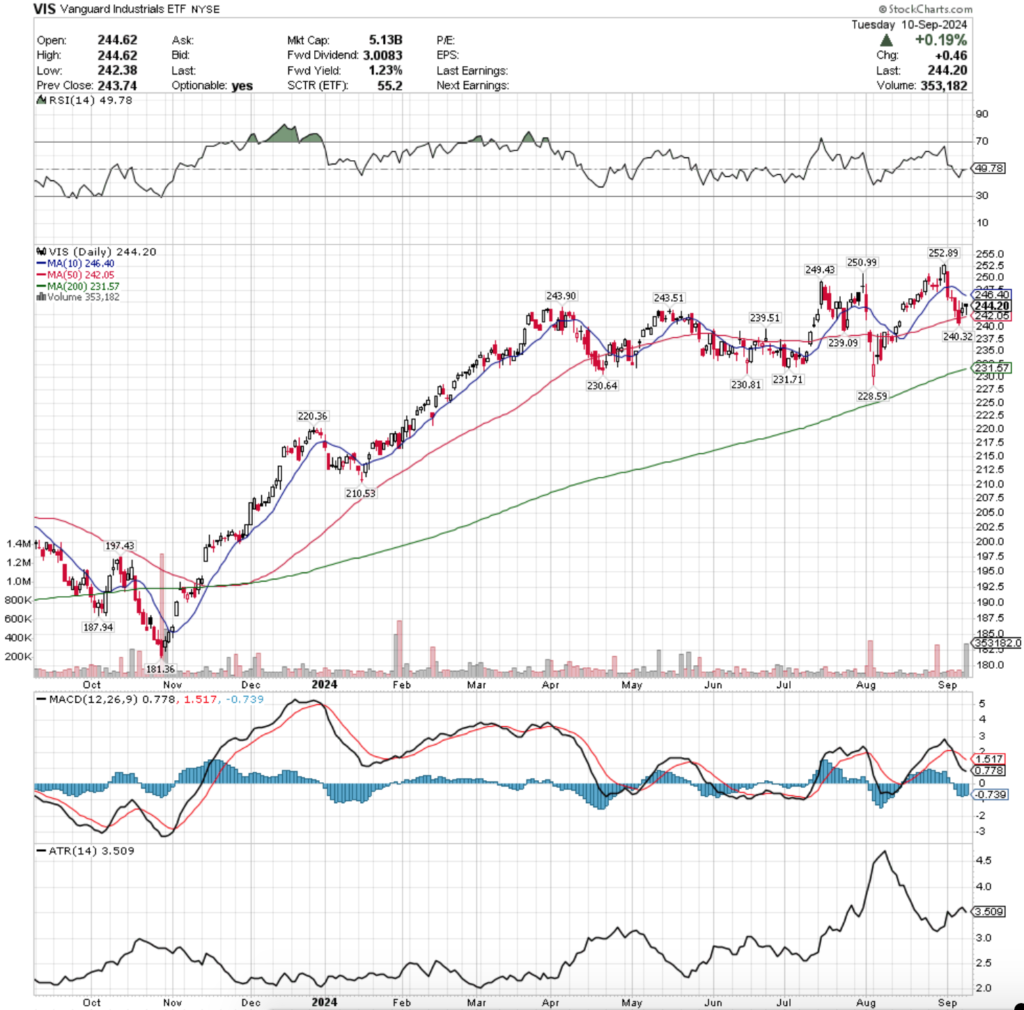
Their RSI is currently trending back down towards the neutral mark & sits at 63.9 after approaching the overbought level & their MACD is bullish but beginning to curl over bearishly today after yesterday’s gap up session.
Volumes were -33.52% below the previous year’s average over the past week & a half (3,758,571.43 vs. 5,654,110.67), as investors have become very skittish near their all-time high which was set on yesterday following a +1.83% gap up.
Last Monday kicked the shortened holiday week off on a bearish note when prices opened higher than Friday’s close, but throughout the day trended lower, eventually testing the support of the 10 day moving average before closing above it.
Tuesday’s session produced a harami cross, indicating that there was uncertainty around XLK’s price on a light volume session.
Wednesday opened on a gap lower, broke down through the 10 DMA’s support & approached the 50 DMA’s support but did not test it, instead rallying to close just below the 10 day moving average the day before Thanksgiving.
Friday naturally produced the lowest volume session of the past week & a half as it was a half day after a holiday, but XLK was able to open at the 10 DMA, test lower briefly, before powering through it & closing in the window created the day prior.
Monday continued the rally for XLK, as did Tuesday as the day’s lows were all ascending & above the 10 day moving average’s support.
Yesterday’s gap up session will be worth keeping an eye on in the coming days, particularly given that today’s session seems ready to close in a bearish harami formation, which would signal that there will likely be a closing of the window on the near-term horizon.
It will also be worth watching volume in the near term, as there will need to be some extra participation to continue marching XLK higher, and watching volume trends will make it easier to gauge when profits will be taken if prices are unable to continue higher.
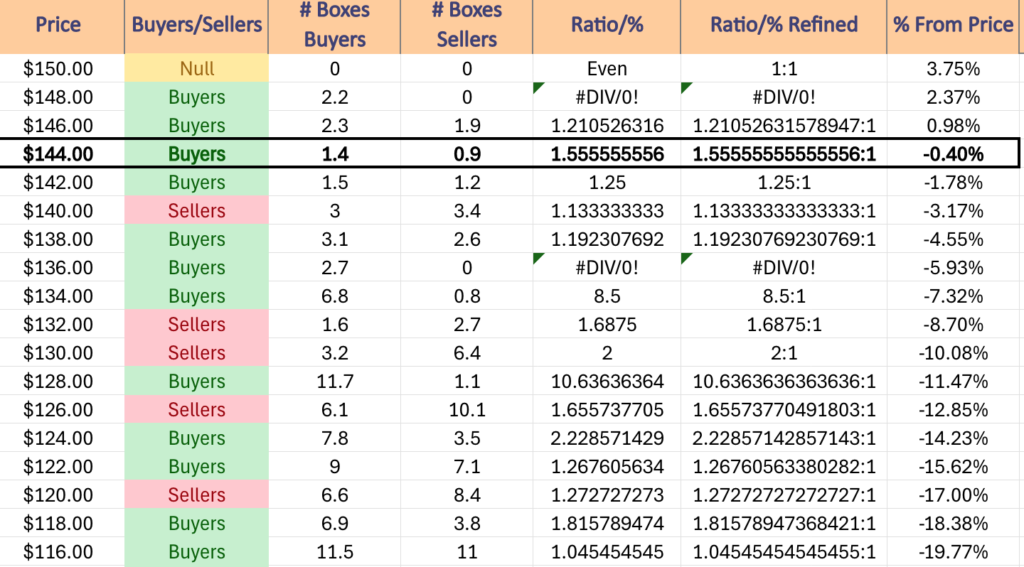
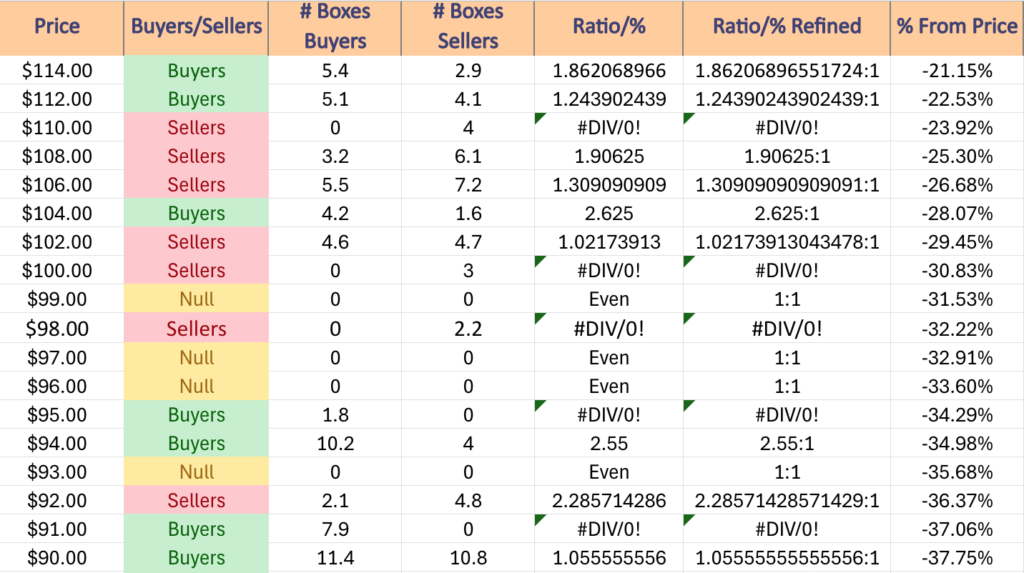
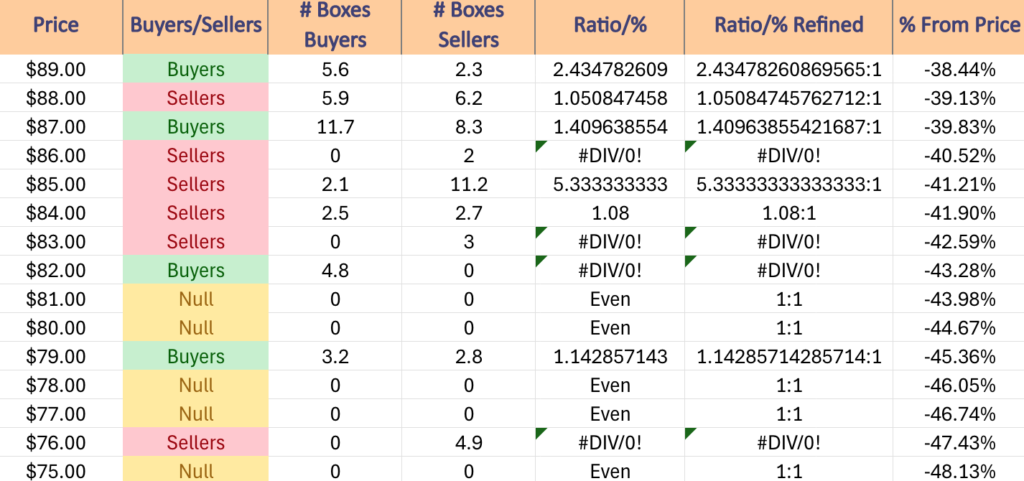
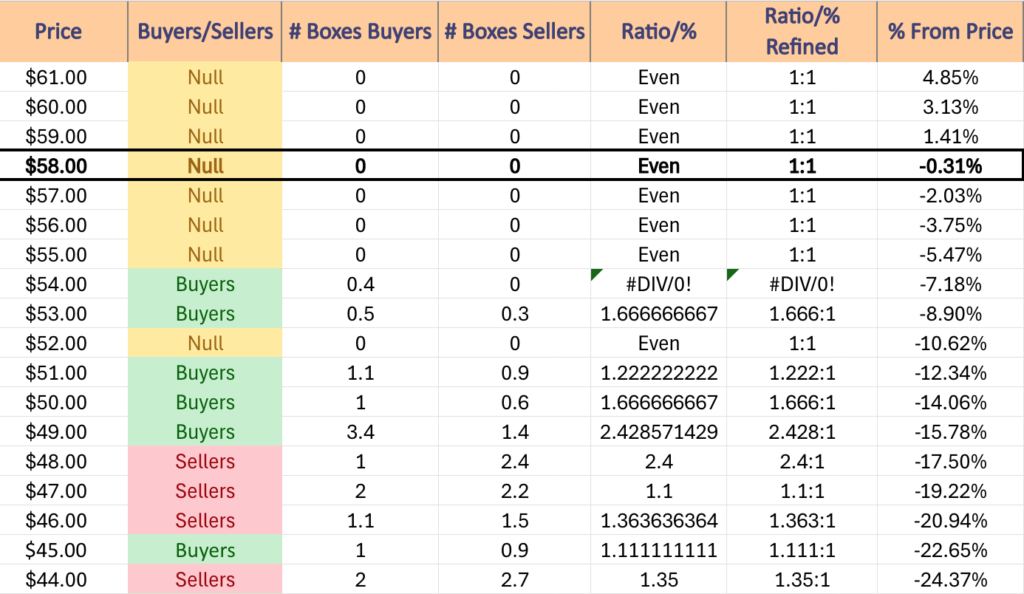
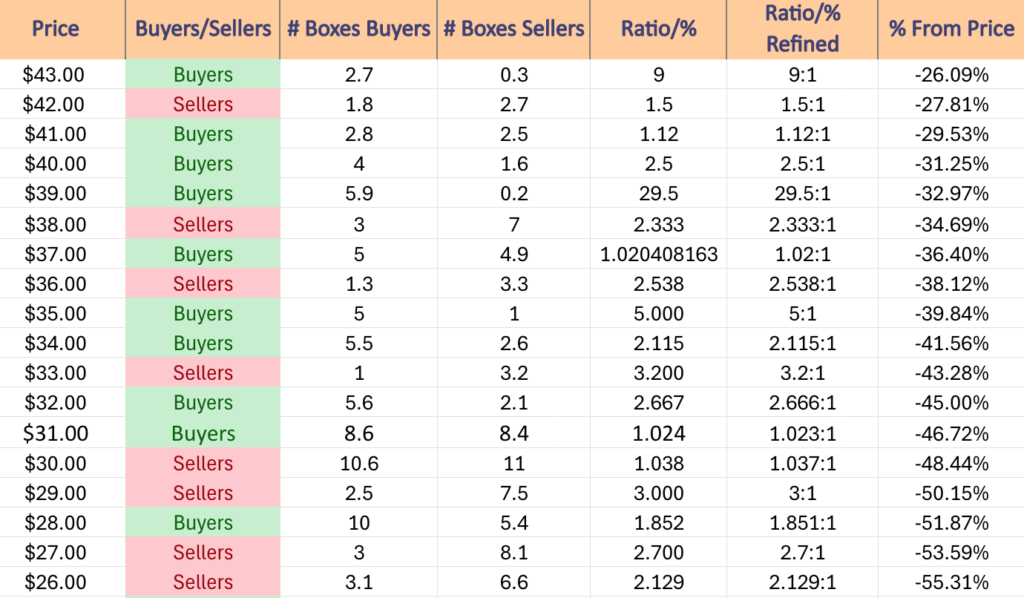
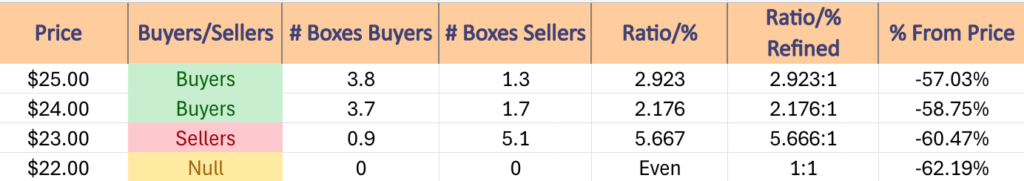
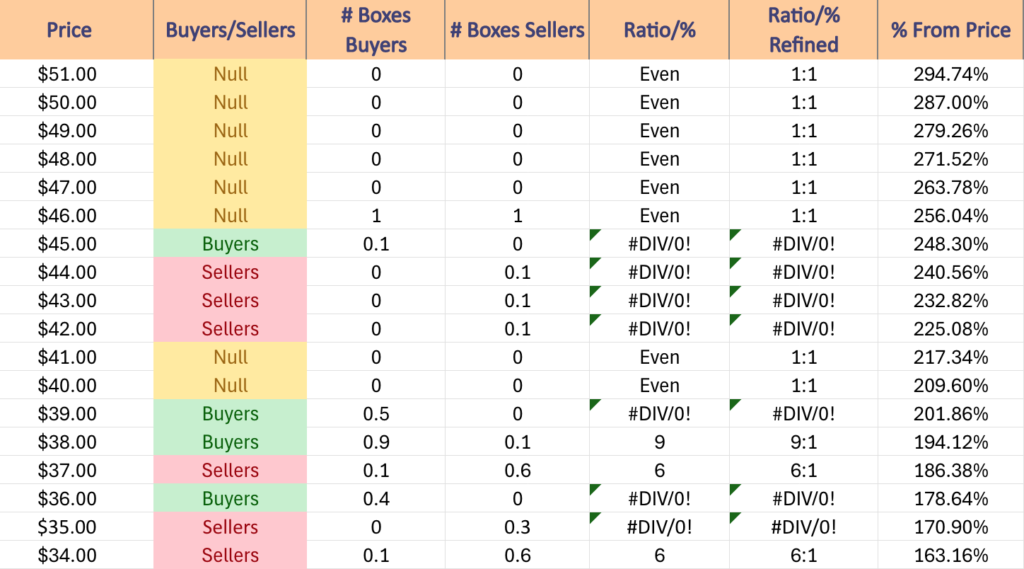
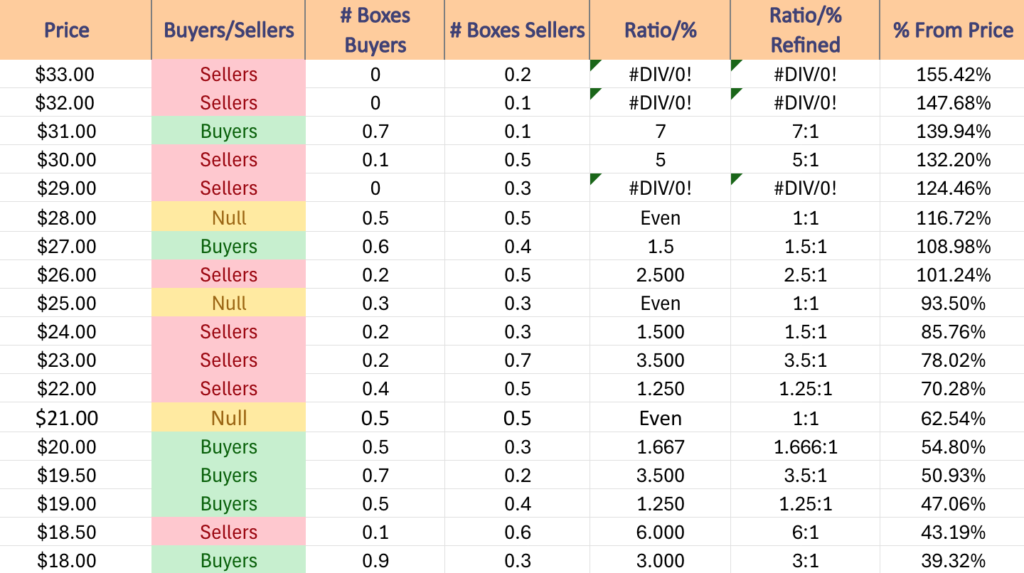
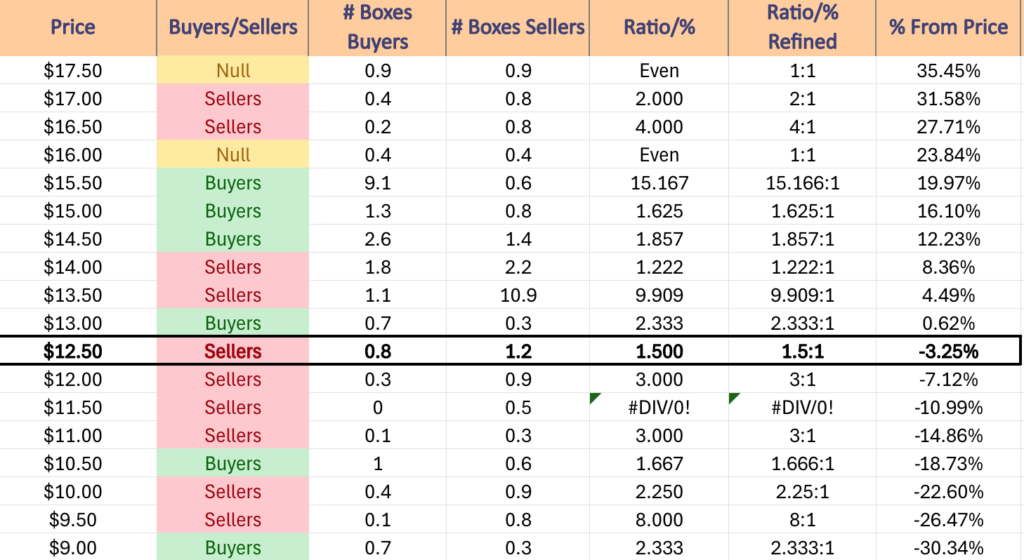
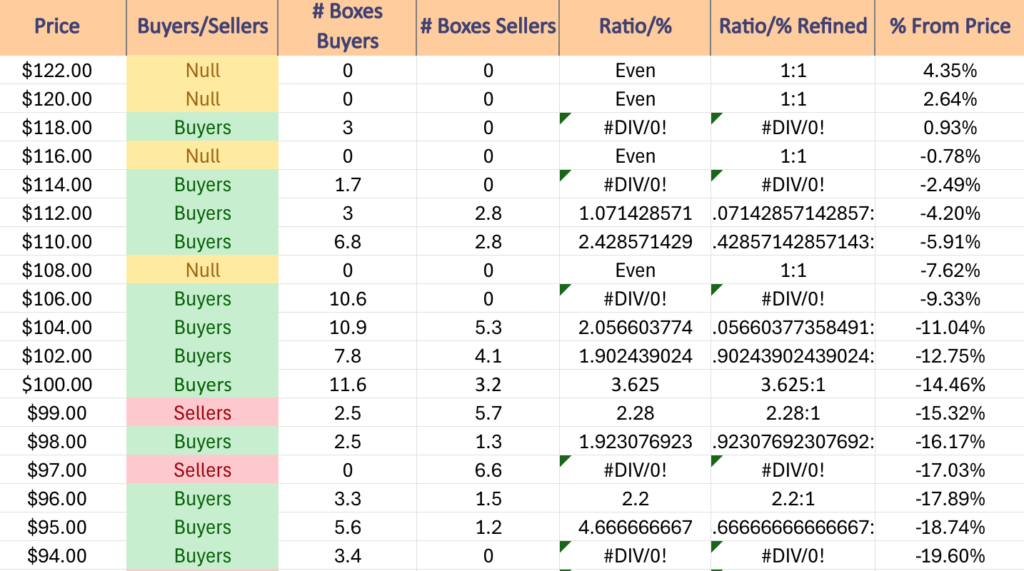
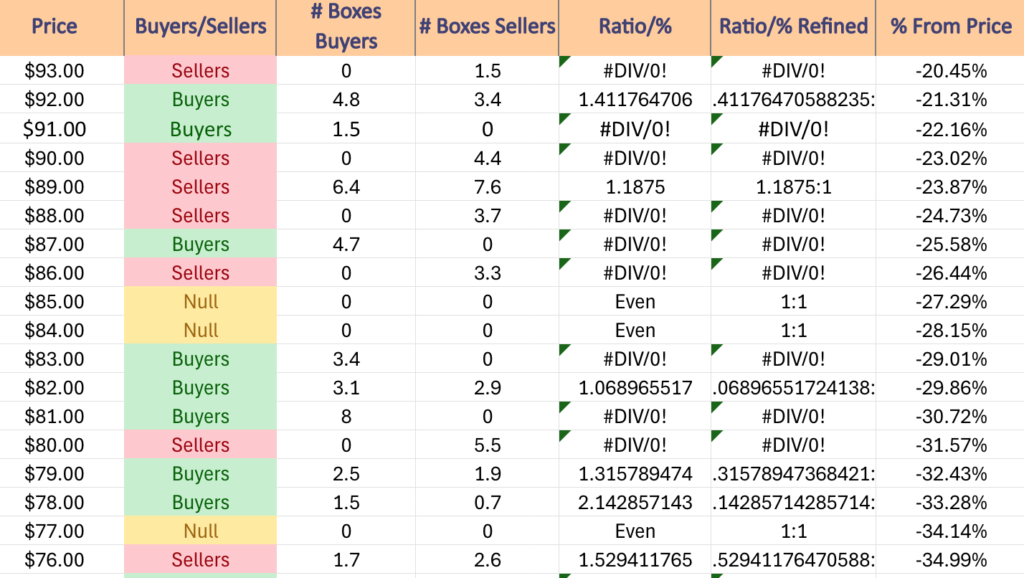
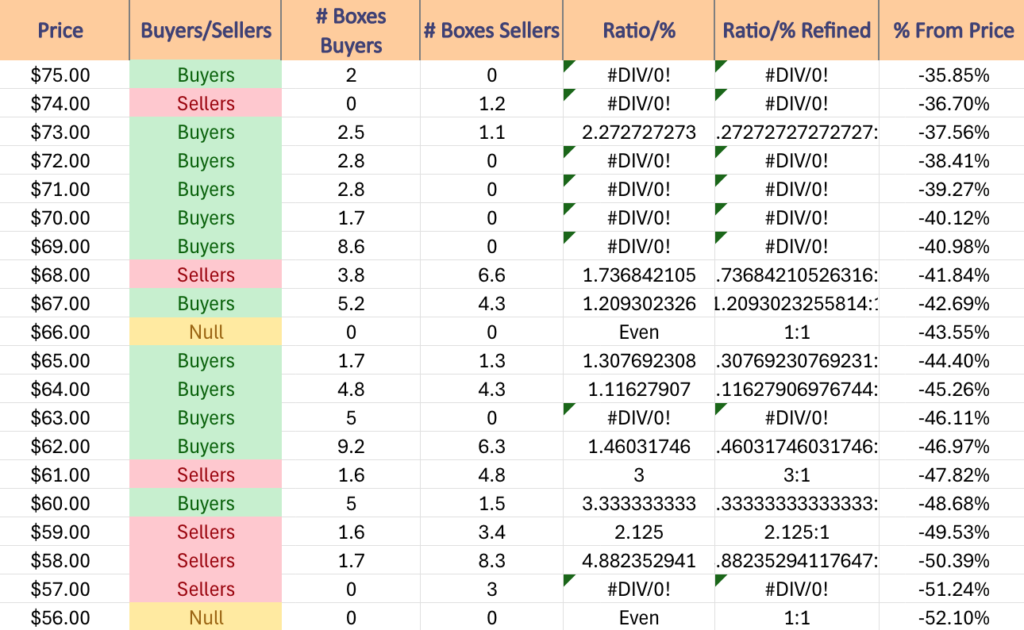
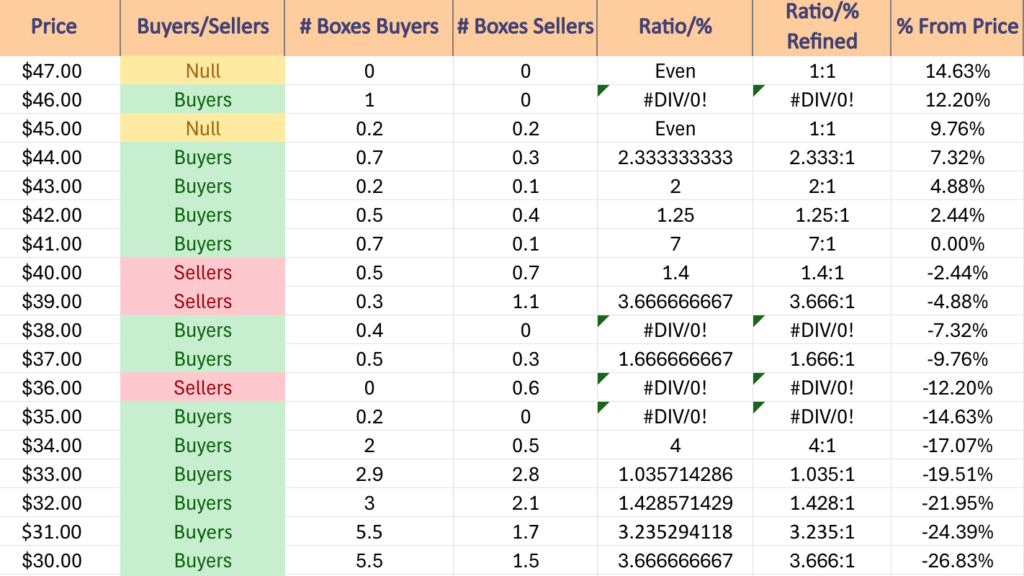
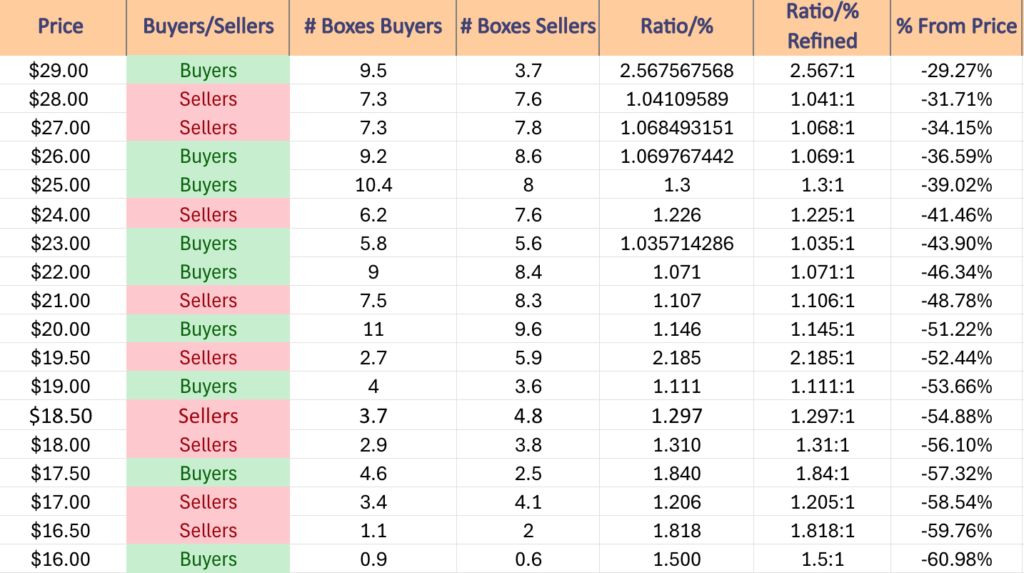
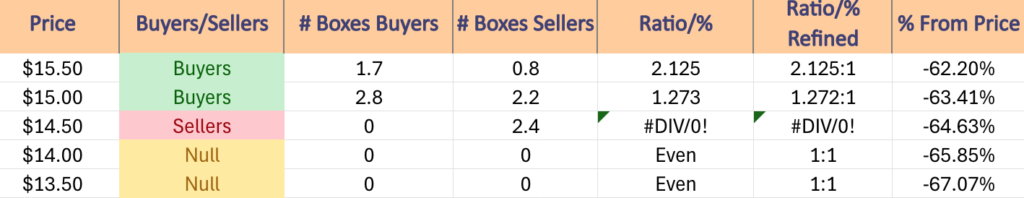
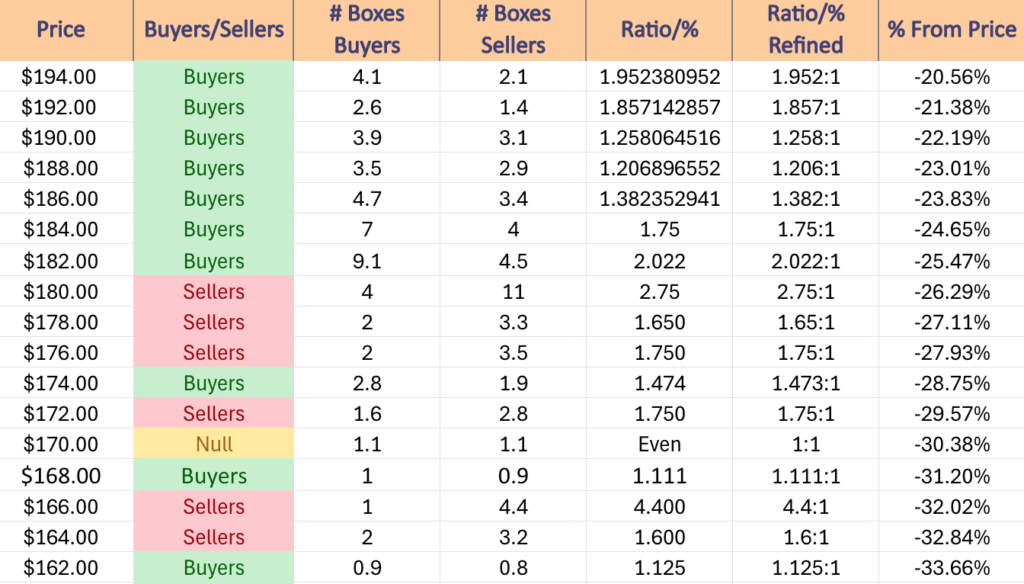
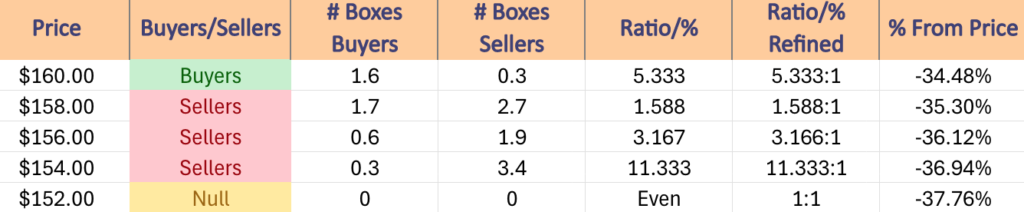
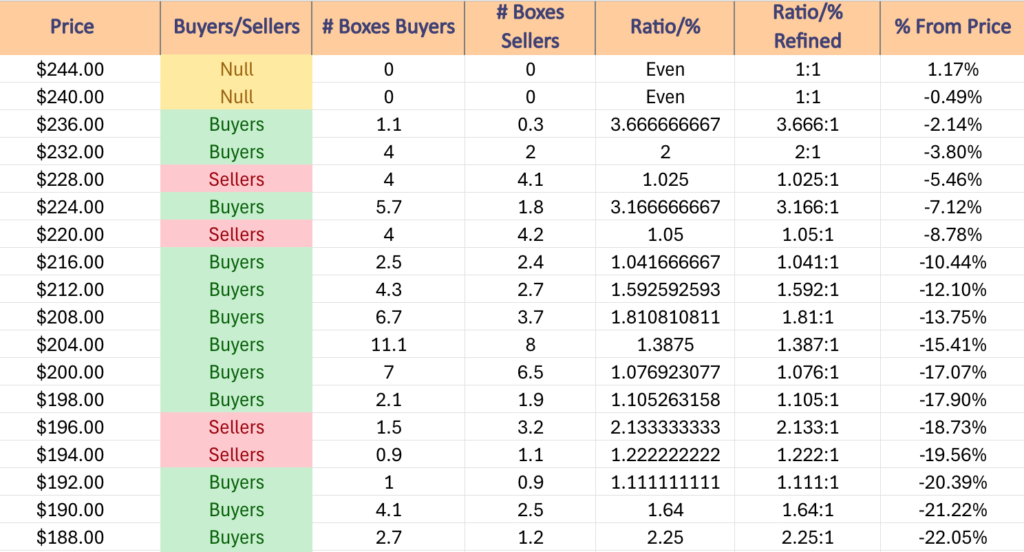
The section below lays out how the buyers & sellers have met at each price level XLK has traded at over the past ~2 years.
While it is not indicative of future performance, history repeats itself & or rhymes & this can be used as a barometer to anticipate how market participants may behave when faced with these price levels again.
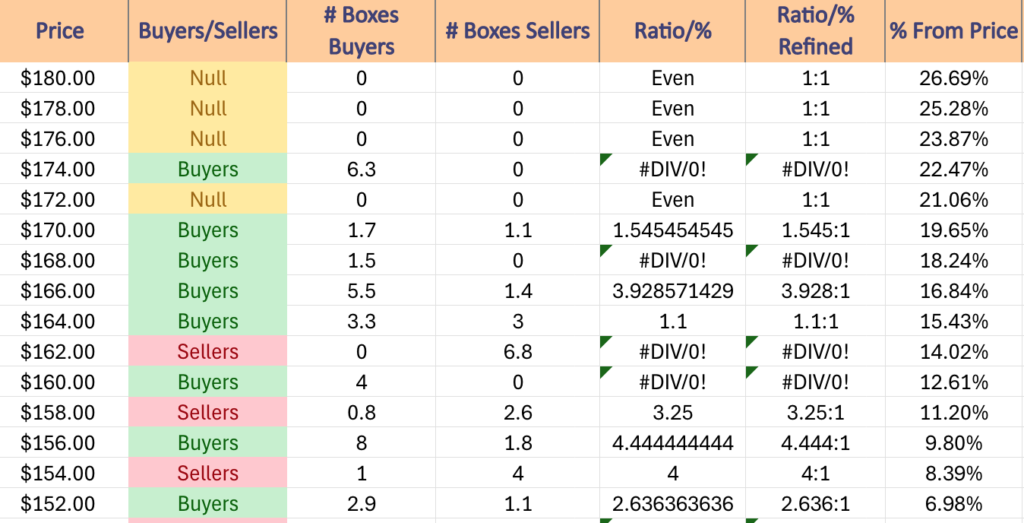
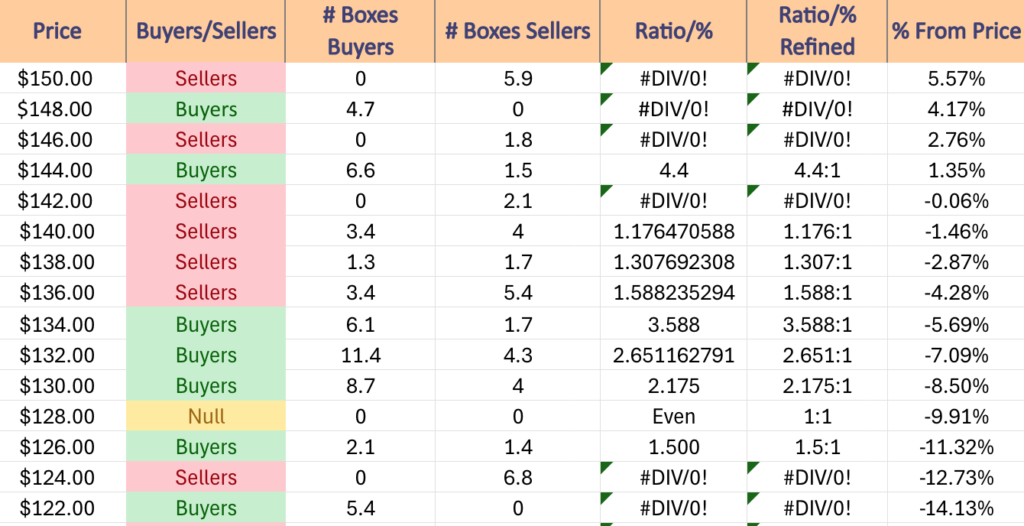
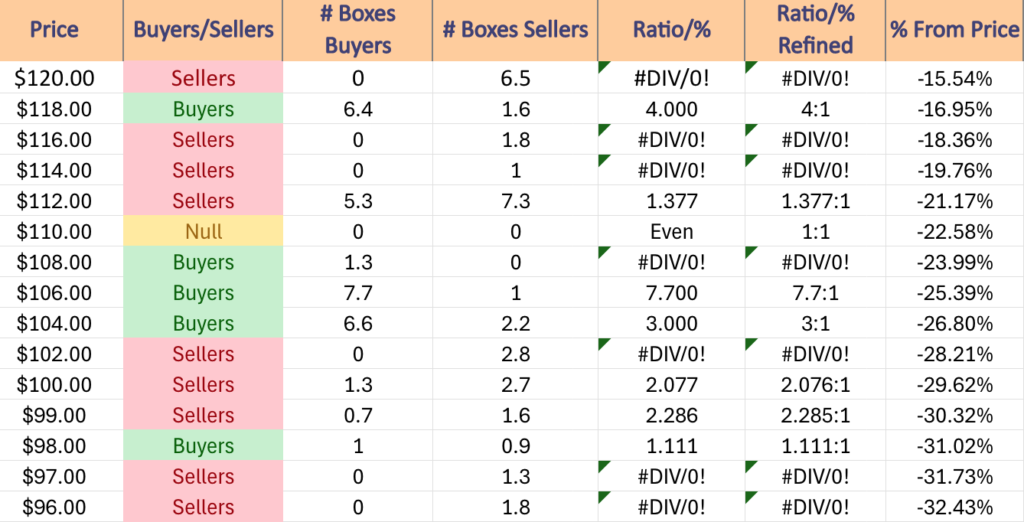
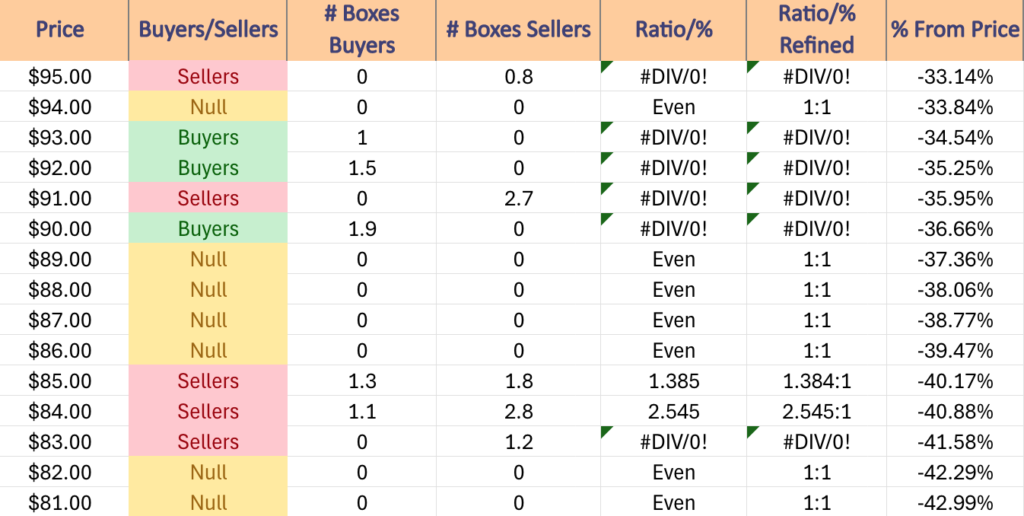
Price Level:Volume Sentiment Analysis For XLK, The Technology Select Sector SPDR Fund ETF
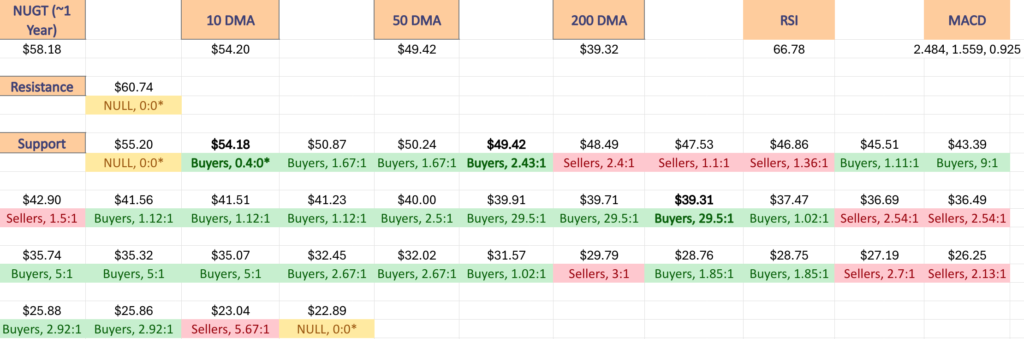
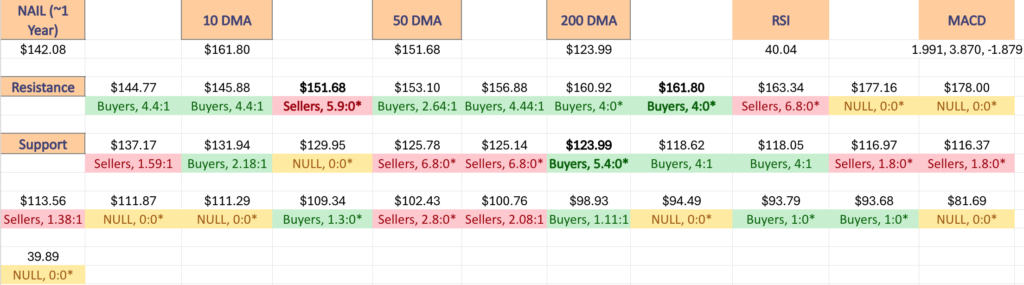
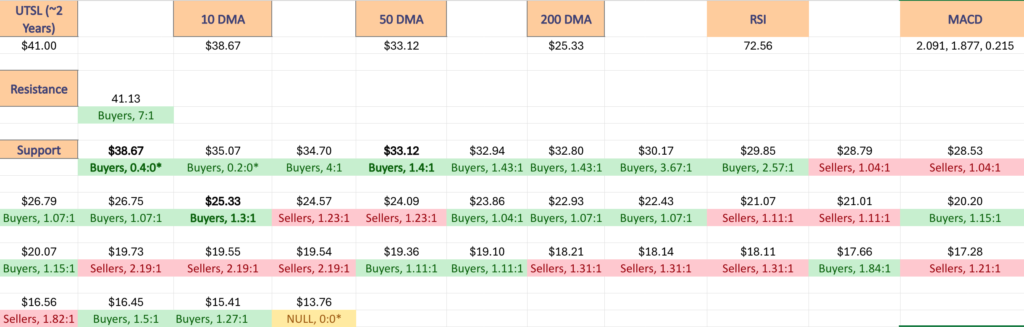
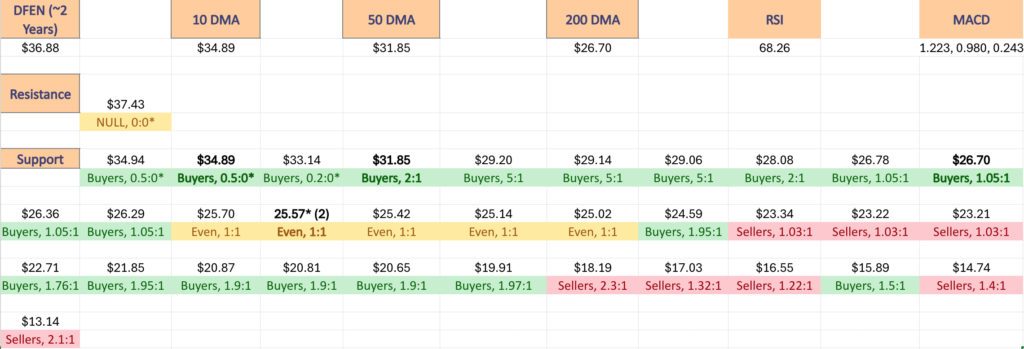
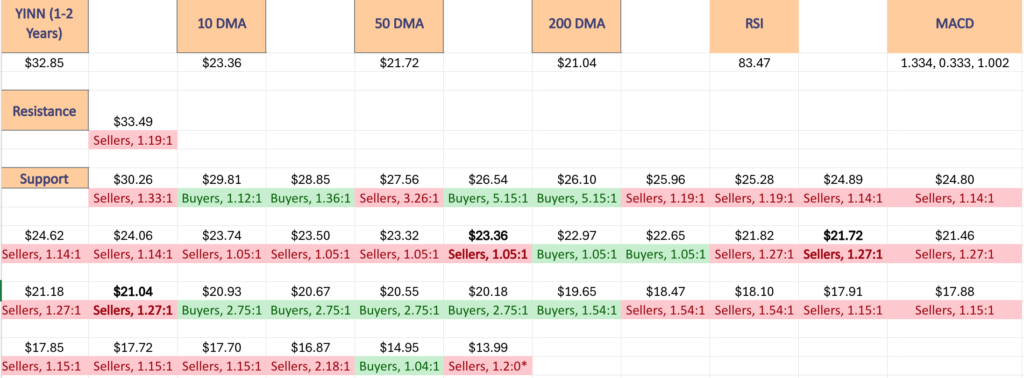
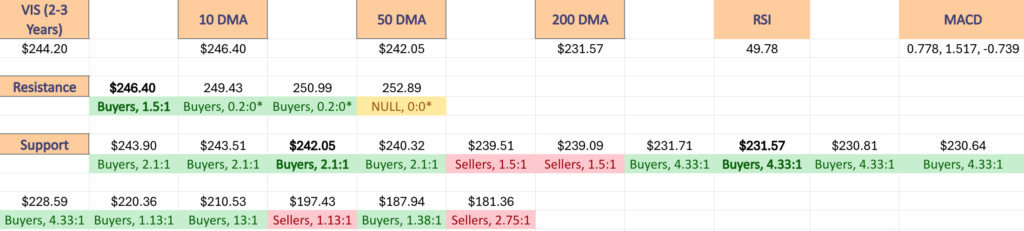
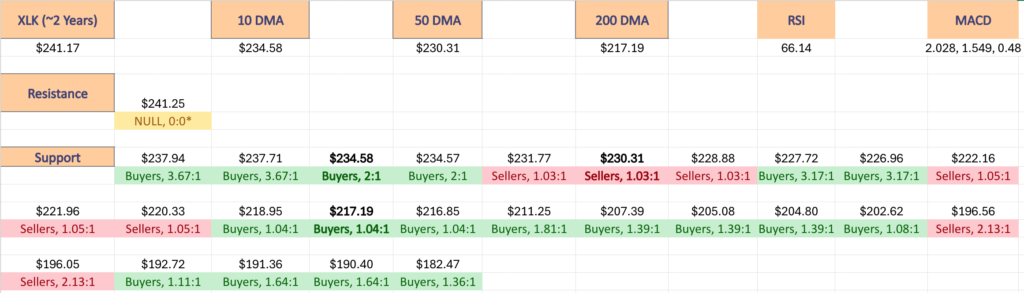
The top table below shows the support & resistance levels of XLK from the past year’s chart, as well as their price level:volume sentiment at each from data covering the past ~2 years, using Wednesday 11/20/24’s mid-session price for their price & moving averages/other technicals.
The moving averages are denoted with bold.
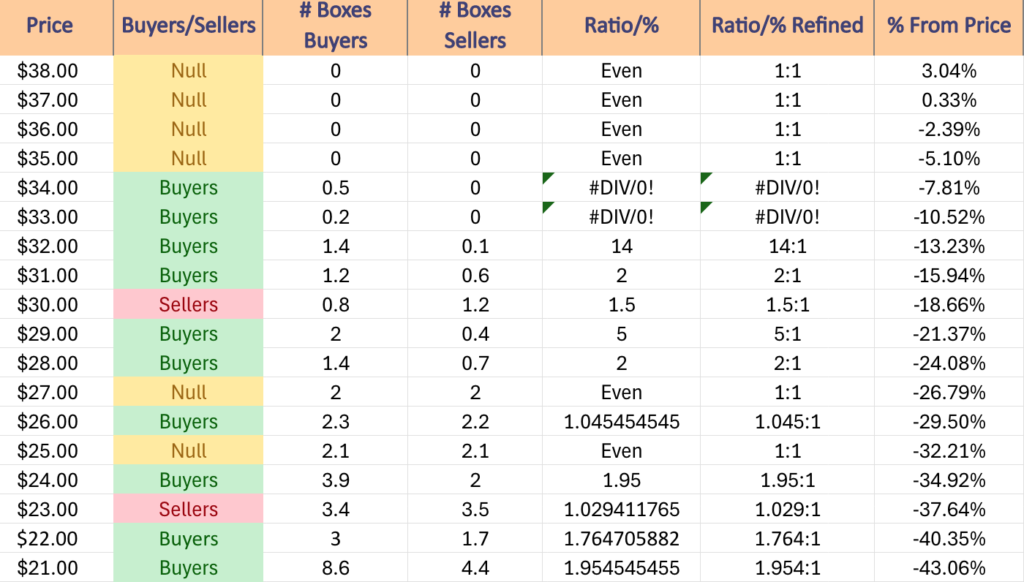
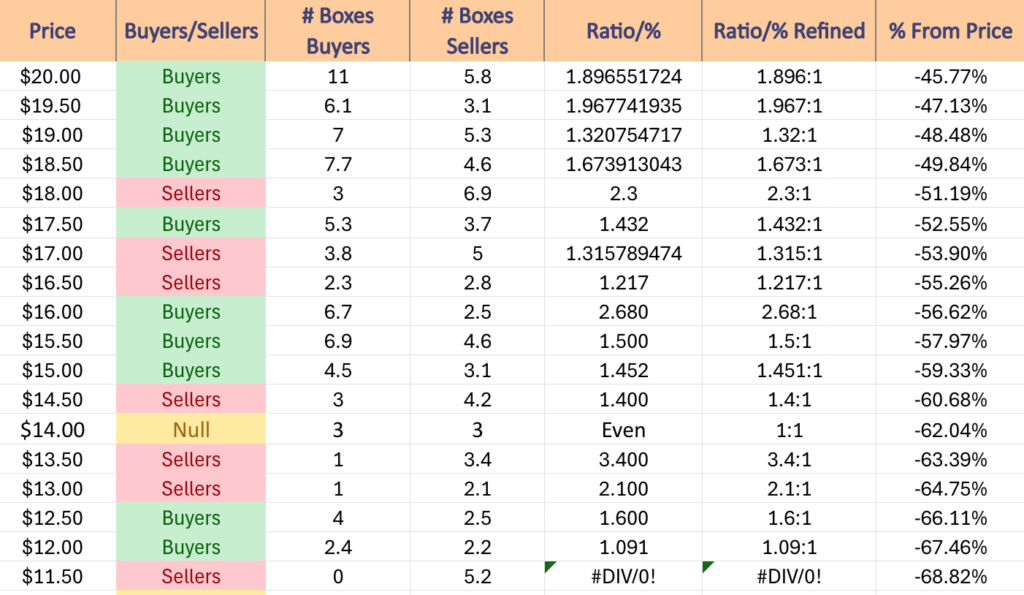
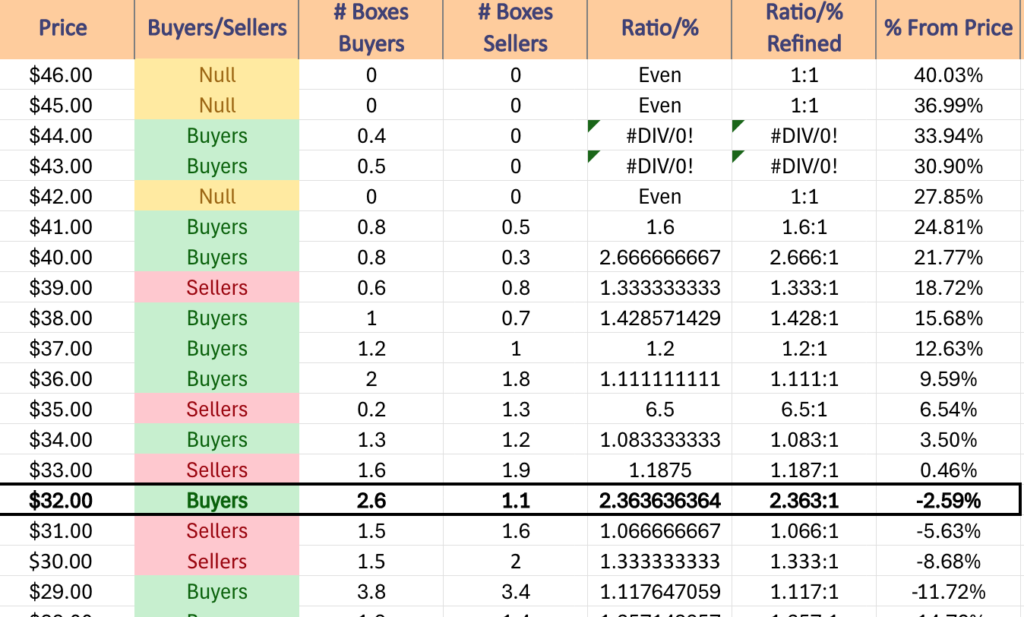
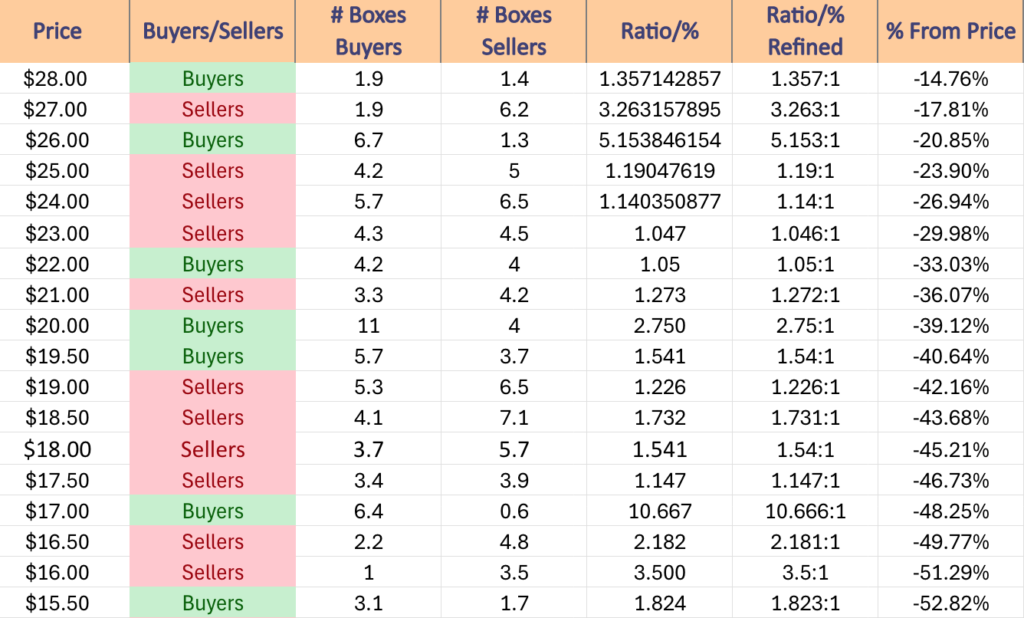
The next charts show the volume sentiment at each individual price level XLK has traded at over the past ~2 years.
Beneath them is a copy & pasteable list of the same data, where the support/resistance levels are denoted in bold.
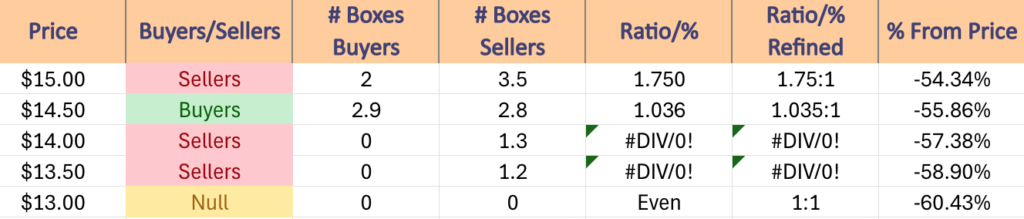
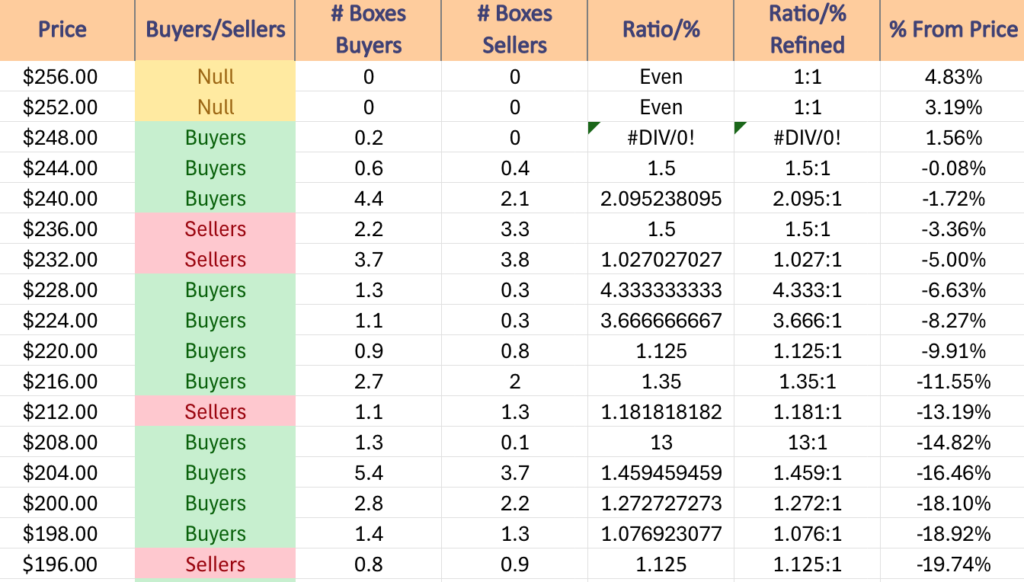
All ratios with “0” in the denominator are denoted with a “*”.
NULL values are price levels that had limited trading volume, whether it be due to gaps, quick advances or they are at price extremes; in the event that they are retested & there is more data they would have a distinct “Buyers”, “Sellers” or “Even” title.
This is not intended as financial advice, but rather another tool to consider when performing your own research & due diligence on XLK.
$244 – NULL – 0:0*, +1.17% From Current Price Level
$240 – NULL – 0:0*, -0.49% From Current Price Level – Current Price Level*
$236 – Buyers – 3.67:1, -2.14% From Current Price Level
$232 – Buyers – 2:1, -3.8% From Current Price Level – 10 Day Moving Average*
$228 – Sellers – 1.03:1, -5.46% From Current Price Level – 50 Day Moving Average*
$224 – Buyers – 3.17:1, -7.12% From Current Price Level
$220 – Sellers – 1.05:1, -8.78% From Current Price Level
$216 – Buyers – 1.04:1, -10.44% From Current Price Level – 200 Day Moving Average*
$212 – Buyers – 1.59:1, -12.1% From Current Price Level
$208 – Buyers – 1.81:1, -13.75% From Current Price Level
$204 – Buyers – 1.39:1, -15.41% From Current Price Level
$200 – Buyers – 1.08:1, -17.07% From Current Price Level
$198 – Buyers – 1.11:1, -17.9% From Current Price Level
$196 – Sellers – 2.13:1, -18.73% From Current Price Level
$194 – Sellers – 1.22:1, -19.56% From Current Price Level
$192 – Buyers – 1.11:1, -20.39% From Current Price Level
$190 – Buyers – 1.64:1, -21.22% From Current Price Level
$188 – Buyers – 2.25:1, -22.05% From Current Price Level
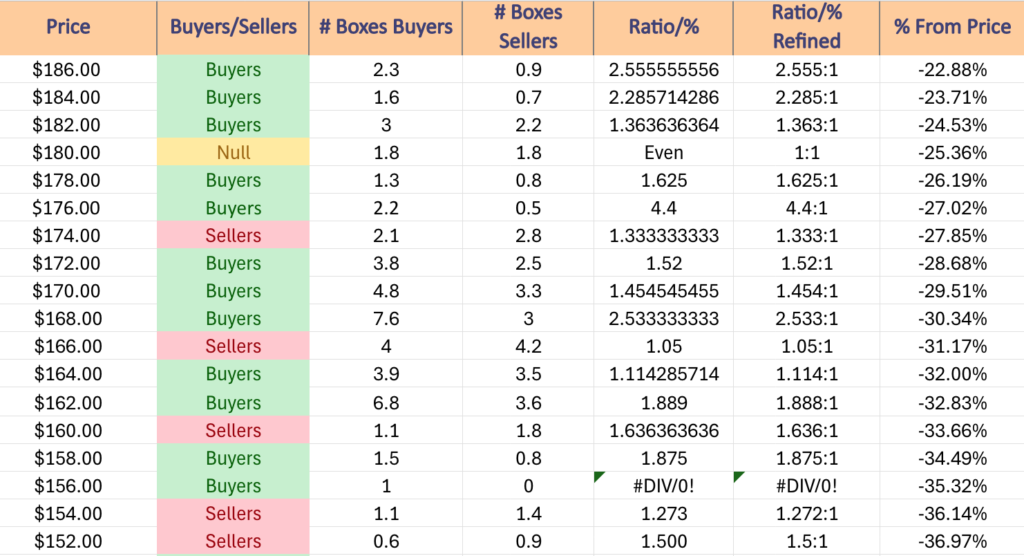
$186 – Buyers – 2.56:1, -22.88% From Current Price Level
$184 – Buyers – 2.29:1, -23.71% From Current Price Level
$182 – Buyers – 1.36:1, -24.53% From Current Price Level
$180 – Even – 1:1, -25.36% From Current Price Level
$178 – Buyers, 1.63:1, -26.19% From Current Price Level
$176 – Buyers – 4.4:1, -27.02% From Current Price Level
$174 – Sellers – 1.33:1, -27.85% From Current Price Level
$172 – Buyers – 1.52:1, -28.68% From Current Price Level
$170 – Buyers – 1.45:1, -29.51% From Current Price Level
$168 – Buyers – 2.53:1, -30.34% From Current Price Level
$166 – Sellers – 1.05:1, -31.17% From Current Price Level
$164 – Buyers – 1.11:1, -32% From Current Price Level
$162 – Buyers – 1.89:1, -32.83% From Current Price Level
$160 – Sellers – 1.64:1, -33.66% From Current Price Level
$158 – Buyers – 1.88:1, -34.49% From Current Price Level
$156 – Buyers – 1:0*, -35.32% From Current Price Level
$154 – Sellers – 1.27:1, -36.14% From Current Price Level
$152 – Sellers – 1.5:1, -36.97% From Current Price Level
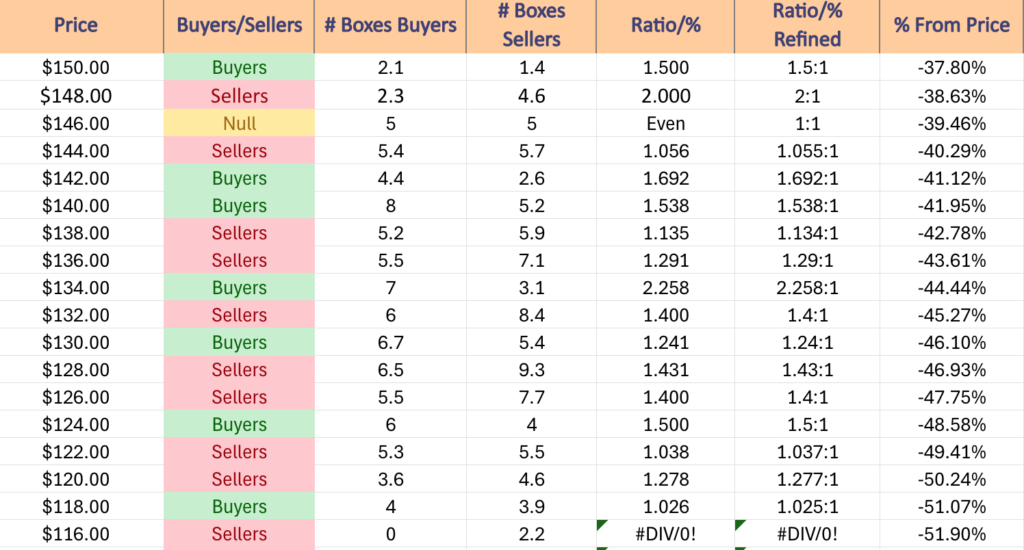
$150 – Buyers – 1.5:1, -37.8% From Current Price Level
$148 – Sellers – 1.2:1, -38.63% From Current Price Level
$146 – Even – 1:1, -39.46% From Current Price Level
$144 – Sellers – 1.06:1, -40.29% From Current Price Level
$142 – Buyers – 1.69:1, -41.12% From Current Price Level
$140 – Buyers – 1.54:1, -41.95% From Current Price Level
$138 – Sellers – 1.13:1, -42.78% From Current Price Level
$136 – Sellers – 1.29:1, -43.61% From Current Price Level
$134 – Buyers – 2.26:1, -44.44% From Current Price Level
$132 – Sellers – 1.4:1, -45.27% From Current Price Level
$130 – Buyers – 1.24:1, -46.1% From Current Price Level
$128 – Sellers – 1.43:1, -46.93% From Current Price Level
$126 – Sellers – 1.4:1, -47.75% From Current Price Level
$124 – Buyers – 1.5:1, -48.58% From Current Price Level
$122 – Sellers – 1.04:1, -49.41% From Current Price Level
$120 – Sellers – 1.28:1, -50.24% From Current Price Level
$118 – Buyers – 1.03:1, -51.07% From Current Price Level
$116 – Sellers – 2.2:0*, -51.9% From Current Price Level
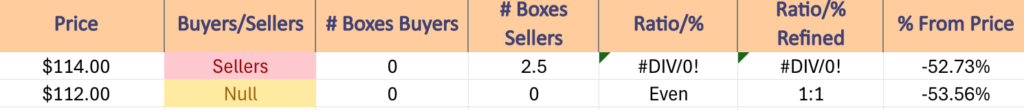
$114 – Sellers – 2.5:0*, -52.73% From Current Price Level
$112 – NULL – 0:0*, -53.56% From Current Price Level
*** I DO NOT OWN SHARES OR OPTIONS CONTRACT POSITIONS IN XLK AT THE TIME OF PUBLISHING THIS ARTICLE ***