CAI International Inc. stock trades under the ticker CAI, and offers some interesting opportunities for traders & investors alike. In addition to having good fundamentals & technicals, they also recently began issuing a dividend, which made it stand out & be worth taking a deeper look.
Breaking Down CAI International Inc. CAI Stock Fundamentals
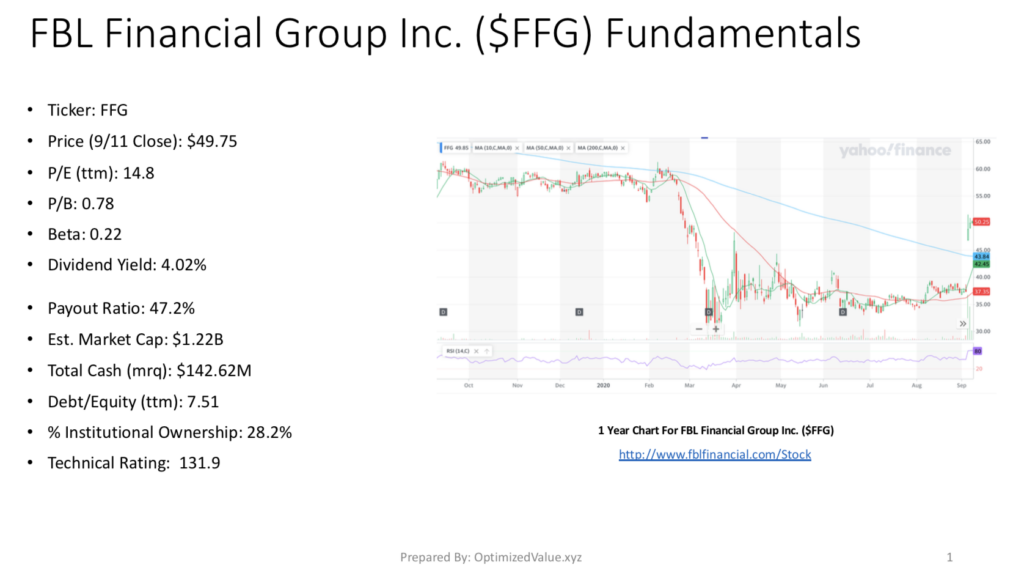
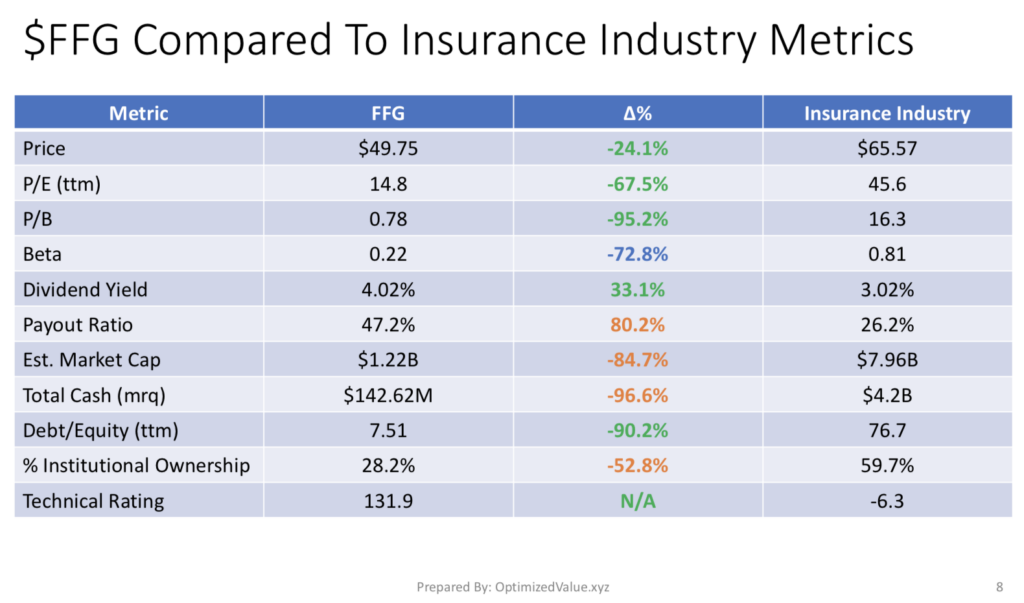
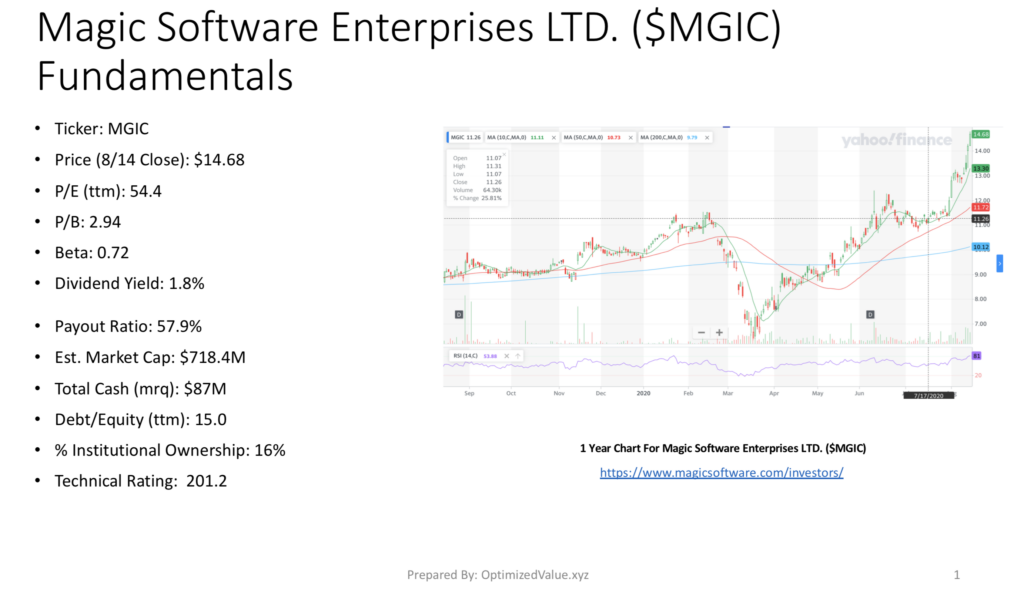
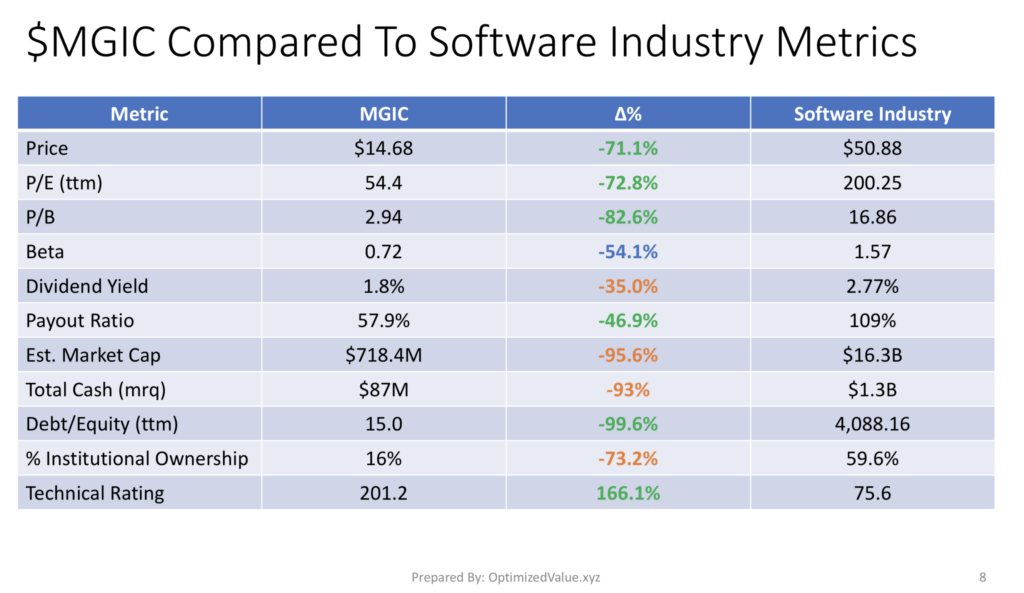
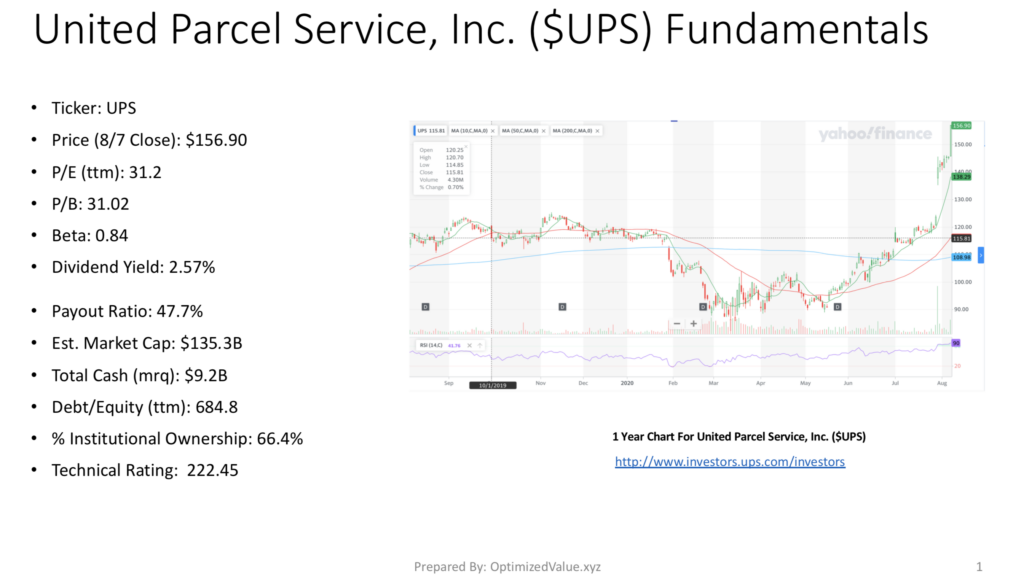
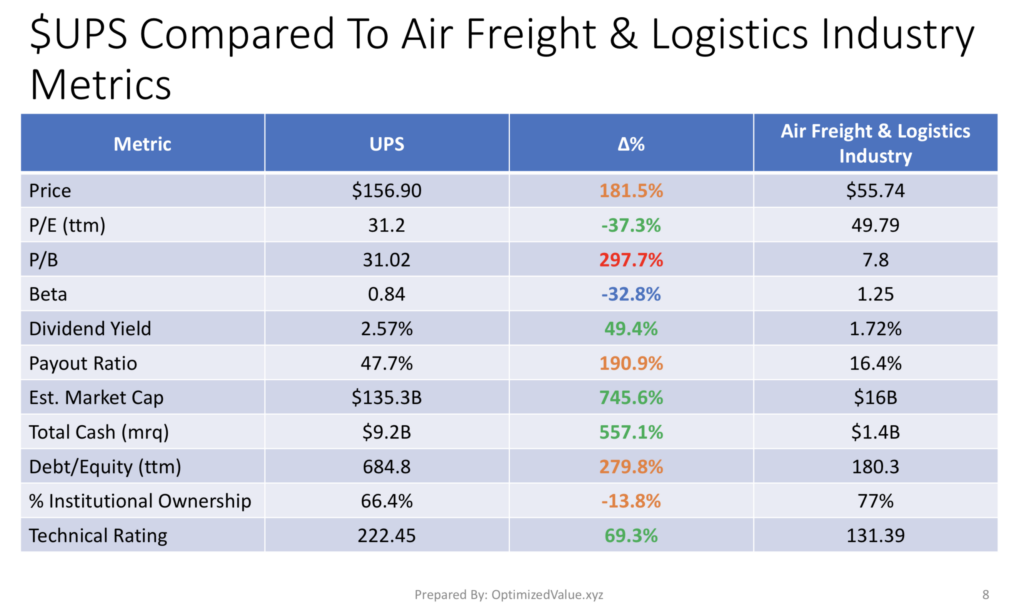
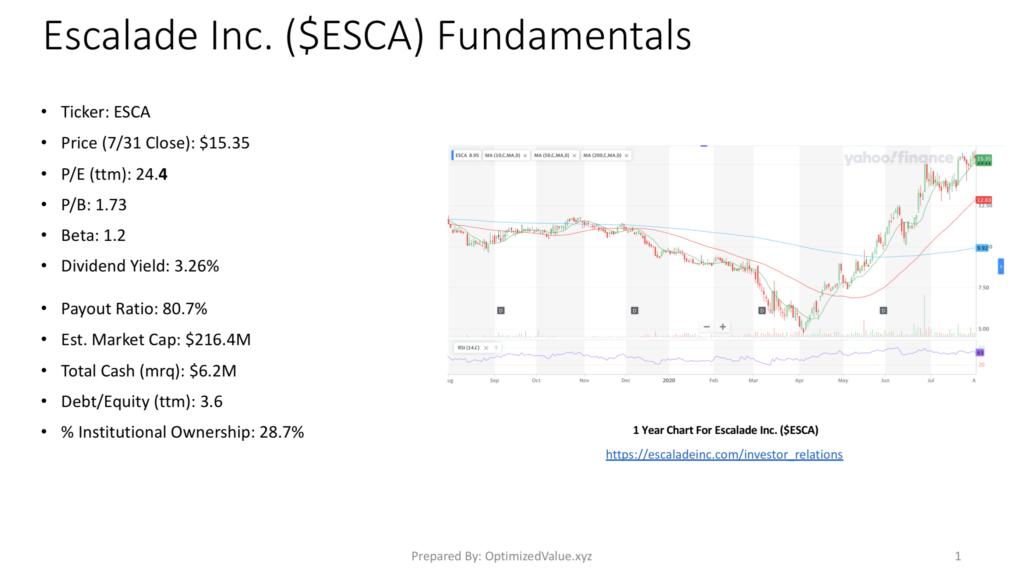
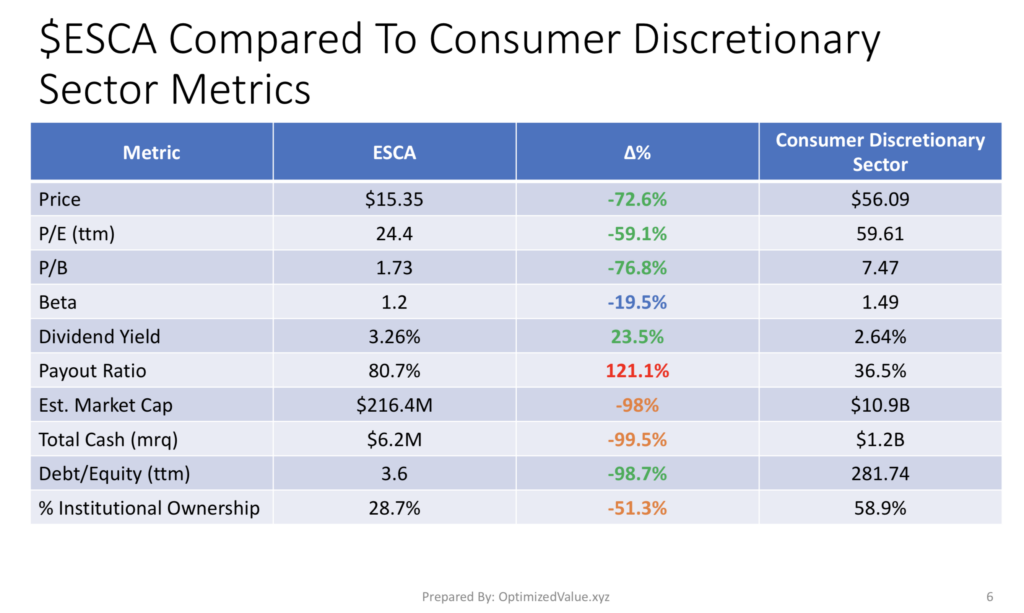
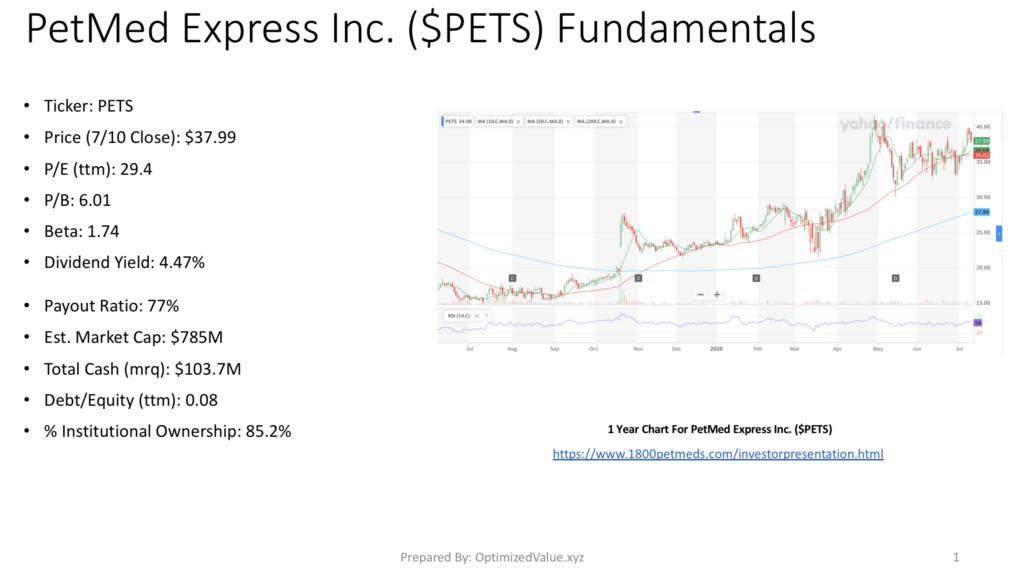
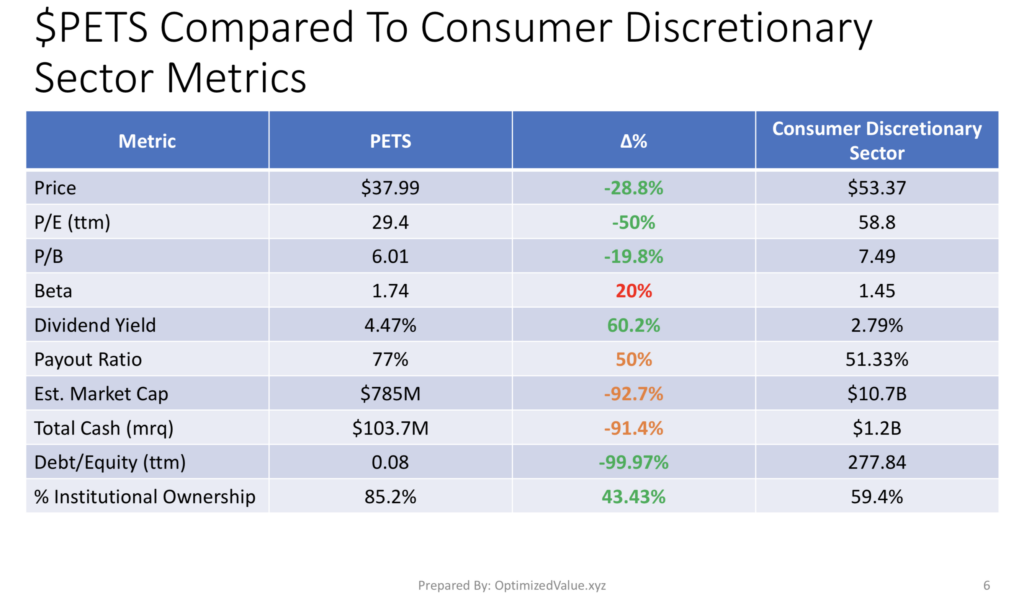
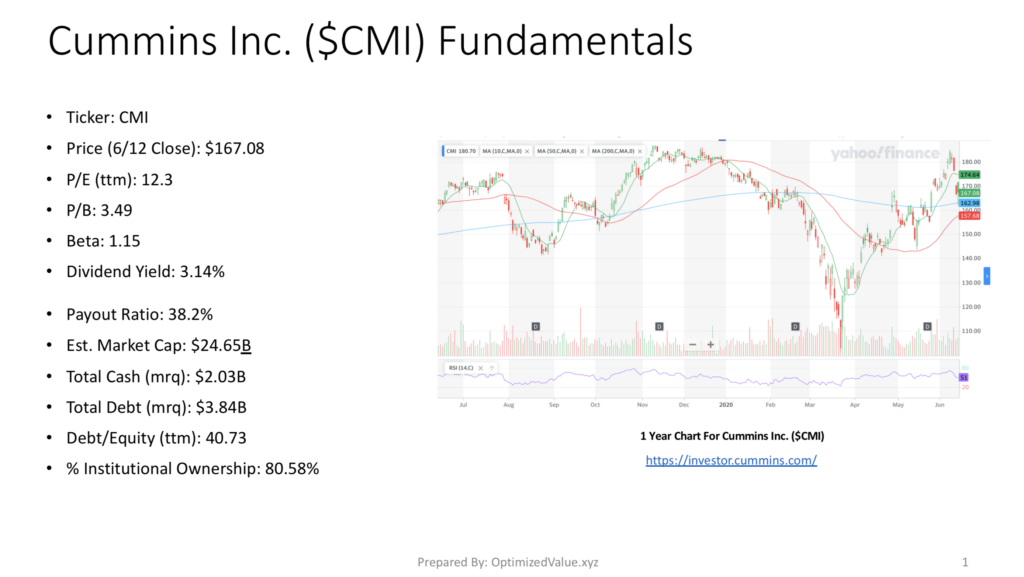
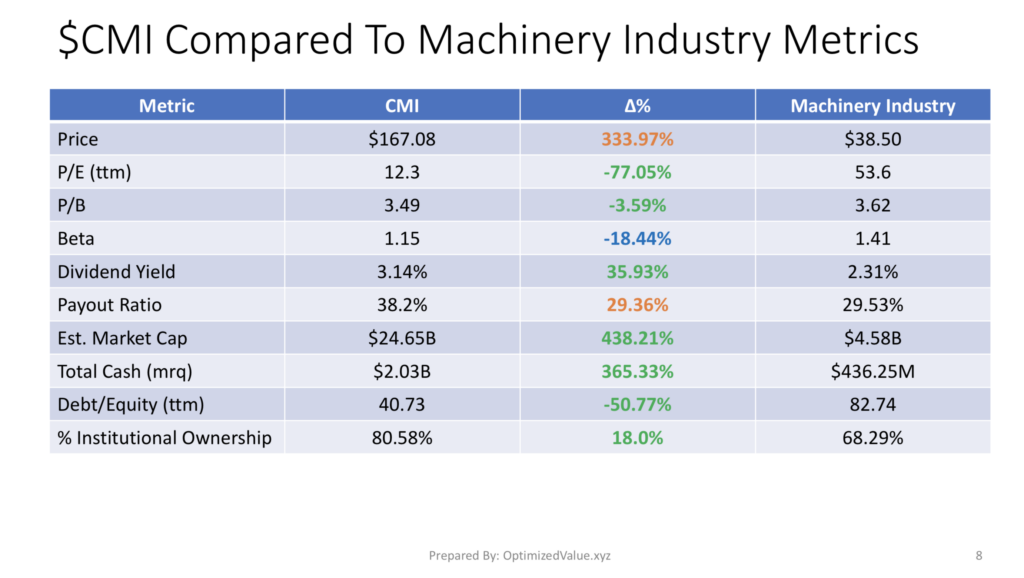
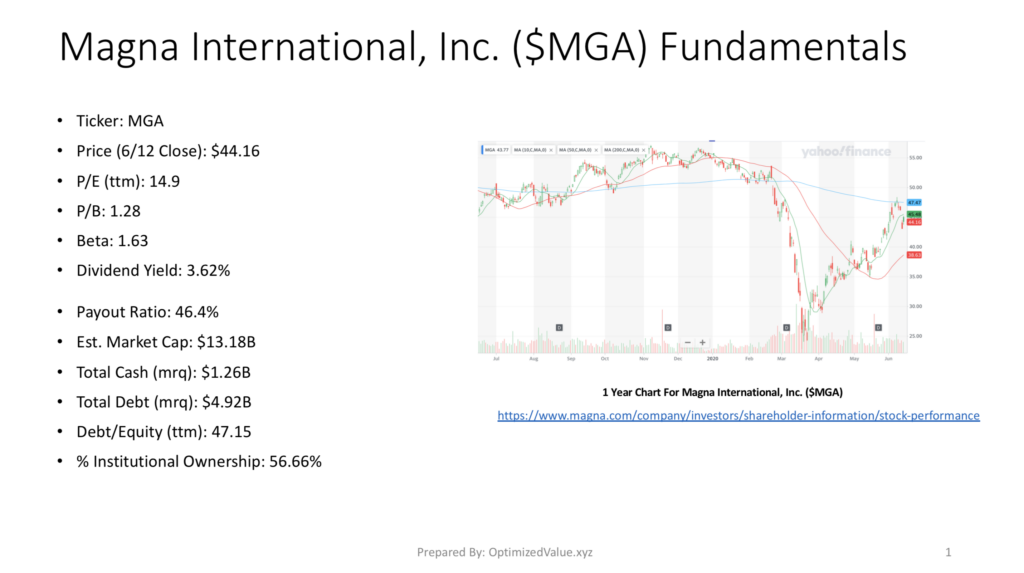
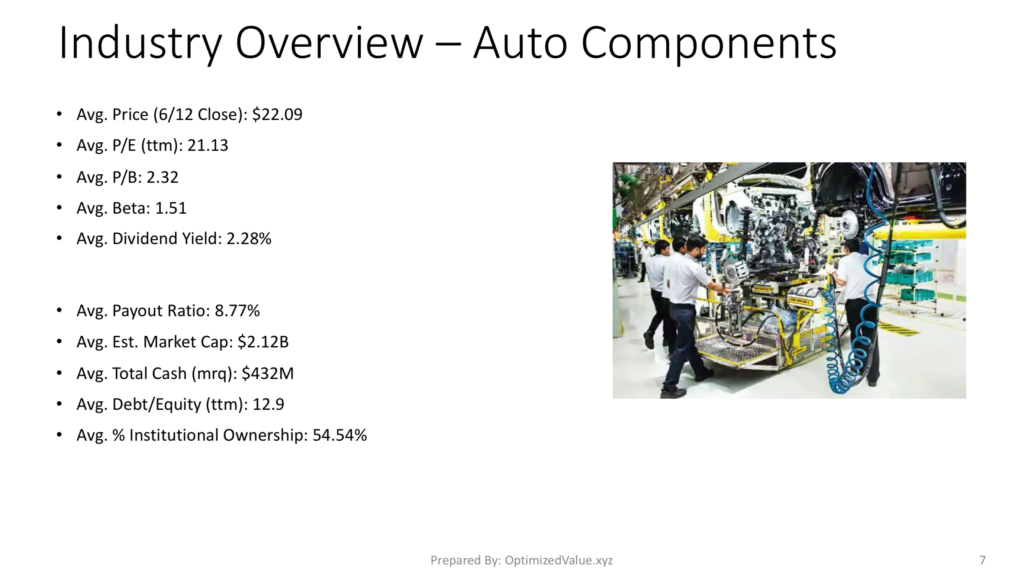
CAI closed for trading at $27.24/share on 9/18/2020, which gives it a P/E (ttm) of 16.8, a P/B of 0.82 & a newly created Dividend Yield of 3.67%.
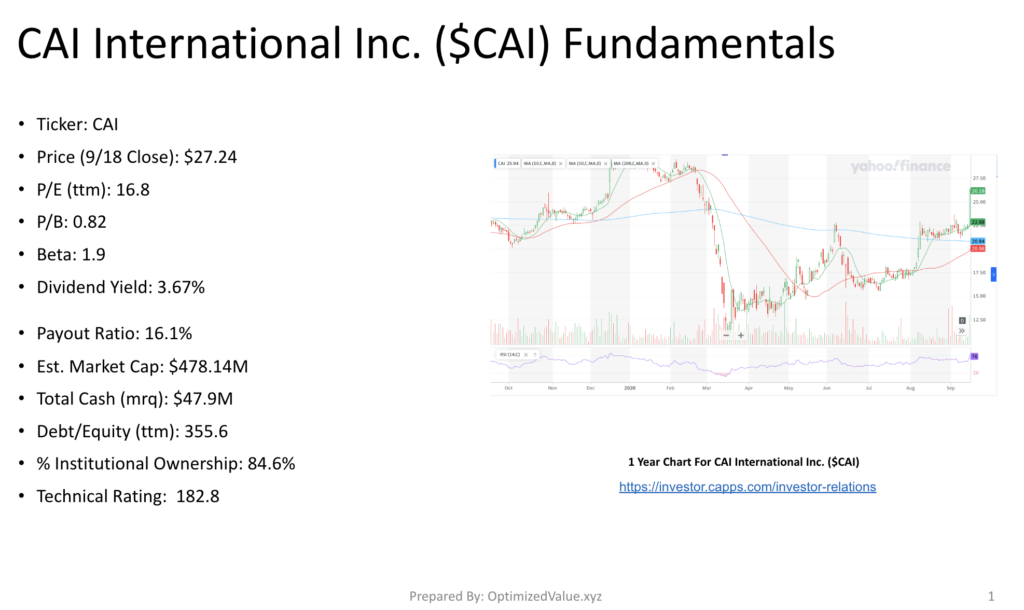
That Dividend is protected by a low 16.1% Payout Ratio, meaning that they have enough cash to continue making payments, and increase the yield if need be.
CAI International Inc. is a small cap stock, with a Market Cap of $478.14M, and has $47.9M of Total Cash (mrq).
Despite their Debt/Equity (ttm) of 355.6 being higher than the stocks we like to publish about and their small cap status, CAI still has a 84.6% % Institutional Ownership.
CAI’s technical rating is 182.8 on our scale.
CAI International Inc. CAI’s Stock Technicals Broken Down
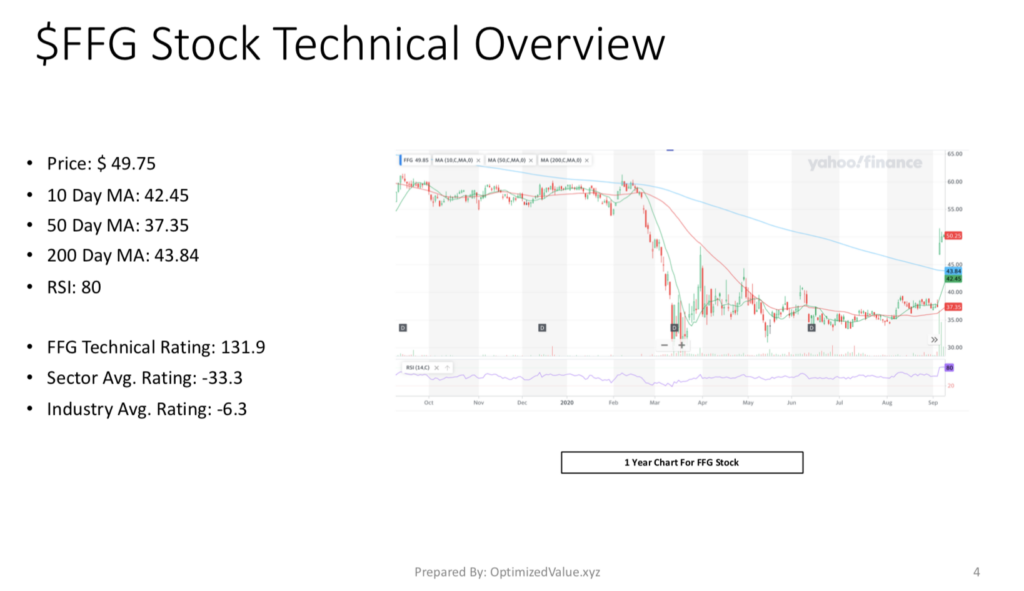
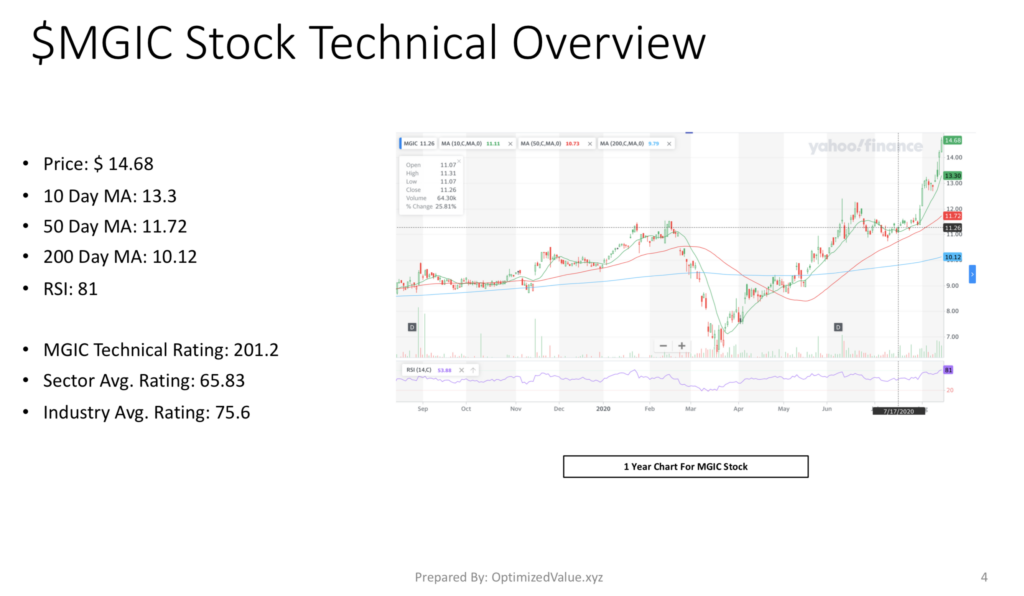
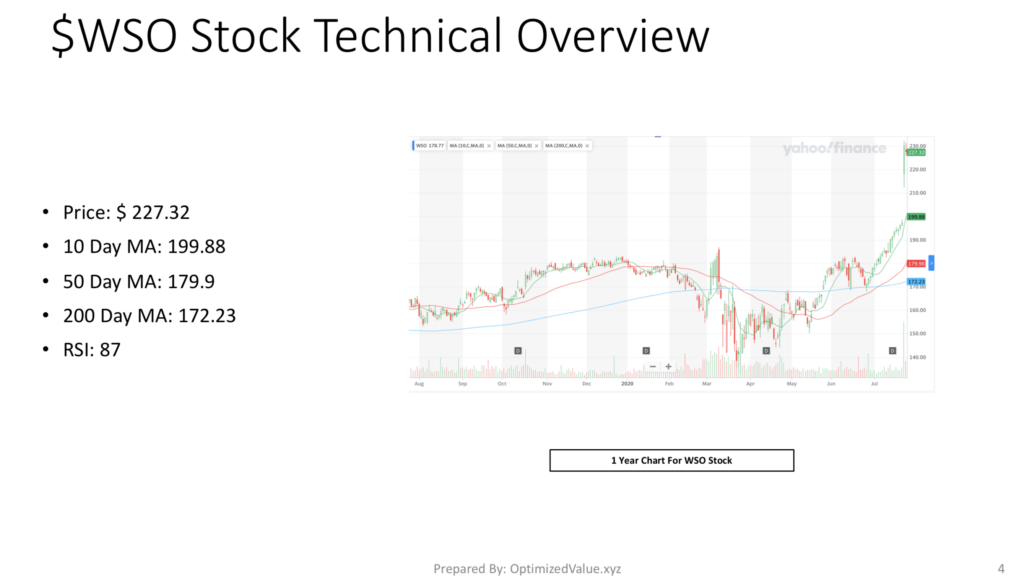
Part of the appeal of CAI stock is that their technicals are showing a good deal of strength.
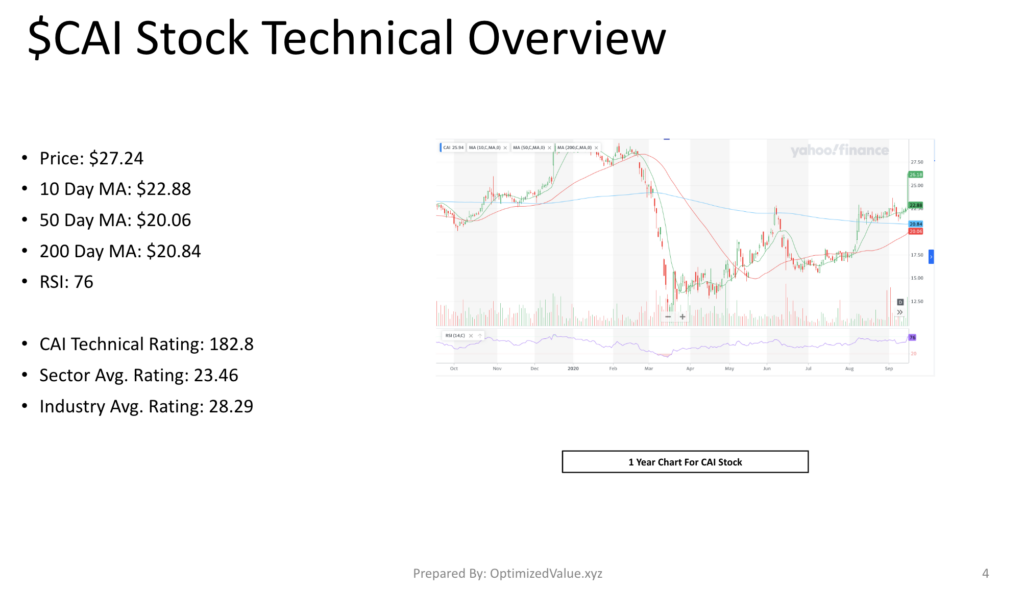
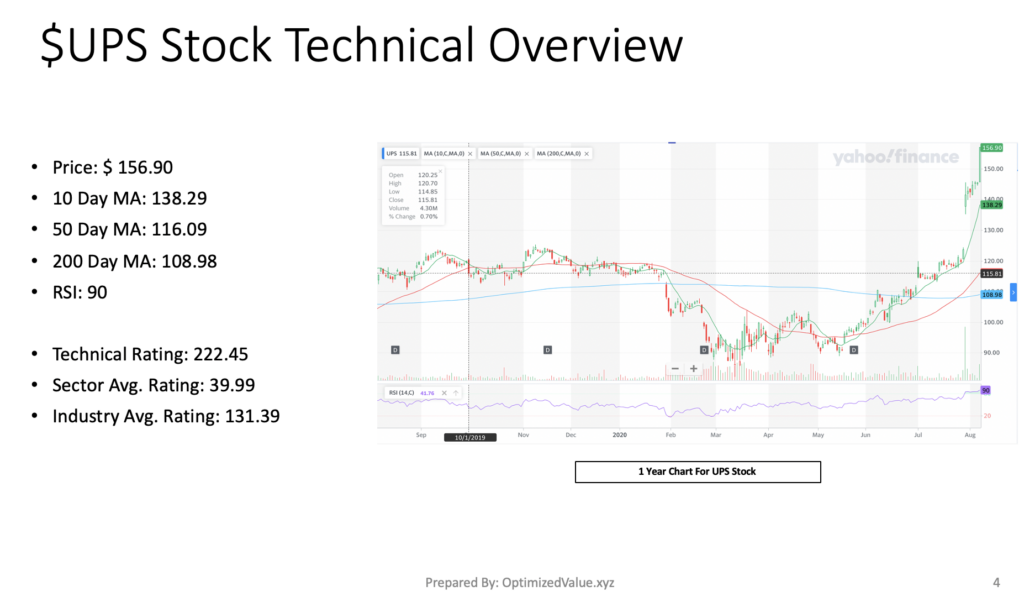
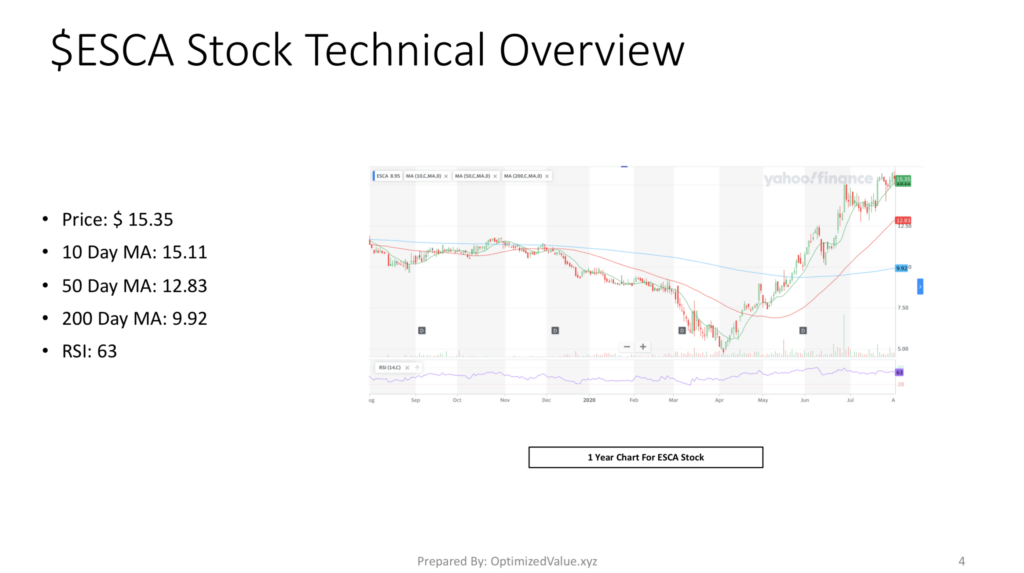
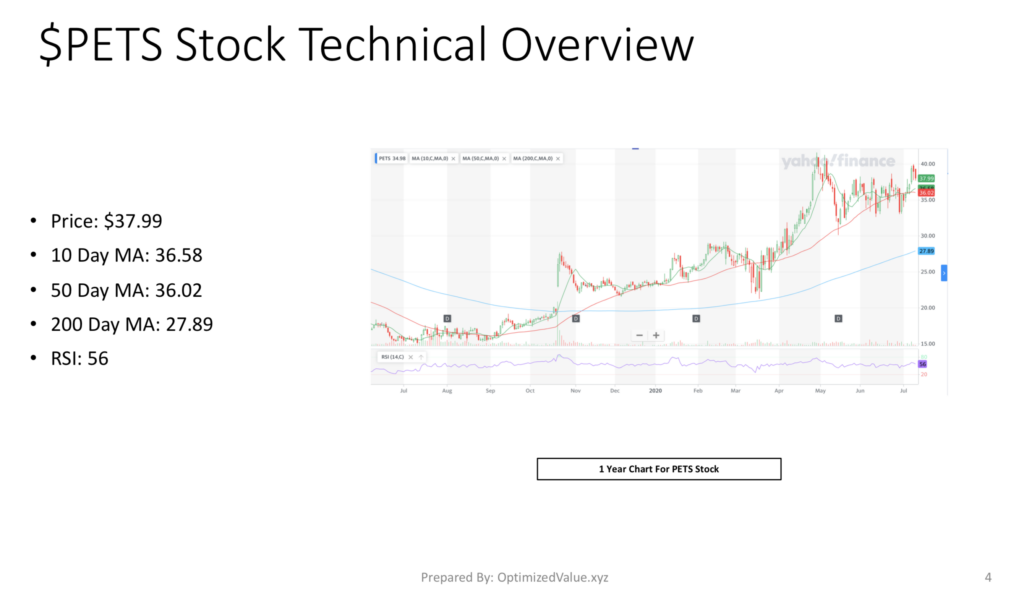
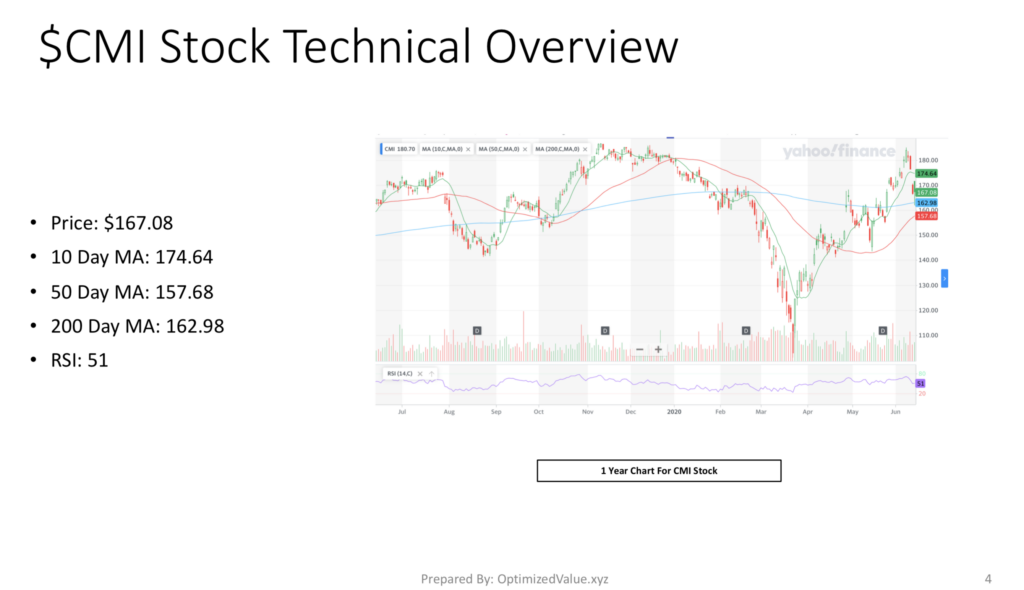
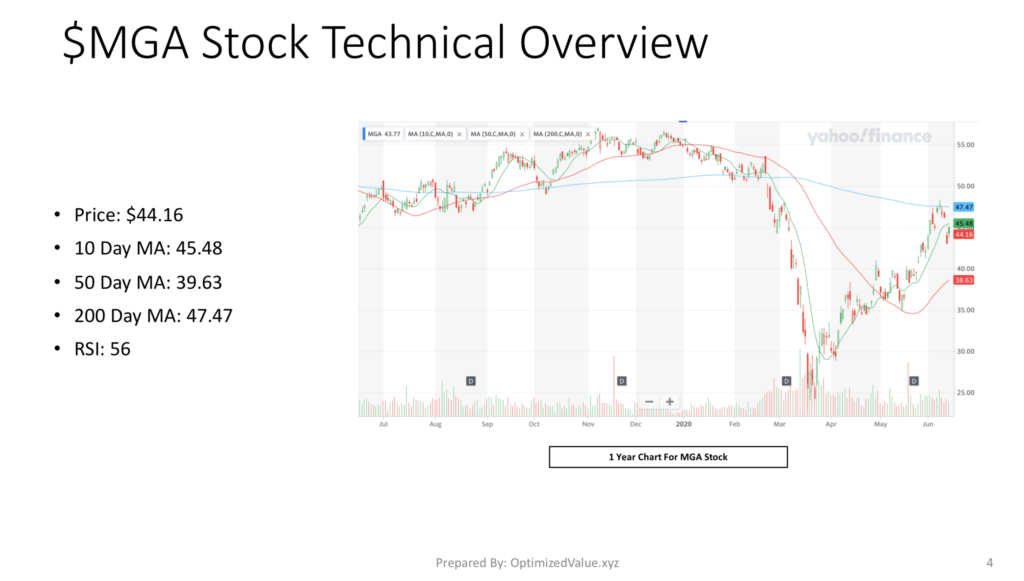
CAI Price: $27.24
10 Day Moving-Average: $22.88
50 Day Moving-Average: $20.06
200 Day Moving-Average: $20.84
RSI 76
CAI’s 50 Day Moving-Average is set to break through the 200 Day Moving-Average soon, which should add some increased support & push their price higher.
When compared with their peers in their sector & industry, CAI is far ahead of the pack, showing one of the strongest Technical Ratings in the market currently.
CAI Stock Technical Rating: 182.8
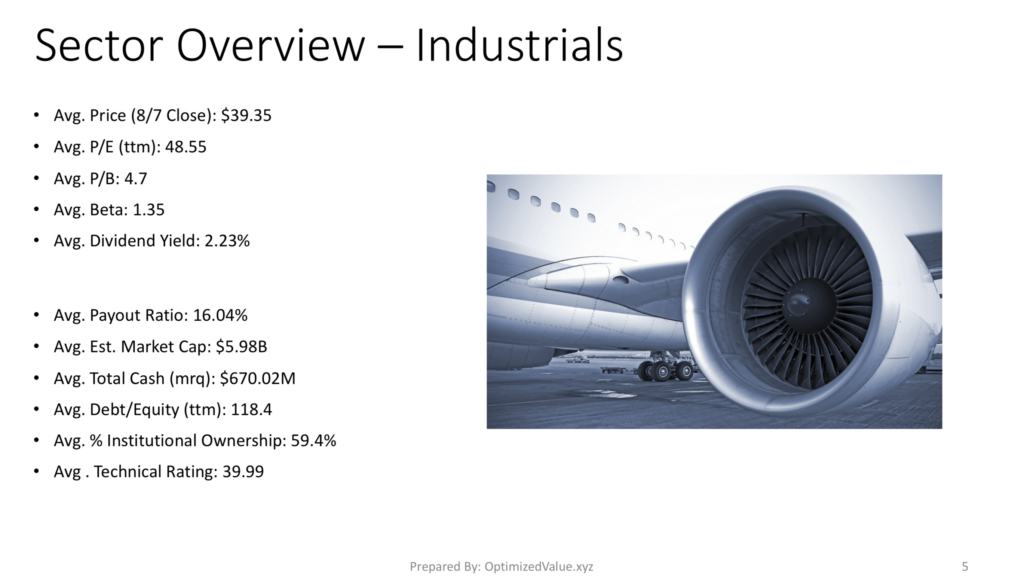
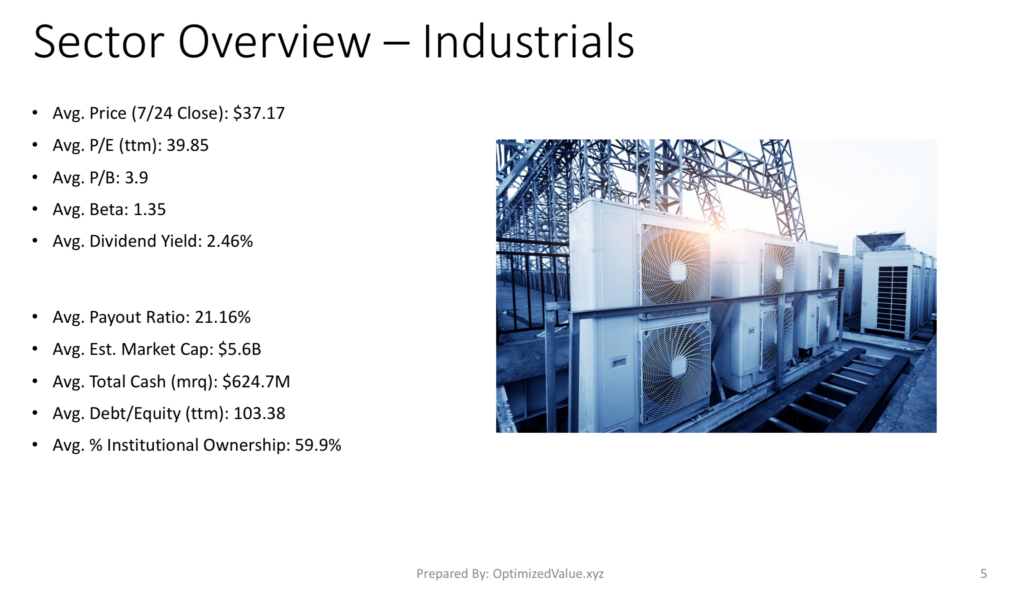
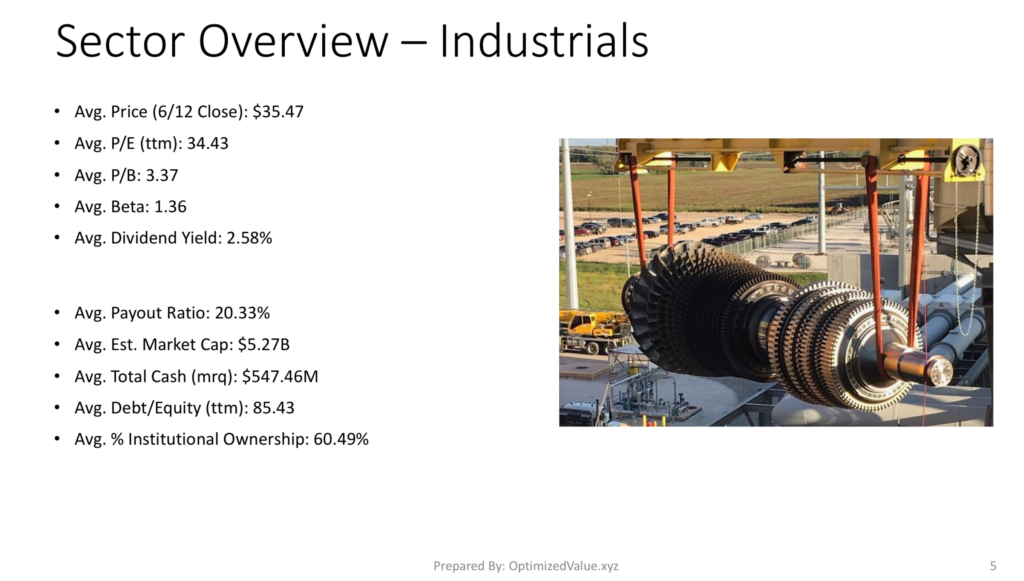
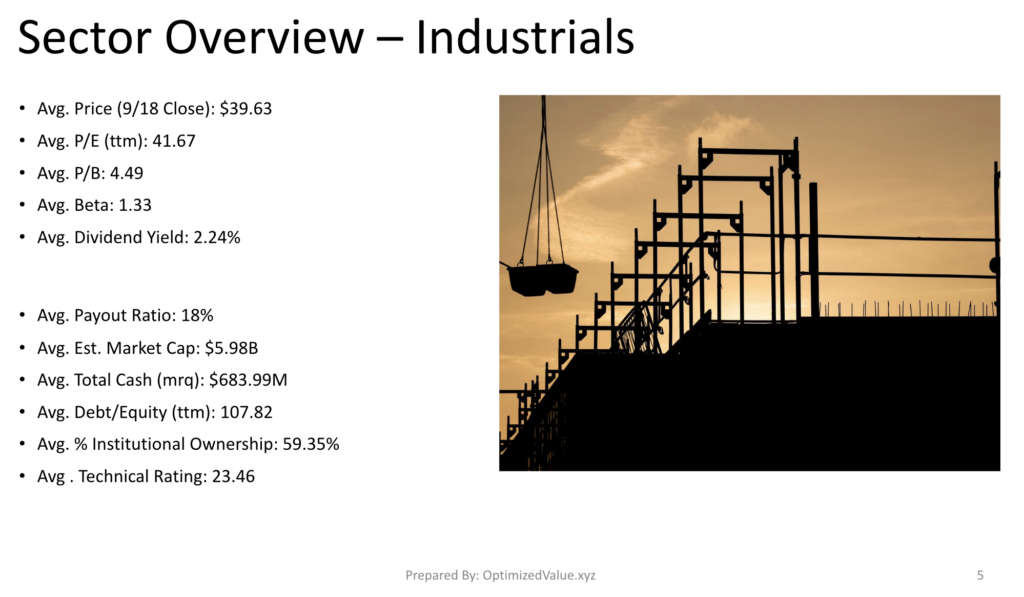
Industrials Sector Average Technical Rating: 23.46
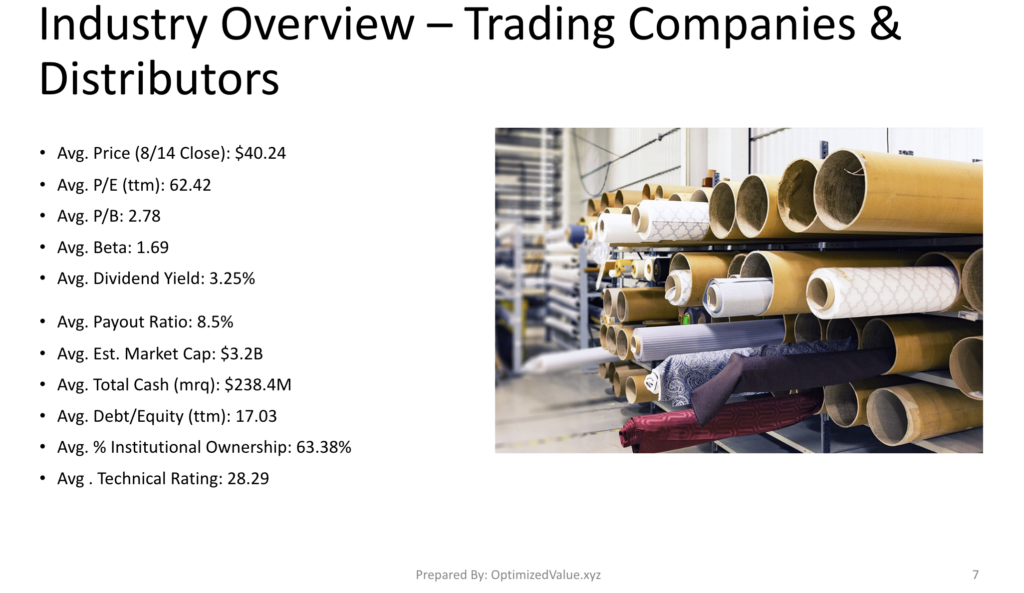
Trading Companies & . Distributors Industry Average Technical Rating: 28.29
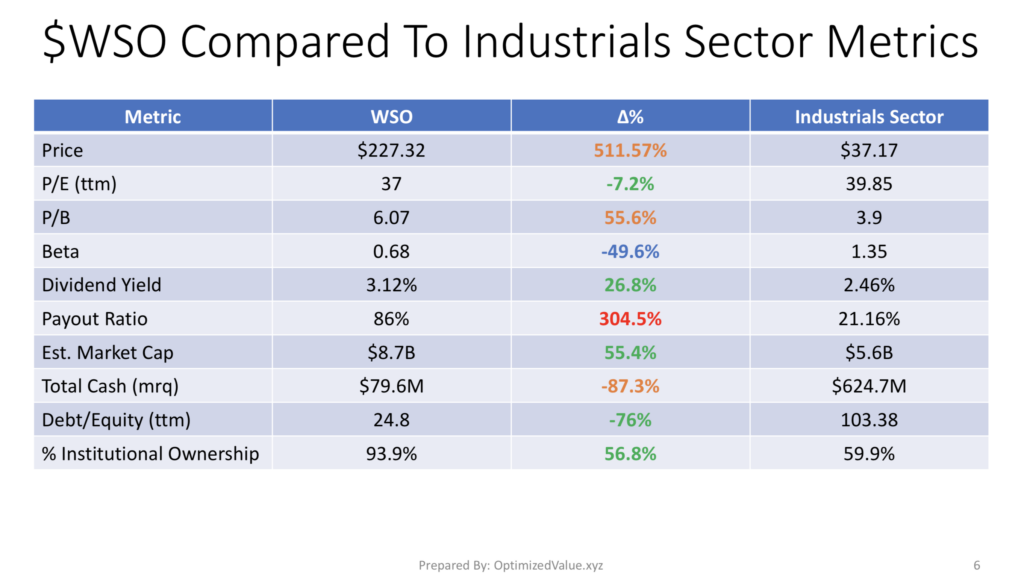
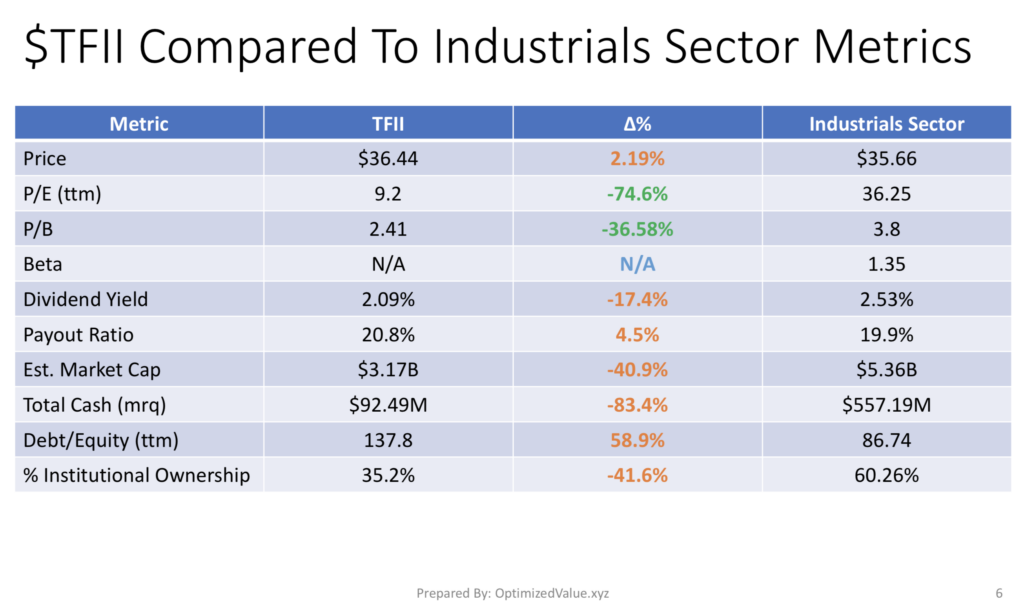
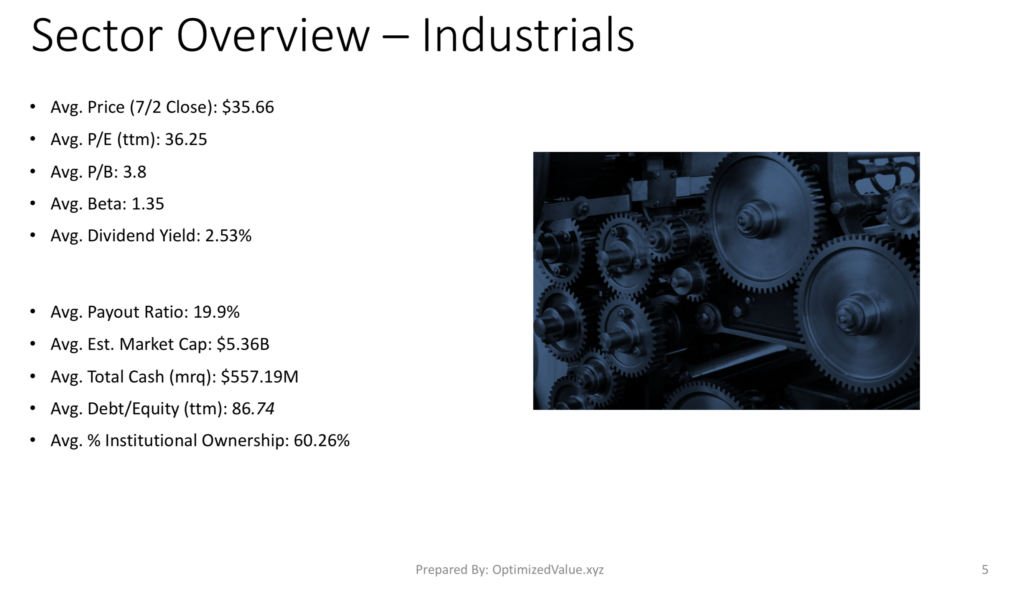
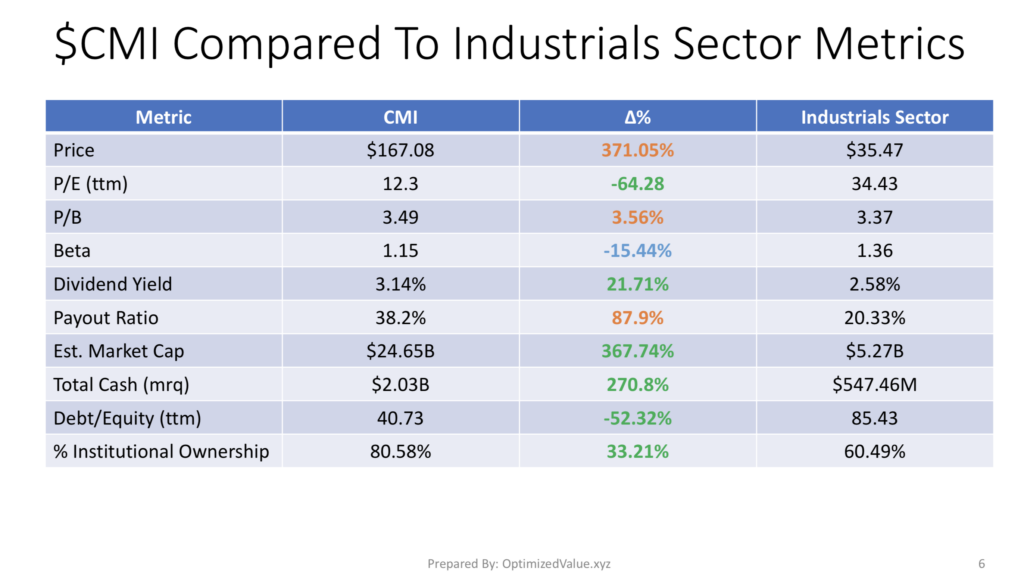
CAI International Inc. CAI Stock Vs. The Industrials Sector Average Fundamentals
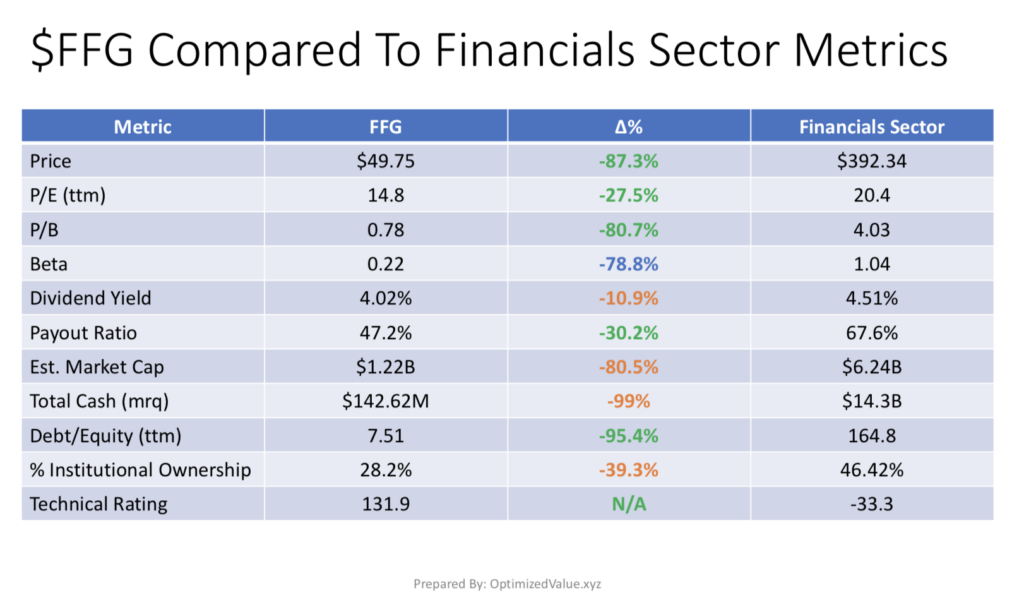
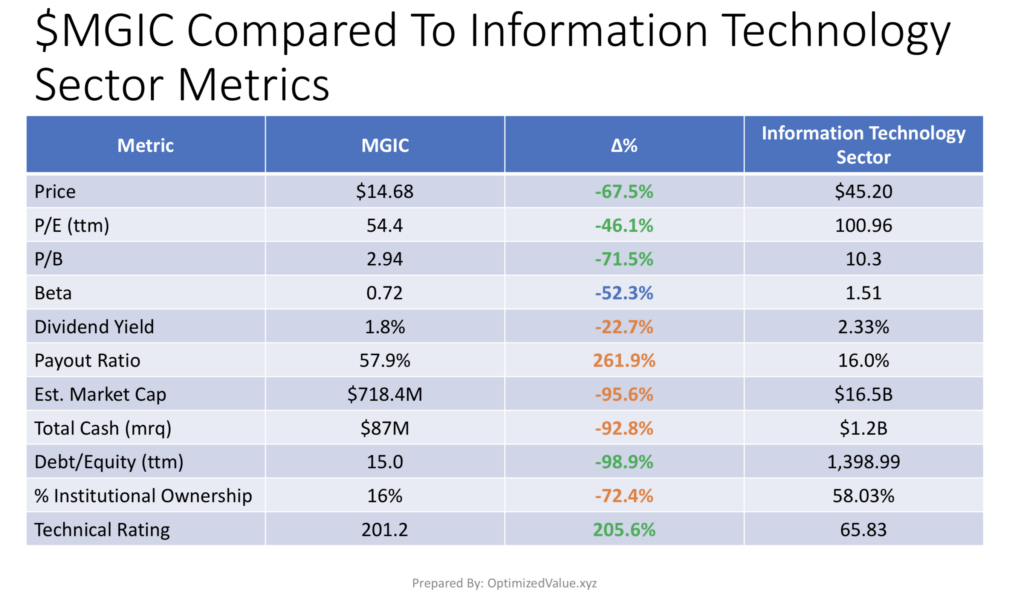
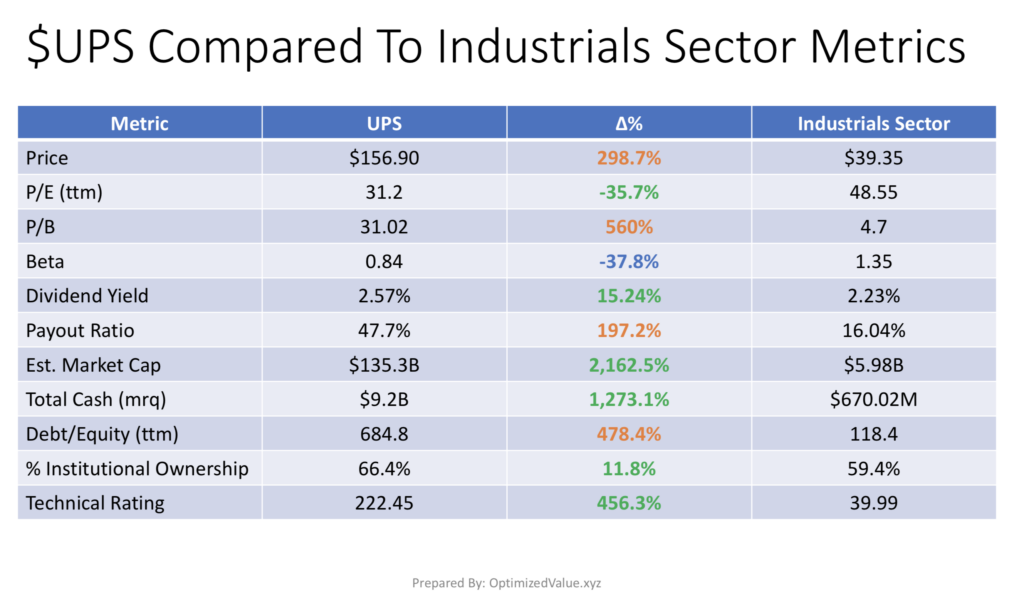
CAI Stock has a P/E (ttm) that is 59.7% lower than the Industrials Sector Stock Average, and an 81.7% lower than average P/B. Their new Dividend Yield is 63.8% higher than the Industrials Sector average, with a 10.6% lower than average Payout Ratio, suggesting their dividend is safer than average.
CAI International Inc.’s stock also has 42.5% better than average % Institutional Investors, and their Technical Rating is 679.2% better than the Industrials sector average.
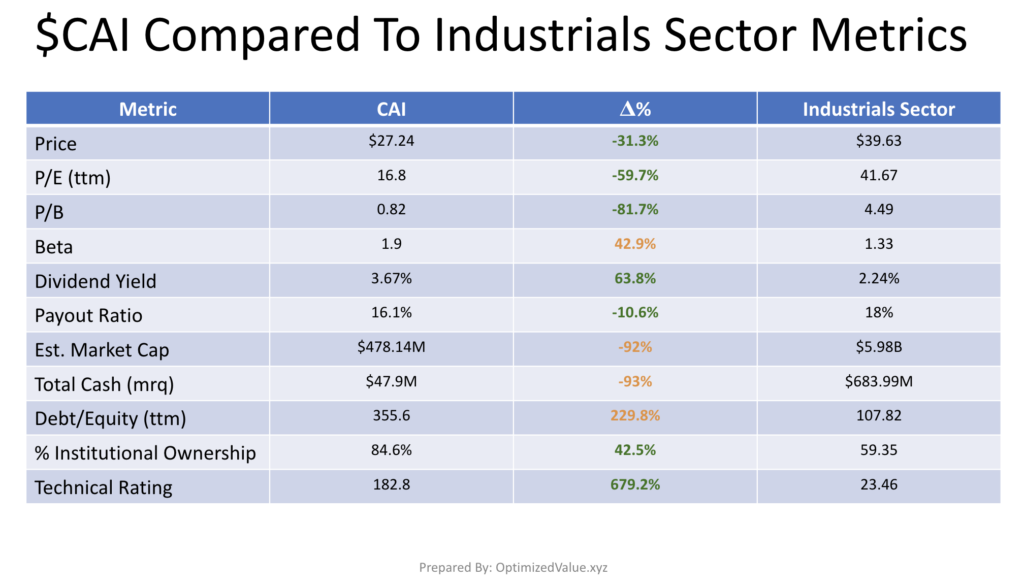
As a small cap stock, it isn’t surprising to see that CAI’s Market Cap is 92% lower than average, resulting in a 93% lower than average amount of Total Cash (ttm).
Their Debt/Equity (ttm) is higher than what we like to publish about, being 229.8% higher than average, and the stock price may fluctuate a bit more than the average stock, as its Beta is 42.9% higher than average for an Industrials stock.
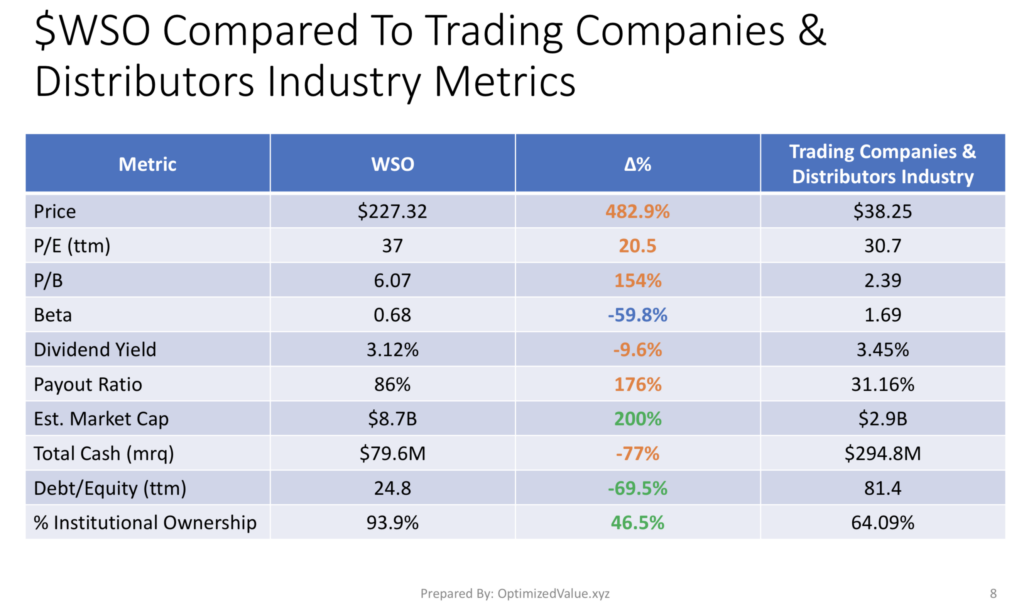
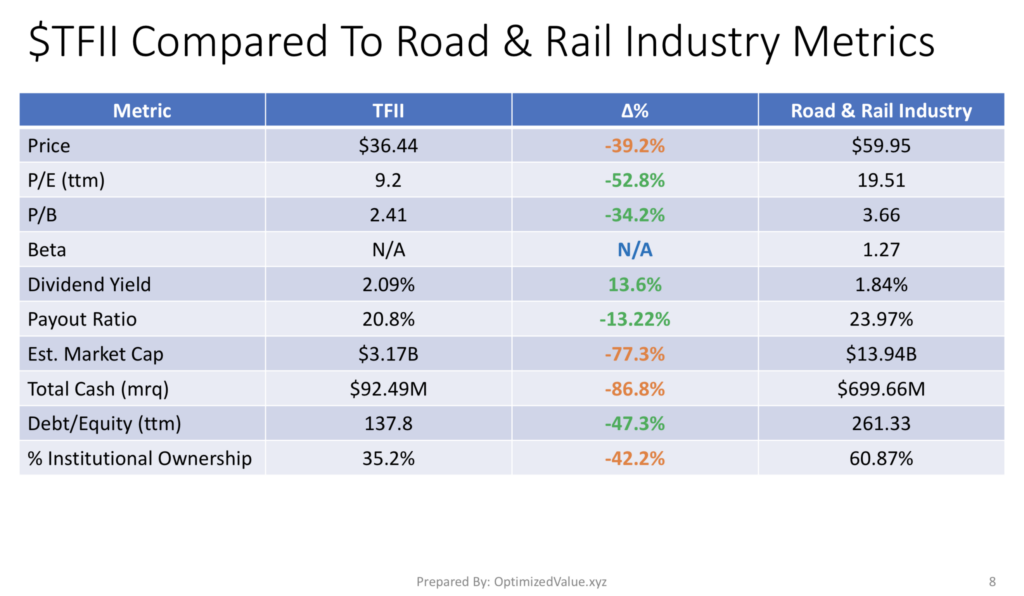
Comparing CAI International Inc. CAI’s Stock Fundamentals Vs. The Trading Companies & Distributors Industry Averages
CAI International Inc.’s stock also has many similar advantages over its peers in the Trading Companies & Distributors Industry. CAI’s P/E (ttm) is 78% lower than average, with their P/B 70.5% less than average.
CAI’s Dividend Yield is 12.9% higher than average, with a 33.5% higher than average % Institutional Ownership & a 546% better than average Technicals Rating.
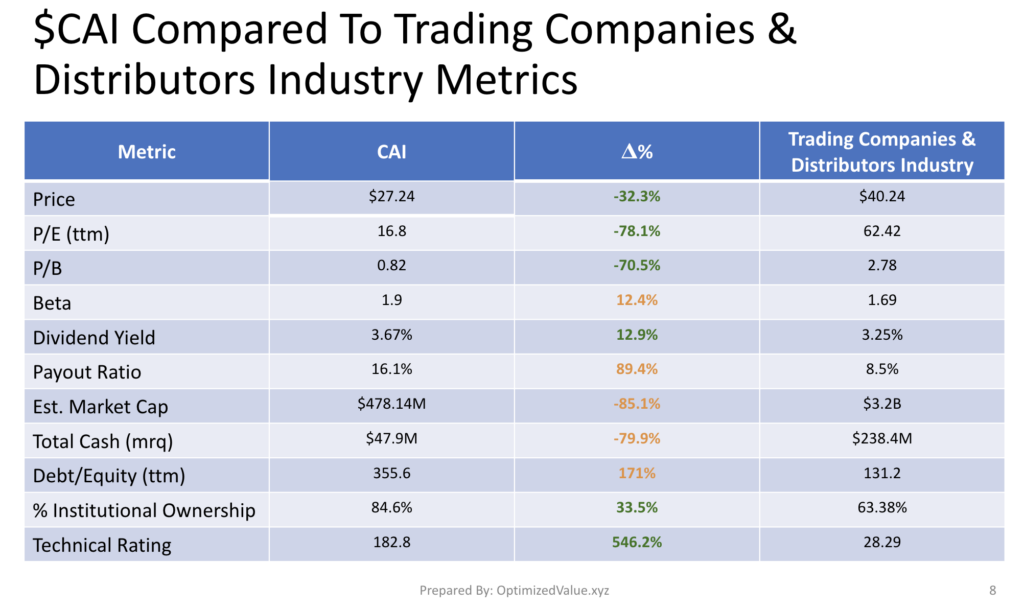
Small Cap CAI is 85% smaller than their average industry peer, and their Total Cash (mrq) is almost 80% less than average. Their Debt/Equity (ttm) is 171% higher than average.
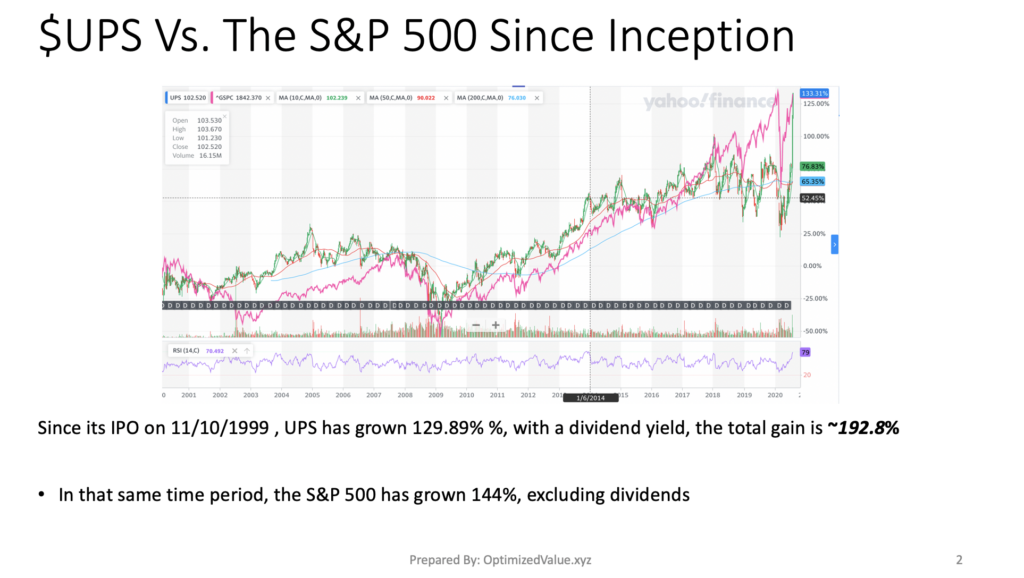
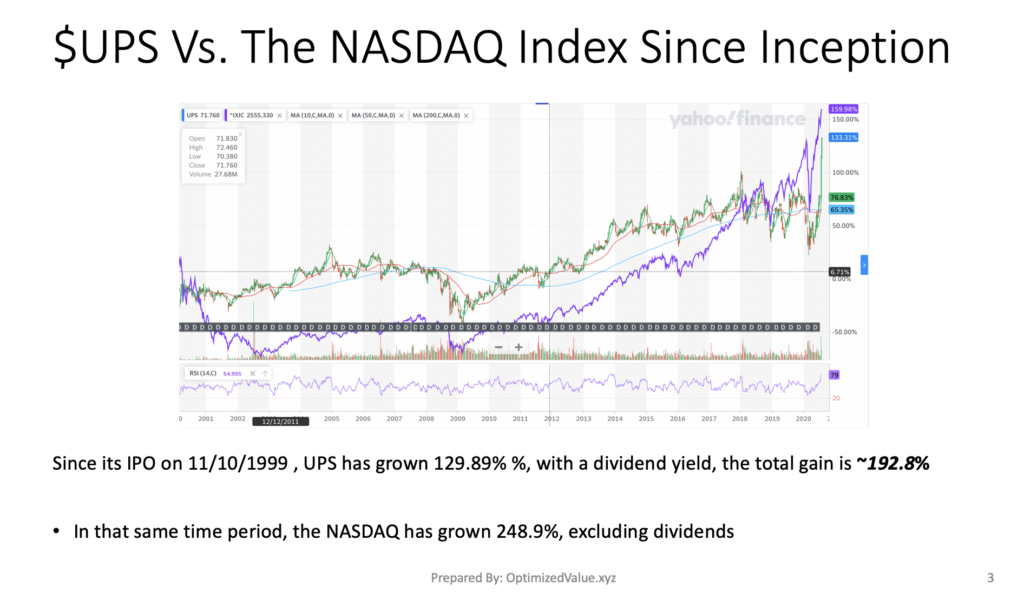
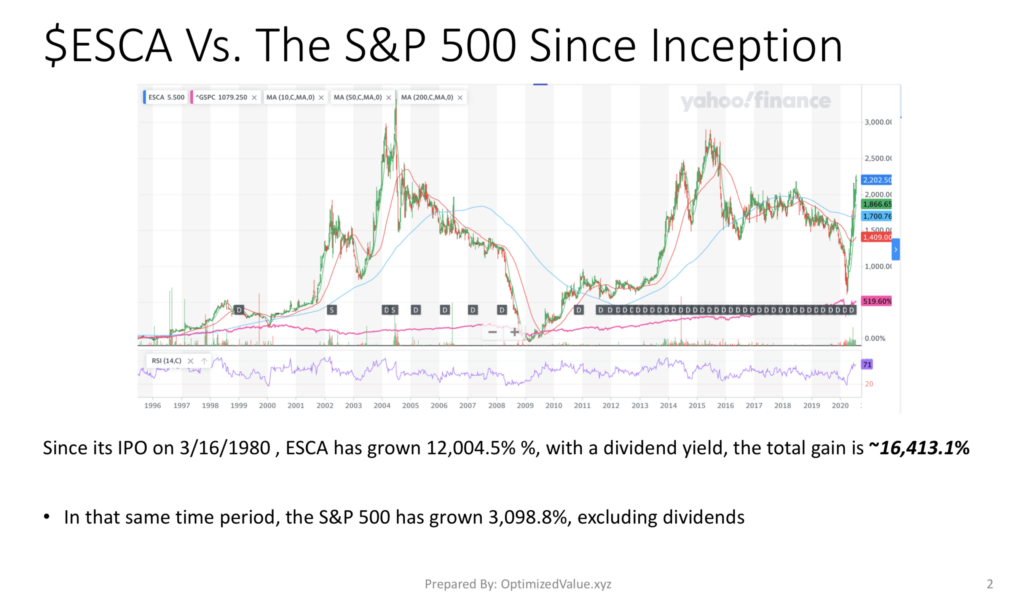
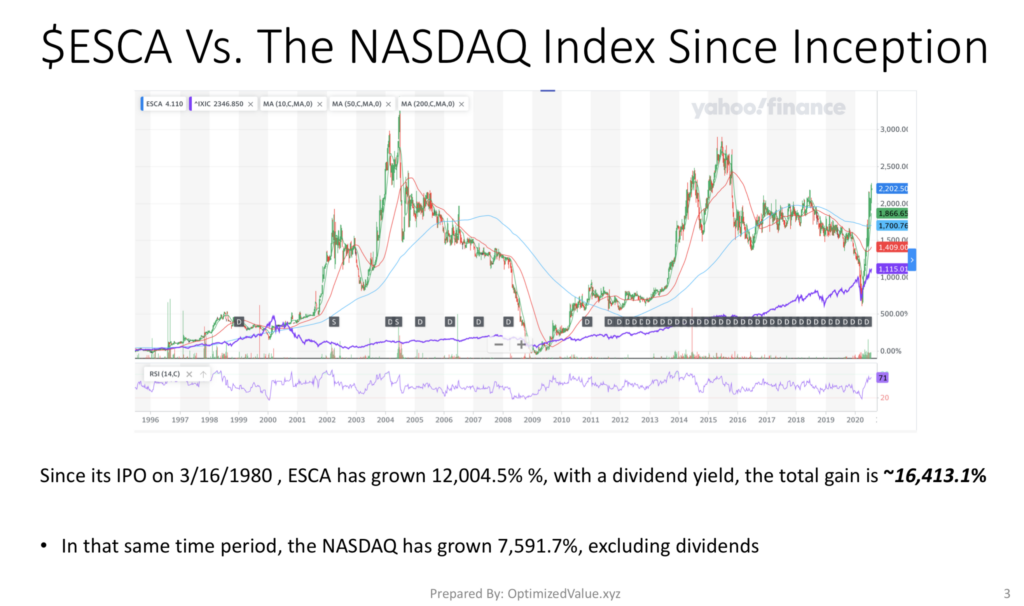
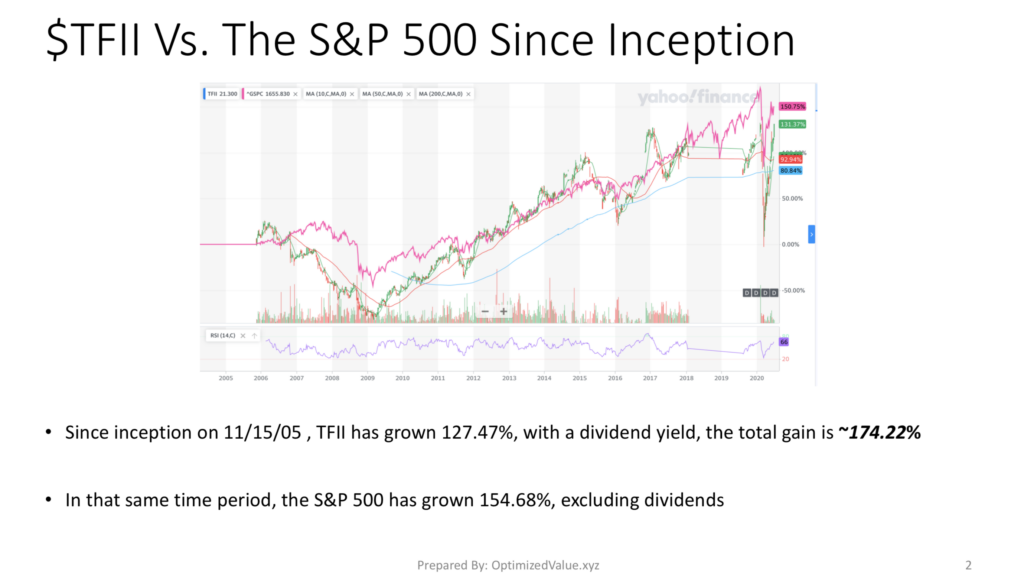
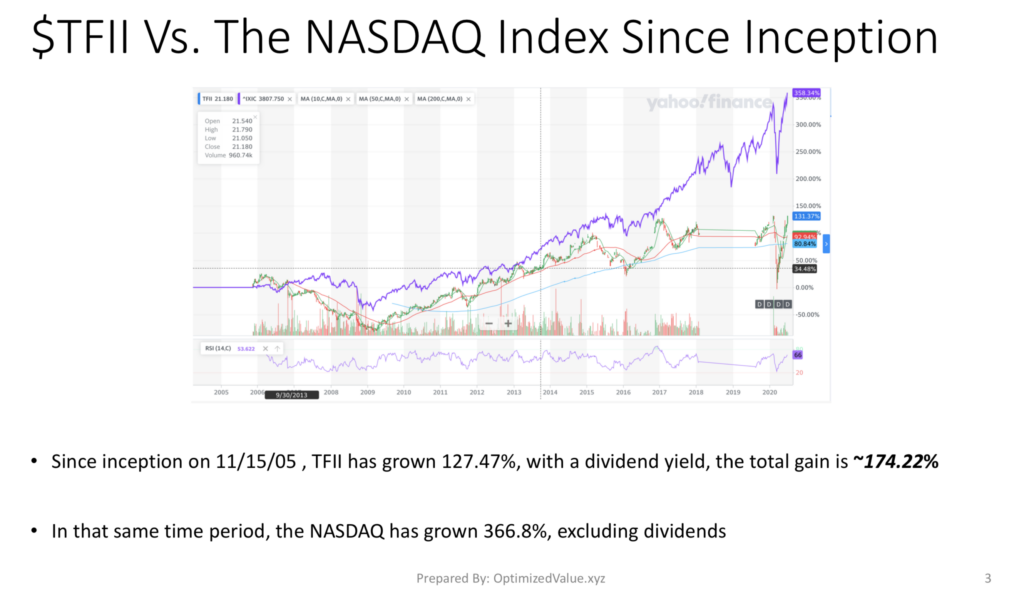
CAI International Inc. CAI’s Stock Performance Vs. The S&P 500 & NASDAQ Historically
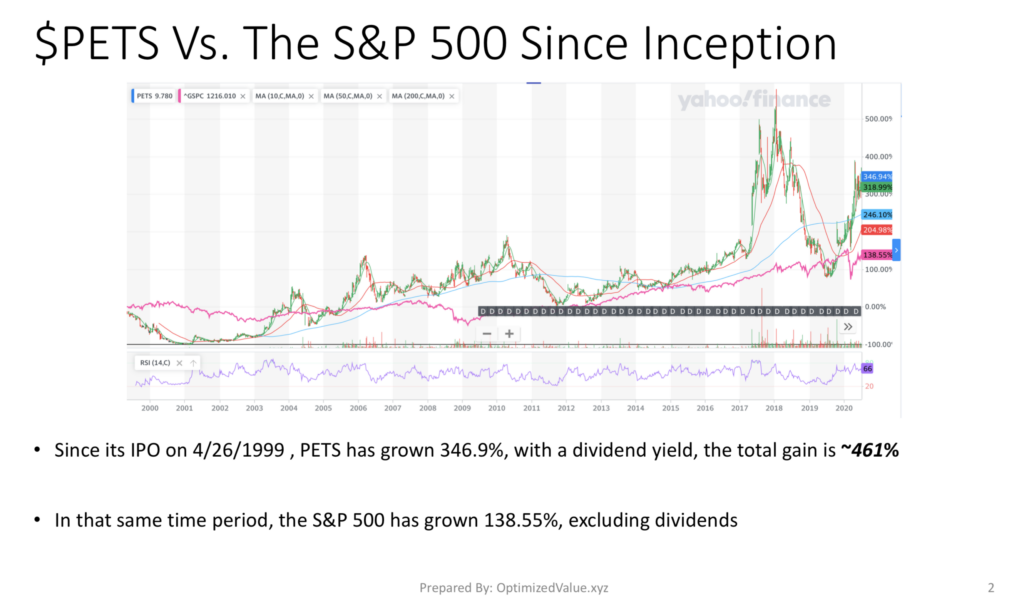
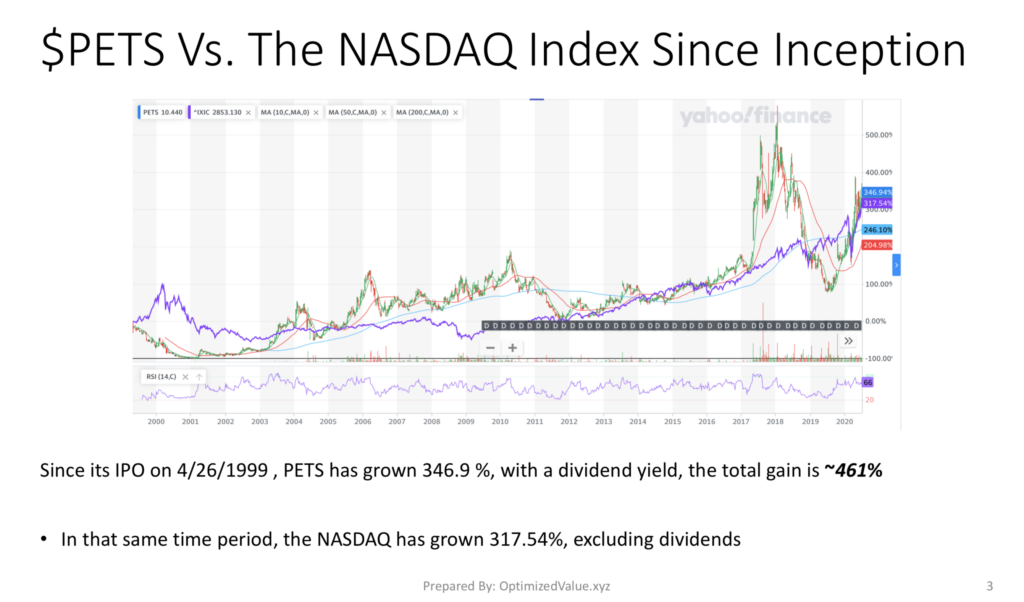
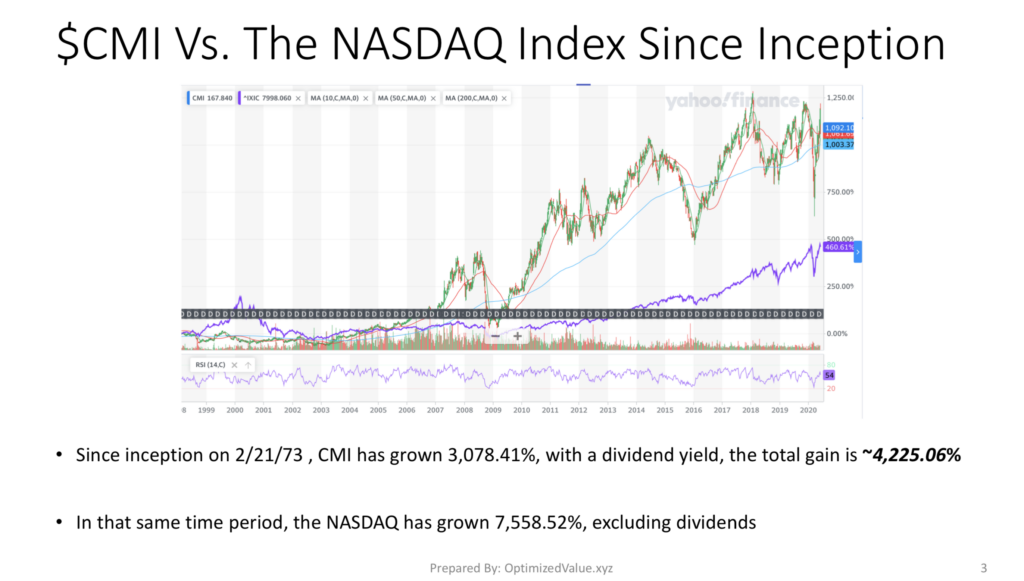
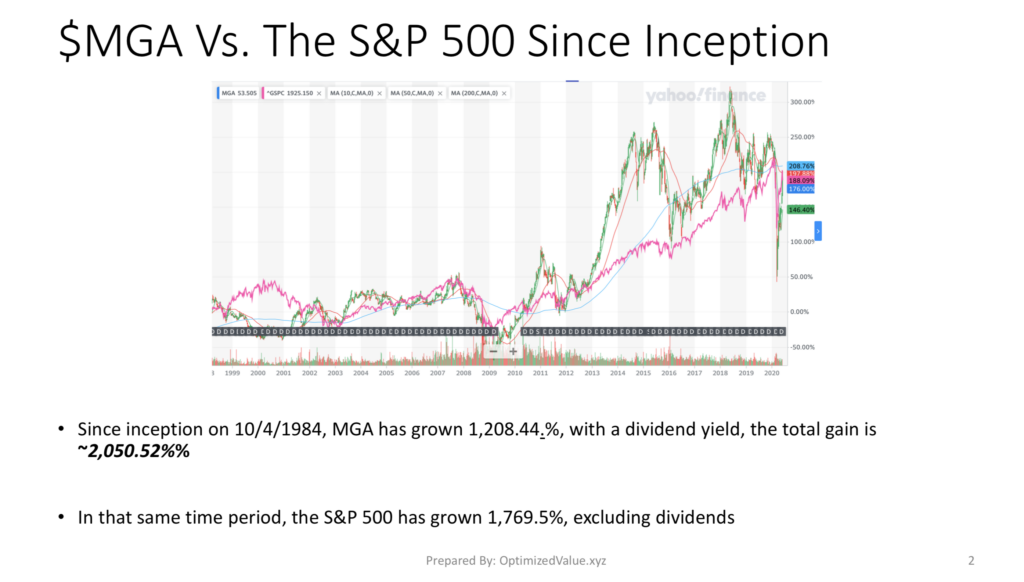
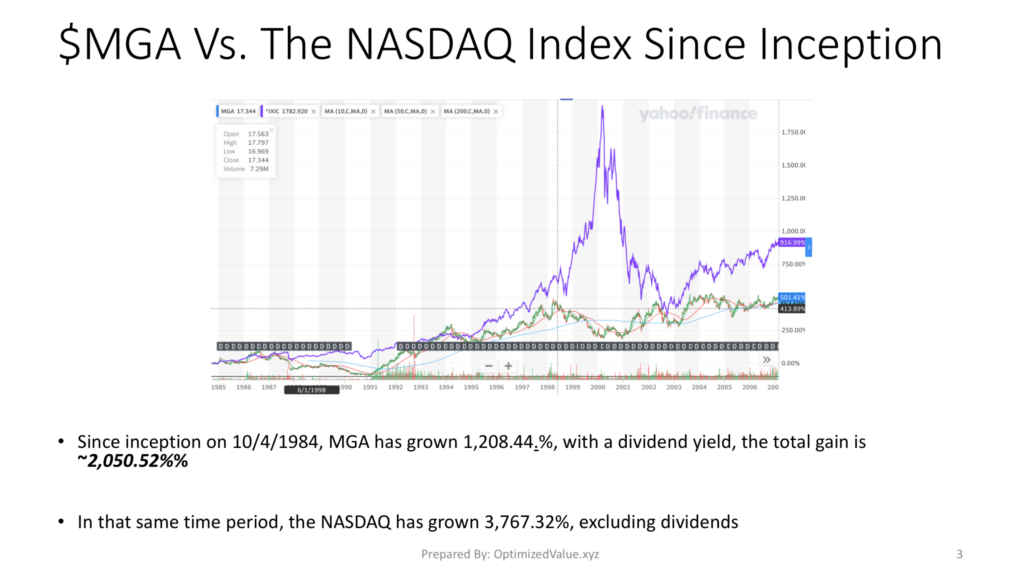
Since they began trading on 5/16/2007, CAI International Inc.’s stock has grown by 84%. If you add their new Dividend Yield they have grown 85%, following only one quarter of payments.
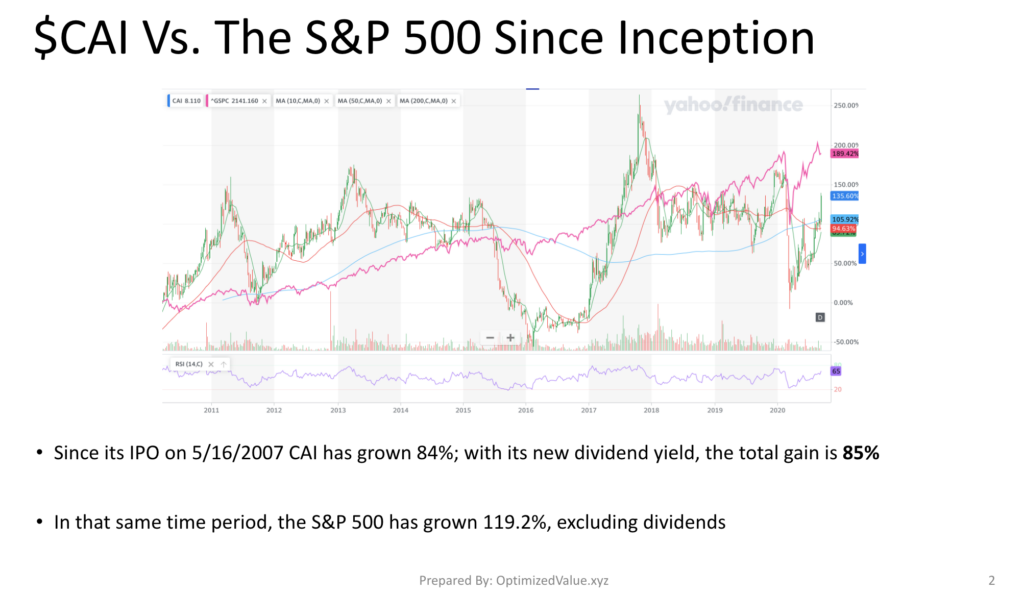
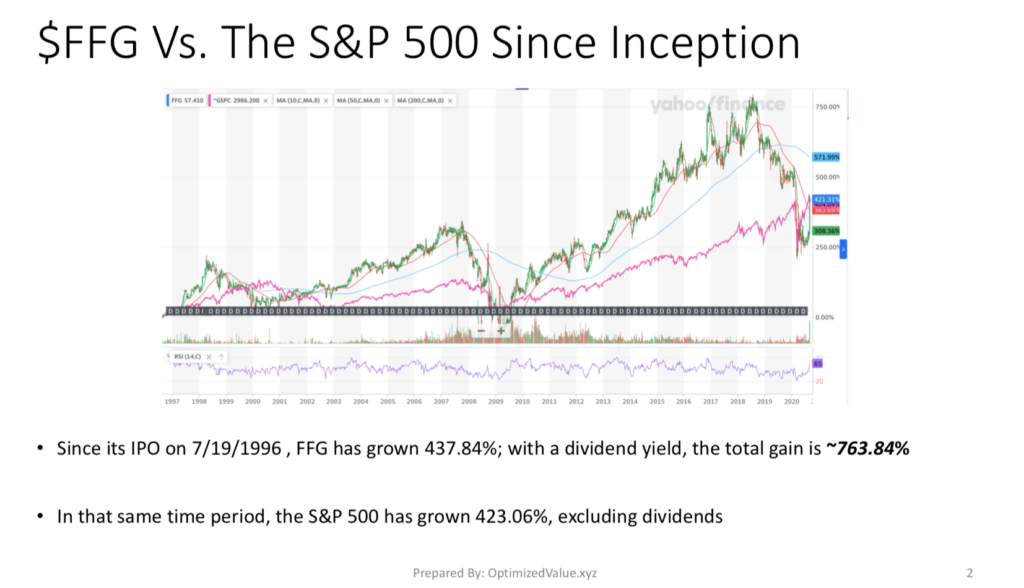
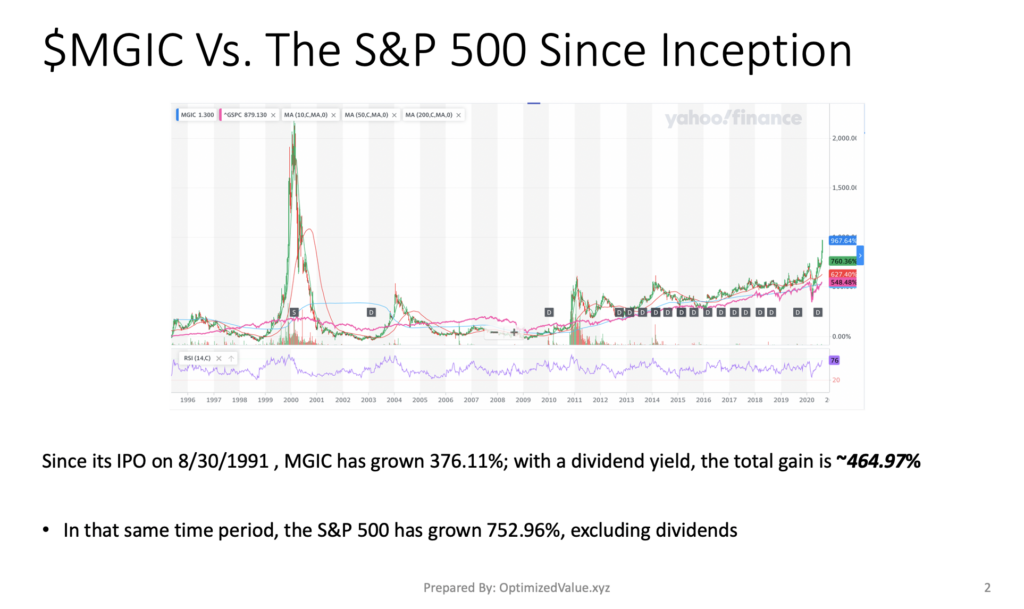
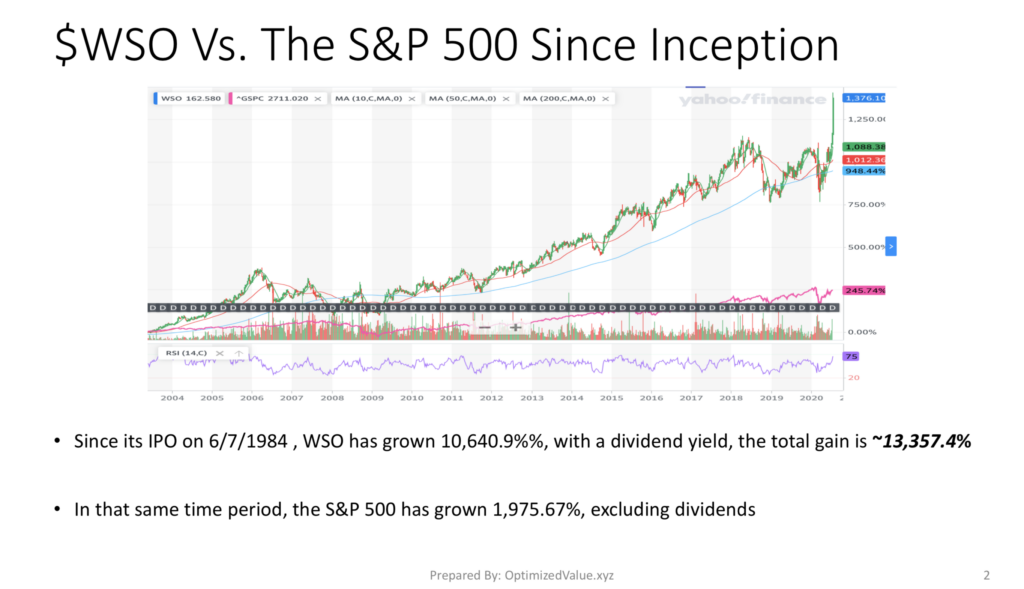
In that same time, the S&P 500 has grown 119.2%, excluding dividends.
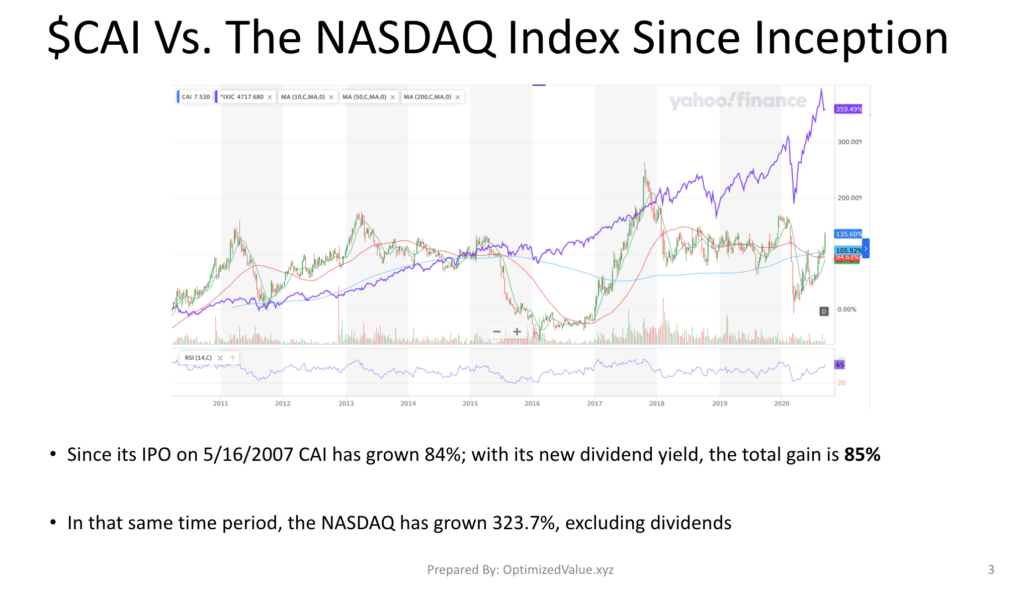
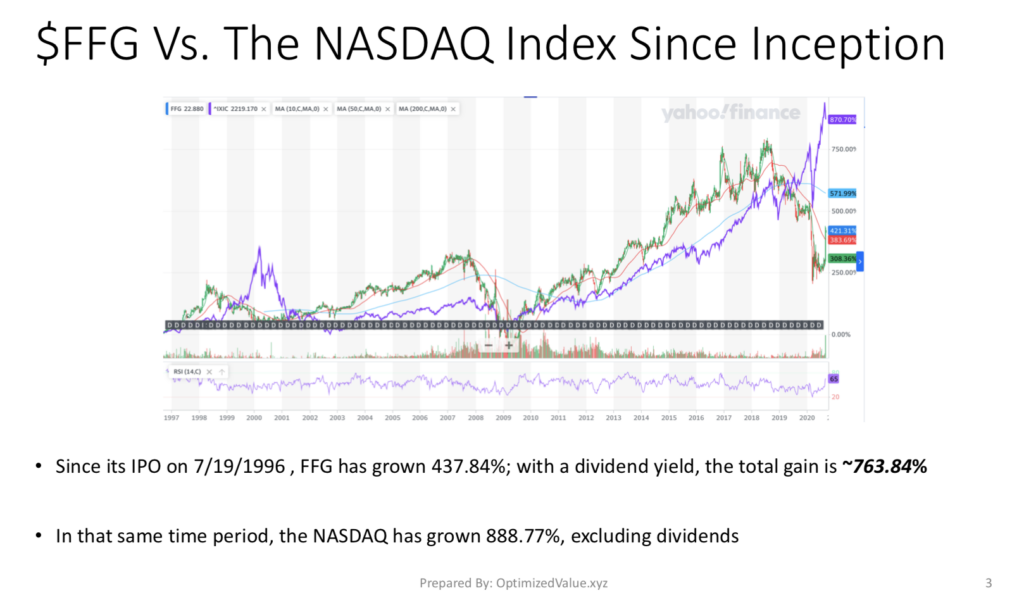
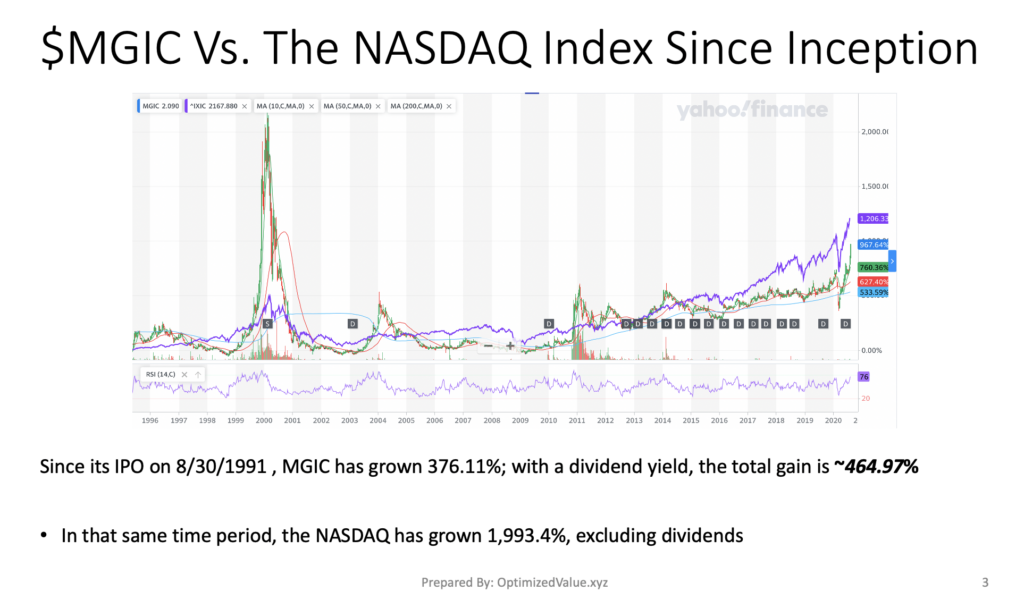
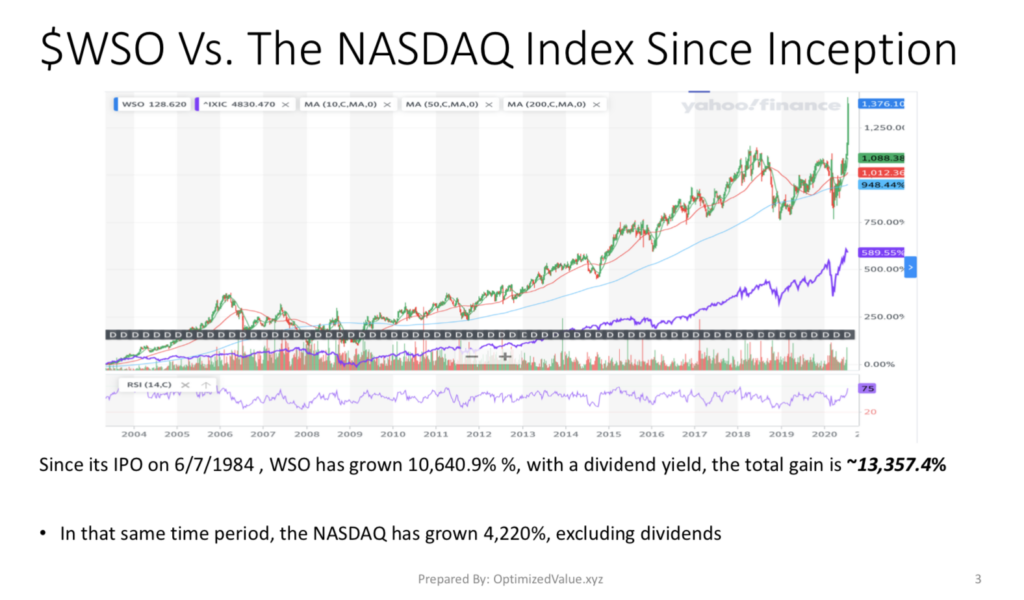
The NASDAQ Index has grown 323.7% in that time, excluding dividends.
Moving forward with the 3.67% Dividend Yield, there is now a much stronger case for investing in CAI stock to compete with the S&P 500 for returns.
Tying It All Together With CAI International Inc. CAI Stock
Overall, CAI stock offers many unique advantages that trades & investors can both benefit from. Their recent technical strength is appealing to traders, while investors like their fundamentals and new 3.67% annual Dividend Yield. When looking at their growth prospects, and adding in the new yield, there is an even stronger case for investment.
*** I DO NOT OWN SHARES OF CAI INTERNATIONAL INC CAI STOCK ***