NVDIA Corp. stock trades under the ticker NVDA and has advanced +68.27% over the past year, rising +76.1% since their 52-week low in February of 2024, but has declined -23.82% since their 52-week high on January 7, 2025 (excluding dividends).
The past six days have proven difficult for NVDA, as despite hitting a fresh 52-week high in early January, the news about DeepSeek, tariff jitters & concerns about Federal Reserve policy have all contributed to volatility for the high flying stock that was one of the darlings of 2024.
Yesterday was especially tough, as they gapped down to open below their long-term trend line (200 Day Moving Average), which may signal that there is a large shift on the horizon for NVDA, as well as other names in the technology & A.I. space.
With that in mind, it is important to understand the strength of NVDA’s support & resistance levels in order to get an idea as to how they may trade in the future when prices retest these levels.
Below is a brief technical analysis of NVDA, as well as a price level:volume sentiment analysis of the price levels NVDA has traded at over the ~1 year.
Included in this data is also their recent support & resistance levels so that readers can gain insight into how strong/weak these support/resistance levels may be in the future, based on past investor behavior.
It is not intended to serve as financial advice, but rather as an additional tool to reference while performing your own due diligence on NVDA.
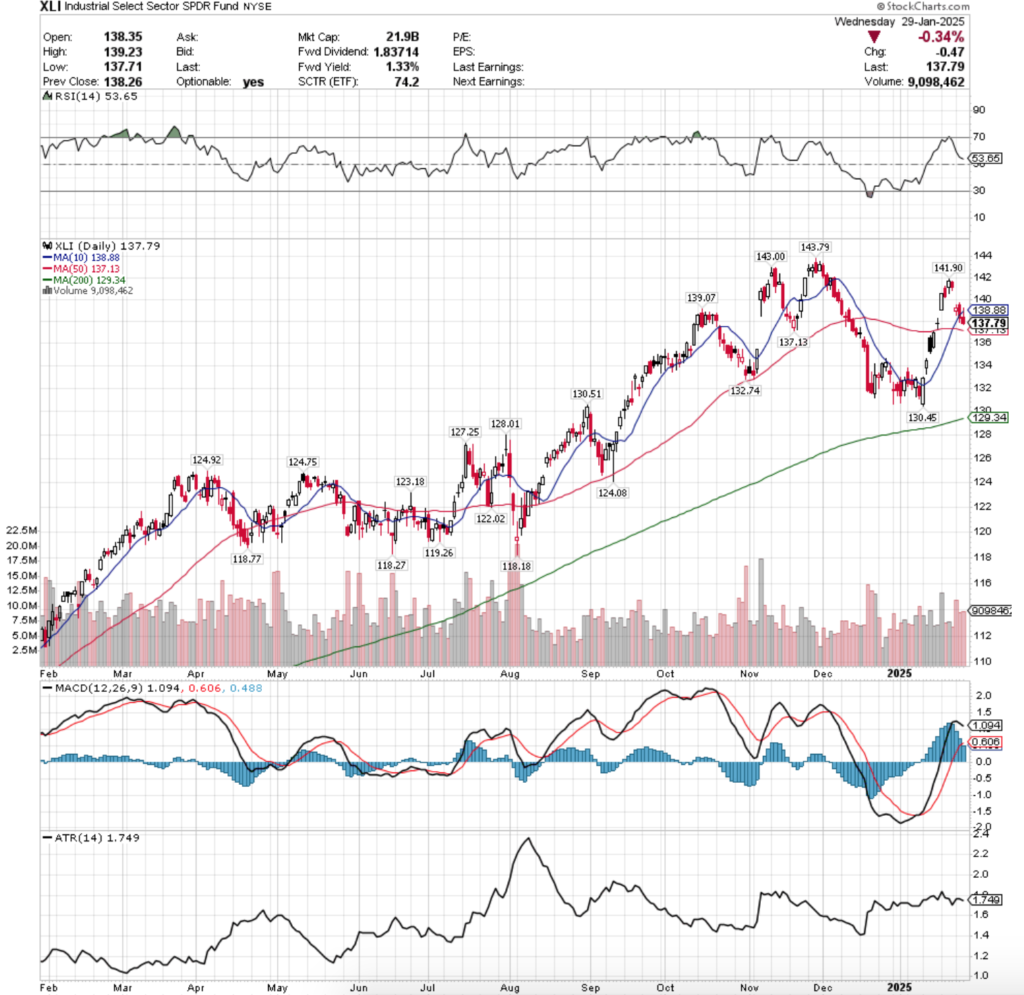
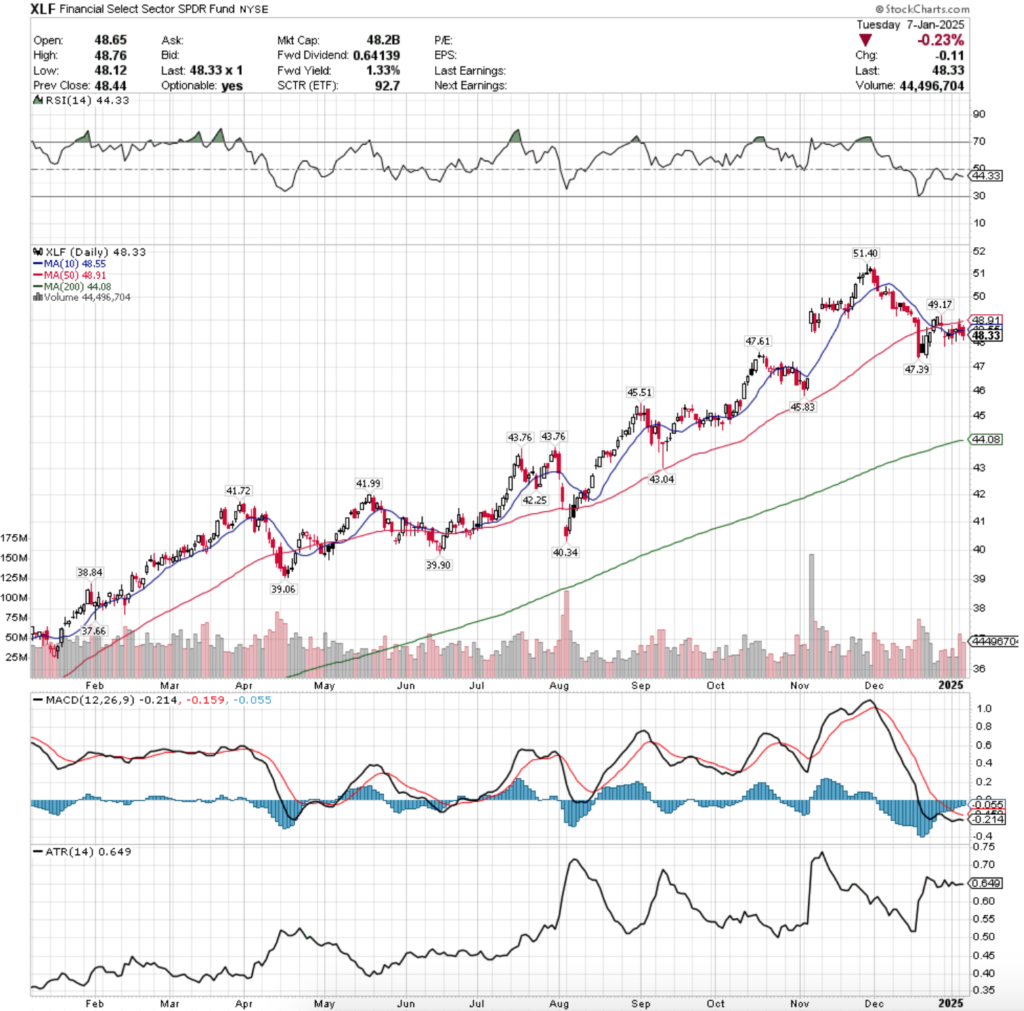
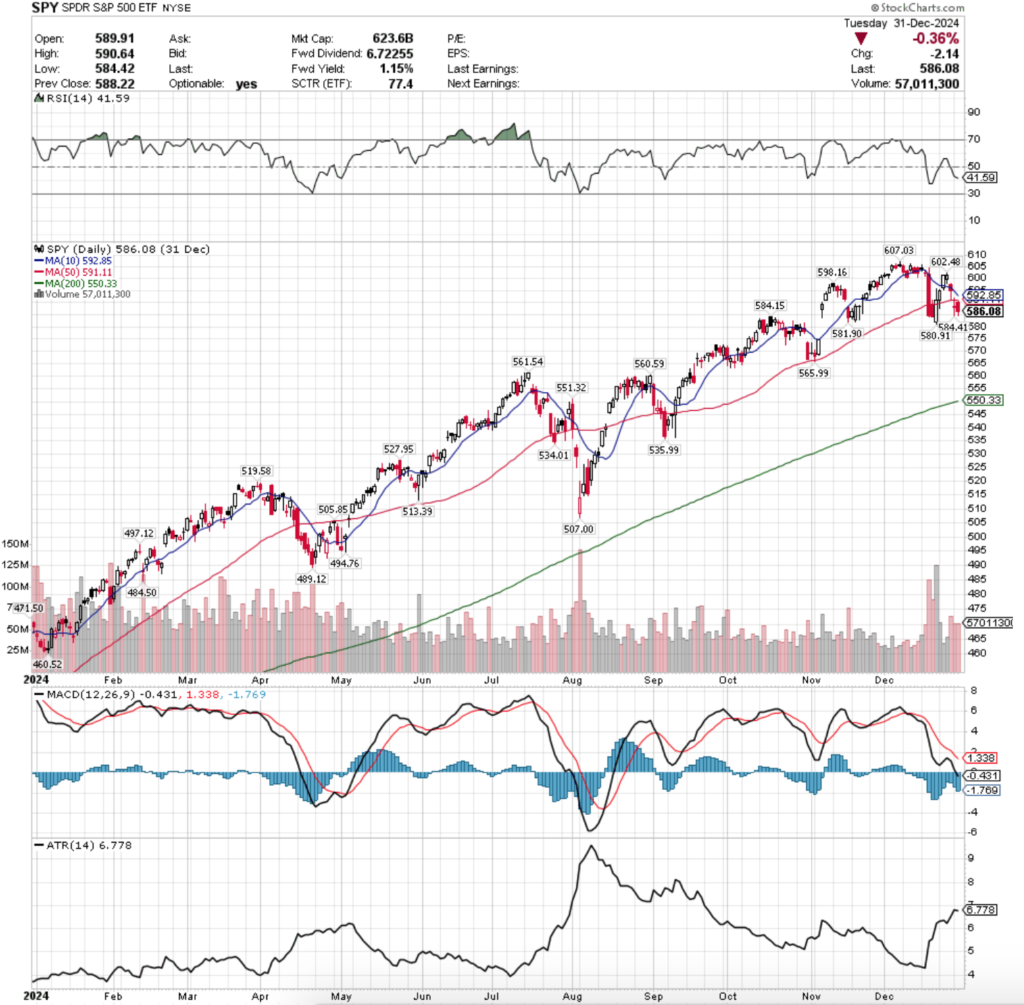
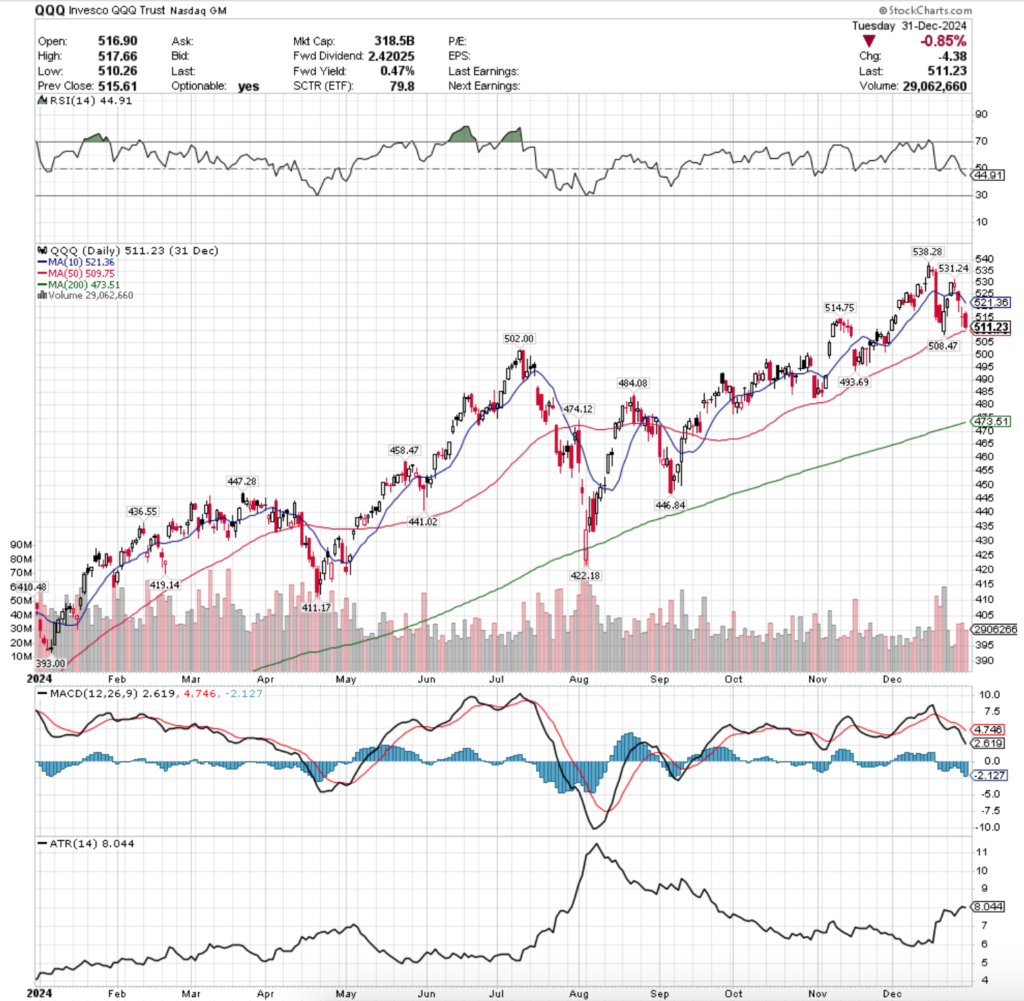
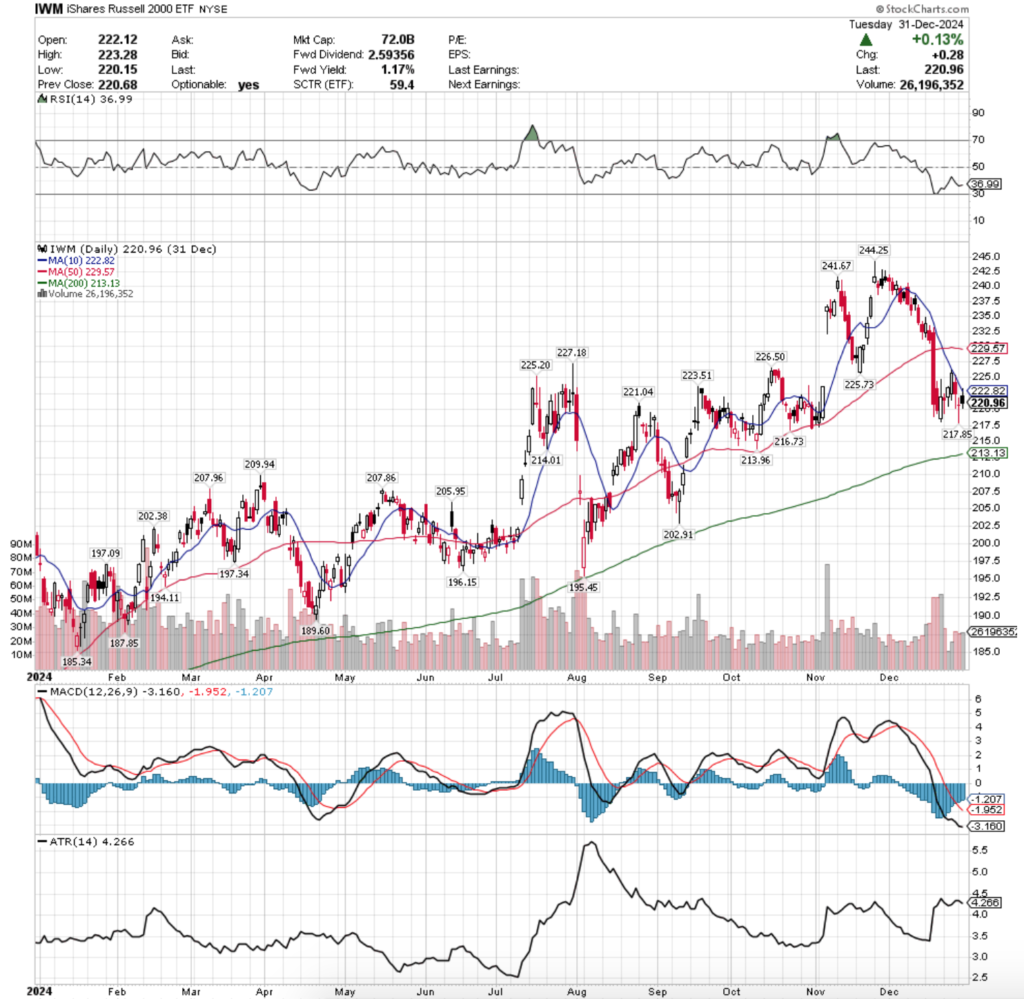
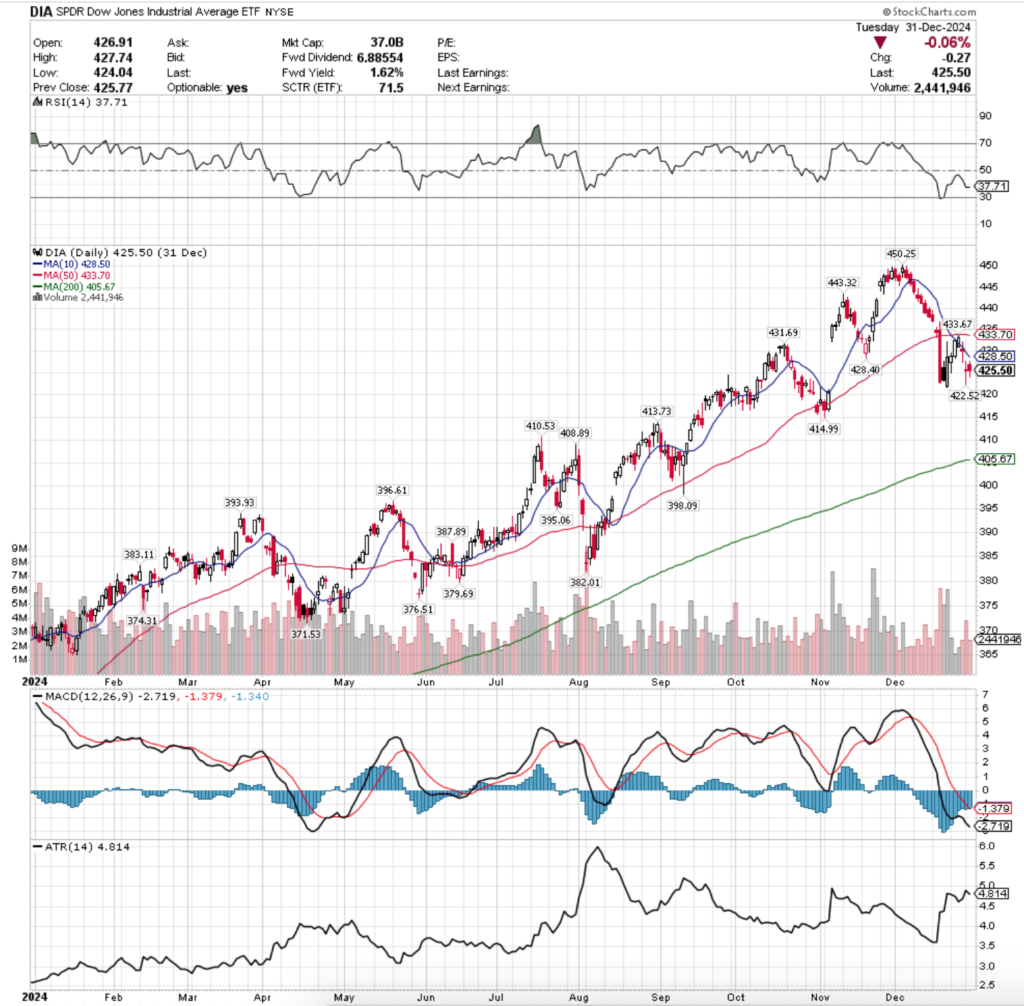
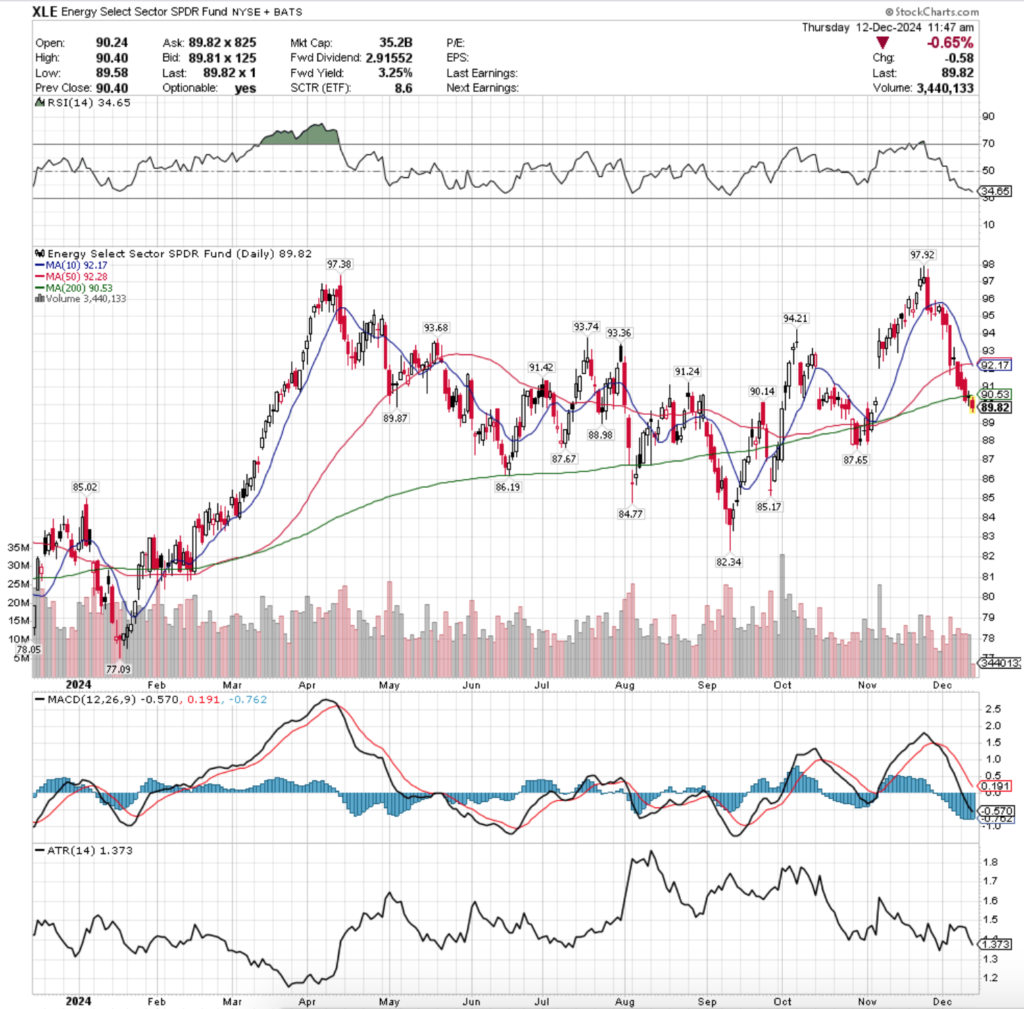
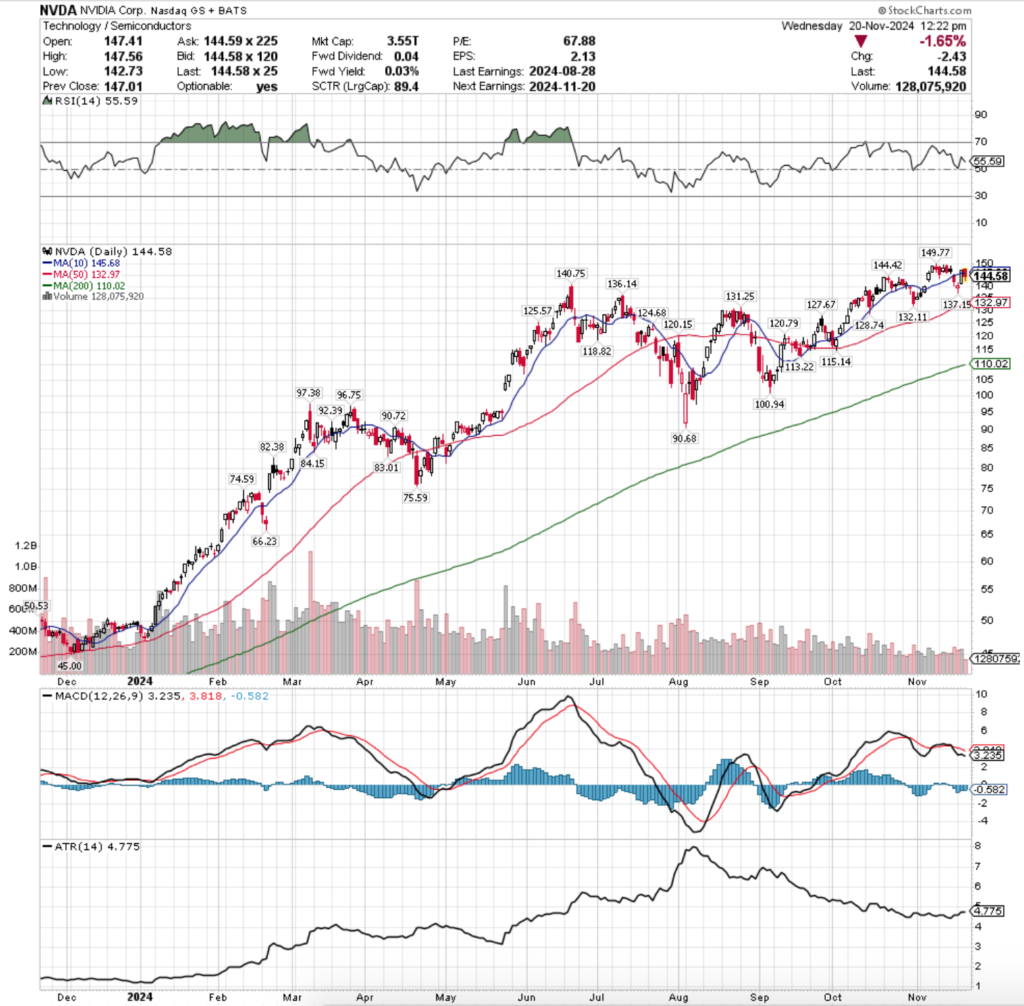
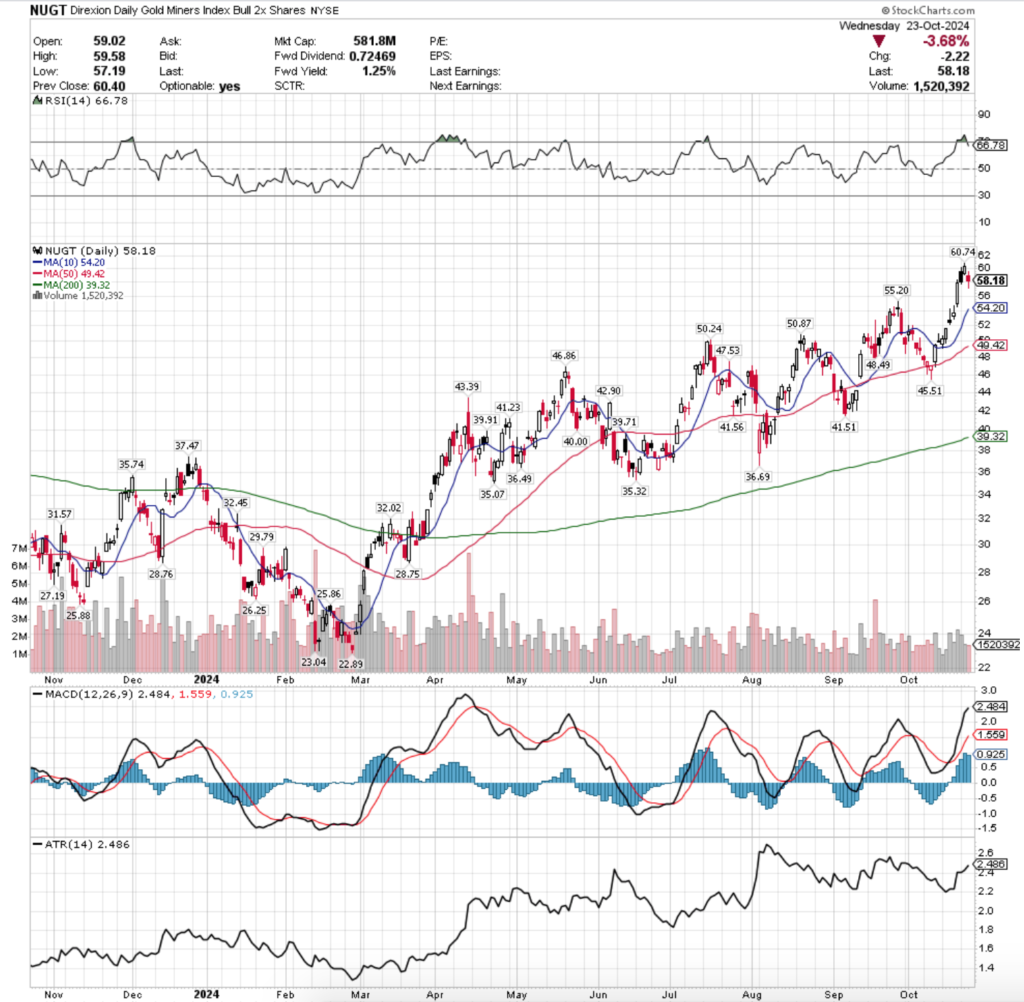
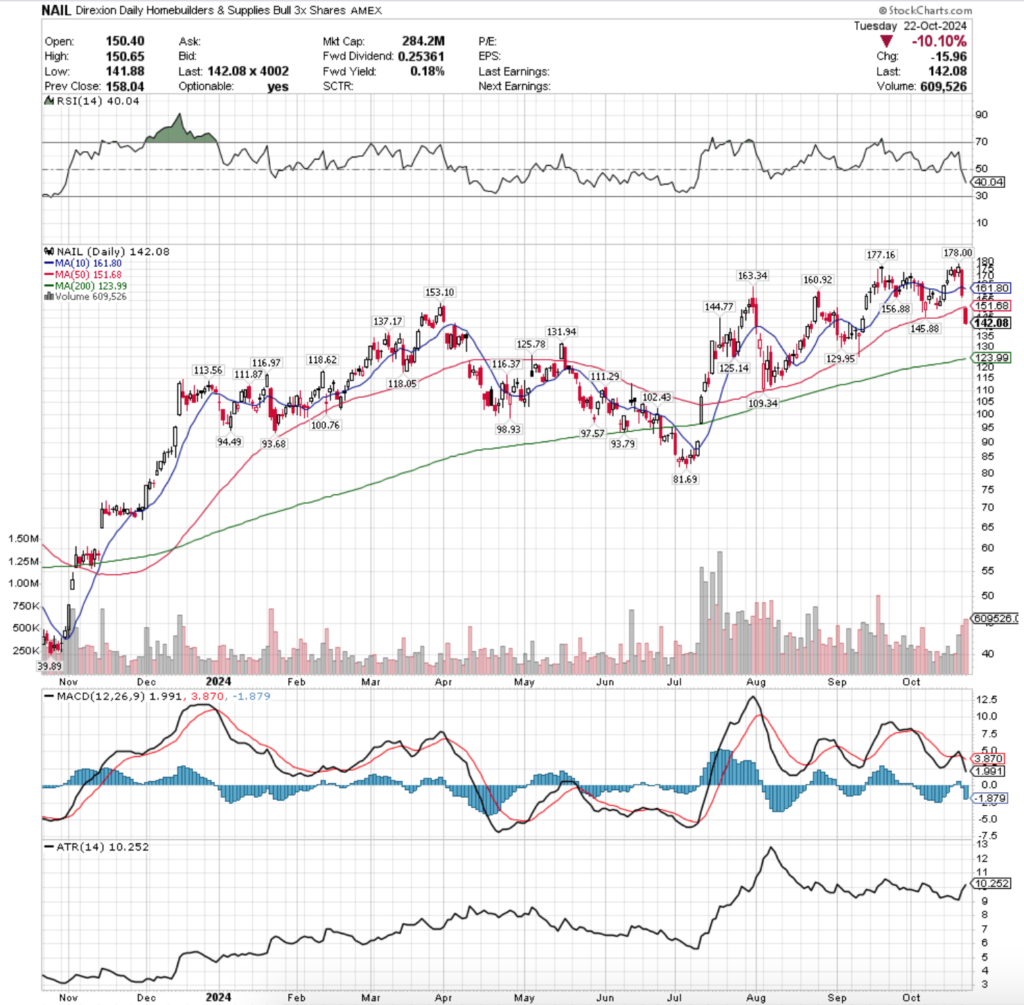
Technical Analysis Of NVIDIA Corp. NVDA Stock
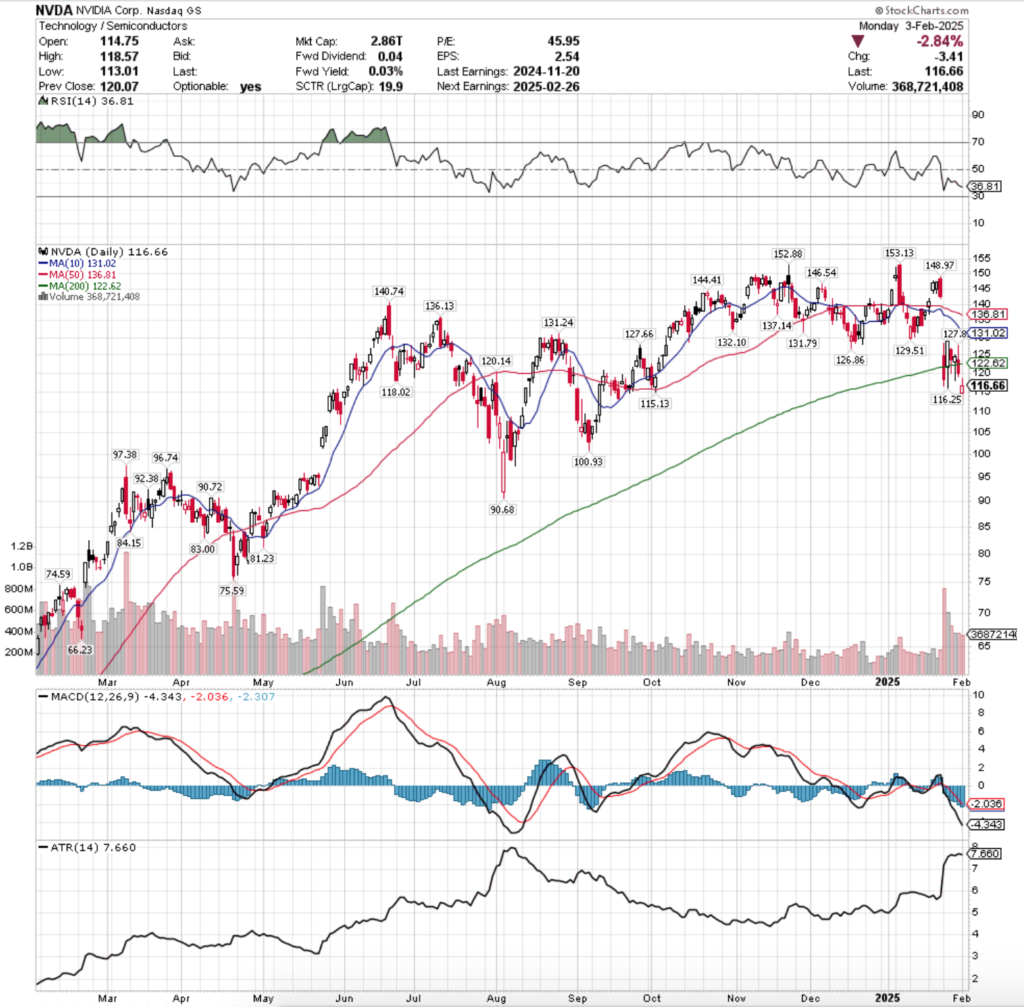
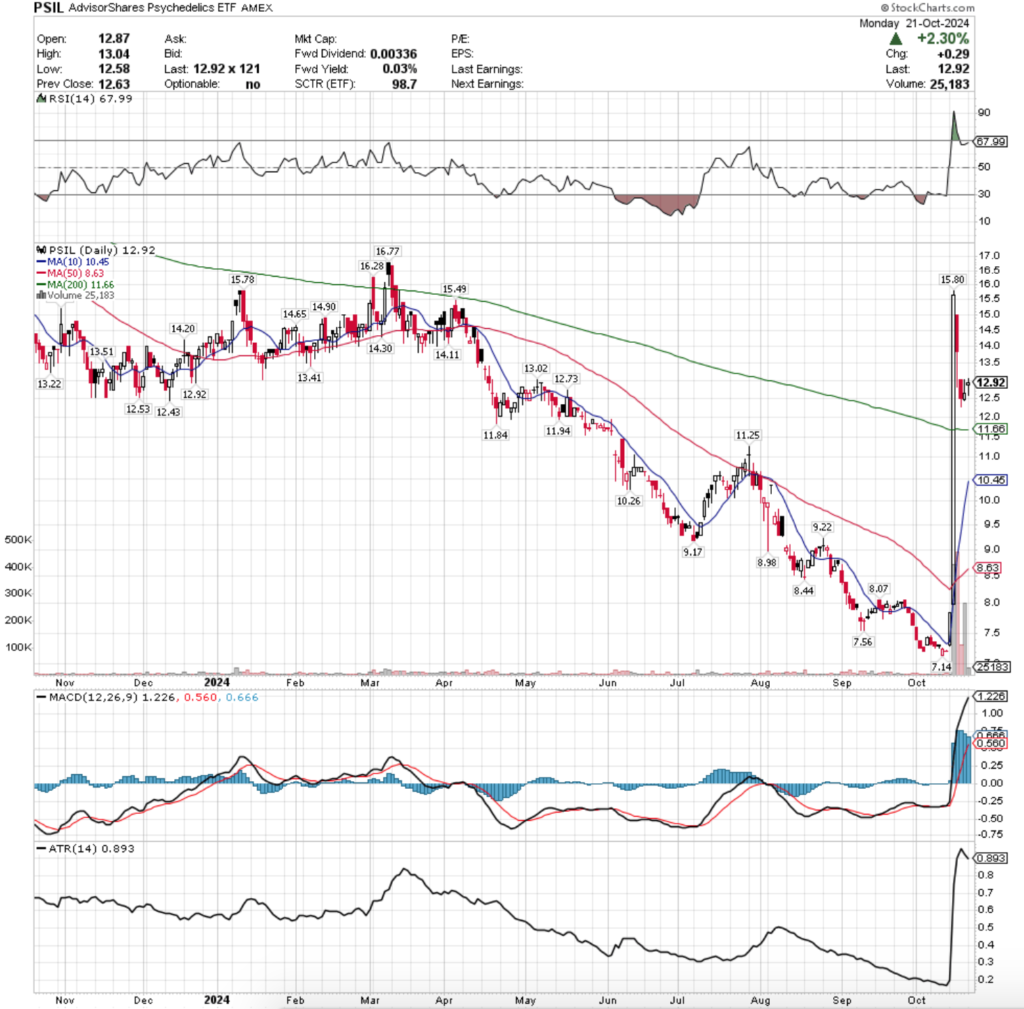
Their RSI is trending toward the oversold level at 30 & sits currently at 36.81, while their MACD has been bearish for the past week & its histogram is becoming more bearish after yesterday’s -2.84% decline.
Volumes since last Monday have been +38.49% higher than the prior year’s average (508,360,000 vs. 363,455,360), which is a bad sign given that most of that volume has been during declines & consolidation moves.
It is also worth noting that the major index ETFs have had far less volume over this time period, SPY’s last week was -5.93% lower than the prior year’s average, QQQ’s was +3.59% above its average, IWM was -16.66% lower than its average & DIA was -16.99% below its prior year’s average (per last week’s market review note).
That’s a pretty large discrepancy in volume between the indexes & NVDA & should be a cause for concern & something to keep watch of in the coming weeks.
Last Monday’s gap down was written in the stars after the preceding Friday’s high was unable to break above the second highest resistance level of the past year & the day’s candle formed a bearish engulfing pattern with the day prior.
Monday opened on a gap down that skipped through the 10 & 50 day moving averages, tested higher but was unable to touch the $129.51/share resistance point & prices broke down to cross the 200 day moving average’s support bearishly & close beneath it.
The lower shadow on the day’s candle also indicates that there is more downside appetite, but for the day the bulls were able to push prices above it.
Monday’s declining volume also eclipsed all but 3-4 sessions of the previous year based on a quick glance at their chart; sentiment has become questionable.
Tuesday NVDA opened in-line with its 200 day moving average, went lower than Monday’s lowest price, before the bulls stepped in to push prices higher for a gain on the day & a close above the resistance of the 200 day moving average.
Crisis was not averted though, as Wednesday opened lower near the middle of Tuesday’s candle’s real body & broke downward through the 200 DMA’s support, before climbing back up to close just above it, but with a lot of room to the downside covered by its lower shadow.
While Tuesday featured a lot of folks jumping back into the pool, Wednesday saw ~80%+ of that volume as declining, so there is quite a bit of uncertainty in the volume sentiment locally.
Thursday opened on a gap lower, broke down through the long-term trend, but was able to muster up the bullish support to power higher & close the day as an advancing session.
However, two notes of caution: A) that candle resembles a hanging man, but since it is in a consolidation range & not marking a top or bottom it is not a true hanging man (bearish) & B) volumes declined so much from the beginning of the week that it is hard to find anything to be enthusiastic about in terms of losing bearish sentiment.
Friday this was confirmed when NVDA opened slightly lower, pushed higher but got stopped at the $127.85/share level, before puking to close below the 200 DMA.
Monday saw NVDA take another leg lower on an opening gap down to below the $115/share mark & on light volume compared to the prior five days bulls were able to push the prices higher throughout the session to close above their open, but well below Friday’s close & its low.
Monday’s moves also flash a caution sign as the day closed above where it opened, but with that weak of volume vs. the previous five days there was not much bullishness to the move & it seemed more like cautious dip buying & perhaps some monthly rebalancing that was taken as a result of the lower prices.
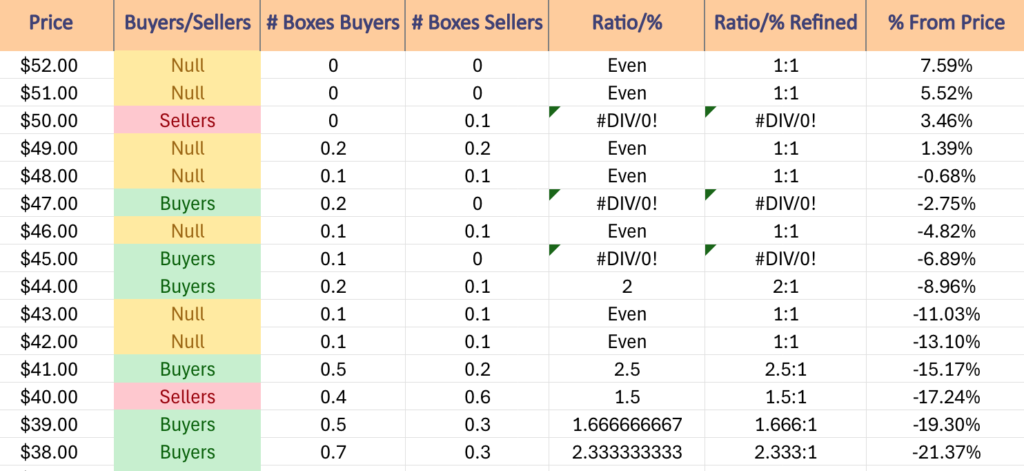
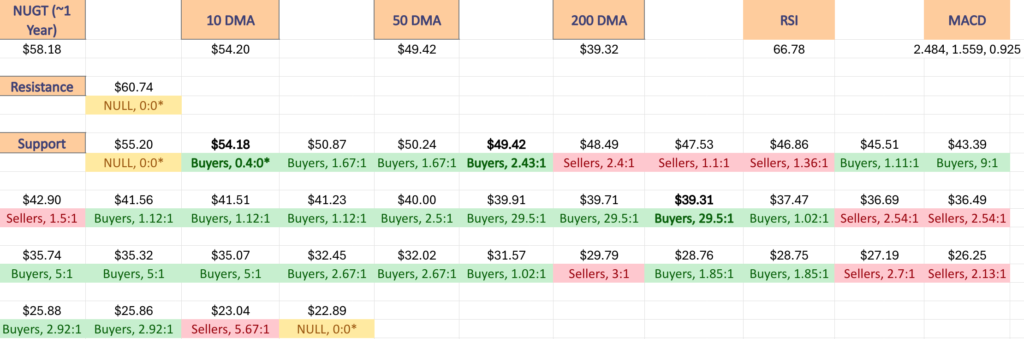
The next support level to keep an eye on is $115.13, which will be where most market participants’ attention will be for the next week, particularly as over the past year it has been relatively even in that price zone between Buyers & Sellers.
Another area of focus will be the 10 & 200 day moving averages, as after today’s session 5 of the past 7 sessions closed below the long-term trend line & a bearish crossover appears imminent unless prices get squeezed higher.
Should this happen there will be some interesting movement for NVDA’s prices, as the bearish signal may be the catalyst that pushes prices down into a densely concentrated zone of historic Seller dominance over Buyers, which would then allow the 50 DMA time to catch up & also death cross.
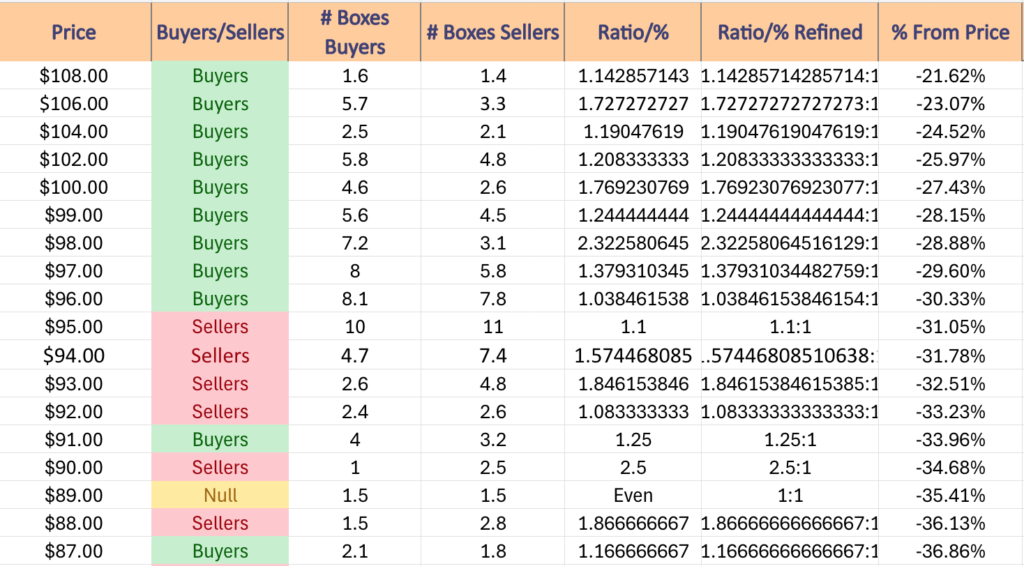
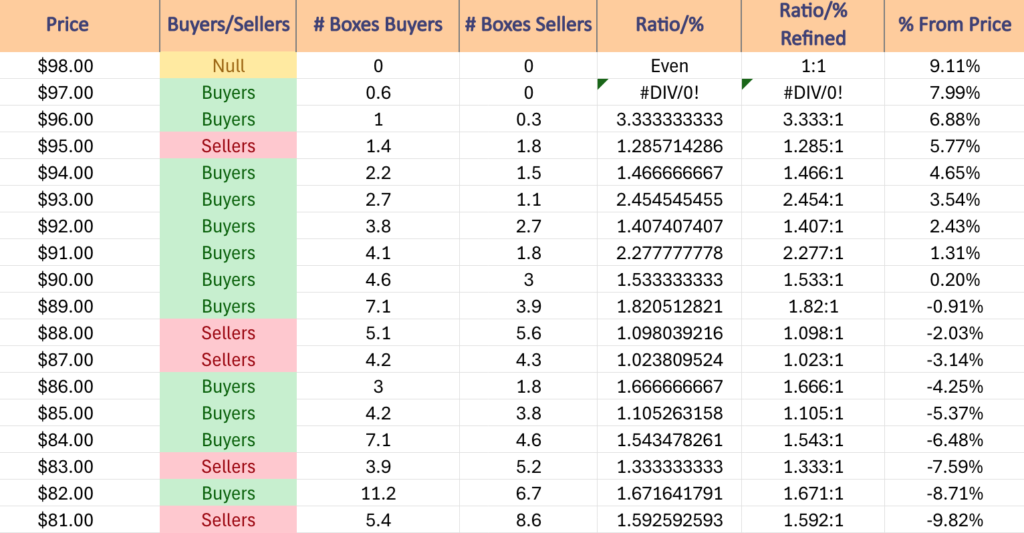
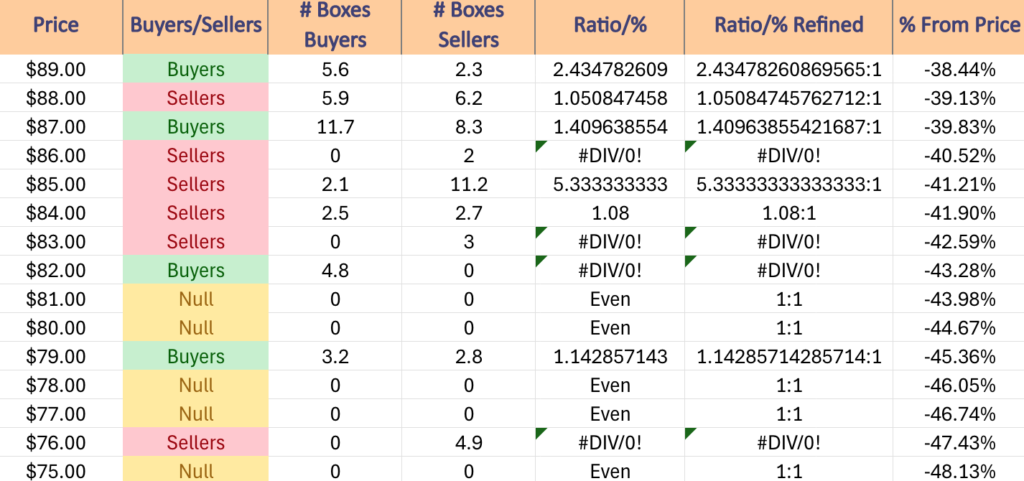
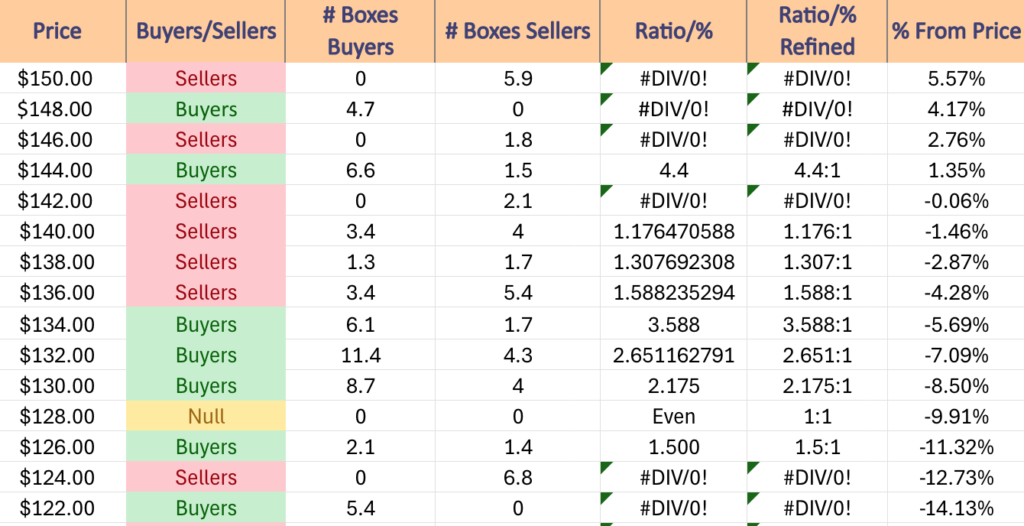
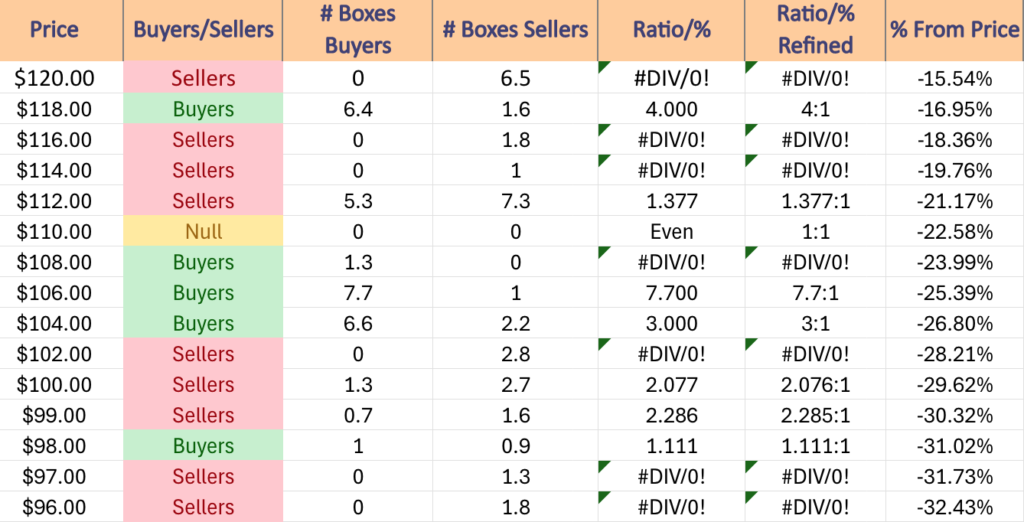
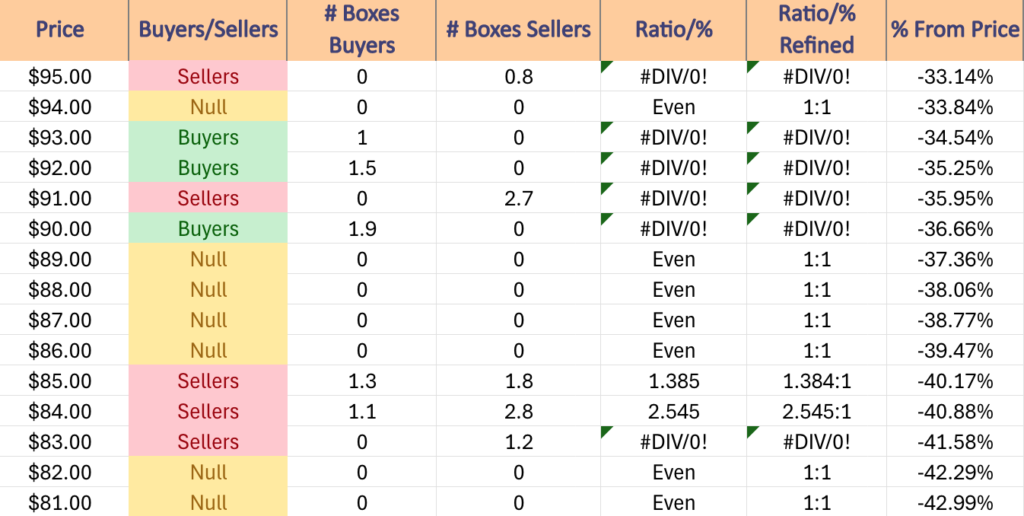
There are no support levels between the $115.13 & $100.93/share levels, making it a potential slippery slope, especially when combined with Seller dominance from the $111.99-$97.99/share zone.
It is also worth noting in the section below that there is a NULL zone from $96-97.99/share & that the $95-95.99/share zone is Buyer dominated, but relatively untested as the Seller portion of the ratio (denominator) is 0.
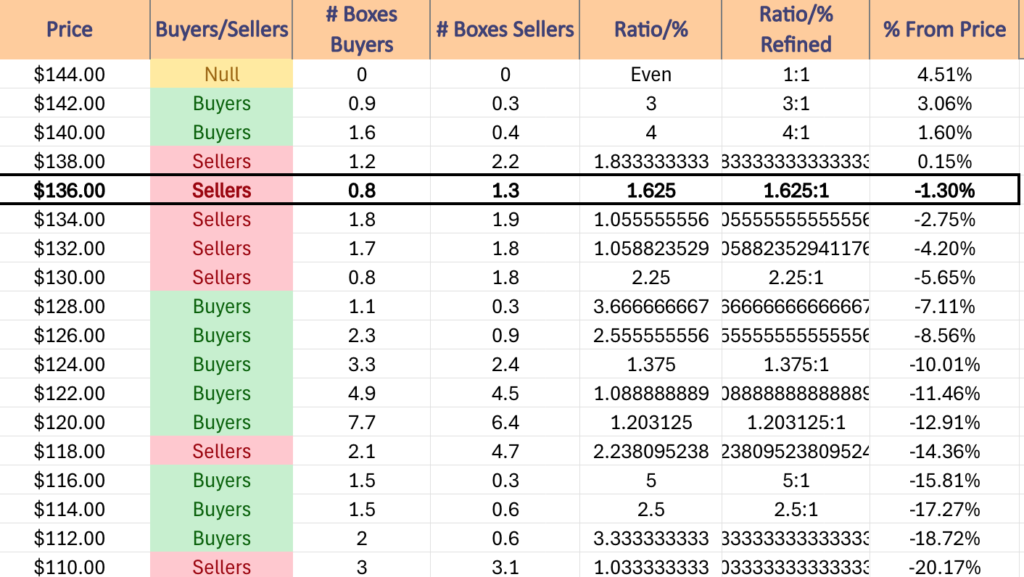
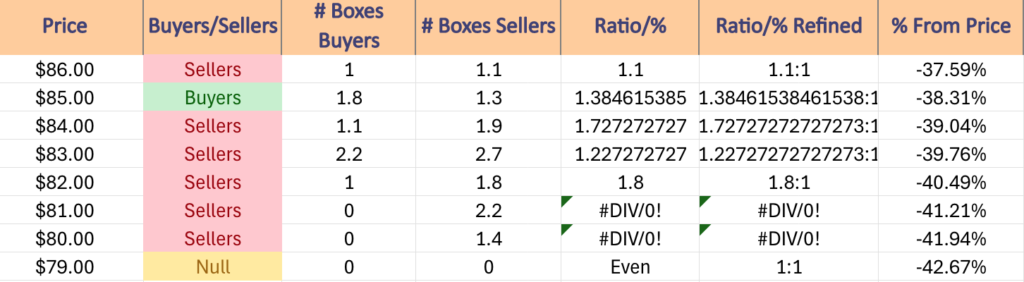
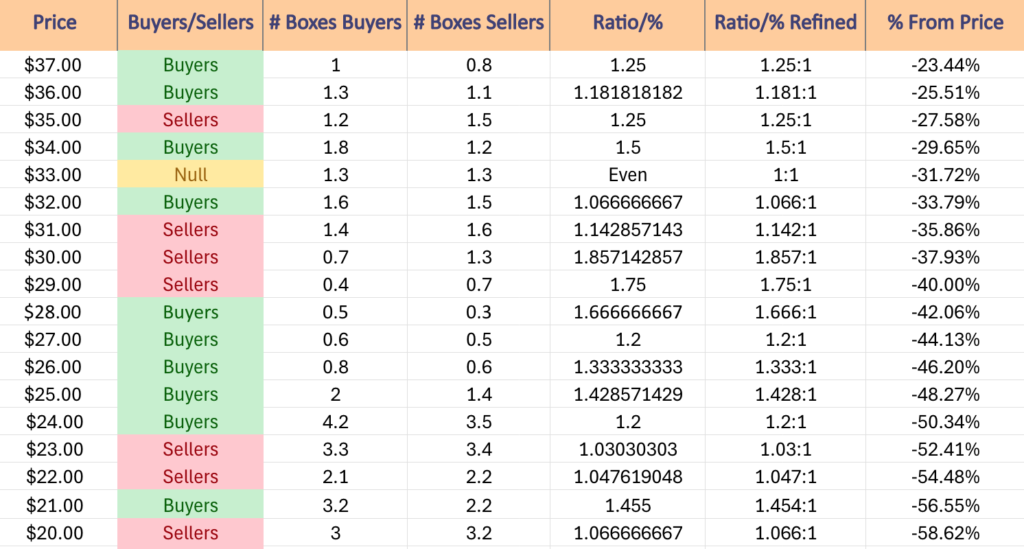
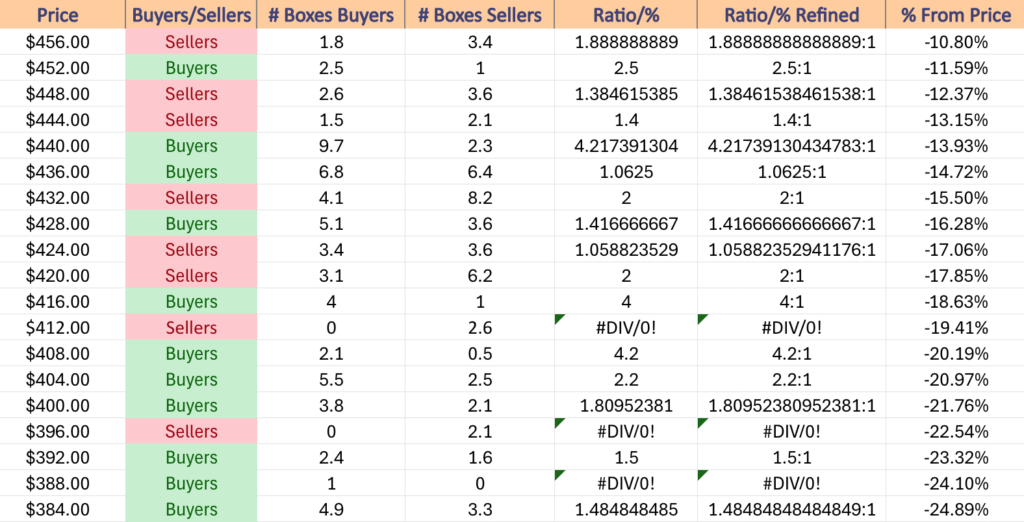
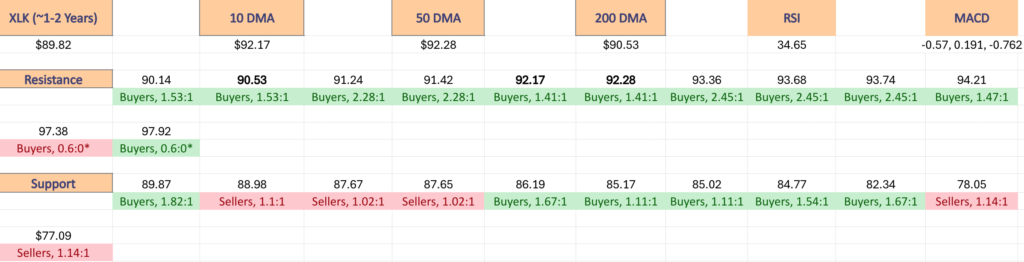
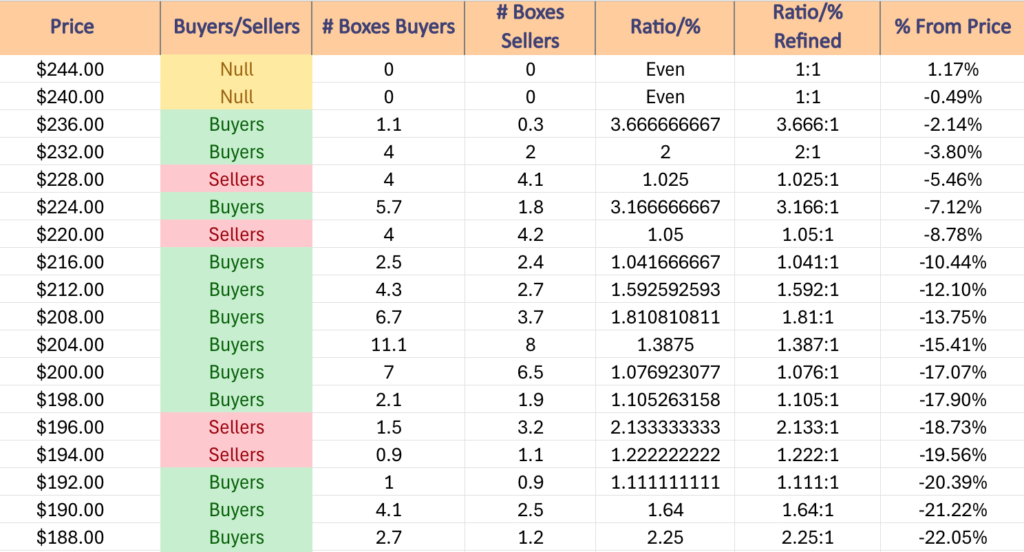
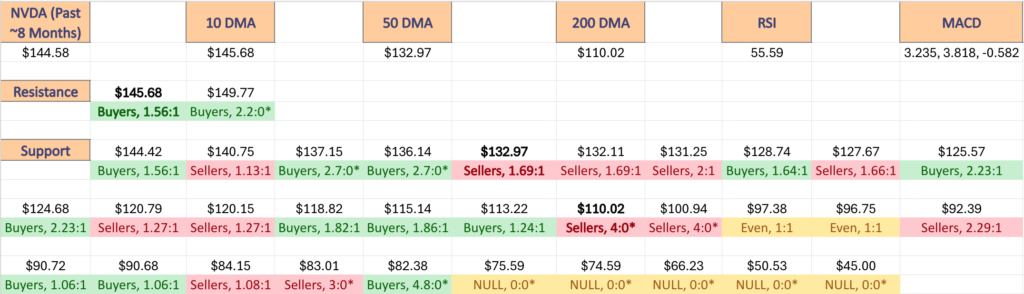
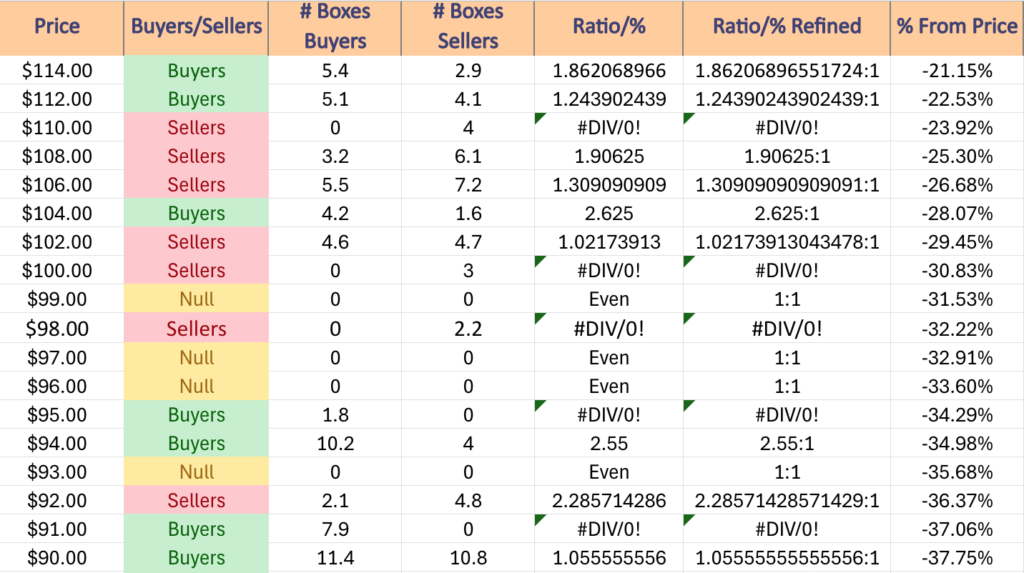
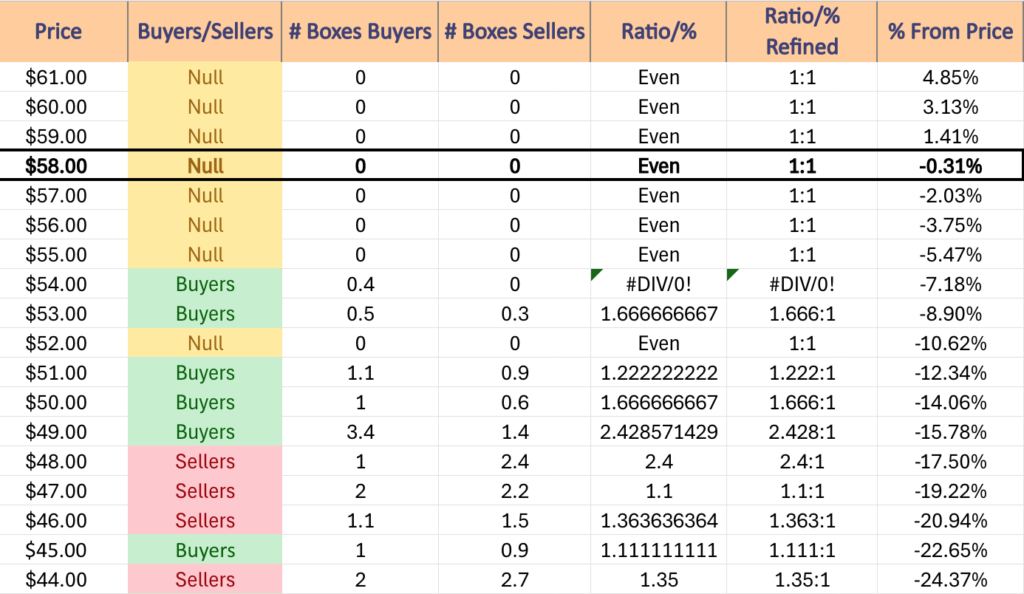
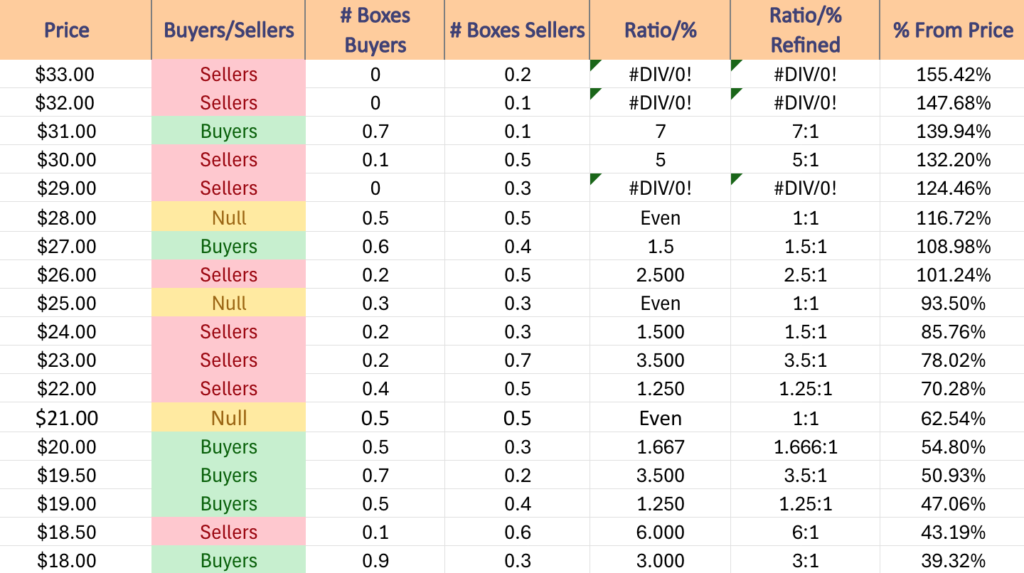
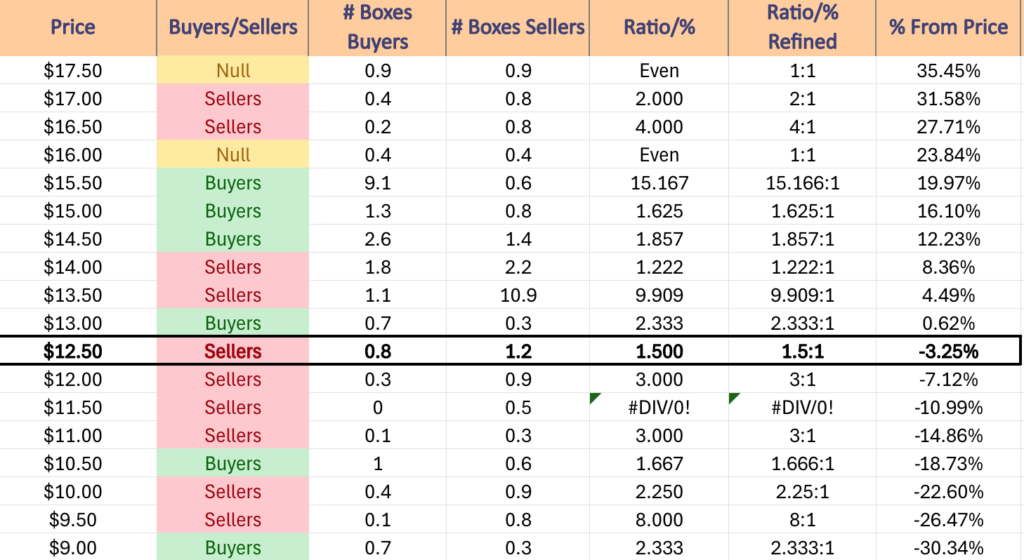
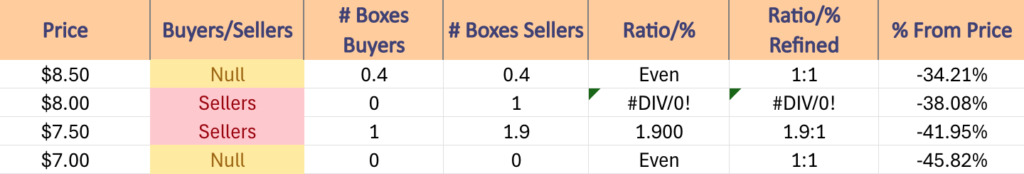
The following section lays out NVDA’s one year support/resistance levels, as well as their Buyer:Seller (Seller:Buyer) ratios at each price level that they’ve traded at over the past ~1 year, which can be used as a barometer for estimating the expected strength/weakness of each of the support/resistance levels.
Price Level:Volume Sentiment Analysis For NVIDIA Corp. NVDA Stock
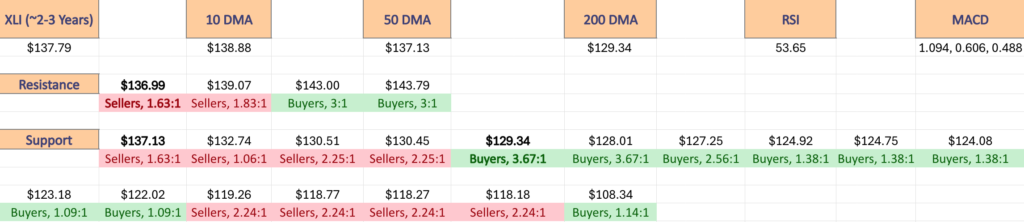
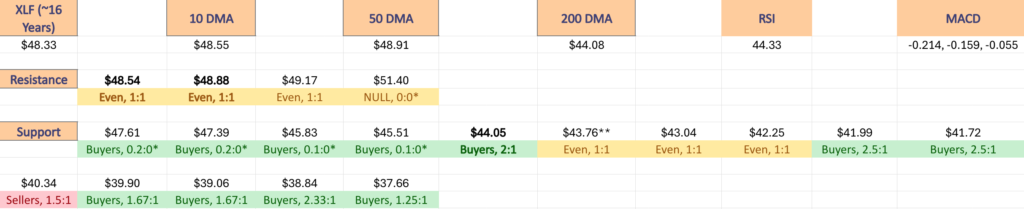
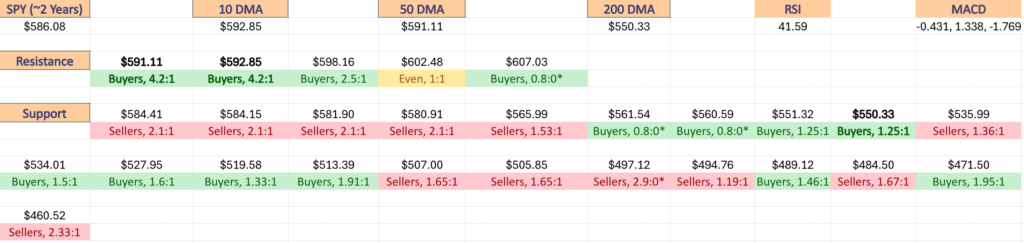
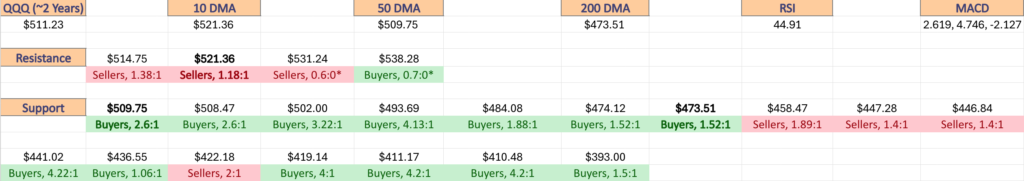
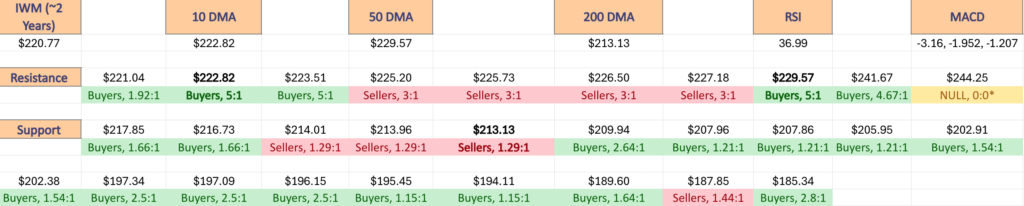
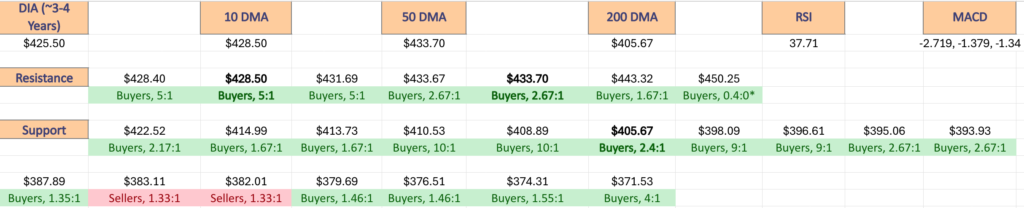
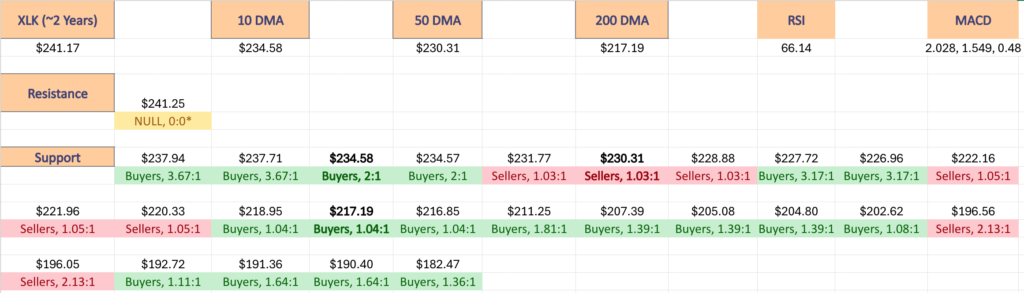
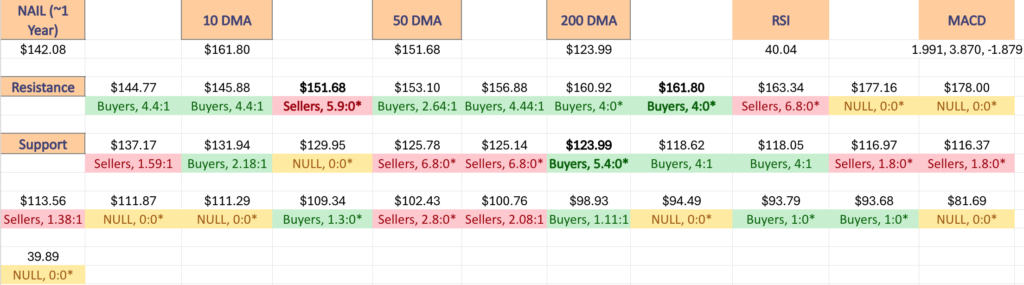
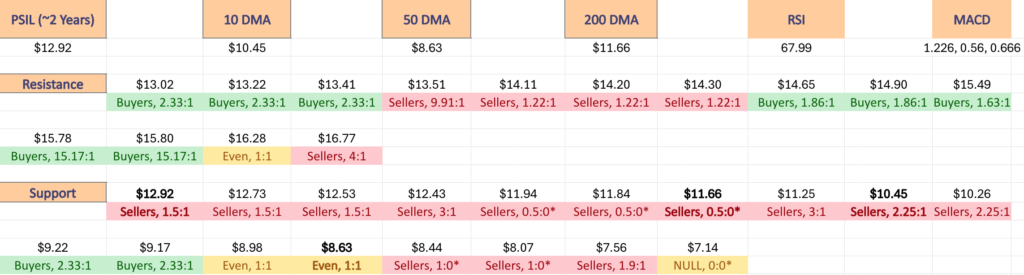
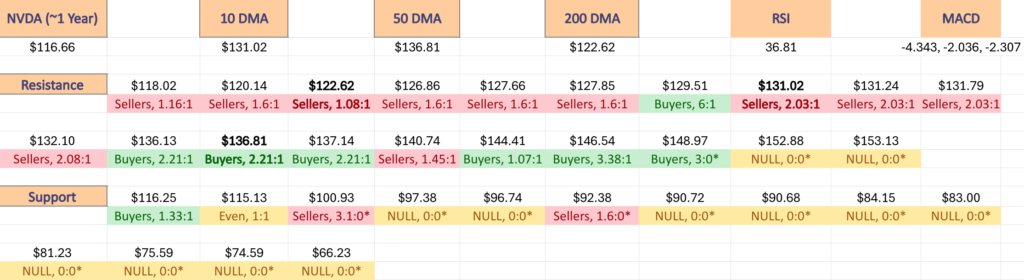
The top table below shows the support & resistance levels of XLI from the past year’s chart, as well as their price level:volume sentiment at each from data covering the past ~1 year, using Monday 2/3/2025’s closing data for their price & moving averages/other technicals.
The moving averages are denoted with bold.
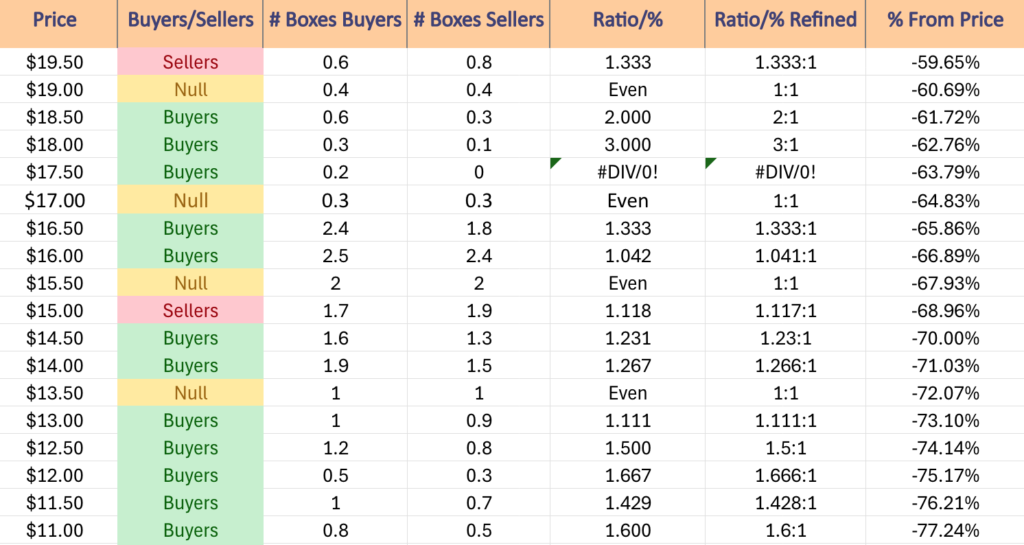
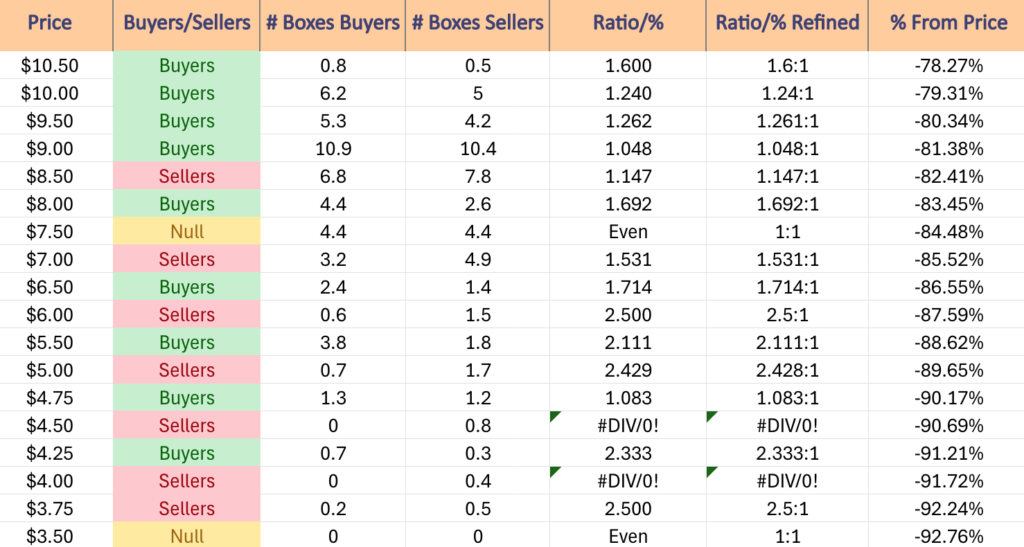
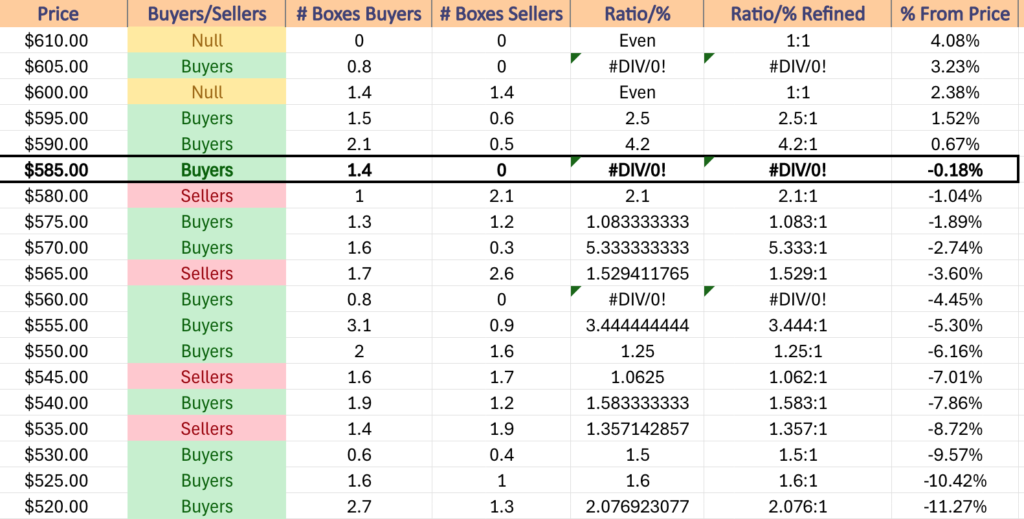
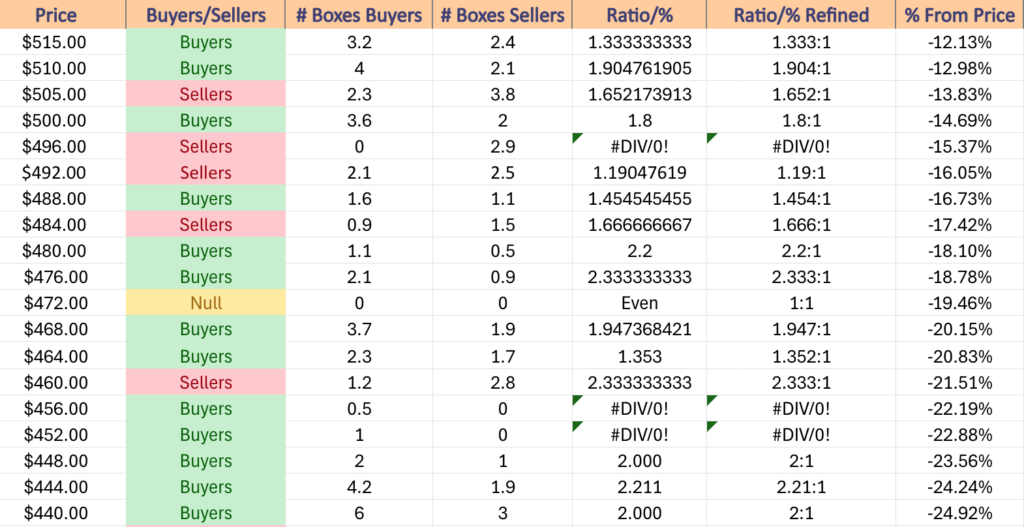
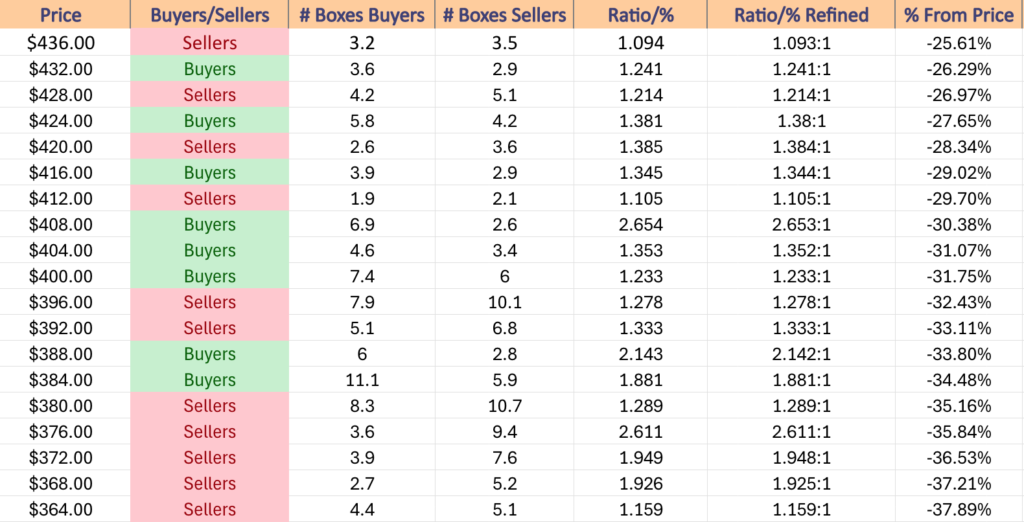
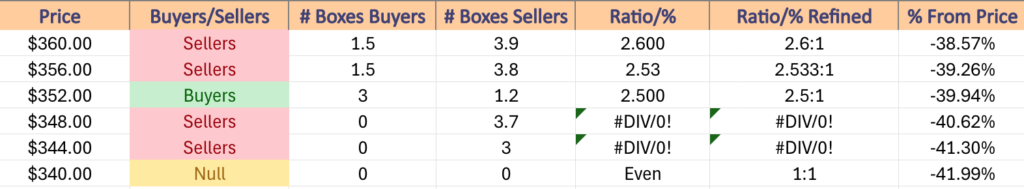
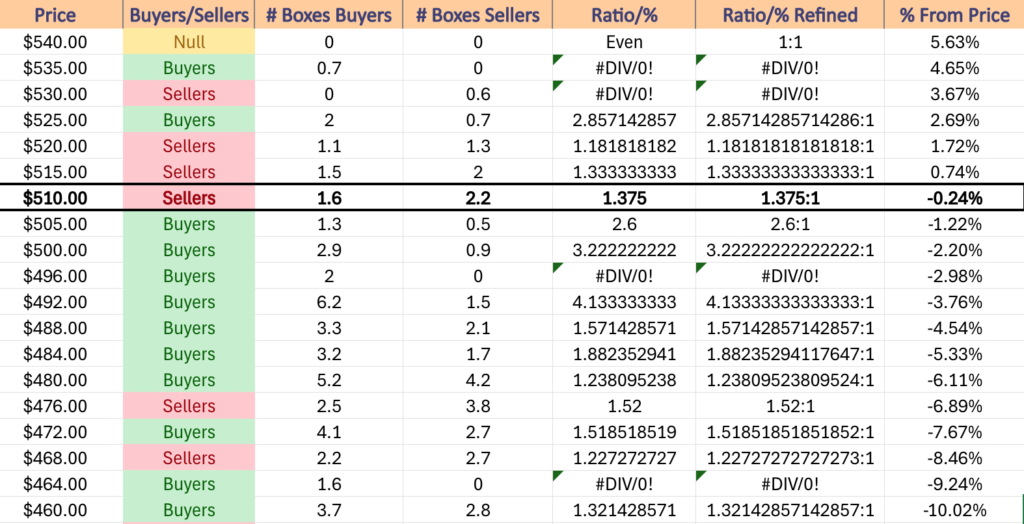
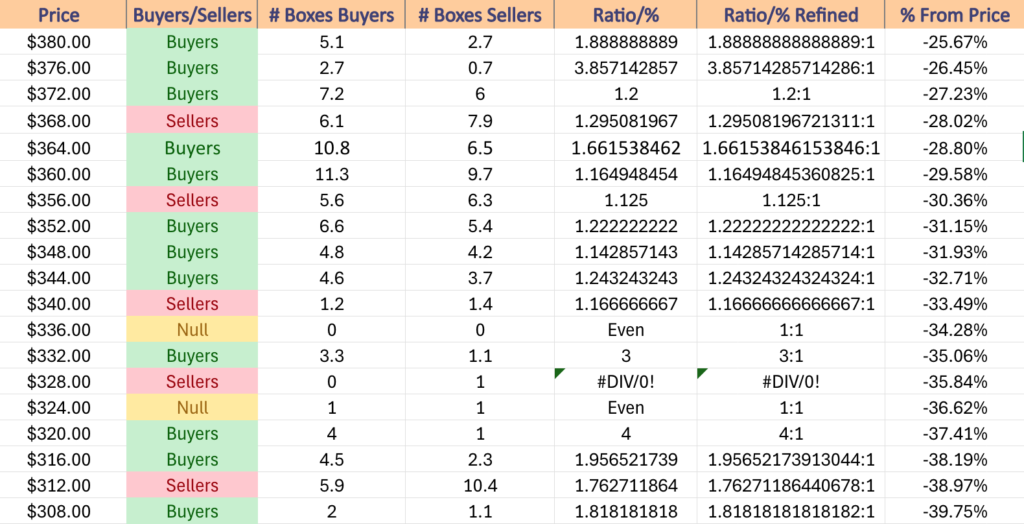
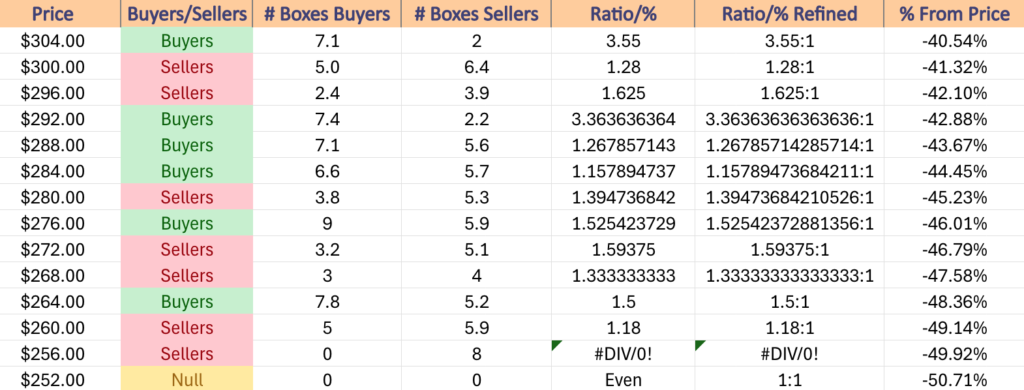
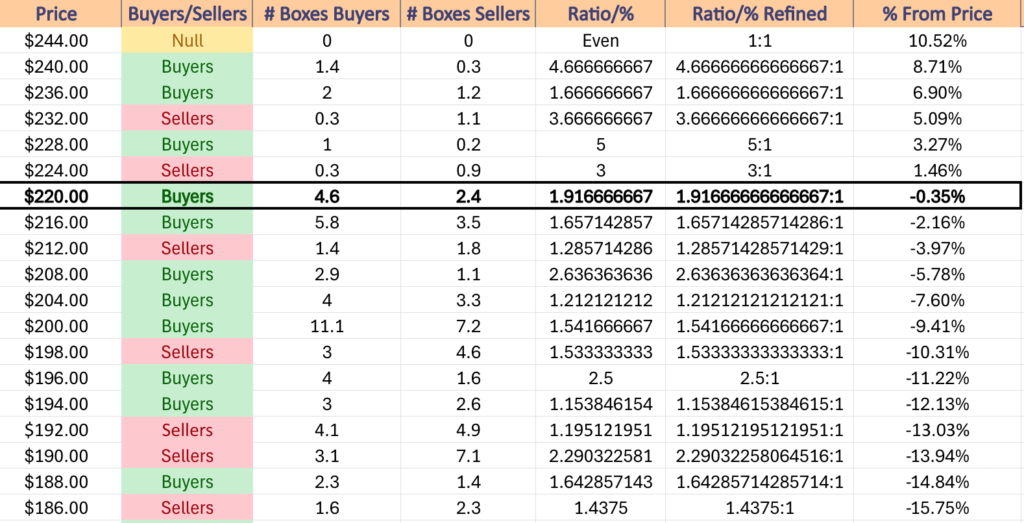
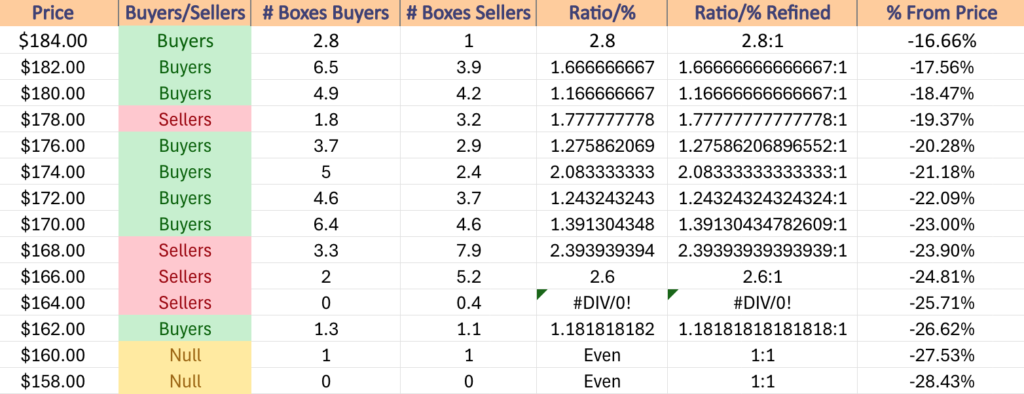
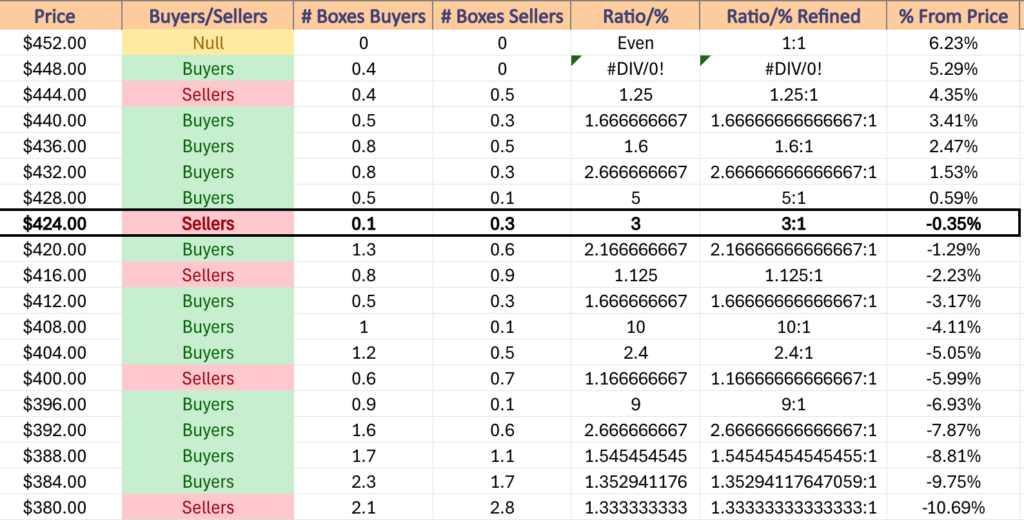
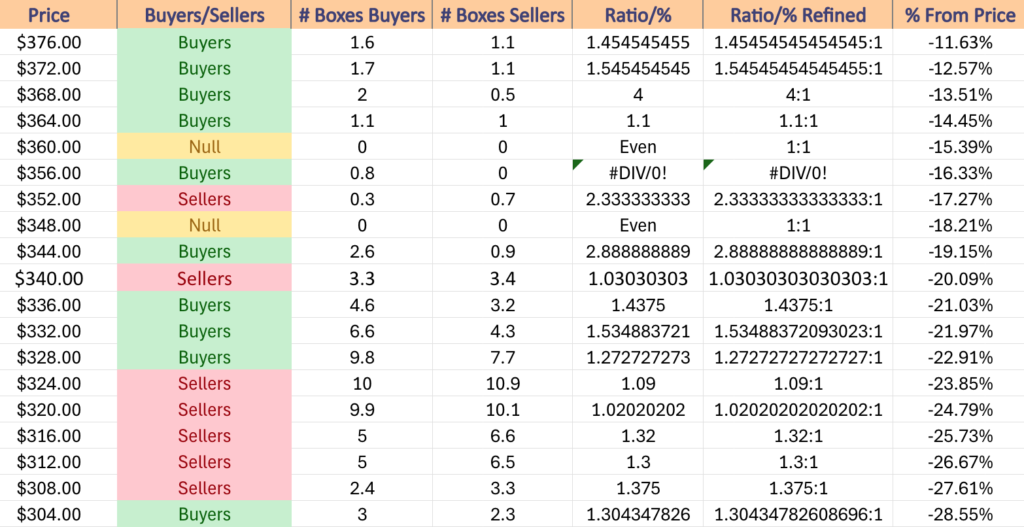
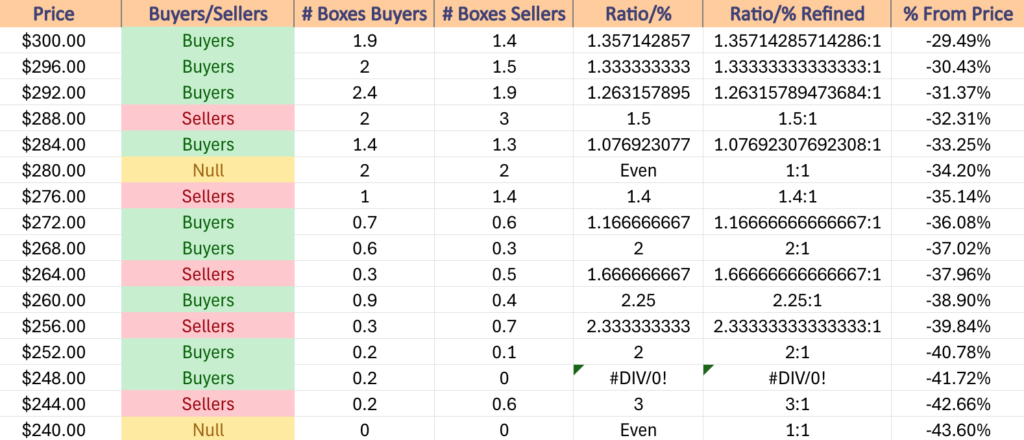
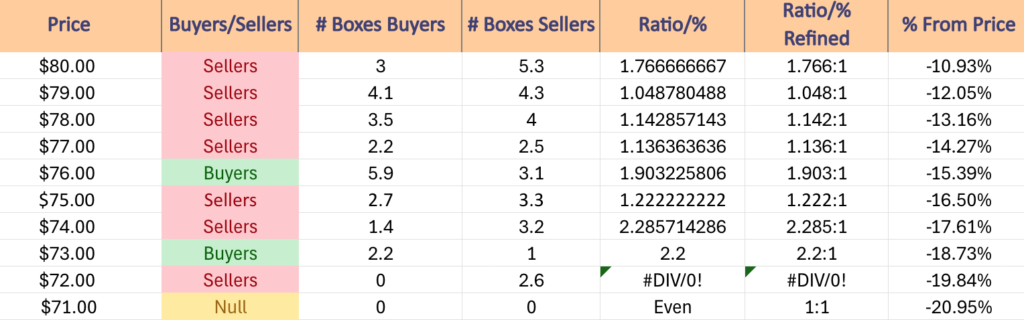
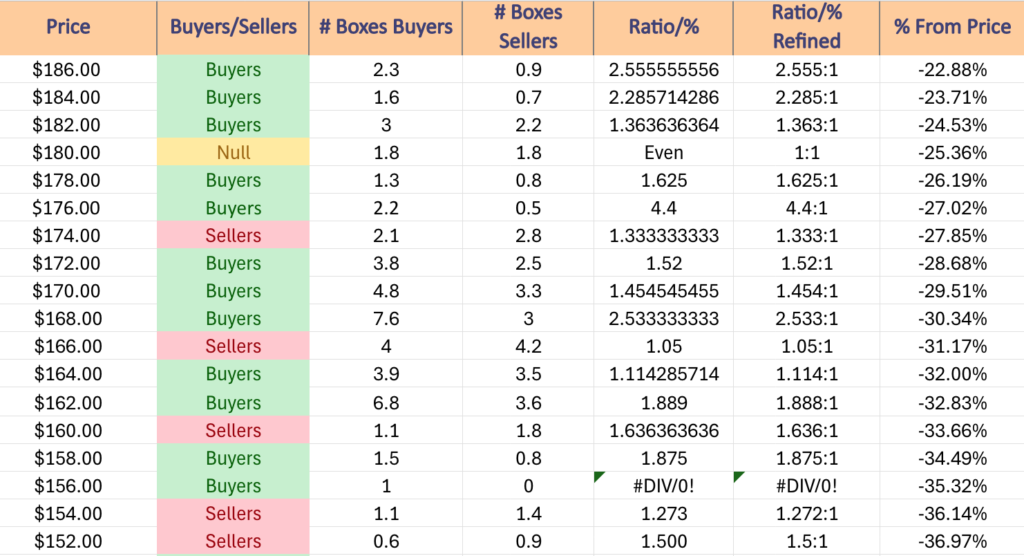
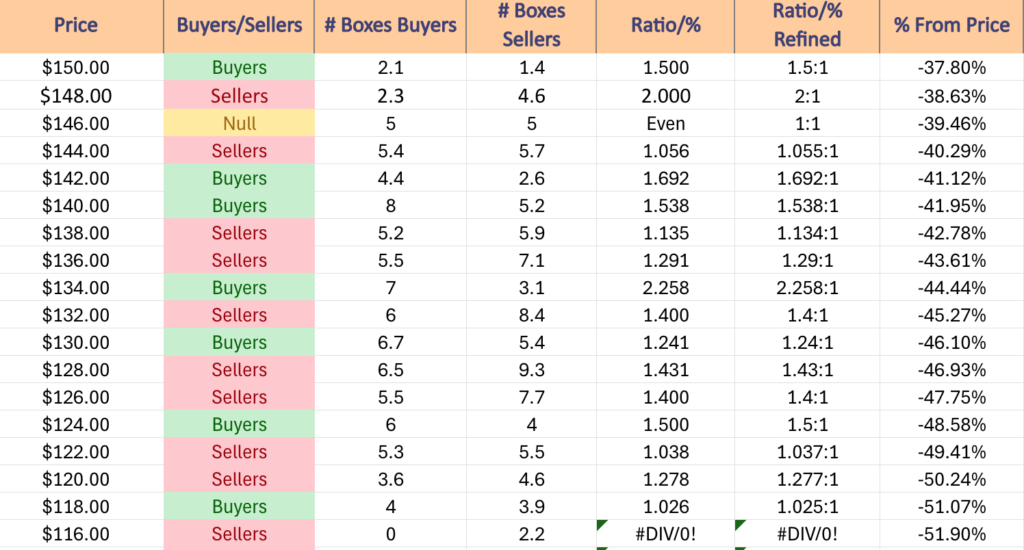
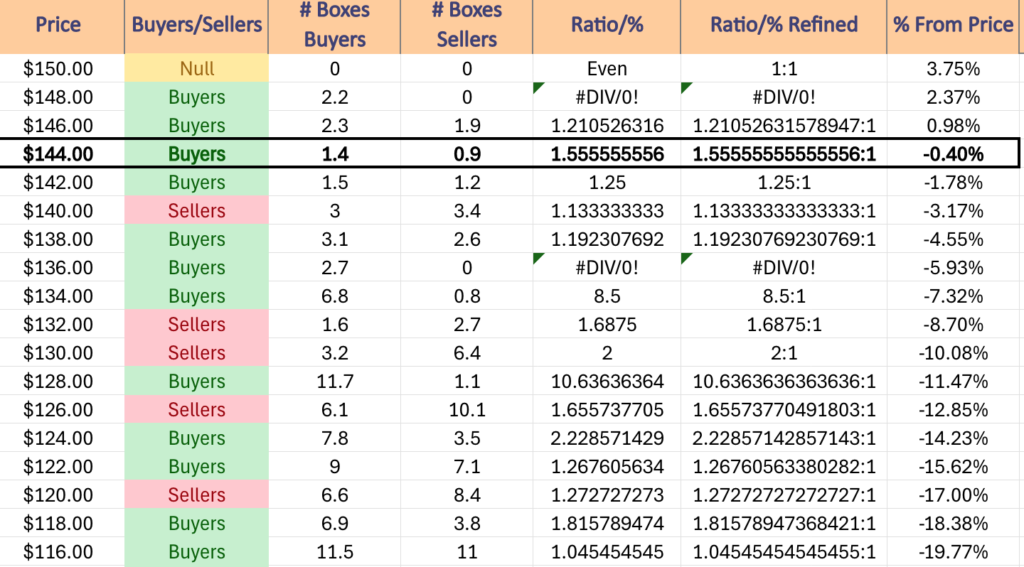
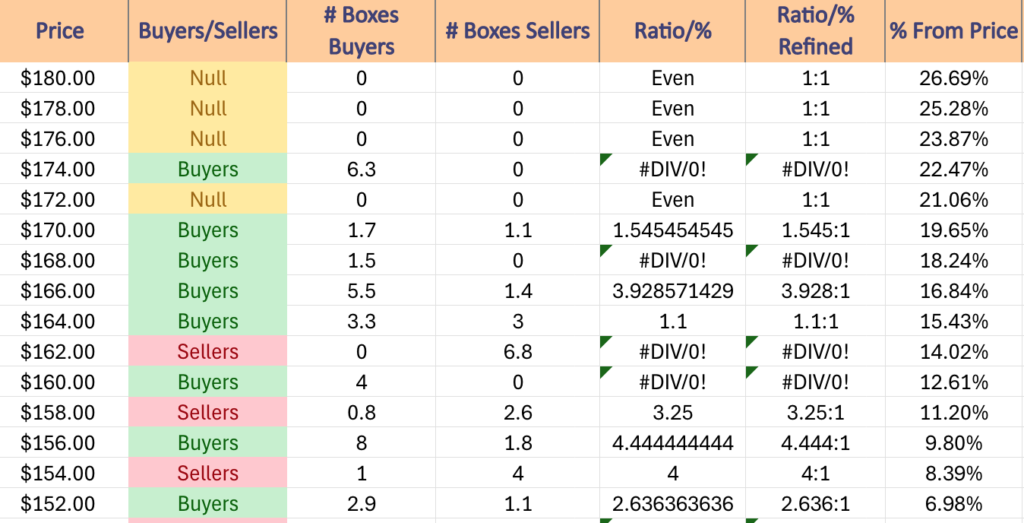
The next charts show the volume sentiment at each individual price level NVDA has traded at over the past ~1 year.
Beneath them is a copy & pasteable list of the same data, where the support/resistance levels are denoted in bold.
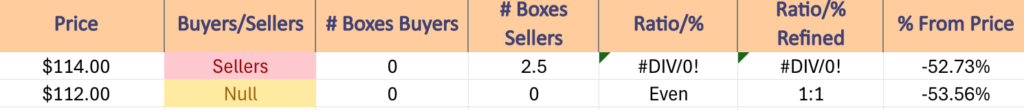
All ratios with “0” in the denominator are denoted with a “*”.
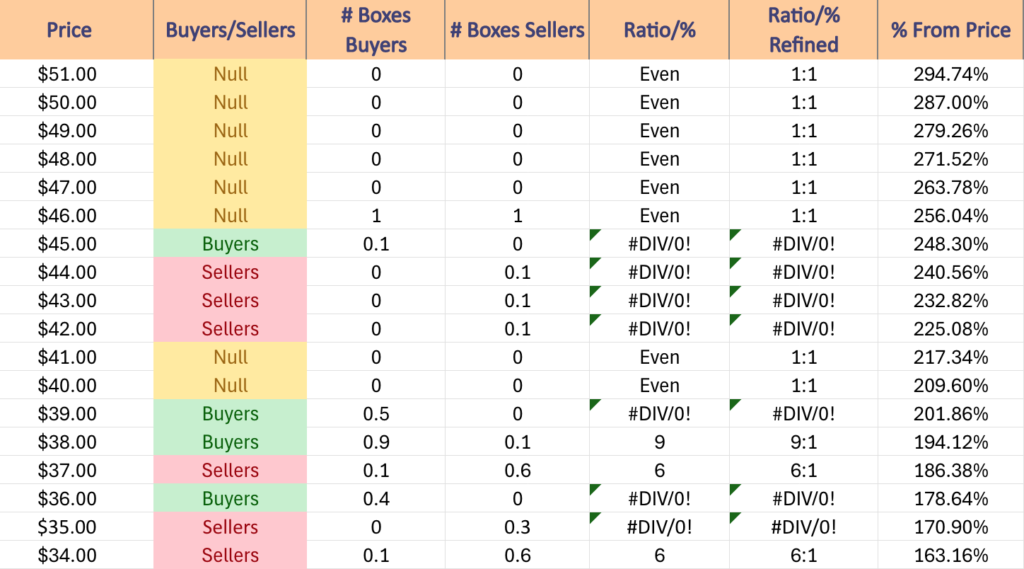
NULL values are price levels that had limited trading volume, whether it be due to gaps, quick advances or they are at price extremes; in the event that they are retested & there is more data they would have a distinct “Buyers”, “Sellers” or “Even” title.
This is not intended as financial advice, but rather another tool to consider when performing your own research & due diligence on NVDA.
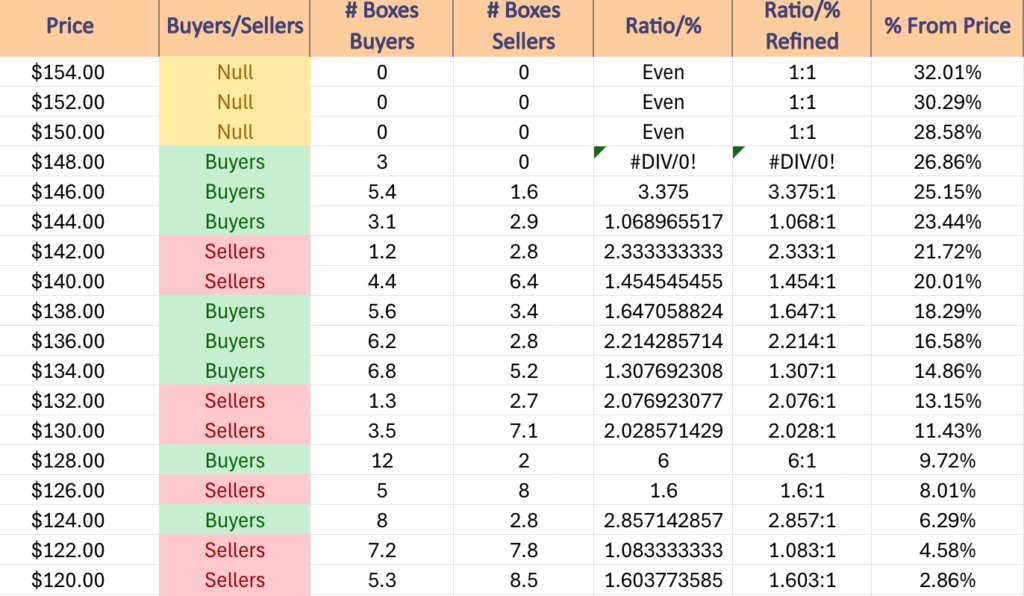
$154 – NULL – 0:0*, +32.01% From Current Price Level
$152 – NULL – 0:0*, +30.29% From Current Price Level
$150 – NULL – 0:0*, +28.58% From Current Price Level
$148 – Buyers – 3:0*, +26.86% From Current Price Level
$146 – Buyers – 3.38:1, +25.15% From Current Price Level
$144 – Buyers – 1.07:1, +23.44% From Current Price Level
$142 – Sellers – 2.33:1, +21.72% From Current Price Level
$140 – Sellers – 1.46:1, +20.01% From Current Price Level
$138 – Buyers – 1.65:1, +18.29% From Current Price Level
$136 – Buyers – 2.21:1, +16.58% From Current Price Level – 50 Day Moving Average*
$134 – Buyers – 1.31:1, +14.86% From Current Price Level
$132 – Sellers – 2.08:1, +13.15% From Current Price Level
$130 – Sellers – 2.03:1, +11.43% From Current Price Level – 10 Day Moving Average*
$128 – Buyers – 6:1, +9.72% From Current Price Level
$126 – Sellers – 1.6:1, +8.01% From Current Price Level
$124 – Buyers – 2.86:1, +6.29% From Current Price Level
$122 – Sellers – 1.08:1, +4.58% From Current Price Level – 200 Day Moving Average*
$120 – Sellers – 1.6:1, +2.86% From Current Price Level
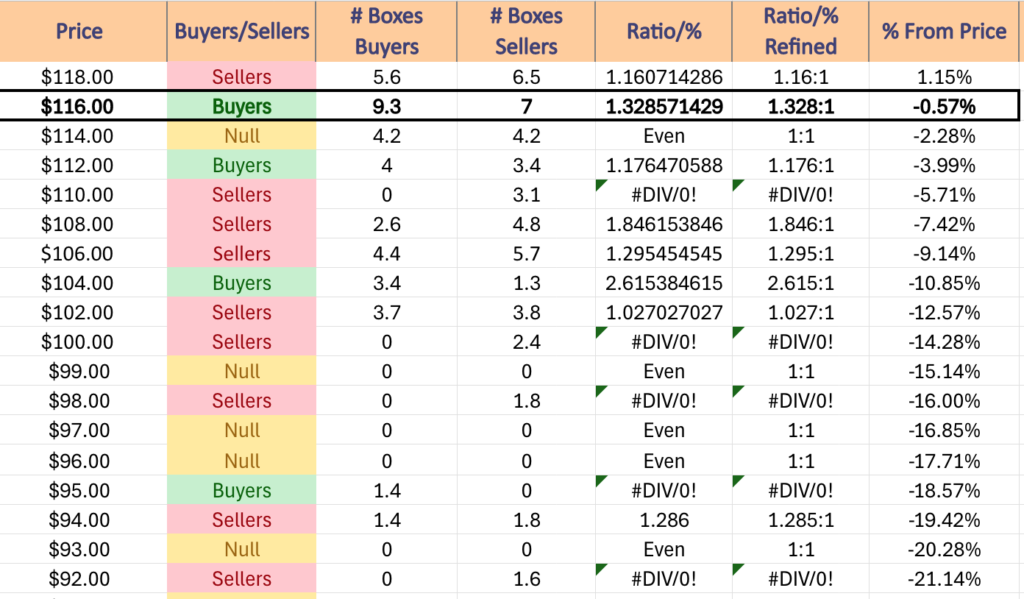
$118 – Sellers – 1.16:1, +1.15% From Current Price Level
$116 – Buyers – 1.33:1, -0.57% From Current Price Level – Current Price Zone*
$114 – Even – 1:1, -2.28% From Current Price Level
$112 – Buyers – 1.18:1, -3.99% From Current Price Level
$110 – Sellers – 3.1:0*, -5.71% From Current Price Level
$108 – Sellers – 1.85:1, -7.42% From Current Price Level
$106 – Sellers – 1.3:1, -9.14% From Current Price Level
$104 – Buyers – 2.62:1, -10.85% From Current Price Level
$102 – Sellers – 1.03:1, -12.57% From Current Price Level
$100 – Sellers – 2.4:0*, -14.28% From Current Price Level
$99 – NULL – 0:0*, -15.14% From Current Price Level
$98 – Sellers – 1.8:0*, -16% From Current Price Level
$97 – NULL – 0:0*, -16.85% From Current Price Level
$96 – NULL – 0:0*, -17.71% From Current Price Level
$95 – Buyers – 1.4:0*, -18.57% From Current Price Level
$94 – Sellers – 1.29:1, -19.42% From Current Price Level
$93 – NULL – 0:0*, -20.28% From Current Price Level
$92 – Sellers – 1.6:0*, -21.14% From Current Price Level
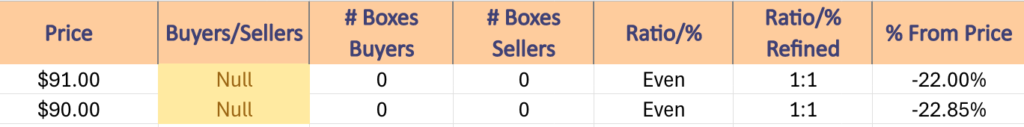
$91 – NULL – 0:0*, -22% From Current Price Level
$90 – NULL – 0:0*, -22.85% From Current Price Level
*** I DO NOT OWN SHARES OR OPTIONS CONTRACT POSITIONS IN NVDA STOCK AT THE TIME OF PUBLISHING THIS ARTICLE ***