Exxon Mobil Corp. stock trades under the ticker XOM & has shown recent bullishness that traders & investors should research further into for when market volatility has reduced.
XOM stock closed at $107.50/share on 5/24/2023.
Exxon Mobil Corp. XOM Stock’s Technical Performance Broken Down
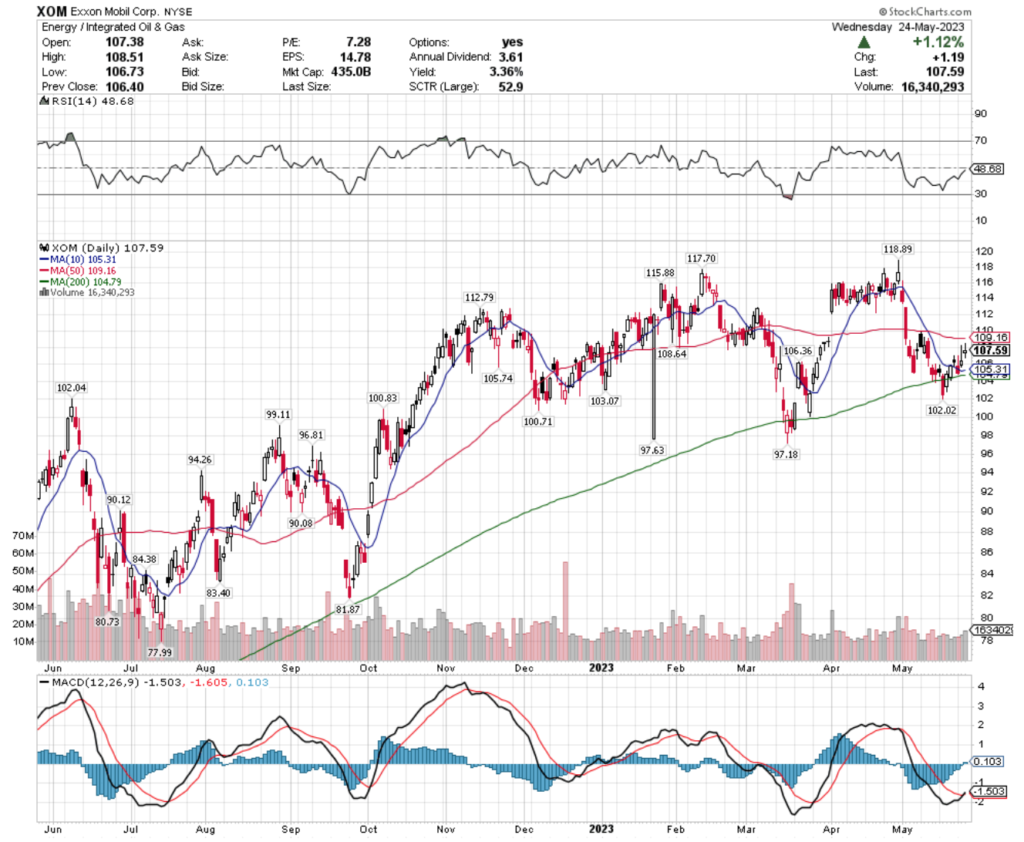
XOM Stock Price: $107.59
10 Day Moving Average: $105.31
50 Day Moving Average: $109.16
200 Day Moving Average: $104.79
RSI: 48.68
MACD: -1.503, -1.605, 0.103
Yesterday, XOM stock completed a bullish MACD crossover, gaining +1.12% on the day’s session.
Their RSI is about neutral at 48.68, but recent trading volumes have been below average compared to the year prior, signaling uncertainty by investors about XOM in the near-term.
Yesterday’s spinning top candlestick, along with the others of the past two weeks confirm that there is hesitance on investors’ part to buy XOM currently, making it best to look to see how they behave at support levels in the coming weeks.
XOM has support at the $106.36, $105.74, $105.31 (10 day moving average) & $104.79/share (200 day moving average) price levels, with resistance at the $108.64, $109.16 (50 day moving average), $112.79 & $115.88/share price levels.
Exxon Mobil Corp. XOM Stock As A Long-Term Investment
Long-term focused investors will like XOM stock’s valuation metrics, with a 7.31 P/E (ttm) & a 2.2 P/B (mrq).
They recently reported -4.3% Quarterly Revenue Growth Y-o-Y, with 108.6% Quarterly Earnings Growth Y-o-Y.
Their balance sheet should also be reviewed more thoroughly before investing, with $32.65B of Total Cash (mrq) & $41.45B of Total Debt (mrq).
XOM pays a 3.36% dividend, which appears to be sustainable in the long-run, as their payout ratio is 24.24%.
60.91% of XOM stock’s outstanding share float is owned by institutional investors.
Exxon Mobil Corp. XOM Stock As A Short-Term Trade Using Options
Traders with shorter time horizons can trade options to profit from price movements in XOM stock, while protecting their portfolios from broader market volatility.
I am looking at the contracts with the 6/16 expiration date.
The $105, $107 & $106 calls options are all in-the-money, listed from highest to lowest level of open interest.
The $110, $108 & $111 puts are also in-the-money, with the former being more liquid than the latter two strike prices.
Tying It All Together
XOM stock has many interesting attributes that traders & investors will find appealing.
Investors will like their stable dividend, along with their valuation metrics, but may want to look closer into their balance sheet & recent growth performance.
Traders will like their recent technical performance & liquid options.
All-in-all, it is worth taking a closer look at XOM stock to see how it fits into your portfolio strategy.
*** I DO NOT OWN SHARES OR OPTIONS CONTRACT POSITIONS IN XOM STOCK AT THE TIME OF PUBLISHING THIS ARTICLE ***