Magic Software Enterprises Ltd. stock trades under the ticker MGIC, and offers many interesting trading & investment opportunities. MGIC stock trades at $14.68 as of the close on 8/14/2020. Their recent movements higher have rated them a 201.2 on our Technical Rating scale, and their fundamentals are also attractive for investors.
Magic Software Enterprises Ltd. MGIC Stock Fundamentals Broken Down
MGIC stock’s P/E (ttm) is 54.4, with a P/B of 2.94. They offer a 1.8% Trailing Dividend Yield, with a Payout Ratio of 57.9%.
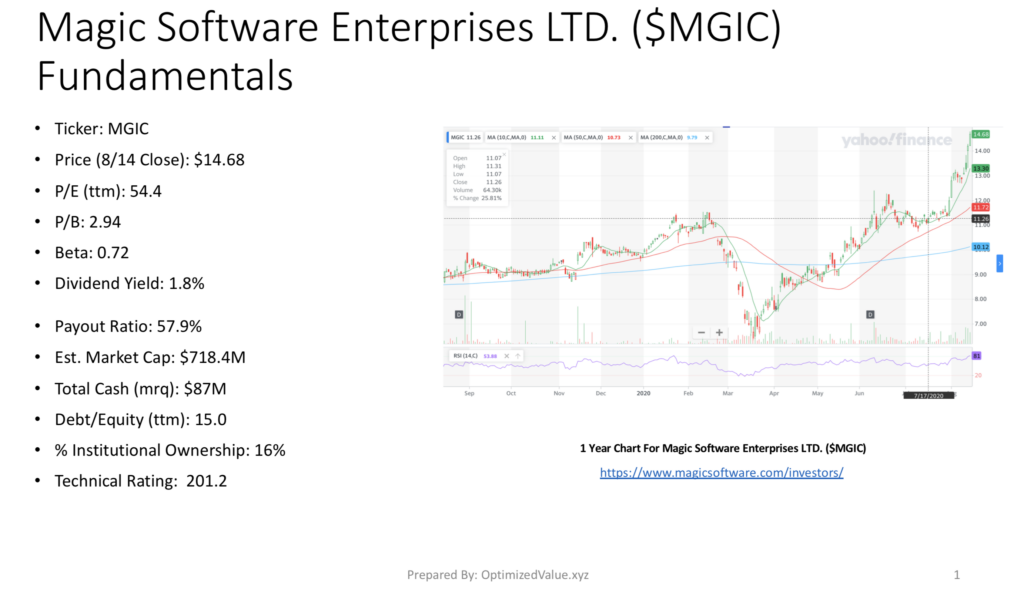
Magic Software Enterprises Ltd. MGIC stock’s Market Cap is $718.4M, making them a small cap stock; with $87M in Total Cash (mrq) & a low Debt/Equity (ttm) of 15. Their small cap status is likely a major factor in why they have a 16% % Institutional Ownership.
Magic Software Enterprises Ltd. $MGIC Stock’s Technicals Broken Down
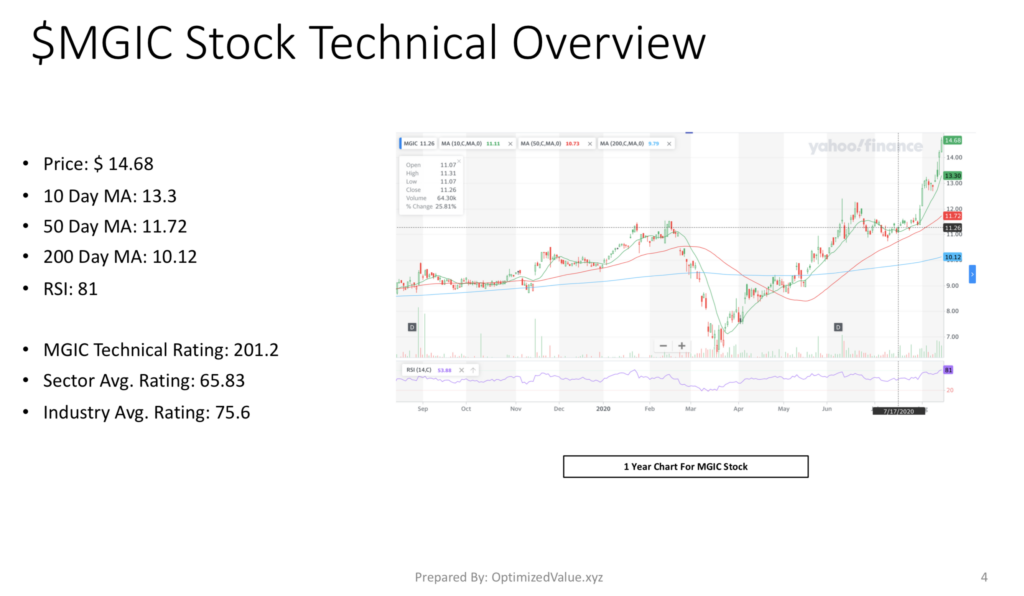
Magic Software Enterprises Ltd. $MGIC stock’s fundamentals are attractive, and their recent success has made their technicals also very attractive.
MGIC’s price of $14.68 is above its 10-Day Moving Average of 13.3, which is also above their 50-Day Moving Average of 11.72 and their 200-Day Moving Average of 10.12. While their RSI is 81 and considered overbought, recent dramatic movements to the upside are causing this, and it will settle down as more time passes and the stock establishes its range.
MGIC has a Technical Rating of 201.2, which is far superior to the Information Technology Sector average rating of 65.83 & the Software Industry average of 75.6.
This makes them look appealing for trades to both the upside & downside, based on where they establish their new range & how the overall market moves around them. While they’re a low beta small cap, they still will feel the pain of a NASDAQ correction.
Magic Software Enterprises Ltd. $MGIC Stock Fundamentals Vs. The Information Technology Sector
Magic Software Enterprises Ltd. stock’s fundamentals offer many advantages to their average information technology sector peer, despite their small cap status.
MGIC’s P/E (ttm) is 46% less than average for an Information Technology sector stock, with a 71.5% lower than average P/B, and a 52% less Beta.
One of their strongest advantages is their 98.9% lower Debt/Equity (ttm), which is especially important in times of market uncertainty, and their Technical Rating is 205.6% better than average for the sector.
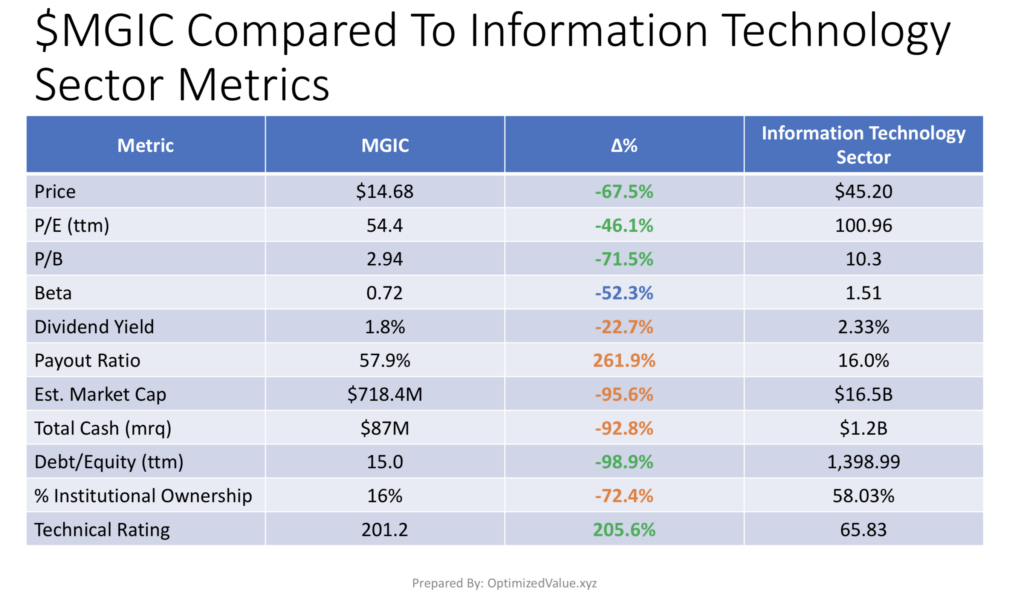
Their Dividend Yield of 1.8% is 22.7% less than average, although their Payout Ratio of 57.9% is sustainable.
Due to small cap size, MGIC has a 95.6% smaller than average Market Cap, and a 93% lower than average Total Cash (mrq).
This leads to their 72% lower than average % Institutional Ownership, despite their many strong qualities listed above.
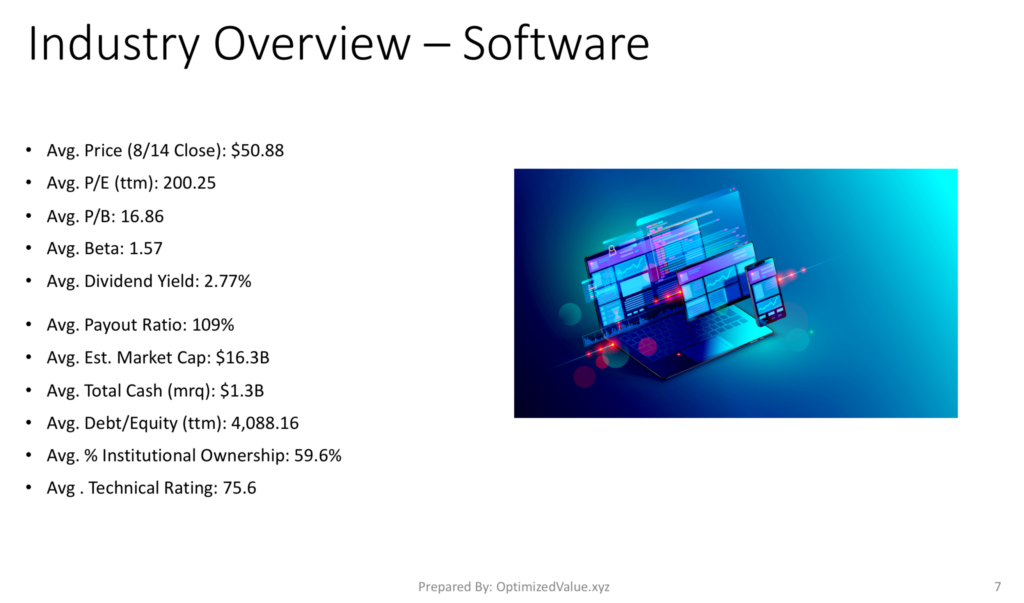
Magic Software Enterprises Ltd. $MGIC Stock Fundamentals Vs. The Software Industry
MGIC Stock offers many of the same advantages over their peers in the software industry. Their P/E (ttm) is 73% less than average, with an 82.6% less than average P/B compared to the average Software Industry stock.
Their Debt/Equity (ttm) is the most astounding advantage, 99.6% less than average.
While their Dividend Yield is 35% less than average, their sturdy Payout Ratio is almost 47% better than average for the software sector.
Their Technical Rating is 166% higher than average, which should appeal to most short-term traders.
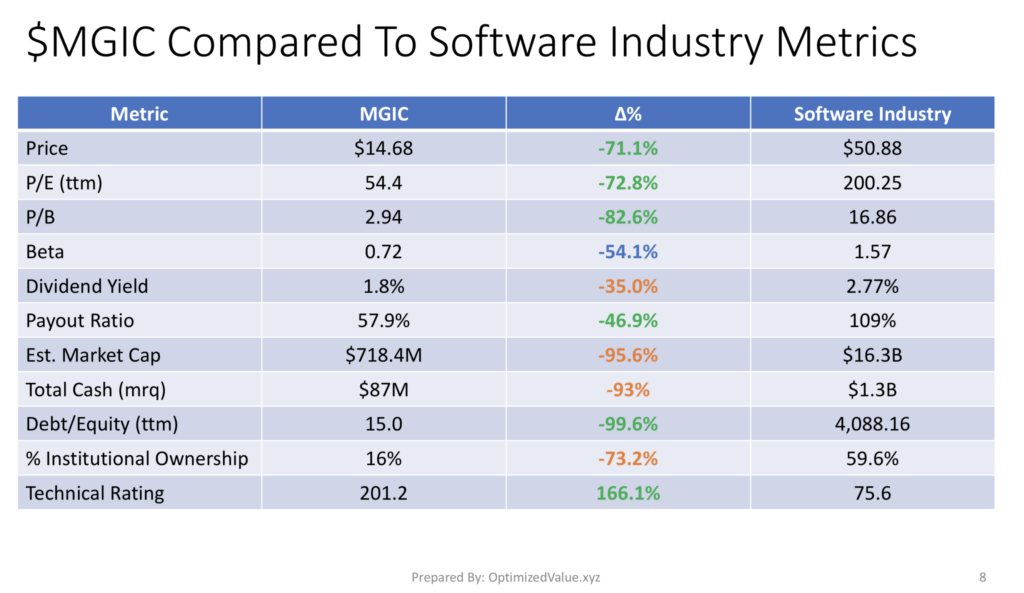
As they’re a small cap stock, MGIC’s Market Cap is 95.6% lower than average for a software industry stock, and their Total Cash (mrq) is 93% less than average.
Their Dividend Yield is 35% lower than average, and their % Institutional Ownership is 73% less than average for the industry.
Magic Software Enterprises Ltd. MGIC Stock Performance Vs. The S&P 500 & NASDAQ Since IPO
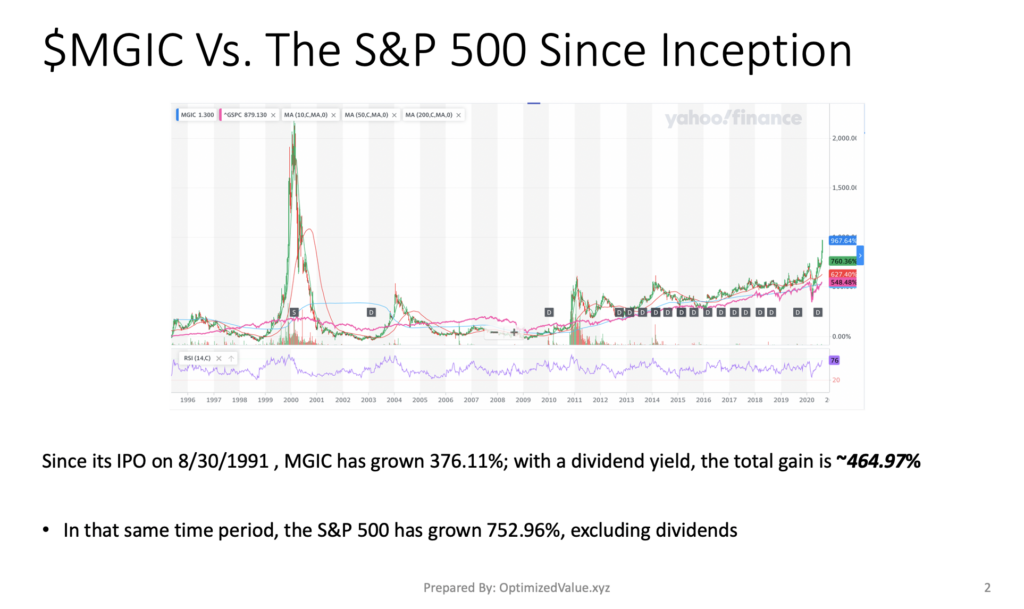
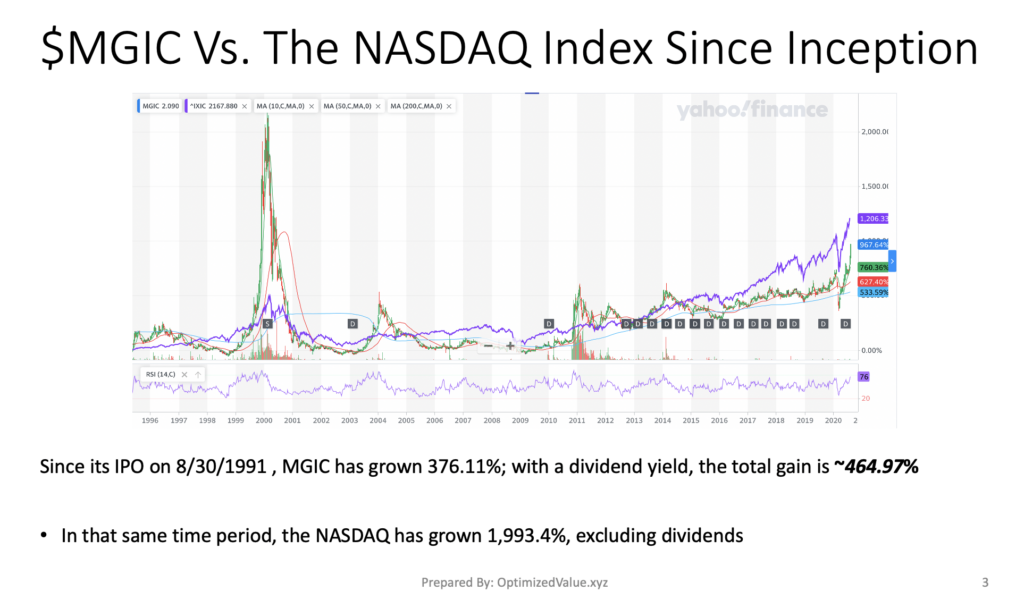
Aside from the lower than average dividend yield, one thing that makes me question the long-term investment here is the fact that MGIC has not outperformed the S&P 500 or NASDAQ since it IPO’d on 8/30/1991. While this does not mean that it is not a suitable investment for the properly set up portfolio, it is certainly something an investor needs to be aware of.
MGIC stock has grown 376.11% since their IPO, 464.97% including dividends collected. While it is excellent, it makes me more interested from a long term perspective as used for minimizing risk to a software exposure position, knowing that you’ll collect a dividend & continue to see growth, with limited downside compared to the average peer’s stock.
The S&P 500 has since grown by 752.96%, excluding dividends.
The NASDAQ has grown 1,993.4% over that same time period, excluding dividends collected.
Tying It All Together
Overall, MGIC offers many advantages to a long-term investor and a trader.
Their performance and fundamentals offer a means of reducing risk while having exposure to technology & software, while also collecting some interest on a dividend.
From a trading perspective, their recent performance warrants a closer look, as when smaller stock have high performance days, more people become aware of them & tend to dive into the pile & join the party.
For A Full PDF Report:
*** I DO NOT OWN SHARES OF MGIC ***