XLU, the Utilities Select Sector Fund ETF is currently at a new 52-week high following a +8.15% advance over the past year (ex-distributions) & a +30% gain since their 52-week low in October of 2023.
Regular readers will recall last month’s article about creating a synthetic defensive artificial intelligence ETF which included many utility stocks.
Given that XLU is at a new 52-week high it is worth diving into what volume sentiments have been like at various price levels that they have traded at over the past 4-5 years, especially given that there will likely be tests of support levels in the coming week(s).
This is important as it may help identify which levels of support will be more apt to be stronger than others.
This is not a specific recommendation, nor is it a substitute for performing your own due diligence, but rather it is meant to be an extra tool that you can take into consideration while making your own assessment of XLU.
Brief Technical Analysis Of XLU, The Utilities Select Sector SPDR Fund ETF
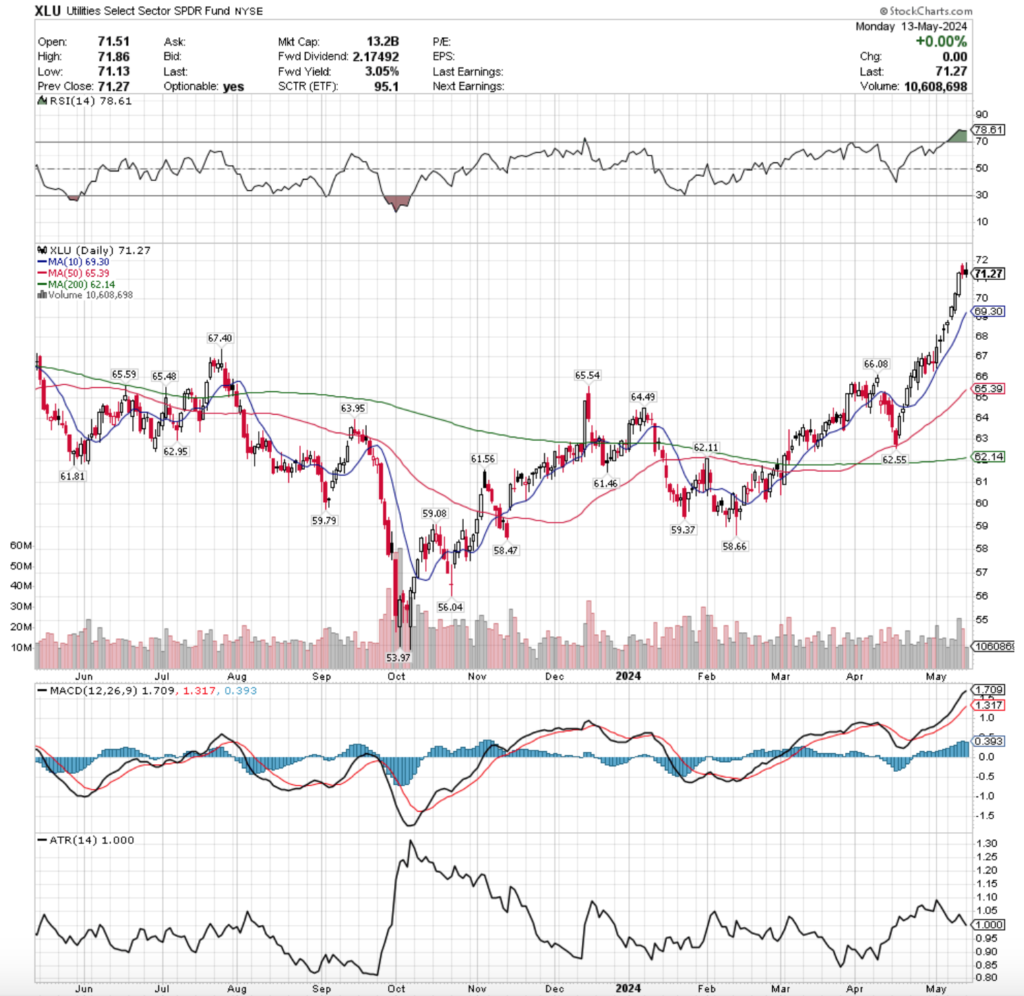
Their RSI is currently overbought at 78.61, while XLU’s MACD is bullish, but beginning to show signs of rolling over bearishly in the near-term.
Volumes for the past week were +2.77% above the average volume of the past year (16,541,240 vs. 16,095,135.46) confirming strong sentiment behind the run up to the new 52-week high.
However, it is difficult to gauge if this is due to exuberance from the A.I. craze as market participants piled into the utility companies that will be needed to provide all of the power to data centers, or as a pivot due to the broader market state.
Determining this will be key to understanding how resilient XLU & its components remain in the coming months.
Tuesday of last week came as a gap up session on stable volume, leading to Wednesday & Thursday’s subsequent advances, with Thursday’s high advancing volume being notably above average.
Friday was a risk-off session in anticipation of the weekend, where it looked like there could be a bearish dark cloud cover pattern set up, but XLU was able to close closer to the close of Thursday’s candle, avoiding the bearish sentiment.
Friday’s high volume level should be noted, as it seemed folks were packing in & taking profits before the weekend in anticipation of this week’s PPI, CPI, Fed Speakers & other consumer-centric data releases (details can be found in this week’s market review note).
Monday was an interesting day for XLU, as the session opened higher than Friday, tested above Friday’s high, before venturing lower & ultimately settling at the same price day-over-day as Friday’s session.
Monday’s volume also was well below the volumes of the other days of the past week, adding an even stronger note of uncertainty & indecision on the part of market participants.
In the event of a pull-back in XLU, it is important to note where their support levels are.
The nearest level is at the 10 day moving average at $69.30, before $67.40, $66.08 & a support zone in the $65-66/share range (including the 50 DMA).
When these support levels are tested, the table & data contained below may be useful in your analysis of how strong/weak each will be.
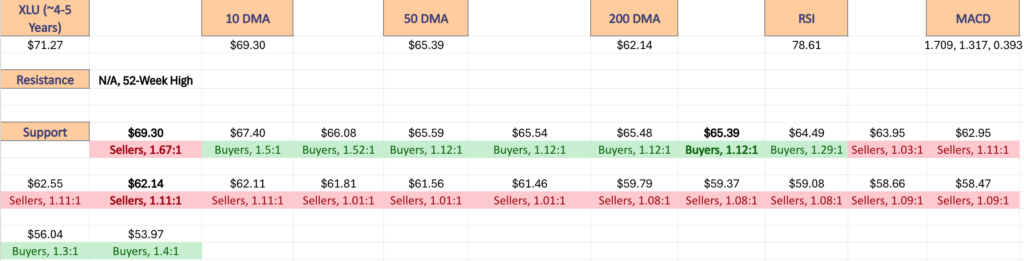
Price Level:Volume Sentiment For XLU, Utilities Select Sector Fund ETF For The Past 4-5 Years
Below is a list of the one year support & resistance levels, with the 10, 50 & 200 day moving averages denoted in bold & the Buyer:Seller sentiment ratio beneath each price level.
The images that follow it list out the volume sentiment for each price level that XLU has traded at over the past 4-5 years.
These ratios can be used to make an assessment about how strong a particular support or resistance level may be, based on how buyers & sellers have behaved there in the recent past.
There is also a list typed out below it with the same table information, where the bold prices indicate a support/resistance level.
Note that due to price extremes (being near the all-time high) some price levels do not have enough data yet & are marked as NULL 0:0*, while other high levels will be skewed towards buyers, as there has not been much in terms of downside tests against them.
Also, ratios with a denominator of 0 are also denoted with an “*”.
This is something that should be kept in mind when working with the data below.
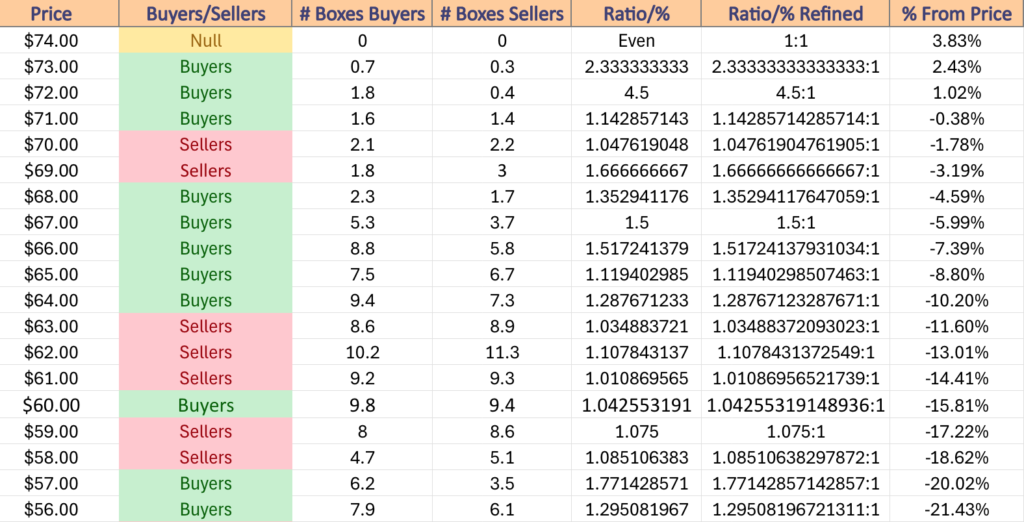
$74 – NULL – 0:0*, +3.83% From Current Price Level
$73 – Buyers – 2.33:1, +2.43% From Current Price Level
$72 – Buyers – 4.5:1, +1.02% From Current Price Level
$71 – Buyers – 1.14:1, -0.38% From Current Price Level – Current Price Box*
$70 – Sellers – 1.05:1, -1.78% From Current Price Level
$69 – Sellers – 1.67:1, -3.19% From Current Price Level – 10 Day Moving Average*
$68 – Buyers – 1.35:1, -4.59% From Current Price Level
$67 – Buyers – 1.5:1, -5.99% From Current Price Level
$66 – Buyers – 1.52:1, -7.39% From Current Price Level
$65 – Buyers – 1.12:1, -8.8% From Current Price Level – 50 Day Moving Average*
$64 – Buyers – 1.29:1, -10.2% From Current Price Level
$63 – Sellers – 1.03:1, -11.6% From Current Price Level
$62 – Sellers- 1.11:1, -13.01% From Current Price Level – 200 Day Moving Average*
$61 – Sellers – 1.01:1, -14.41% From Current Price Level
$60 – Buyers – 1.04:1, -15.81% From Current Price Level
$59 – Sellers – 1.08:1, -17.22% From Current Price Level
$58 – Seller s- 1.09:1, -18.62% From Current Price Level
$57 – Buyers – 1.77:1, -20.02% From Current Price Level
$56 – Buyers – 1.3:1, -21.43% From Current Price Level
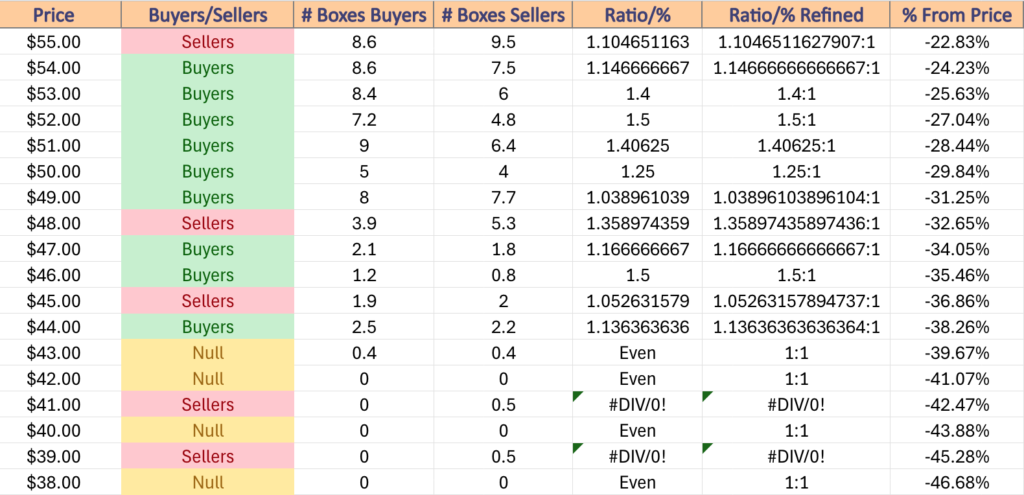
$55 – Sellers – 1.11:1, -22.83% From Current Price Level
$54 – Buyers – 1.15:1, -24.23% From Current Price Level
$53 – Buyers – 1.4:1, -25.63% From Current Price Level
$52 – Buyers – 1.5:1, -27.04% From Current Price Level
$51 – Buyers – 1.41:1, -28.44% From Current Price Level
$50 – Buyers – 1.25:1, -29.84% From Current Price Level
$49 – Buyers – 1.04:1, -31.25% From Current Price Level
$48 – Sellers – 1.36:1, -32.65% From Current Price Level
$47 – Buyers – 1.17:1, -34.05% From Current Price Level
$46 – Buyers – 1.5:1, -35.46% From Current Price Level
$45 – Sellers – 1.05:1, -36.86% From Current Price Level
$44 – Buyers – 1.14:1, -38.26% From Current Price Level
$43 – Even – 1:1, -39.67% From Current Price Level
$42 – NULL – 0:0*, -41.07% From Current Price Level
$41 – Sellers – 0.5:0*, -42.47% From Current Price Level
$40 – NULL – 0:0*, -43.88% From Current Price Level
$39 – Sellers – 0.5:0*, -45.28% From Current Price Level
$38 – NULL – 0:0*, -46.68% From Current Price Level
*** I DO NOT OWN SHARES OR OPTIONS CONTRACTS IN XLU AT THE TIME OF PUBLISHING THIS ARTICLE ***