Oracle Corp. stock trades under the ticker ORCL and has advanced +16.87% over the past year, sitting -25.47% below their 52-week high from December 2024, while remaining +31.05% above their 52-week low from April of 2024 (all ex-dividends).
ORCL has had a rough past few months after hitting their 52-week high, and has spent the month of March consolidating after crossing bearishly below their 200 day moving average.
This makes it a great time to check in on how ORCL has traded at their various price levels of the past couple of years
Below is a brief technical analysis of ORCL, as well as a price level:volume sentiment analysis of the price levels ORCL has traded at over the past ~2 years.
Included in this data is also their recent support & resistance levels so that readers can gain insight into how strong/weak these support/resistance levels may be in the future, based on past investor behavior.
It is not intended to serve as financial advice, but rather as an additional tool to reference while performing your own due diligence on ORCL.
Technical Analysis Of Oracle Corp. ORCL Stock
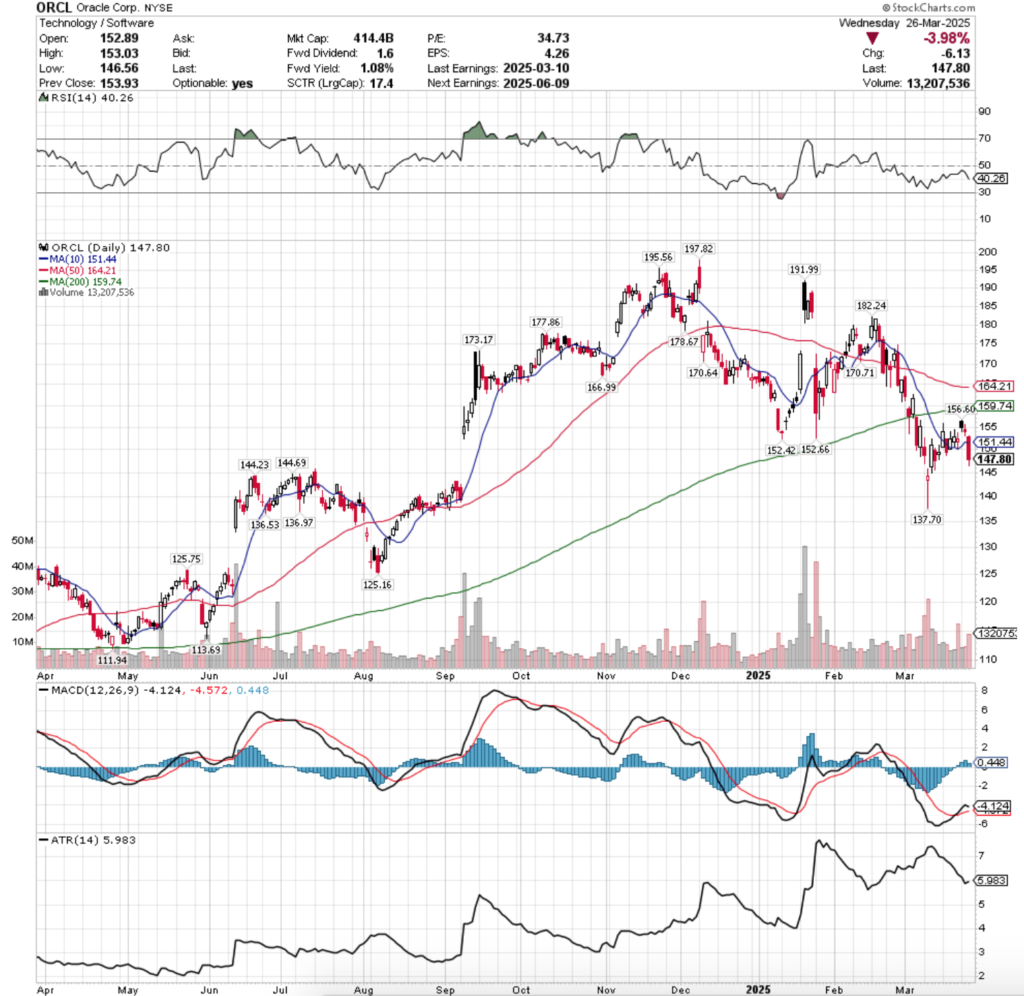
Their RSI is trending towards the oversold 30 mark & currently sits at 40.26, while their MACD has dolphined but is bearishly approaching the signal line.
Volumes have been +12.64% above the prior year’s average over the past week & a half (10,056,250 vs. 8,927,888.45), which is slight cause for concern given that their highest volume sessions have been declines.
Last Monday ORCL opened on a gap up with the highest advancing volume of the past week & a half, and was able to break above the resistance of the 10 day moving average.
Tuesday opened in the middle of Monday’s range, but the support of the 10 DMA was unable to hold up & ORCL closed below it at $149.45/share.
Wednesday saw ORCL open in-line with the 10 DMA & march higher, but it was unable to test the $155/share level.
Thursday saw gains, but again was unable to test the $155/share level & the session closed with an air of uncertainty as a spinning top candle.
Thursday’s low was supported by the 10 day moving average, but volumes were very light, indicating that there was not a lot of participation among investors.
Friday the uncertainty continued, but with a hint of bearish sentiment crawling back into markets, as ORCL opened lower, tested lower & bounced off of the support of the 10 day moving average, before closing higher than it opened & forming a bearish harami pattern with Thursday’s candle.
It’s important to note that both days resulted in spinning tops as well, indicating that there was uncertainty among market participants about where to value ORCL’s shares at.
ORCL’s volume on Friday is also important to note, as the declining volume was the highest level of any session from the prior two weeks, with a mix of folks taking risk off the table heading into the weekend & others buying the dip to squeeze prices higher.
Monday set the week up bearishly, as ORCL opened on a gap higher above the $155/share level, before testing & closing lower for the day on very light volume, indicating that there was not going to be any staying power behind the move.
Sure enough, Tuesday opened lower, tested above the $155/share mark but was unable to sustain the move & closed lower, as a spinning top candle.
The uncertainty of the day’s close paired with the negative sentiment from the end of the prior week & Monday’s session led to a gap down open on Wednesday, where the second highest volume of the past week & a half managed to break down the support of the 10 day moving average & close below it.
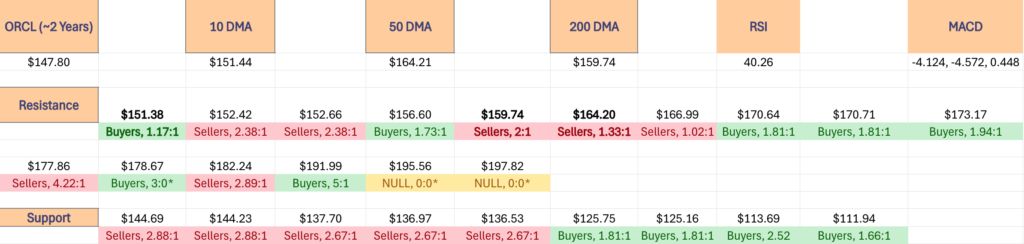
To the upside, the $151.44/share price level (10 day moving average) will be important to watch in the coming weeks, as if it can’t be broken through to the upside we’ll likely see further declines or consolidation.
Should it be broken through there will be a lot of selling pressure at the $152.42 & $152.66/share price levels which will be a tough zone of resistance to break through without a major market catalyst.
Should ORCL consolidate further it will likely oscillate around the 10 DMA in the range that it has spent most of March 2025 in.
To the downside, the next five support levels have historically been dominated by Sellers over the past ~2 years, which will make it difficult to find stable footing for ORCL in the event of further declines.
The following section lays out ORCL’s one year support/resistance levels, as well as their Buyer:Seller (Seller:Buyer) ratios at each price level that they’ve traded at over the past ~2 years, which can be used as a barometer for estimating the expected strength/weakness of each of the support/resistance levels.
Price Level:Volume Sentiment For Oracle Corp. ORCL Stock
The top table below shows the support & resistance levels of ORCL from the past year’s chart, as well as their price level:volume sentiment at each from data covering the past ~2 years, using Wednesday 3/26/2025’s closing data for their price & moving averages/other technicals.
The moving averages are denoted with bold.
The next charts show the volume sentiment at each individual price level ORCL has traded at over the past ~2 years.
Beneath them is a copy & pasteable list of the same data, where the support/resistance levels are denoted in bold.
All ratios with “0” in the denominator are denoted with a “*”.
NULL values are price levels that had limited trading volume, whether it be due to gaps, quick advances or they are at price extremes; in the event that they are retested & there is more data they would have a distinct “Buyers”, “Sellers” or “Even” title.
This is not intended as financial advice, but rather another tool to consider when performing your own research & due diligence on ORCL.
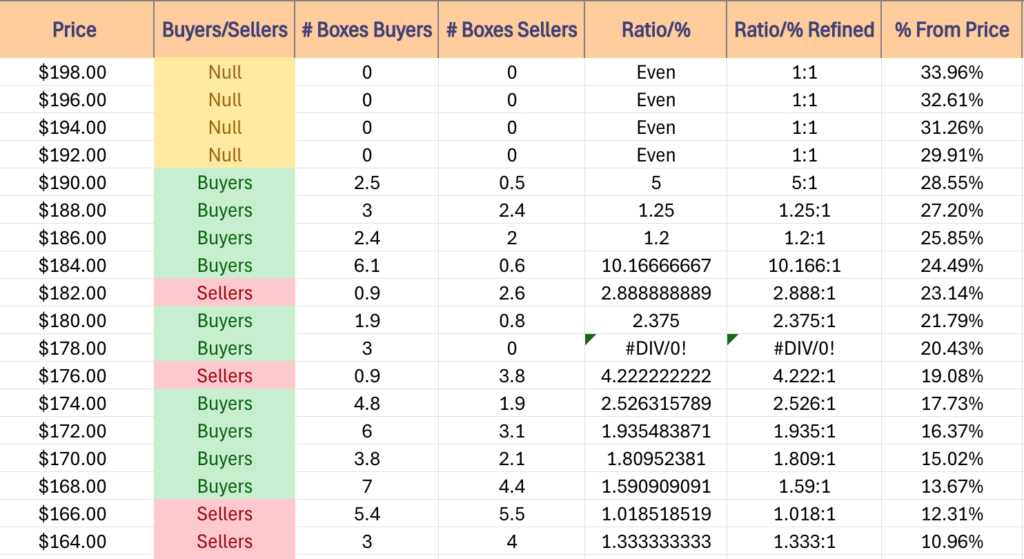
$198 – NULL – 0:0*, +33.96% From Current Price
$196 – NULL – 0:0*, +32.61% From Current Price
$194 – NULL – 0:0*, +31.26% From Current Price
$192 – NULL – 0:0*, +29.91% From Current Price
$190 – Buyers – 5:1, +28.55% From Current Price
$188 – Buyers – 1.25:1, +27.2% From Current Price
$186 – Buyers – 1.2:1, +25.85% From Current Price
$184 – Buyers – 10.17:1, +24.49% From Current Price
$182 – Sellers – 2.89:1, +23.14% From Current Price
$180 – Buyers – 2.38:1, +21.79% From Current Price
$178 – Buyers – 3:0*. +20.43% From Current Price
$176 – Sellers – 4.22:1, +19.08% From Current Price
$174 – Buyers – 2.53:1, +17.73% From Current Price
$172 – Buyers – 1.94:1, +16.37% From Current Price
$170 – Buyers – 1.81:1, +15.02% From Current Price
$168 – Buyers – 1.59:1, +13.67% From Current Price
$166 – Sellers – 1.02:1, +12.31% From Current Price
$164 – Sellers – 1.33:1, +10.96% From Current Price – 50 Day Moving Average*
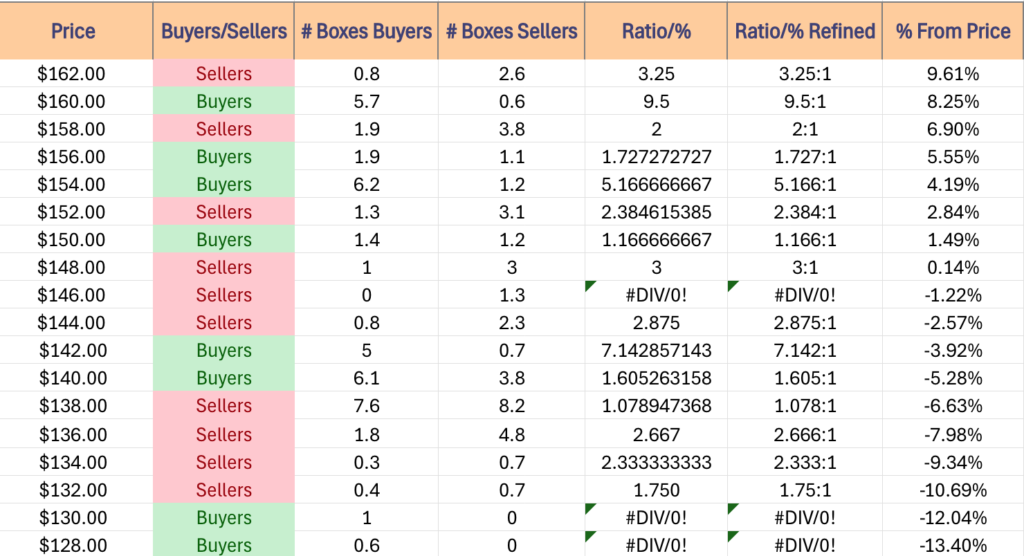
$162 – Sellers – 3.25:1, +9.61% From Current Price
$160 – Buyers – 9.5:1, +8.25% From Current Price
$158 – Sellers – 2:1, +6.9% From Current Price – 200 Day Moving Average*
$156 – Buyers – 1.73:1, +5.55% From Current Price
$154 – Buyers – 5.17:1, +4.19% From Current Price
$152 – Sellers – 2.39:1, +2.84% From Current Price
$150 – Buyers – 1.17:1, +1.49% From Current Price – 10 Day Moving Average*
$148 – Sellers – 3:1, +0.14% From Current Price
$146 – Sellers – 1.3:0*, -1.22% From Current Price – Current Price Level*
$144 – Sellers – 2.88:1, -2.57% From Current Price
$142 – Buyers – 7.14:1, -3.92% From Current Price
$140 – Buyers – 1.61:1, -5.28% From Current Price
$138 – Sellers – 1.08:1, -6.63% From Current Price
$136 – Sellers – 2.67:1, -7.98% From Current Price
$134 – Sellers – 2.33:1, -9.34% From Current Price
$132 – Sellers – 1.75:1, -10.69% From Current Price
$130 – Buyers – 1:0*, -12.04% From Current Price
$128 – Buyers – 0.6:0*, -13.4% From Current Price
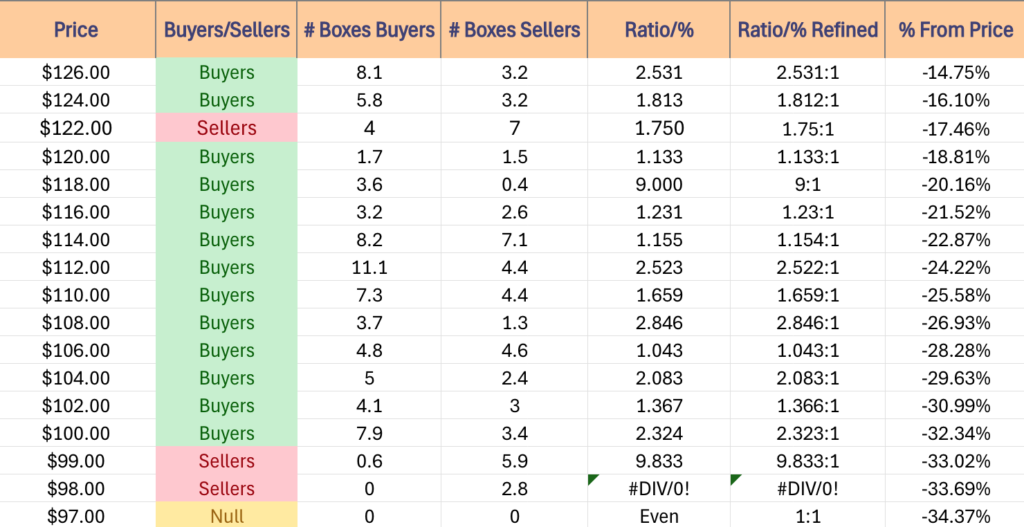
$126 – Buyers – 2.53:1, -14.75% From Current Price
$124 – Buyers – 1.81:1, -16.1% From Current Price
$122 – Sellers – 1.75:1, -17.46% From Current Price
$120 – Buyers – 1.13:1, -18.81% From Current Price
$118 – Buyers – 9:1, -20.16% From Current Price
$116 – Buyers – 1.23:1, -21.52% From Current Price
$114 – Buyers – 1.16:1, -22.87% From Current Price
$112 – Buyers – 2.52:1, -24.22% From Current Price
$110 – Buyers – 1.66:1, -25.58% From Current Price
$108 – Buyers – 2.85:1, -26.93% From Current Price
$106 – Buyers – 1.04:1, -28.28% From Current Price
$104 – Buyers – 2.08:1, -29.63% From Current Price
$102 – Buyers – 1.37:1, -30.99% From Current Price
$100 – Buyers – 2.32:1, -32.34% From Current Price
$99 – Sellers – 9.83:1, -33.02% From Current Price
$98 – Sellers – 2.8:0*, -33.69% From Current Price
$97 – NULL – 0:0*, -34.37% From Current Price
*** I DO NOT OWN SHARES OR OPTIONS CONTRACT POSITIONS IN ORCL STOCK AT THE TIME OF PUBLISHING THIS ARTICLE ***