As I pointed out in last night’s weekly market review note, the S&P 500 & NASDAQ are at 52-week highs & the Russell 2000 & Dow Jones Industrial Average are near theirs.
RSI’s are all flashing overbought signals & we are entering earnings season, one which many analysts have reported would likely be weaker than anticipated.
At times like these, it is important to have an understanding of what the landscape beneath current pricing levels looks like, both in terms of the technicals on a chart & in sentiment of investors.
The following Price:Volume Sentiment analysis breaks down investor sentiments at the price levels that SPY (SPDR S&P 500 ETF), QQQ (Invesco QQQ Trust ETF, which tracks the NASDAQ), IWM (iShares Russell 2000 ETF) & DIA (SPDR Dow Jones Industrial Average ETF) have traded at over the past one-to-three years.
It can be used as a barometer that gauges how market participants have felt at various times during that period when the securities’ prices were within the box-ranges listed below.
The bold prices on the images & lists below denote the moving average levels just listed & the bold entries in the list form of the analysis under the images include other levels of support.
Each corresponding price level has a ratio of Buyers:Sellers (or Sellers:Buyers), NULL values denote that there was not enough data, so the ratio would’ve been 0:0.
Ratios with a 0 for the denominator/constant are denoted with an *, but are reported as is, as we are accounting for volume/sentiment.
Also, as there is such a wide spread between many price levels having activity data, many of the levels are marked NULL, as there was limited volume data for them, and they were not included in the long lists below unless they were relevant to support/resistance levels.
The following is meant to serve as a reference to how market participants have behaved historically at these price levels & is neither investment advice nor recommendations of any kind.
Price:Volume Sentiment Analysis For SPY, The SPDR S&P 500 ETF
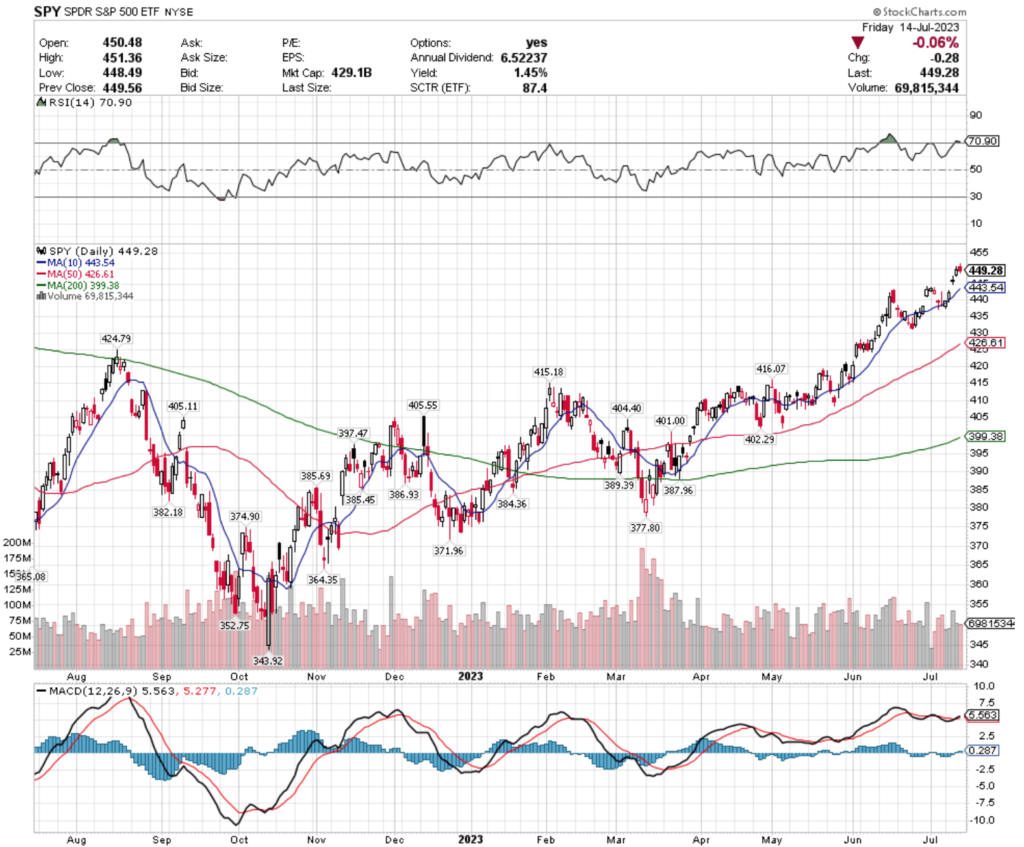
Last week SPY gapped up on Wednesday to a new price range, however the volumes behind the week’s trading was lacluster.
With an overbought RSI, wise investors/traders who are in SPY should begin looking into their support levels.
For the detailed chart breakdown, please see last night’s post here.
The data below can serve as a tool to help investors figure out how price may behave at each price level should the index return to it.

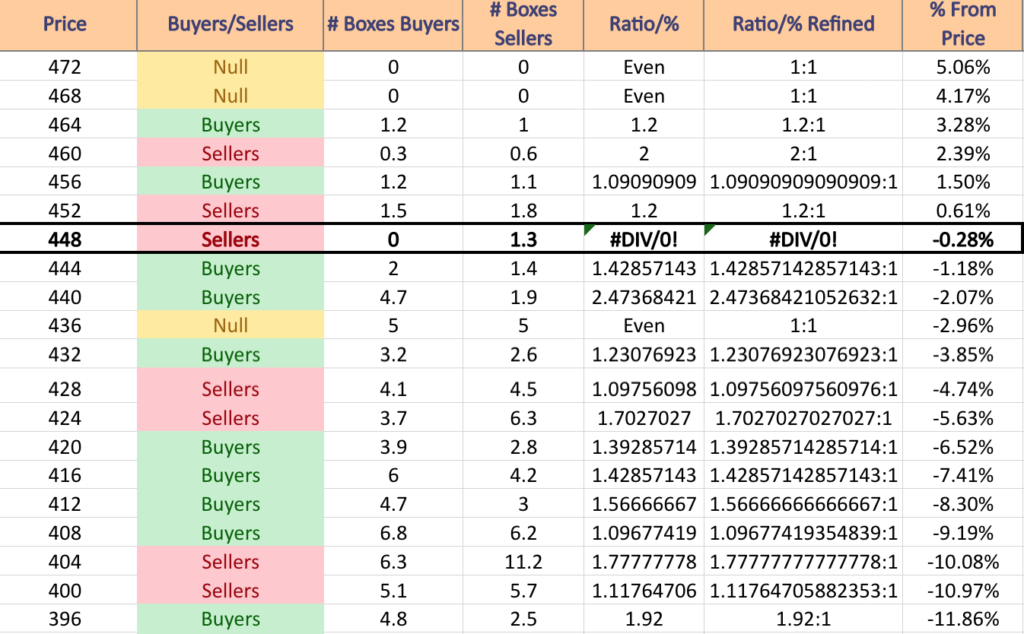
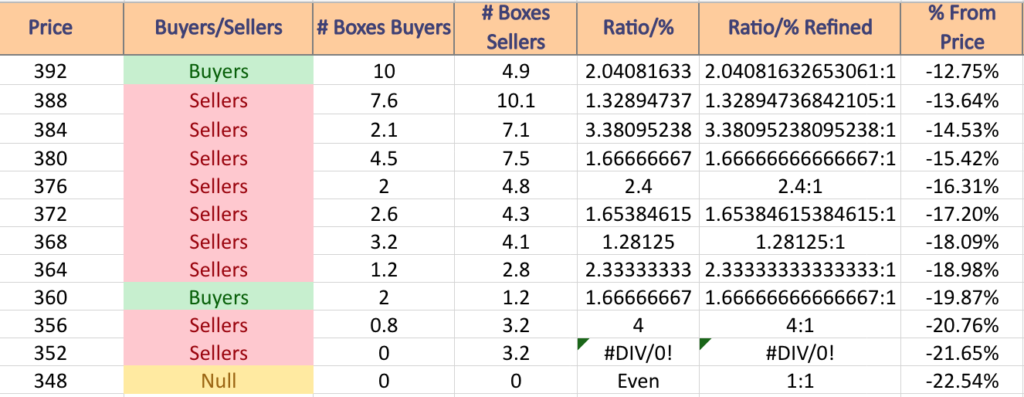
SPY ETF’s Volume Sentiment By Price Level
(*BOLD denotes a Moving Average)
$472 – NULL – 0:0*; 5.06% From Current Price
$468 – NULL – 0:0*; 4.17% From Current Price
$464 – Buyers – 1.2:1; 3.28% From Current Price
$460 – Sellers – 2:1; 2.39% From Current Price
$456 – Buyers – 1.09:1; 1.5% From Current Price
$452 – Sellers – 1.2:1; 0.61% From Current Price
$448 – Sellers – 1.3:0*; -0.28% From Current Price
$444 – Buyers – 1.43:1; -1.18% From Current Price
$440 – Buyers – 2.47:1; -2.07% From Current Price
$436 – Even – 1:1; -2.96% From Current Price
$432 – Buyers – 1.23:1; -3.85% From Current Price
$428 – Seller s- 1.10:1; -4.74% From Current Price
$424 – Sellers – 1.70:1; -5.63% From Current Price
$420 – Buyers – 1.391; -6.52% From Current Price
$416 – Buyers – 1.43:1; -7.41% From Current Price
$412 – Buyers – 1.57:1; -8.3% From Current Price
$408 – Buyers – 1.10:1; -9.19% From Current Price
$404 – Sellers – 1.78:1; -10.08% From Current Price
$400 – Sellers – 1.12:1; -10.97% From Current Price
$396 – Buyers – 1.92:1; -11.86% From Current Price
$392 – Buyers – 2.04:1; -12.75% From Current Price
$388 – Sellers – 1.33:1; -13.64% From Current Price
$384 – Sellers – 3.38:1; -14.53% From Current Price
$380 – Sellers – 1.67:1; -15.42% From Current Price
$376 – Sellers – 2.4:1; -16.31% From Current Price
$372 – Sellers – 1.65:1; -17.2% From Current Price
$368 – Sellers – 1.28:1; -18.09% From Current Price
$364 – Sellers – 2.33:1; -18.98% From Current Price
$360 – Buyers – 1.67:1; -19.87% From Current Price
$356 – Sellers – 4:1; -20.76% From Current Price
$352 – Sellers – 3.2:0*; -21.65% From Current Price
$348 – NULL – 0:0*; -22.54% From Current Price
Price:Volume Sentiment Analysis For QQQ, The Invesco QQQ Trust ETF That Tracks The NASDAQ
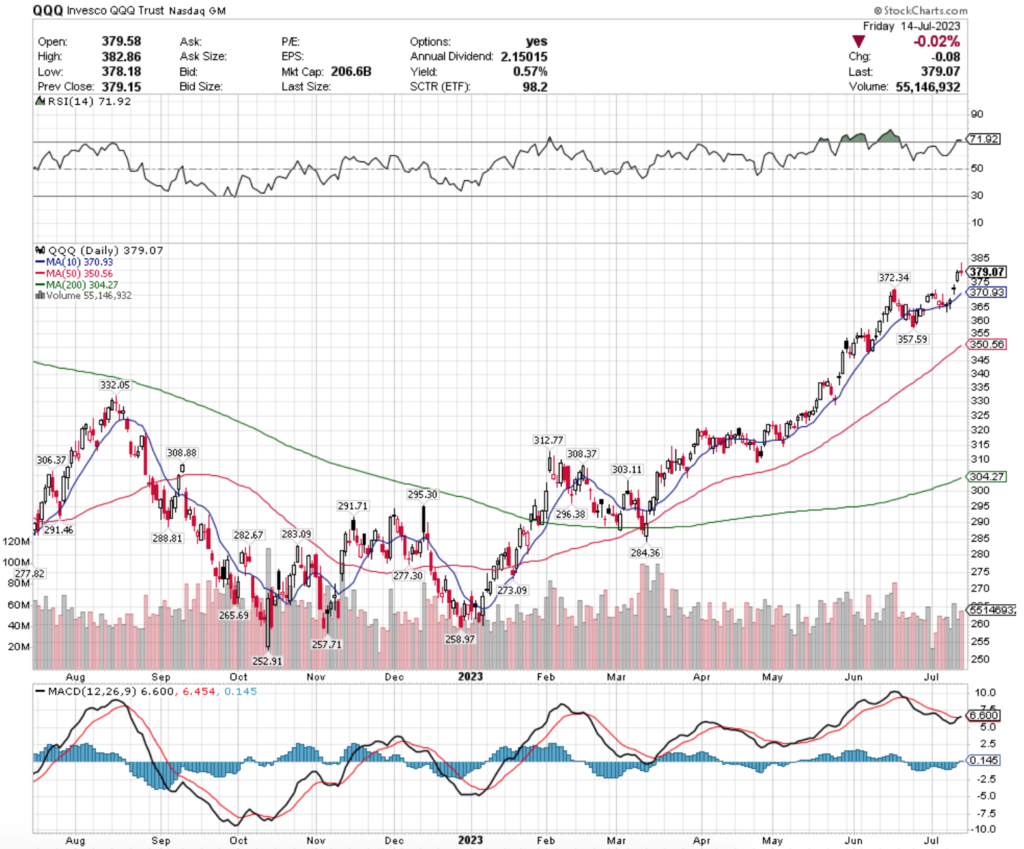
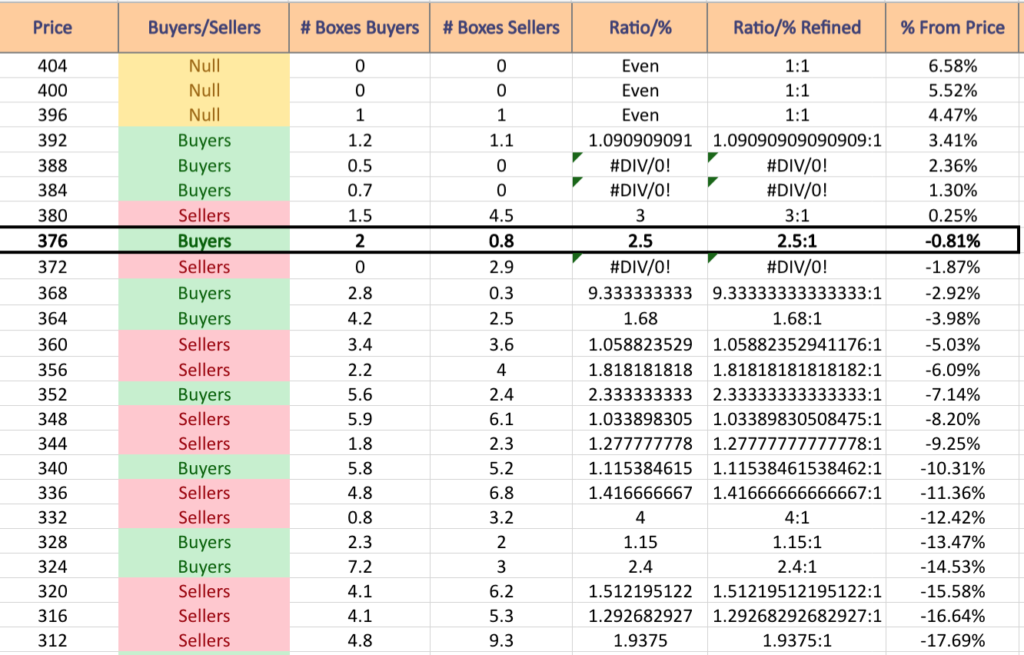
QQQ is also in overbought territory, making it essential to have an understanding as to how market participants will react with the index as the price goes down.
For the detailed chart breakdown, please see last night’s post here.

QQQ ETF’s Volume Sentiment By Price Level
(*BOLD denotes a Moving Average)
$404 – NULL – 0:0*; 6.58% From Current Price
$400 – NULL – 0:0*; 5.52% From Current Price
$396 – Even – 1:1; 4.47% From Current Price
$392 – Buyers – 1.09:1; 3.41% From Current Price
$388 – Buyers – 0.5:0*; 2.36% From Current Price
$384 – Buyers – 0.7:0*; 1.3% From Current Price
$380 – Sellers – 3:1; 0.25% From Current Price
$376 – Buyers – 2.5:1; -0.81% From Current Price
$372 – Sellers – 2.9:0*; -1.87% From Current Price
$368 – Buyers – 9.33:1; -2.92% From Current Price
$364 – Buyers – 1.68:1; -3.98% From Current Price
$360 – Sellers – 1.06:1; -5.03% From Current Price
$356 – Sellers – 1.82:1; -6.09% From Current Price
$352 – Buyers – 2.33:1; -7.14% From Current Price
$348 – Sellers – 1.03:1; -8.2% From Current Price
$344 – Sellers – 1.28:1; -9.25% From Current Price
$340 – Buyers – 1.12:1; -10.31% From Current Price
$336 – Sellers – 1.42:1; -11.36% From Current Price
$332 – Sellers – 4:1; -12.42% From Current Price
$328 – Buyers – 1.15:1; -13.47% From Current Price
$324 – Buyers – 2.4:1; -14.53% From Current Price
$320 – Sellers – 1.51:1; -15.58% From Current Price
$316 – Sellers – 1.29:1; -16.64% From Current Price
$312 – Sellers – 1.94:1; -17.69% From Current Price
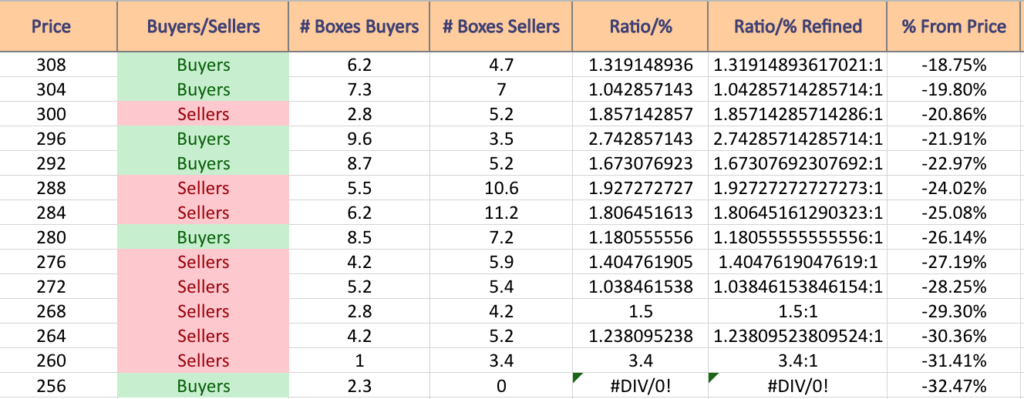
$308 – Buyers – 1.32:1; -18.75% From Current Price
$304 – Buyers – 1.04:1; -19.8% From Current Price
$300 – Sellers – 1.86:1; -20.86% From Current Price
$296 – Buyers – 2.74:1; -21.91% From Current Price
$292 – Buyers – 1.67:1; -22.97% From Current Price
$288 – Sellers – 1.93:1; -24.02% From Current Price
$284 – Sellers – 1.81:1; -25.08% From Current Price
$280 – Buyers – 1.18:1; -26.14% From Current Price
$276 – Sellers – 1.4:1; -27.19% From Current Price
$272 – Sellers – 1.04:1; -28.25% From Current Price
$268 – Sellers – 1.5:1; -29.3% From Current Price
$264 – Sellers – 1.24:1; -30.36% From Current Price
$260 – Sellers – 3.4:1; -31.41% From Current Price
$256 – Buyers – 2.3:0*; -32.47% From Current Price
Price:Volume Sentiment Analysis For IWM, The iShares Russell 2000 ETF
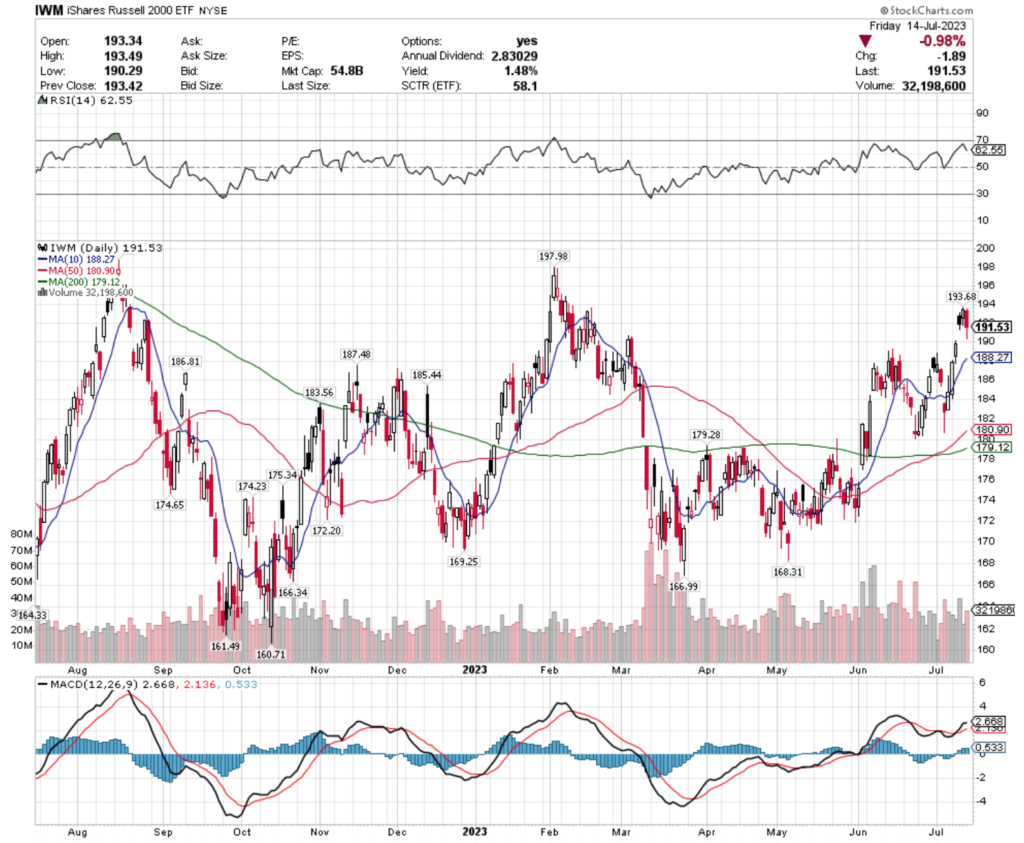
They tend to stay much more in a range compared to SPY & QQQ, making it important to understand their behavior at different price levels, as they are more likely to return to the same level more often than the other names listed in this article.
For the detailed chart breakdown, please see last night’s post here.


IWM ETF’s Volume Sentiment By Price Level
(*BOLD denotes a Moving Average)
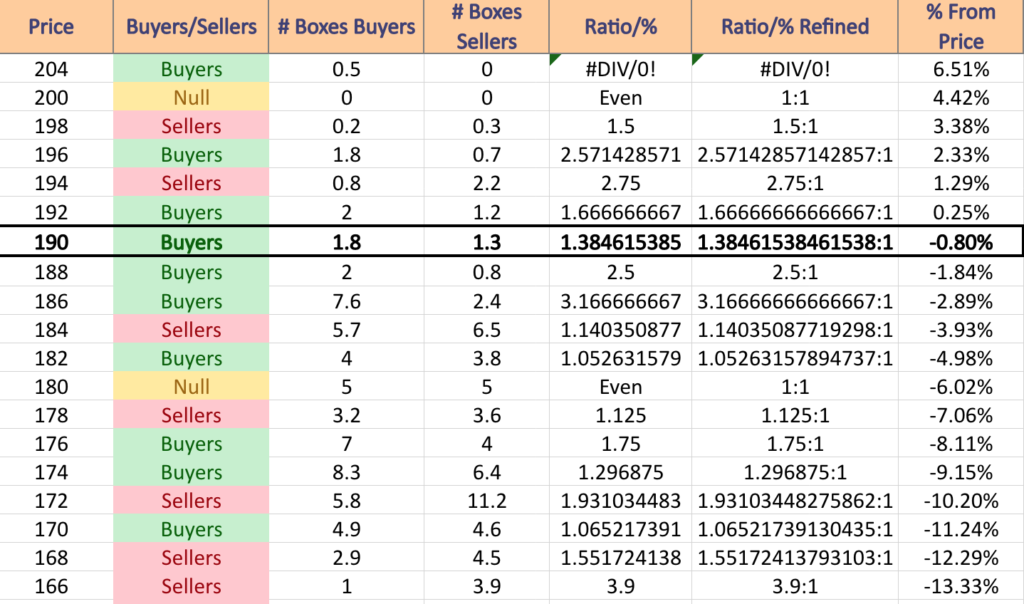
$204 – Buyers – 0.5:0*; 6.51% From Current Price
$200 – NULL – 0:0*; 4.42% From Current Price
$198 – Sellers – 1.5:1; 3.38% From Current Price
$196 – Buyers – 2.57:1; 2.33% From Current Price
$194 – Sellers – 2.75:1; 1.29% From Current Price
$192 – Buyers – 1.67:1; 0.25% From Current Price
$190 – Buyers – 1.39:1; -0.8% From Current Price
$188 – Buyers – 2.5:1; -1.84% From Current Price
$186 – Buyers – 3.17:1; -2.89% From Current Price
$184 – Sellers – 1.14:1; -3.93% From Current Price
$182 – Buyers – 1.05:1; -4.98% From Current Price
$180 – Even – 1:1; -6.02% From Current Price
$178 – Sellers – 1.13:1; -7.06% From Current Price
$176 – Buyers – 1.75:1; -8.11% From Current Price
$174 – Buyers – 1.30:1; -9.15% From Current Price
$172 – Sellers – 1.93:1; -10.2% From Current Price
$170 – Buyers – 1.07:1; -11.24% From Current Price
$168 – Sellers – 1.55:1; -12.29% From Current Price
$166 – Sellers – 3.9:1; -13.33% From Current Price
$164 – Sellers – 2.7:1; -14.37% From Current Price
$162 – Sellers – 1.31:1; -15.42% From Current Price
Price:Volume Sentiment Analysis For DIA, The SPDR Dow Jones Industrial Average ETF
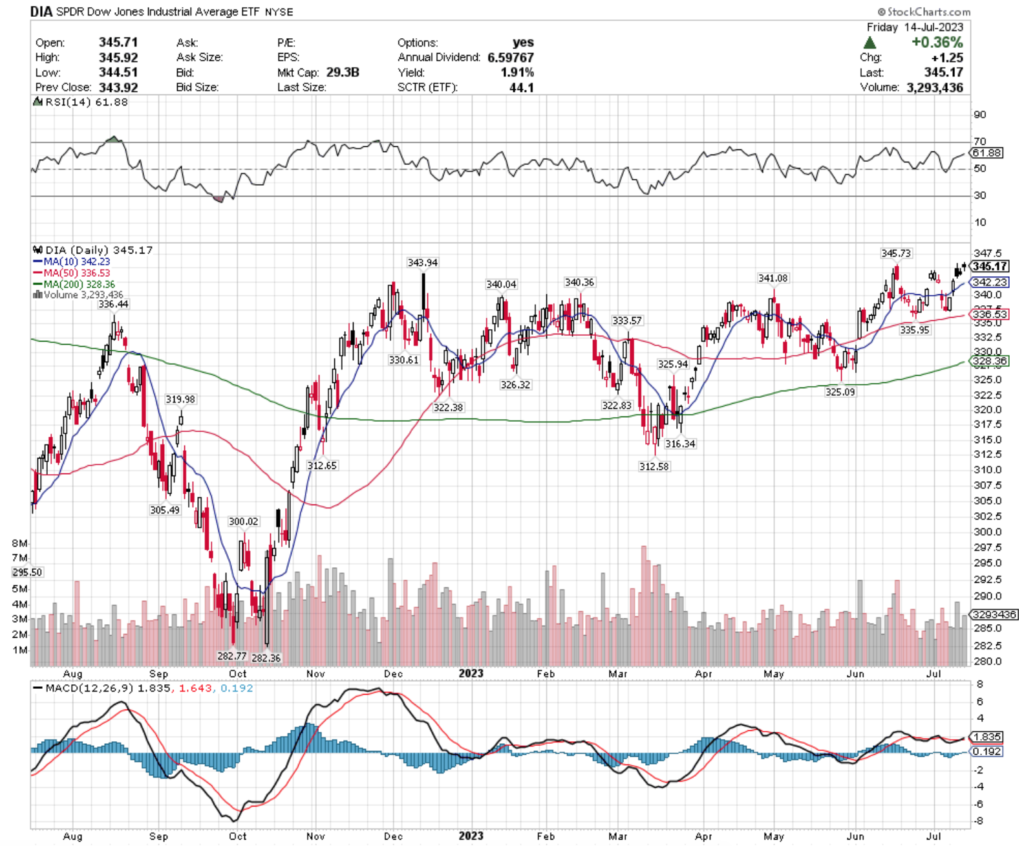
DIA has remained more consistently priced than its peers that are also examined in this document, likely as investors seek safety in uncertain times by buying larger cap stocks.
For the detailed chart breakdown, please see last night’s post here.

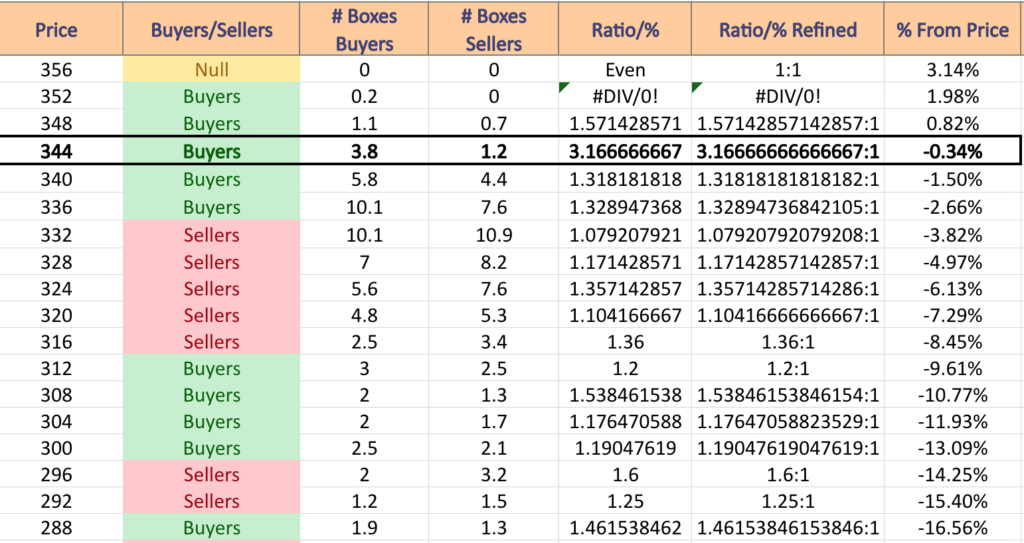
DIA ETF’s Volume Sentiment By Price Level
(*BOLD denotes a Moving Average)
$356 – NULL – 0:0*; 3.14% From Current Price
$352 – Buyers – 0.2:0*; 1.98% From Current Price
$348 – Buyers – 1.57:1; 0.82% From Current Price
$344 – Buyers – 3.17:1; -0.34% From Current Price
$340 – Buyers – 1.32:1; -1.5% From Current Price
$336 – Buyers – 1.33:1; -2.66% From Current Price
$332 – Sellers – 1.08:1; -3.82% From Current Price
$328 – Sellers – 1.17:1; -4.97% From Current Price
$324 – Sellers – 1.36:1; -6.13% From Current Price
$320 – Sellers – 1.10:1; -7.29% From Current Price
$316 – Sellers – 1.36:1; -8.45% From Current Price
$312 – Buyers – 1.2:1; -9.61% From Current Price
$308 – Buyers – 1.54:1; -10.77% From Current Price
$304 – Buyers – 1.18:1; -11.93% From Current Price
$300 – Buyers – 1.19:1; -13.09% From Current Price
$296 – Sellers – 1.6:1; -14.25% From Current Price
$292 – Sellers – 1.25:1; -15.4% From Current Price
$288 – Buyers – 1.46:1; -16.56% From Current Price
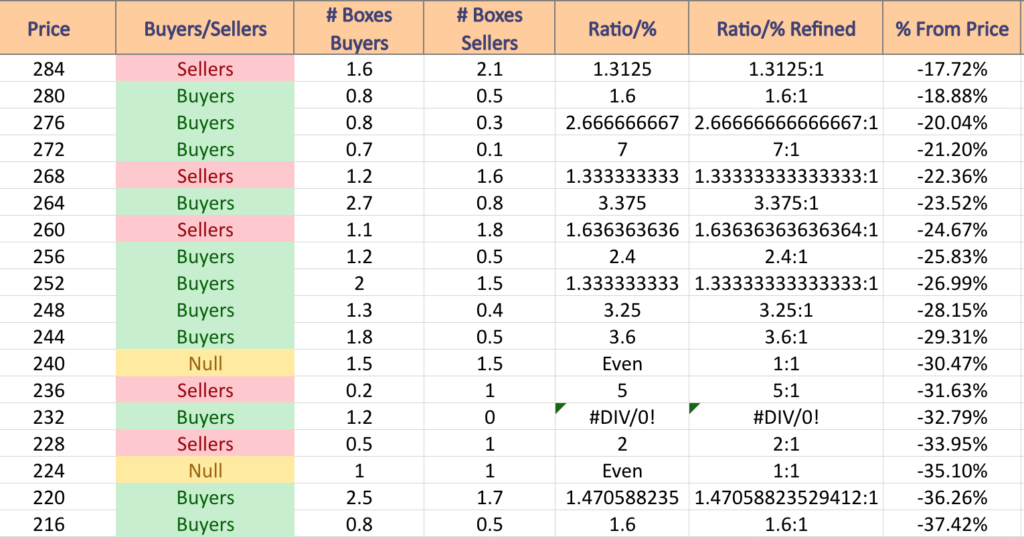
$284 – Sellers – 1.31:1; -17.72% From Current Price
$280 – Buyers – 1.6:1; -18.88% From Current Price
$276 – Buyers – 2.67:1; -20.04% From Current Price
$272 – Buyers – 7:1; -21.2% From Current Price
$268 – Sellers – 1.33:1; -22.36% From Current Price
$264- Buyers- 3.38:1; -23.52% From Current Price
$260 – Sellers – 1.64:1; -24.67% From Current Price
$256 – Buyers – 2.4:1; -25.83% From Current Price
$252 – Buyers – 1.33:1; -26.99% From Current Price
$248 – Buyers – 3.25:1; -28.15% From Current Price
$244 – Buyers – 3.6:1; -29.31% From Current Price
$240 – Even – 1:1; -30.47% From Current Price
$236 – Sellers – 5:1; -31.63% From Current Price
$232 – Buyers – 1.2:0*; -32.79% From Current Price
$228 – Sellers – 2:1; -33.95% From Current Price
$224 – Even – 1:1; -35.1% From Current Price
$220 – Buyers – 1.47:1; -36.26% From Current Price
$216 – Buyers – 1.6:1; -37.42% From Current Price
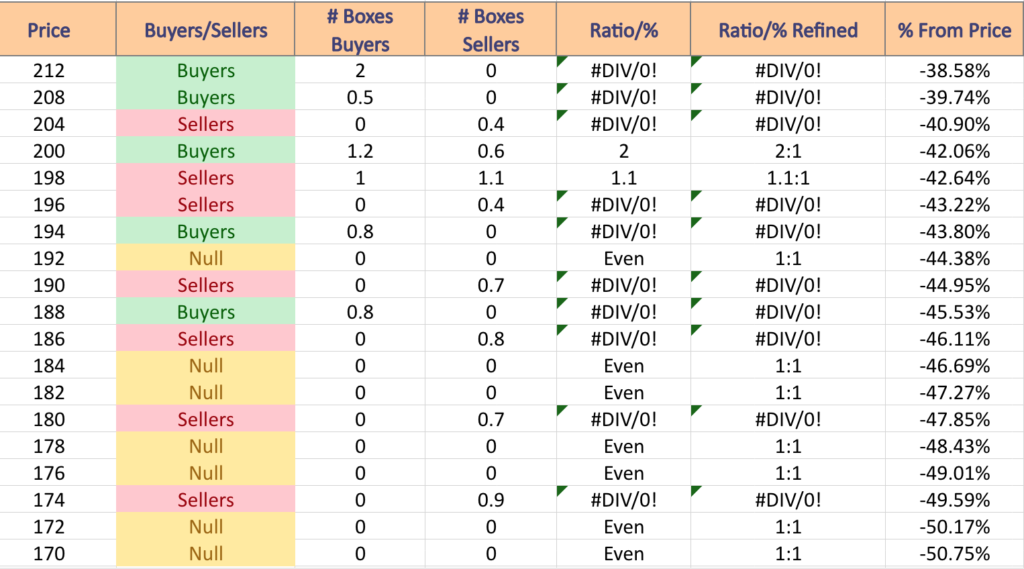
$212 – Buyers – 2:0*; -38.58% From Current Price
$208 – Buyers – 0.5:0*; -39.74% From Current Price
$204 – Sellers – 0.4:0*; -40.9% From Current Price
$200 – Buyers – 2:1; -42.06% From Current Price
$198 – Sellers – 1.1:1; -43.22% From Current Price
$196 – Sellers – 0.4:0*; -43.8% From Current Price
$194 – Buyers – 0.8:0*; -44.38% From Current Price
$192 – NULL – 0:0*; -45.53% From Current Price
$190 – Sellers – 0.7:0*; -46.11% From Current Price
$188 – Buyers – 0.8:0*; -46.69% From Current Price
$186 – Sellers – 0.8:0*; -47.27% From Current Price
Tying It All Together
Volume is one of the best indicators of investor sentiment that can be applied to any time frame, price level, or price range to help paint a better picture of the market’s behavior.
While it does not predict what will happen in the future as market conditions are ever changing & new variables may be of more importance now than they were when these volume levels were read, it can provide a reference as to how investors may behave when the same levels are approached again.
This document was intended to show investor sentiment at levels of support & resistance that are currently relevant to their price levels, while also providing more widespread data that can be used as prices move away from the levels of support & resistance mentioned above.
It can be combined with a current analysis of markets to give more clarity into how investors have historically behaved when prices have been in the price levels listed during the relevant time periods to provide additional detail to your analysis.
It is not intended to serve as investment recommendations or advice.
*** I DO NOT OWN SHARES OR OPTIONS CONTRACT POSITIONS IN SPY, QQQ, IWM or DIA AT THE TIME OF PUBLISHING THIS ARTICLE ***