SPY, the SPDR S&P 500 ETF gained +2.45% over the past week, only outperforming the Dow Jones Industrial Average in terms of weekly performance for an index.
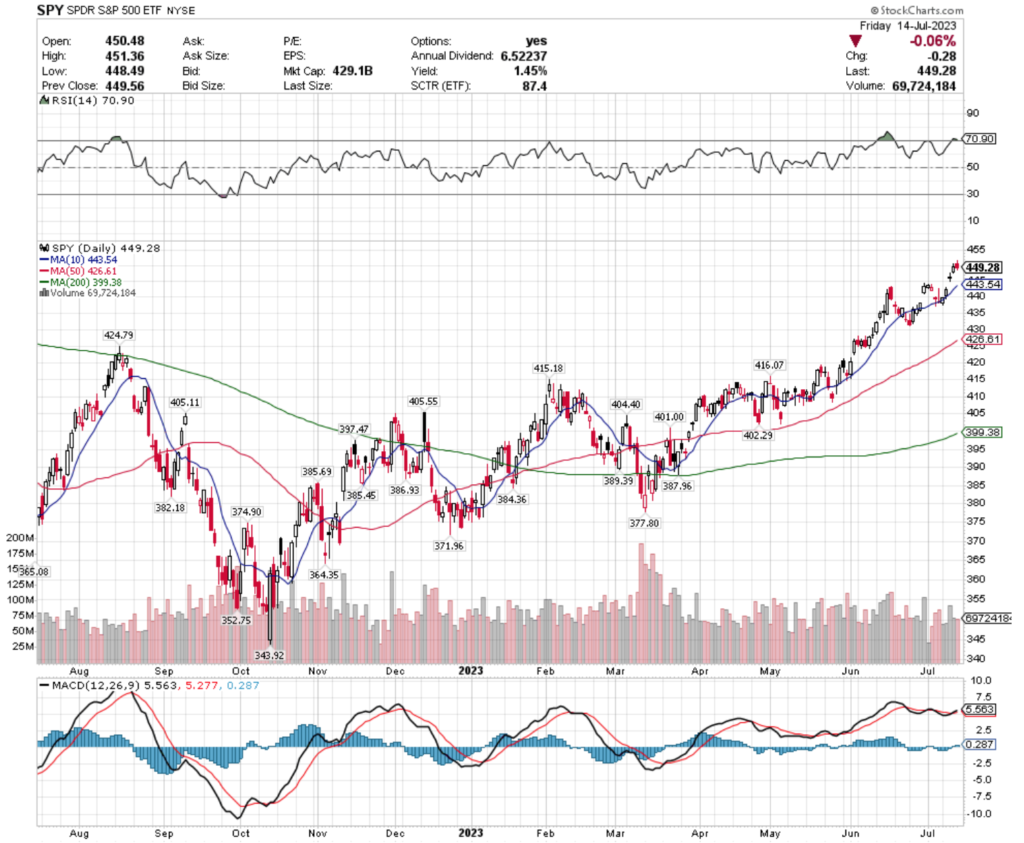
Their RSI closed in overbought territory for the week at 70.9, while their MACD remains mildly bullish, but not strong.
Their volume this week was below average compared to the year prior (722,203,760 vs. 83,556,752), with the heaviest traded session falling on Wednesday, a gap up day that resulted in a spinning top candlestick, a sign of uncertainty among investors.
Friday closed the week out also on a spinning top candle, but Friday’s was bearish, which makes it seem more likely that we will see Wednesday’s gap attempt to be filled this week.
There is support within the gap from the 10 Day Moving Average, but oscillators are signaling that we are due for a consolidation, which based on how far spaced apart support levels are at the moment may cause a 5%+ drop from their current price level.
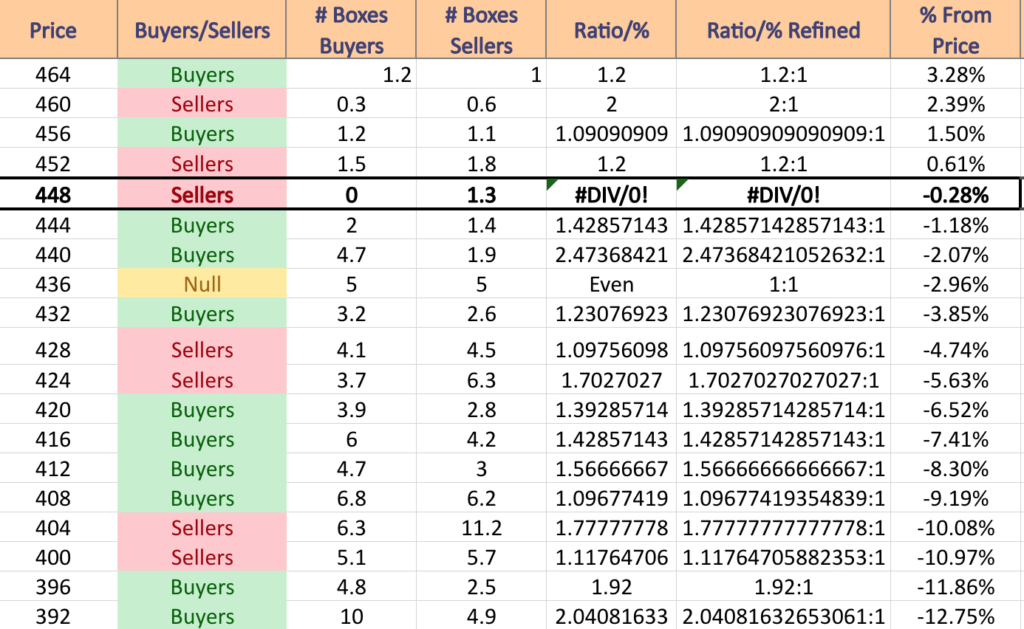
SPY has support at the $443.54 (10 Day Moving Average; Volume Sentiment: Buyers, 2.47:1), $426.61 (50 Day Moving Average; Volume Sentiment: Sellers, 1.70:1), $424.79 (Volume Sentiment: Sellers, 1.70:1) & $416.07 (Volume Sentiment: Buyers, 1.43:1), with resistance at the $452.69 (Volume Sentiment: Sellers, 1.2:1), $460.87 (Volume Sentiment: Sellers, 2:1) & $468.78/share (Volume Sentiment: NULL, 0:0*) price levels.
QQQ, the Invesco QQQ Trust ETF climbed +3.5% over the past week, as the technology-heavy index was the second best performing index to the small cap Russell 2000.
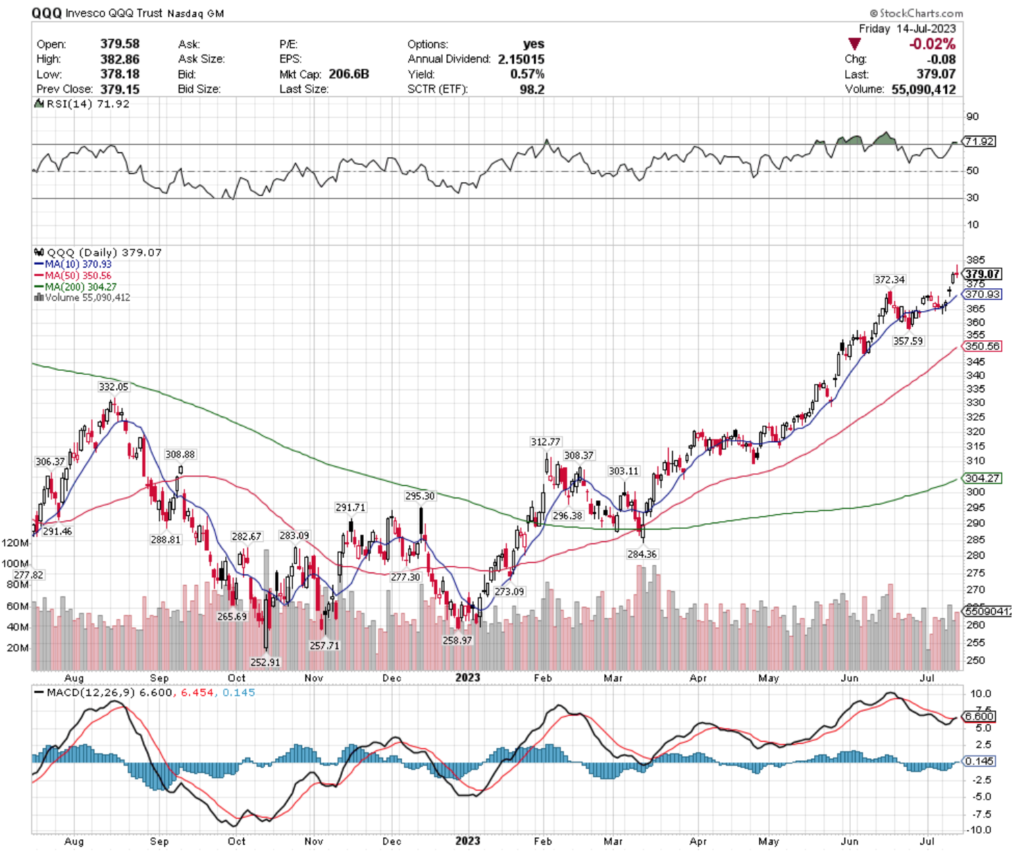
Their RSI is also overbought at 71.92, with their MACD beginning to signal danger ahead & turning bearish.
Volumes were slightly below average last week compared to the prior year (50,149,220 vs. 55,601,102), which indicates that the weekly gain was not done with complete confidence by market participants.
Wednesday’s gap up day resulted in a doji, signaling uncertainty about the following price movement, and while Thursday’s candle was more confident (in terms of body:shadow), volume dipped that day, despite it being another gap up, indicating that investors were on the fence.
Friday’s gravestone doji on a bearish session with higher volume than Thursday’s confirms this sentiment, as investors did not want to carry much additional risk into the weekend & were beginning to take profits & perhaps make hedges.
QQQ doesn’t have any support between the price & the bottom of the gap formed on Thursday, but does have two touch-points around the second gap formed Wednesday, which could lead into a steep decline, with the 50 Day Moving Average falling -7.52% below the current price being the last major support near the price that doesn’t fall within what is considered a “correction” range.
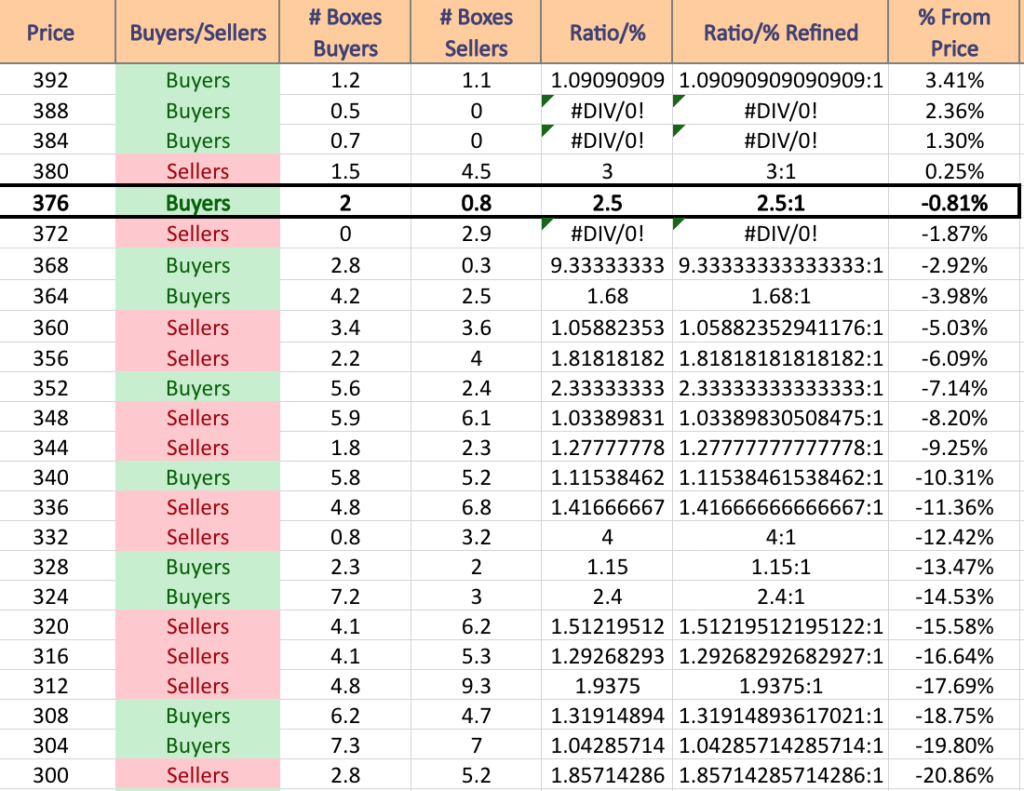
QQQ has support at the $372.34 (Volume Sentiment: Sellers, 2.9:0*), $370.93 (10 Day Moving Average; Volume Sentiment: Buyers, 9.33:1), $357.59 (Volume Sentiment: Sellers, 1.82:1) & $350.56/share (50 Day Moving Average; Volume Sentiment: Sellers, 1.03:1) price levels, with resistance at the $404.02/share price level (Volume Sentiment: NULL, 0:0*).
IWM, the iShares Russell 2000 ETF improved +3.69% over the past week, faring the best of the major indexes.
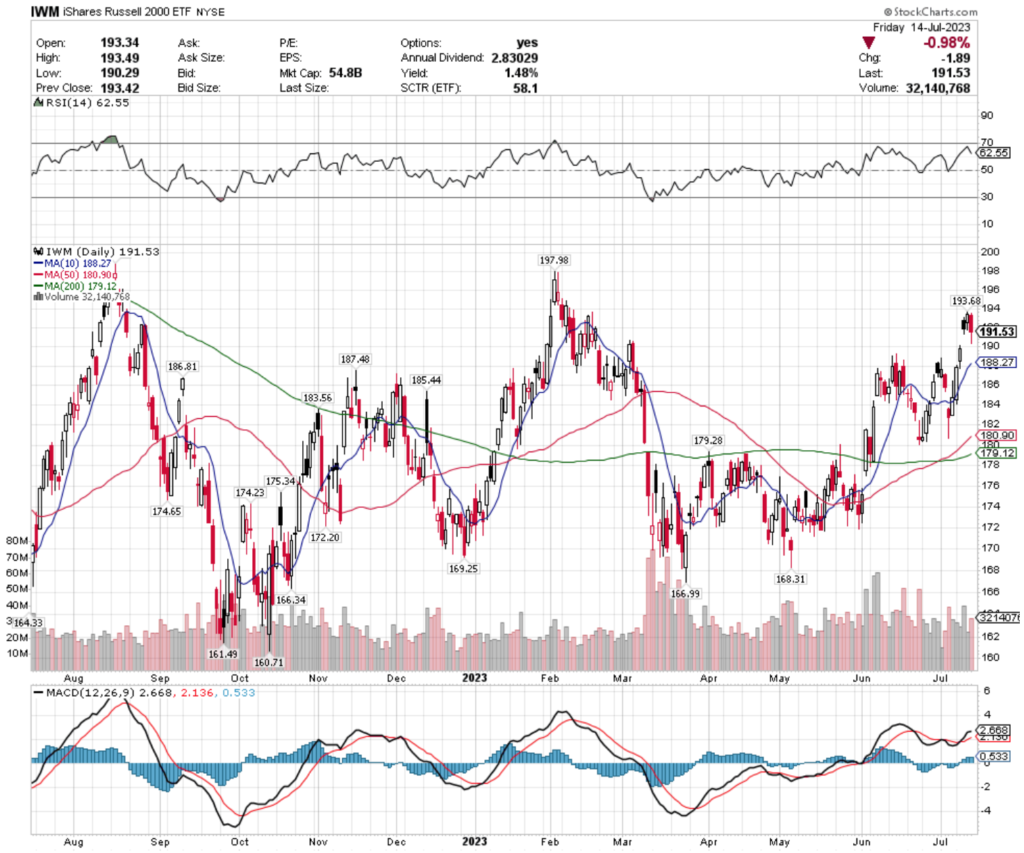
Their RSI is just beyond the overbought end of the neutral range at 62.55 & trending downward, with their MACD beginning to show signals of a bearish crossover in the coming days’ sessions.
Volumes were slightly above average last week compared to the year prior (30,455,980 vs. 27,794,121), with an interesting trend between the two heaviest volume days.
They were the bookends of the current price range established by Wednesday’s gap up (heaviest volume) & Friday’s session, whose lower shadow extended well into the aforementioned gap, but recovered enough before the close to stay just below the new price range.
There is no support within this gap, which makes the coming days interesting as the nearest support level sits below the gap & -1.7% below the current price.
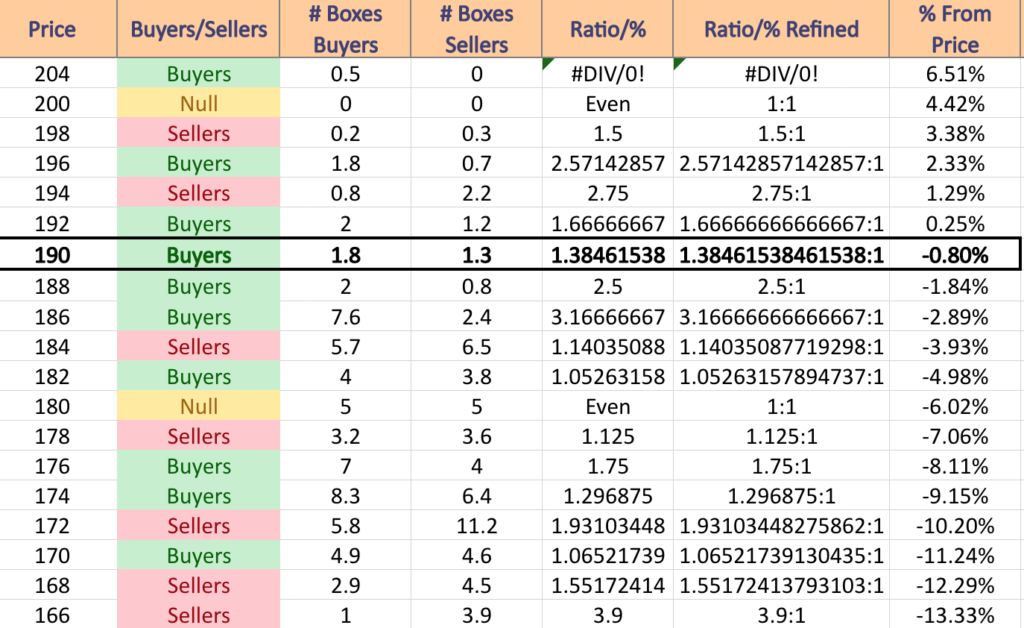
IWM has support at the $188.27 (10 Day Moving Average; Volume Sentiment: Buyers, 2.5:1), $187.48 (Volume Sentiment: Buyers, 3.17:1), $186.81 (Volume Sentiment: Buyers, 3.17:1) & $185.44/share (Volume Sentiment: Sellers, 1.14:1) price levels, with resistance at the $193.68 (Volume Sentiment: Buyers, 1.67:1), $197.98 (Volume Sentiment: Buyers, 2.57:1), $198.74 (Volume Sentiment: Sellers, 1.5:1) & $202.21/share (Volume Sentiment: NULL, 0:0*) price levels.
DIA, the SPDR Dow Jones Industrial Average ETF advanced +2.29% over the past week, the least among the major averages.
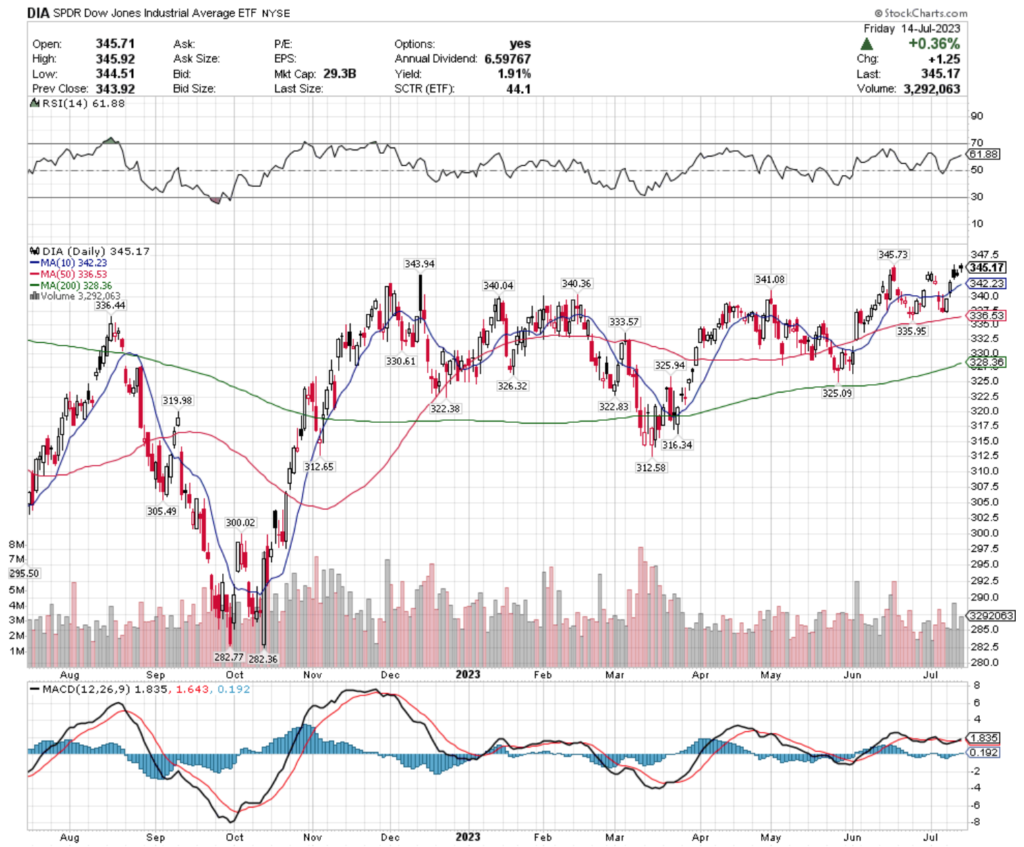
Their RSI is on the overbought end of the neutral range at 61.88, with a MACD that is barely bullish.
Volumes were lighter than average last week compared to the year prior (2,989,640 vs. 3,588,598), signaling uncertainty among market participants.
Their highest volume day of the week was Wednesday, where they gapped up slightly, but the session closed below where it opened, signaling further uncertainty & a lack of confidence in the move.
Thursday & Friday resulted in spinning top candles, another sign of uncertainty among market participants, but unlike the other indexes, DIA has support levels much closer to their current price, which is also likely due to the size of the index components.
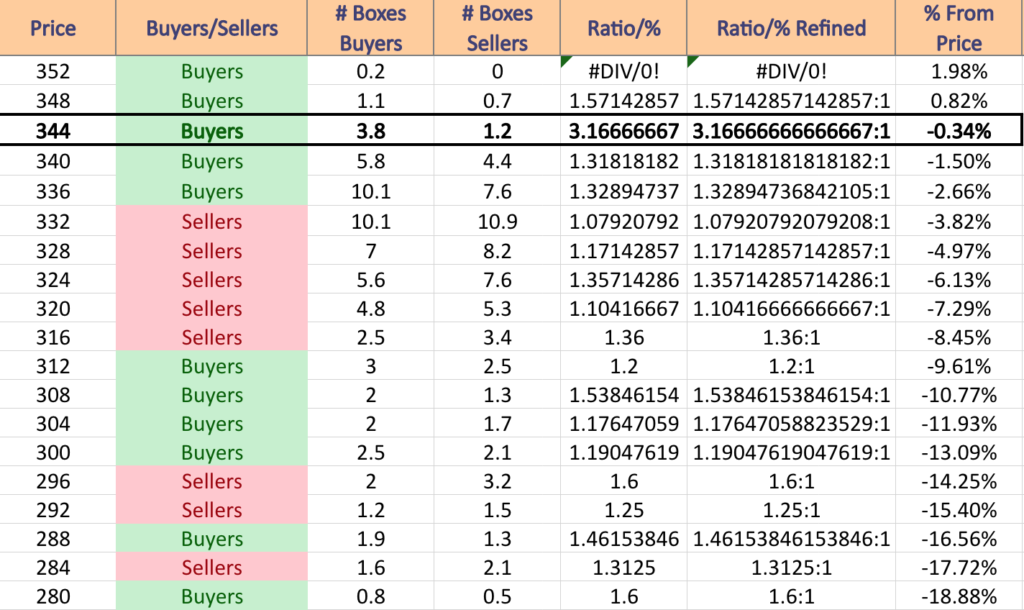
DIA has support at the $343.94 (Volume Sentiment: Buyers, 1.32:1), $342.23 (10 Day Moving Average; Volume Sentiment: Buyers, 1.32:1), $341.08 (Volume Sentiment: Buyers, 1.32:1) & $340.36/share (Volume Sentiment: Buyers, 1.32:1) price levels, with resistance at the $345.73/share price level (Volume Sentiment: Buyers, 3.17:1)
Let’s dive into some of the best & worst performing industries & geo-locations in the market now based on their ETF’s technical rating!
Transportation (TPOR), Mexico (MEXX), Industrials (DUSL) & Social Media (SOCL) Are Bullishly Leading The Market
TPOR, the Direxion Daily Transportation Bull 3x Shares ETF has climbed +39.61% over the past year, including a +95.63% recovery from their 52-week low in October of 2022 (ex-distributions).
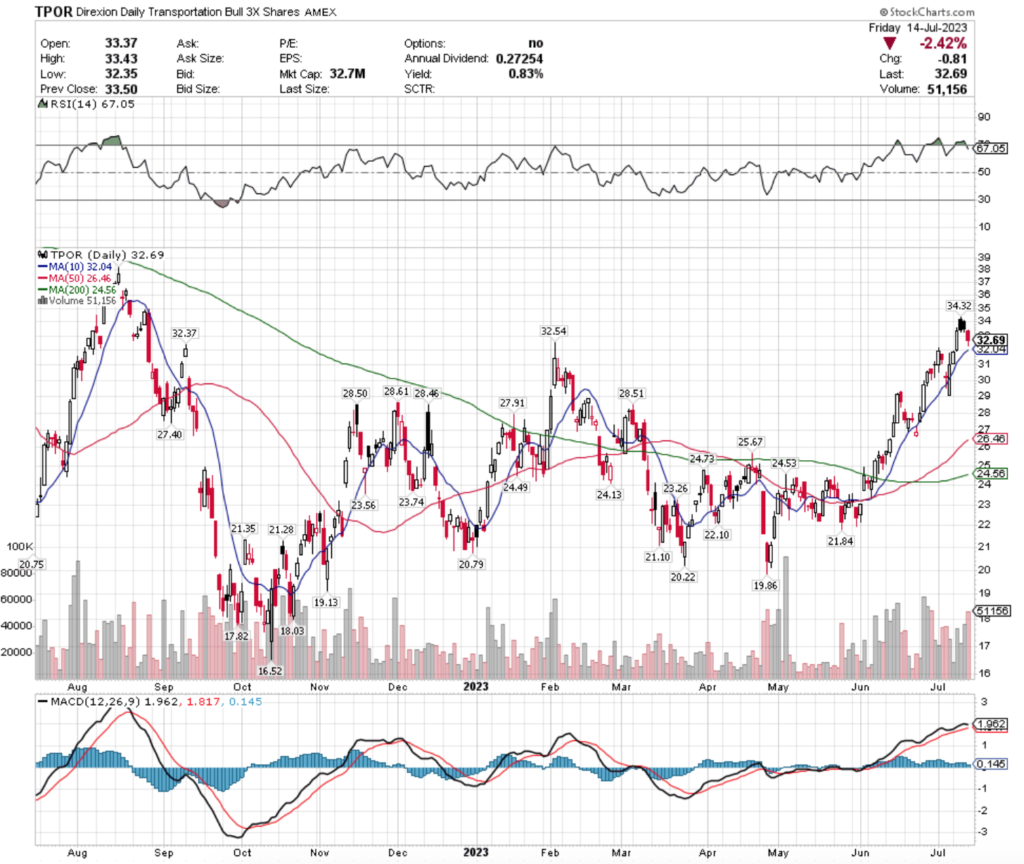
Their RSI just dipped back beneath overbought levels at 67.05, with their MACD signaling an impending bearish crossover in the coming sessions after the mid-to-end of week weakness.
Last week’s volume was above average compared to the year prior (34,080 vs. 26,825), however the configuration of the week’s candlesticks should be a cause of concern for market participants.
Monday & Tuesday were advancing days, but they also had the lowest volumes of the week, with exception to Wednesday’s session, which is currently marking the most recent top & the reversal point, as the day opened above the prior two, but closed below the open.
Investors may think to take some profits or hedge against losses using an options strategy while waiting to see how it behaves around support levels, as their 0.83% distribution yield will not provide much protection.
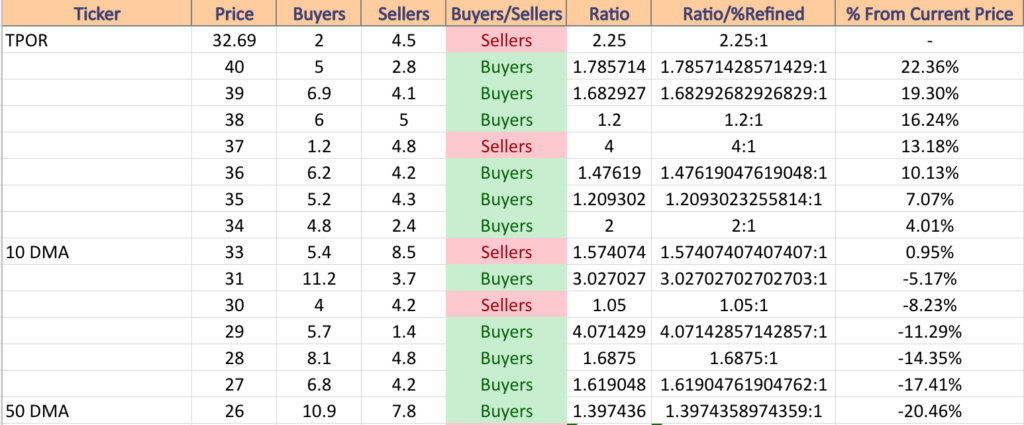
TPOR has support at the $32.54 (Volume Sentiment: Sellers, 2.25:1), $32.37 (Volume Sentiment: Sellers, 2.25:1), $32.04 (10 Day Moving Average; Volume Sentiment: Sellers, 2.25:1) & $28.61/share (Volume Sentiment: Buyers, 1.69:1), with resistance at the $34.23 (Volume Sentiment: Buyers, 2:1), $36.01 (Volume Sentiment: Buyers, 1.48:1), $38.14 (Volume Sentiment: Buyers, 1.2:1) & $40.16/share (Volume Sentiment: Buyers, 1.79:1) price levels.
MEXX, the Direxion Daily MSCI Mexico Bull 3x Shares ETF has ballooned an astounding +142.18% over the past year, tacking on +176.43% from their 52-week low in September of 2022 (ex-distributions).
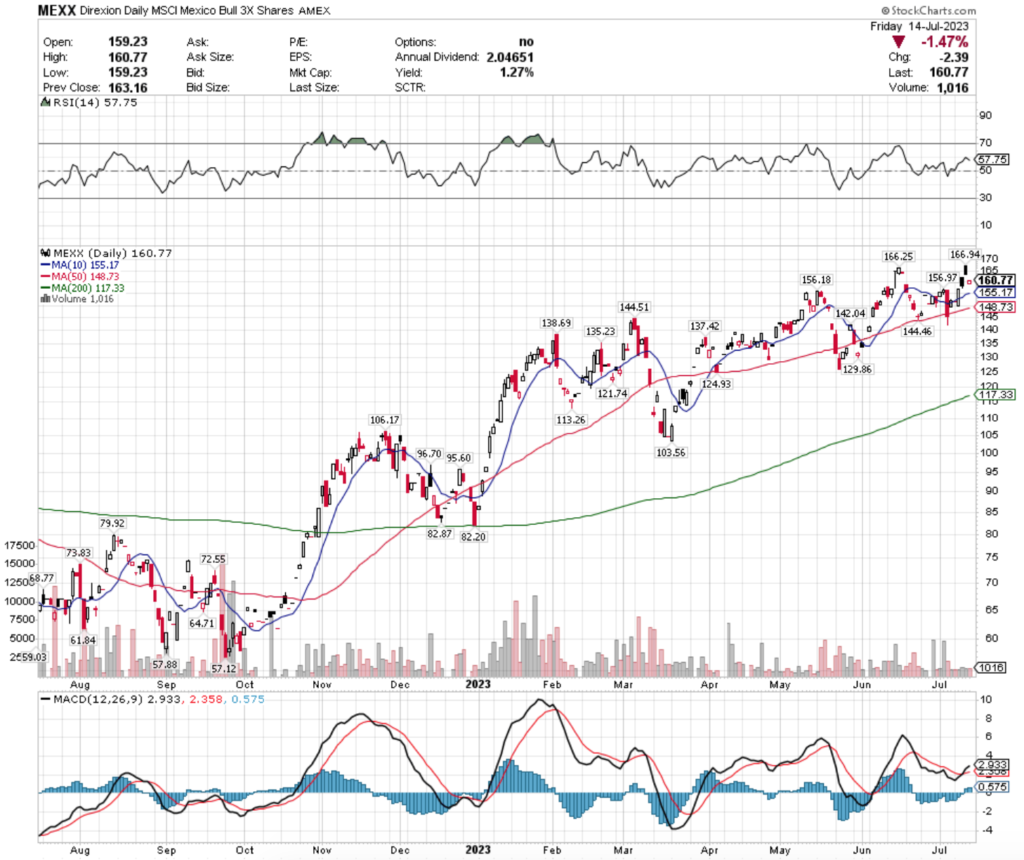
Their RSI is beginning to trend back towards neutral at 57.75, but their MACD is still bullish.
Last week’s volume decline to below half of the past year’s average (1,040 vs. 2,370) as the latter half of the week was marked with gaps & lower closing than opening prices (with exception to Friday’s session), signaling uncertainty among investors.
Friday’s candle does require a closer examination, as the day opened lower & the open & low were the same price level, and the closing price also happened to be the high for the day on a bearish gap down that fell midway between the body of Wednesday’s candle.
This has tended to lead to near-term bearishness, which makes it important to take profits or have a hedging strategy in place, such as buying puts or selling calls, as their 1.27% distribution yield will not provide much protection against losses.
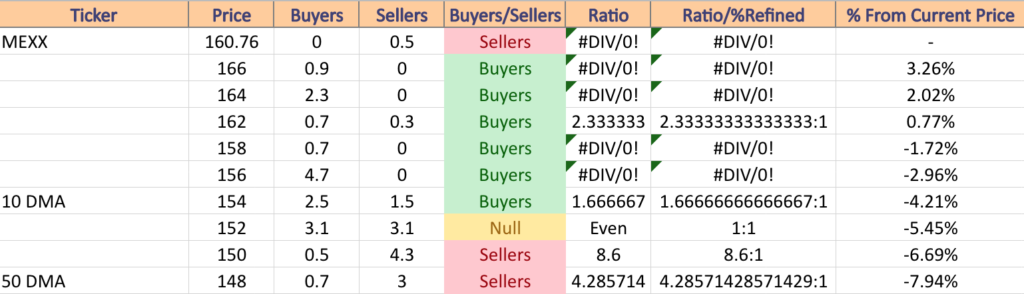
MEXX has support at the $156.97 (Volume Sentiment: Buyers, 4.7:0*), $156.18 (Volume Sentiment: Buyers, 4.7:0* ), $155.17 (10 Day Moving Average; Volume Sentiment: Buyers, 1.67:1) & $148.73/share (Volume Sentiment: Sellers, 4.29:1) price levels, with resistance overhead at the $166.25 (Volume Sentiment: Buyers, 0.9:0*), $166.94 (Volume Sentiment: Buyers, 0.9:0*), $209.77 (Volume Sentiment: NULL, 0:0*) & $249.31/share (Volume Sentiment: NULL, 0:0*) price levels.
DUSL, the Direxion Daily Industrials Bull 3x Shares ETF has gained +68.68% over the past year, adding +97.95% from their 52-week low in October of 2022 (ex-distributions).
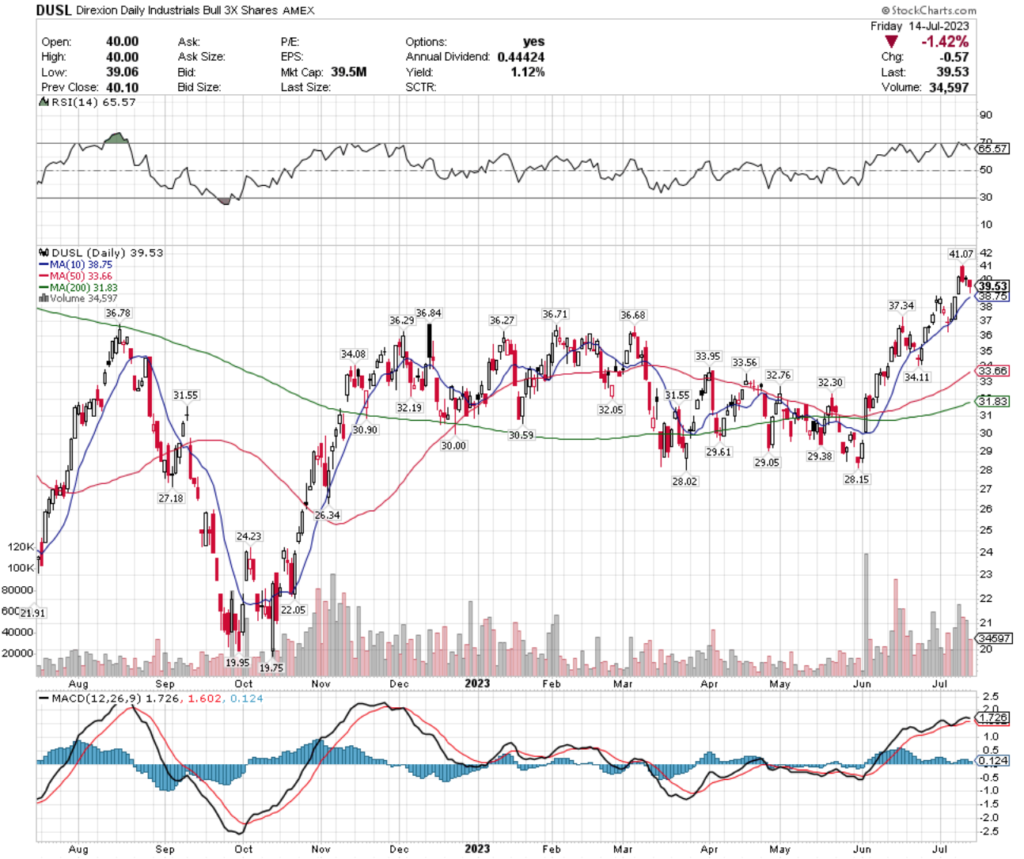
Their RSI is trending back toward neutral from overbought at 65.57, with their MACD showing an impending bearish crossover on the horizon.
Last week’s volume was more than double the average volume of the year prior (50,580 vs. 24,198) with the highest volumes occurring on Tuesday’s gap up session & Thursday’s session which resulted in a dragonfly doji.
Friday closed with a hanging man candle in a three day downtrend, which signals more weakness is on the horizon.
With only a 1.21% distribution yield there is not much in terms of protection against losses during a consolidation period, making it appropriate to find a hedging strategy & to trim some profits after the bull run of the last month & a half.
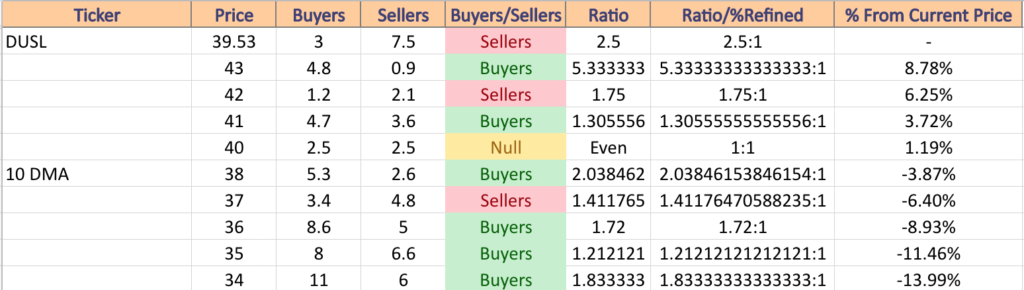
DUSL has support at the $38.75 (10 Day Moving Average; Volume Sentiment: Buyers, 2.04:1), $37.34 (Volume Sentiment: Sellers, 1.41:1), $36.84 (Volume Sentiment: Buyers, 1.72:1) & $36.78/share (Volume Sentiment: Buyers, 1.72:1) price levels, with resistance at the $41.07 (Volume Sentiment: Buyers, 1.31:1), $42.28 (Volume Sentiment: Sellers, 1.75:1), $44.33 (Volume Sentiment: Sellers, 2.7:1) & $48.73/share (Volume Sentiment: NULL, 0:0*) price levels.
SOCL, the Global X Social Media Index ETF has advanced +21.39% over the past year, gaining +63.08% since their 52-week low in November of 2022 (ex-distributions).
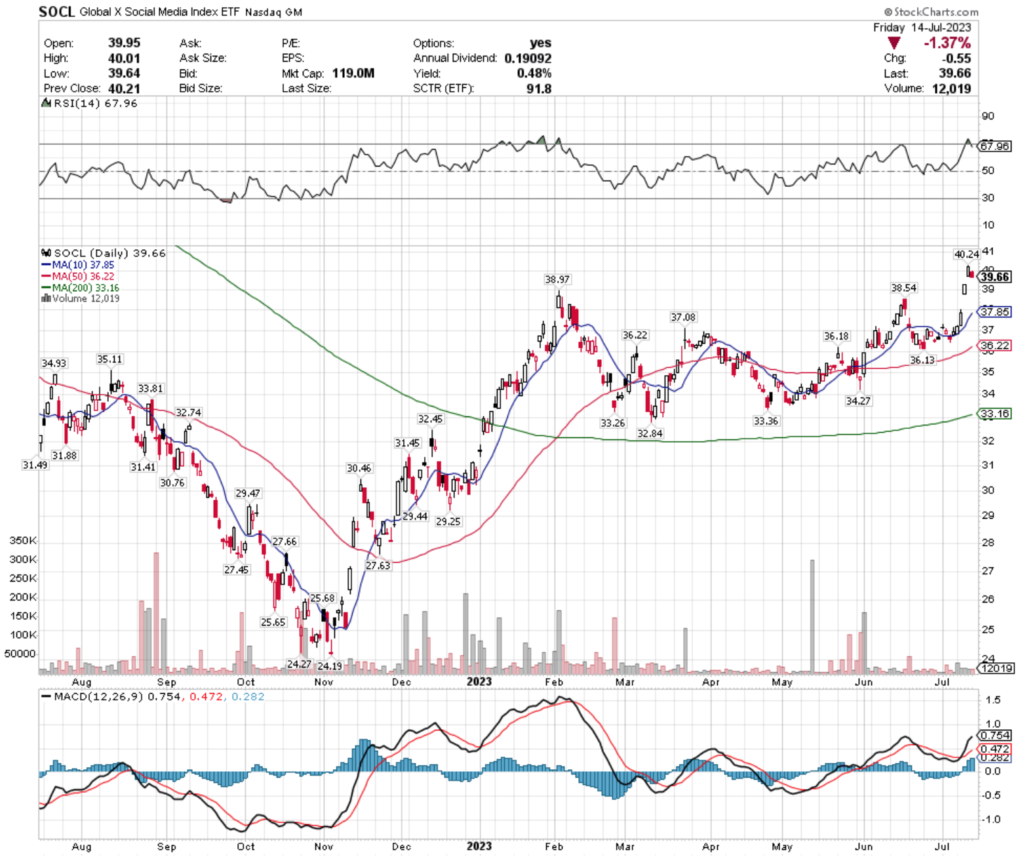
Their RSI is trending back out of overbought territory at 67.96, but their MACD is still bullish (although beginning to curl over bearishly).
Last week’s volume fell to about half of the average volume for the year (16,080 vs. 31,306) in a week that’s gains mostly were due to Wednesday & Thursday’s gap up sessions.
SOCL sports a modest 0.48% distribution yield, which will not provide much protection against losses, making this a good time to think about a hedging strategy & profit taking before it attempts to fill in the gaps from last week & consolidate while its oscillators return to normal levels.
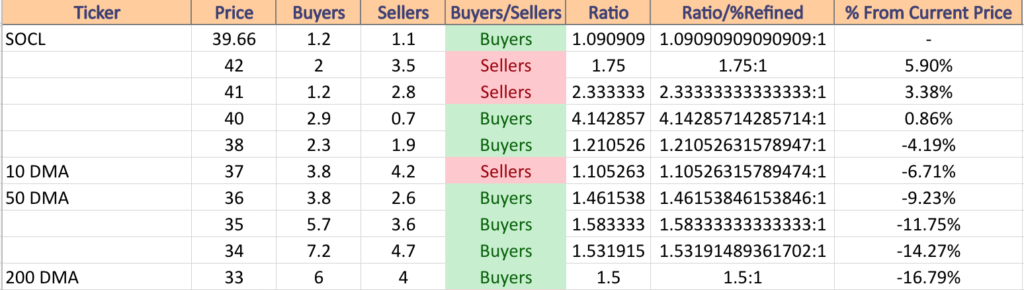
SOCL has support at the $38.97 (Volume Sentiment: Buyers, 1.21:1), $38.54 (Volume Sentiment: Buyers, 1.21:1), $37.85 (10 Day Moving Average; Volume Sentiment: Sellers, 1.11:1) & $37.08/share (Volume Sentiment: Sellers, 1.11:1) price levels, with resistance at the $40.24 (Volume Sentiment: Buyers, 4.14:1), $45.20 (Volume Sentiment: Sellers, 3.4:1), $45.63 (Volume Sentiment: Sellers, 3.4:1) & $49.32/share (Volume Sentiment: Sellers, 1.03:1) price levels.
Energy (ERX), Thailand (THD), 7-10 Year U.S. Treasuries (UST) & U.S. Pharmaceuticals (IHE) Are Bearishly Lagging The Market
ERX, the Direxion Daily Energy Bull 2x Shares ETF has gained 26.57% over the past year, including a +30.29% rebound from their 52-week low in September of 2022, but has declined -29.76% from their 52-week high in November of 2022 (ex-distributions).
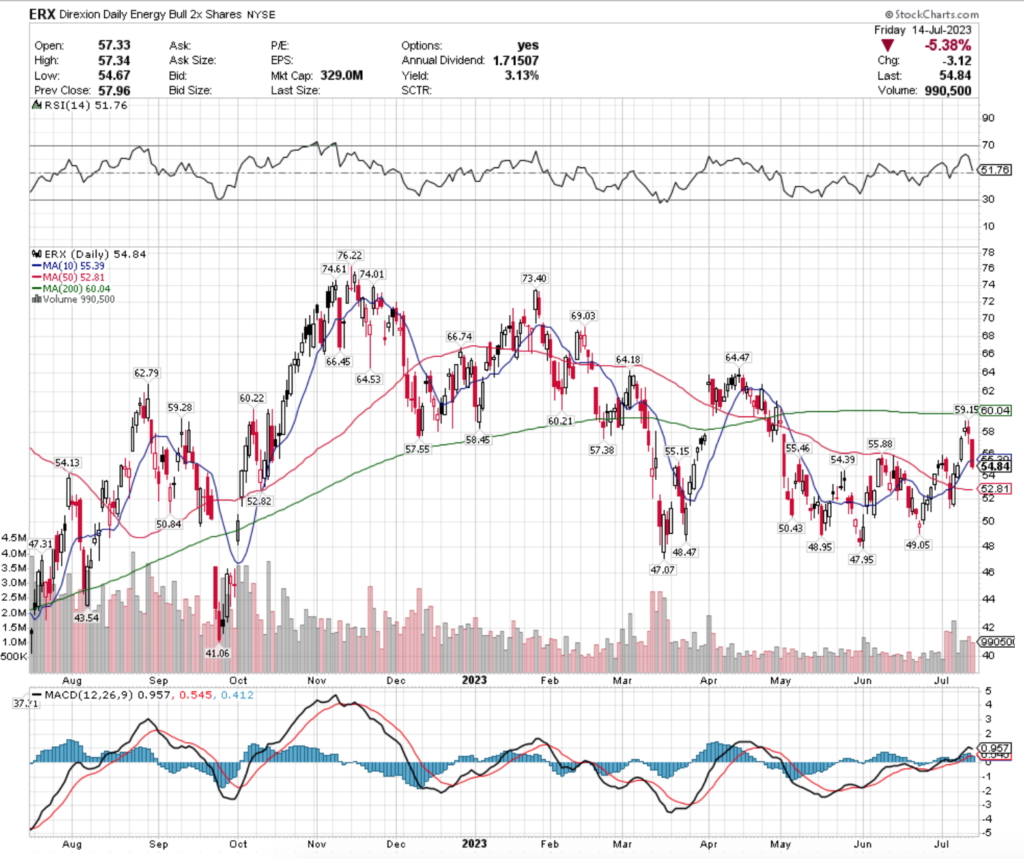
Their RSI has dropped to neutral at 51.76 & their MACD is moving towards a bearish crossover in the coming days.
Last week’s volume was below average compared to the year prior (998,940 vs. 1,462,217) in a week that started off advancing & on Wednesday went into bearish decline after Wednesday’s spinning top candle led to another on Thursday & a break of the 10 Day Moving Average’s support on Friday’s down day.
ERX pays a 3.13% distribution yield to long-term holders, which will provide some protection against losses, however it would be wise to begin looking for hedges against any existing positions while watching to see how its support levels hold up.
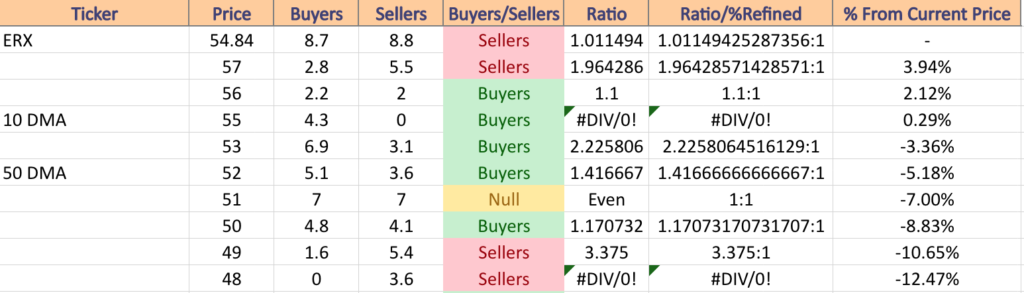
ERX has support at the $54.39 (Volume Sentiment: Sellers, 1.01:1), $54.13 (Volume Sentiment: Sellers, 1.01:1), $52.82 (Volume Sentiment: Buyers, 1.42:1) & $53.81/share (50 Day Moving Average; Volume Sentiment: Buyers, 2.23:1) price levels, with resistance overhead at the $55.15 (Volume Sentiment: Buyers, 4.3:0*), $55.39 (10 Day Moving Average; Volume Sentiment: Buyers, 4.3:0*), $55.46 (Volume Sentiment: Buyers, 4.3:0*) & $55.88/share (Volume Sentiment: Buyers, 4.3:0*) price levels.
THD, the iShares MSCI Thailand Capped ETF has inched forward +5.57% over the past year & +8.28% from their 52-week low in October of 2022, but has fallen -16.64% since their 52-week high in January of 2023 (ex-distributions).
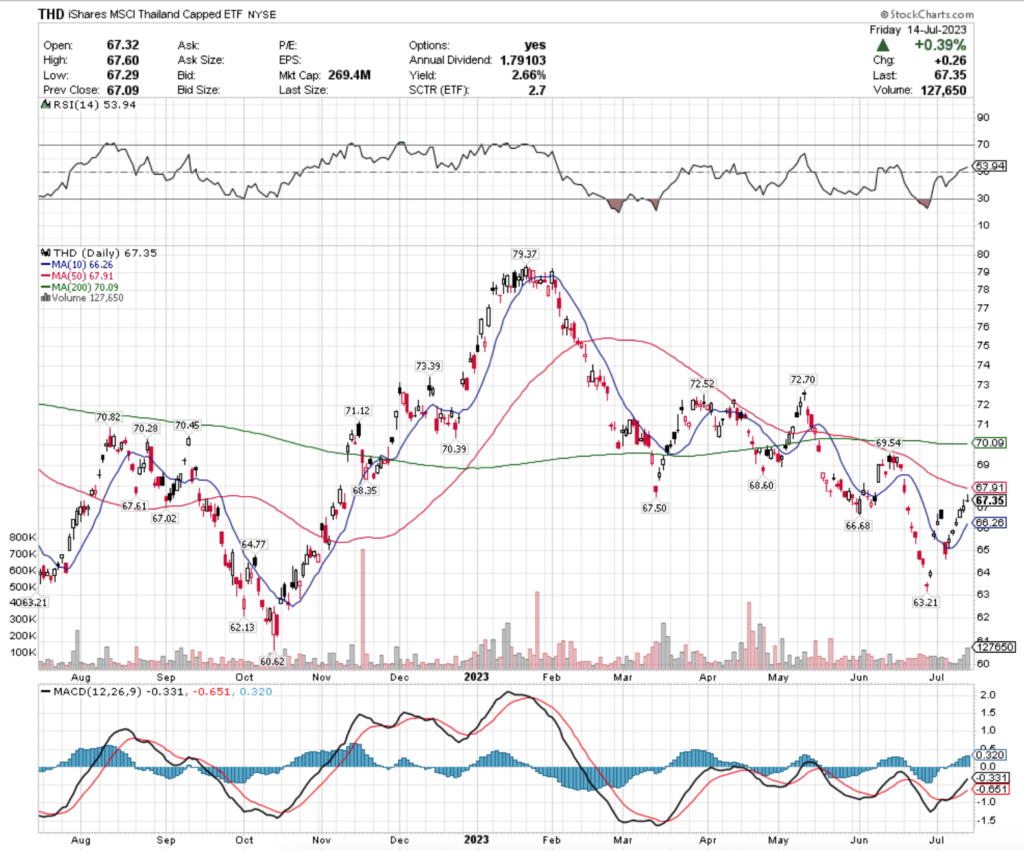
Their RSI is about neutral at 53.94, with their MACD still bullish following 5 sessions of gains, but a warning signal was shown on Friday.
Last week’s volume was slightly above average compared to the past year (80,140 vs. 78,464), but the day with the most volume came on Friday which resulted in a gravestone doji.
This week investors will have their eyes peeled to see if the will be a bearish reversal & how support levels hold up.
While they offer a 2.66% distribution yield, a hedging strategy using options would be a wise thing to look into in the coming days.
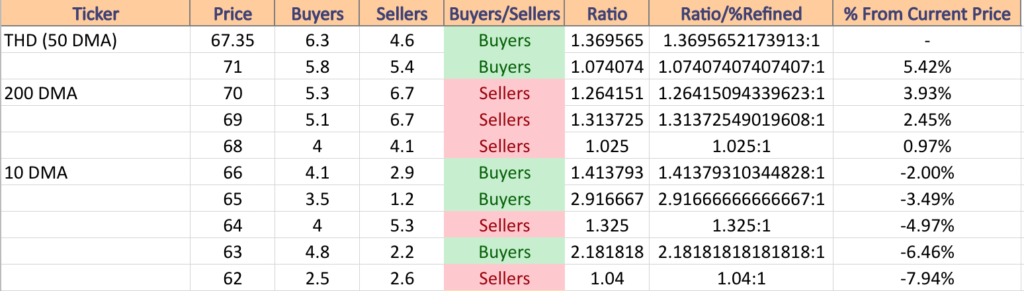
THD has support at the $67.02 (Volume Sentiment: Buyers, 1.37:1), $66.68 (Volume Sentiment: Buyers, 1.41:1), $66.26 (10 Day Moving Average; Volume Sentiment: Buyers, 1.41:!) & $64.77/share (Volume Sentiment: Sellers, 1.33:1) price levels, with resistance at the $67.50 (Volume Sentiment: Buyers, 1.37:1), $67.61 (Volume Sentiment: Buyers, 1.37:1), $67.91 (50 Day Moving Average; Volume Sentiment: Buyers, 1.37:1) & $68.35/share (Volume Sentiment: Sellers, 1.03:1) price levels.
UST, the ProShares Ultra 7-10 Year Treasury ETF has lost -12.46% over the past year, recovering +4.48% from their 52-week low in July of 2022 & dropped -19.55% since their 52-week high in August of 2022 (ex-distributions).
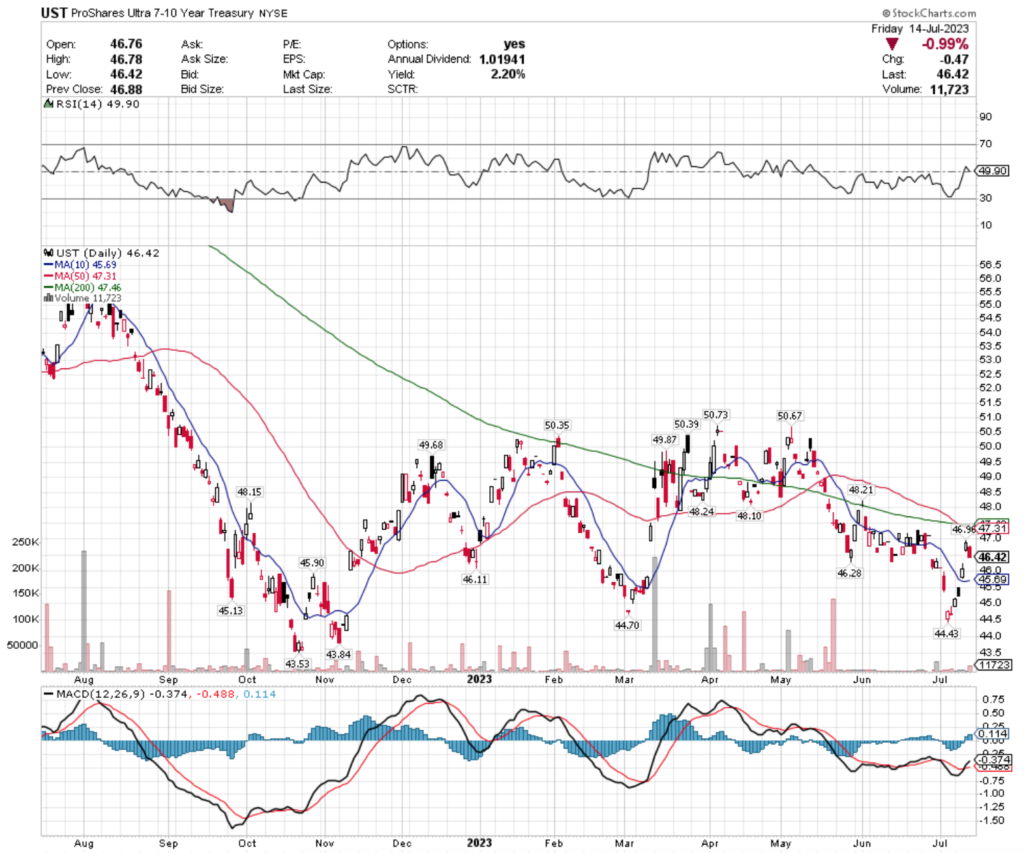
Their RSI is about neutral at 49.90 & their MACD is currently bullish, mostly due to a pair of gap ups on Wednesday & Thursday of last week.
Last week’s volumes were minuscule compared to the average volume of the past year (4,080 vs. 12,376), signaling that there was not much conviction among investors in the moves of the past week & investors should proceed with caution.
While UST offers a 2.2% distribution yield for long-term holders, that is limited protection against further consolidation & the closing of the gap that began on Friday, making it worthwhile to have a hedging strategy in place & waiting to see how it behaves around its support levels, especially given how the 10, 50 & 200 day moving averages are currently positioned around their share price.
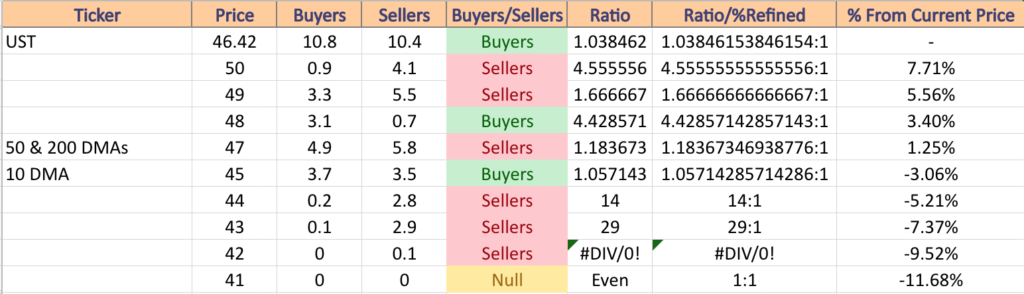
UST has support at the $46.28 (Volume Sentiment: ), $46.11 (Volume Sentiment: ), $45.69 (10 Day Moving Average; Volume Sentiment: ) & $45.13/share (Volume Sentiment: ) price levels, with resistance at the $46.96 (Volume Sentiment: ), $47.31 (50 Day Moving Average; Volume Sentiment: ), $47.46 (200 Day Moving Average; Volume Sentiment: ) & $48.10/share (Volume Sentiment: Buyers, 1.04:1) price levels.
IHE, the iShares U.S. Pharmaceutical ETF has given up -4.82% over the past year, recovered +5.47% from their 52-week low in October of 2022, but declined -8.95% from their 52-week high in July of 2022 (ex-distributions).
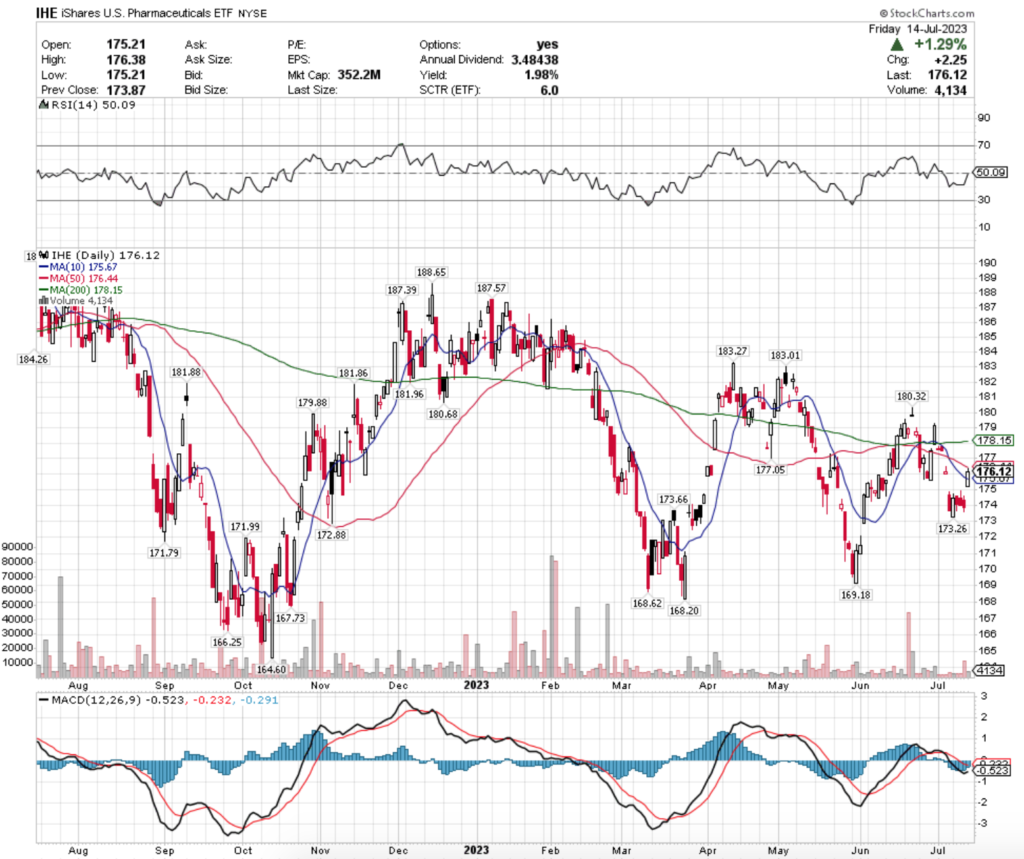
Their RSI is neutral at 50.09, with a bearish MACD that is beginning to trend towards a bullish crossover after Friday’s gap up session.
Last week’s volume was fell far below the average volume for the year (4,700 vs. 9,453), with Thursday’s candlestick receiving the most volume, followed by Friday’s gap up candle.
One thing of note on Friday’s candle, the high of the day went up to the 50 Day Moving Average & then ducked back down to close beneath it, with a shadow in between the close & the 50 DMA.
Based on the light volume, neutral RSI & lack of support levels within the window it created, this gap is something that is likely to be filled in the coming week & investors should be cautious.
Their 1.98% distribution yield does not offer much protection against declines, making a good time to begin planning a hedging strategy as the nearest level of support is at $173.66/share.
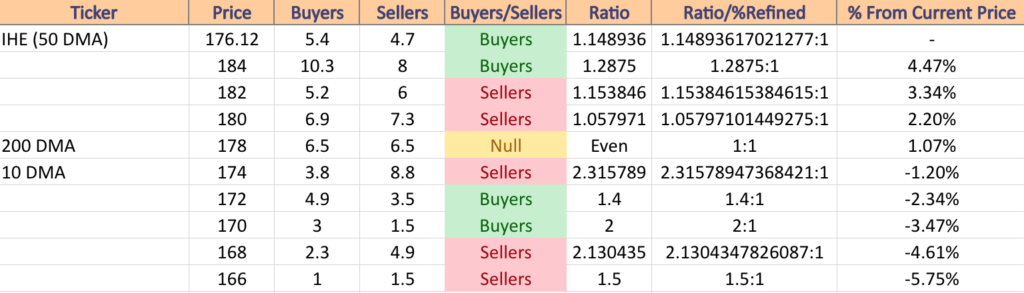
IHE has support at the $175.67 (10 Day Moving Average; Volume Sentiment: Sellers, 2.32:1), $173.66 (Volume Sentiment: Buyers, 1.4:1), $173.26 (Volume Sentiment: Buyers, 1.4:1) & $172.88/share (Volume Sentiment: Buyers, 1.4:1), with resistance at the $176.44 (50 Day Moving Average; Volume Sentiment: Buyers, 1.15:1), $177.05 (Volume Sentiment: Buyers, 1.15:1), $178.15 (200 Day Moving Average; Volume Sentiment: Even, 1:1) & $179.88/share (Volume Sentiment: Even, 1:1) price levels.
Tying It All Together
This week kicks off at 8:30 am on Monday with the Empire State Manufacturing Survey & Equity Lifestyle Properties reports earnings.
Tuesday things get busier, with U.S. Retail Sales & Retail Sales Minus Autos data due at 8:30 am, followed by Industrial Production & Capacity Utilization data at 9:15 am & at 10 am Business Inventories & Home Builder Confidence Index data is set to be reported.
Also on Tuesday, there will be many earnings reports including Bank of America, Bank of New York Mellon, Charles Schwab, Hasbro, Interactive Brokers, J.B. Hunt Transportation Services, Lockheed Martin, Morgan Stanley, Novartis, Omnicom, Pinnacle Financial Partners, PNC, Prologis, Synchrony Financial & Western Alliance Bancorp.
Wednesday morning at 8:30 am we get Housing Starts data.
Netflix, Tesla, Alcoa, Ally Financial, ASML, Baker Hughes, Citizens Financial Group, Cohen & Steers, Crown Castle, Discover Financial Services, Equifax, First Horizon, Goldman Sachs, Halliburton, International Business Machines, Kinder Morgan, Las Vegas Sands, M&T Bank, Nasdaq, Rexford Industrial Realty, SL Green Realty, Steel Dynamics, U.S. Bancorp, United Airlines & Zions Bancorp are also all due to report earnings on Wednesday.
Initial Jobless Claims & the Philadelphia Fed Manufacturing Survey data are set to be reported at 8:30 am on Thursday, followed by Existing Home Sales & U.S. Leading Economic Indicators data at 10 am.
American Airlines, Badger Meter, Blackstone, Capital One Financial, CSX, D.R. Horton, Fifth Third, Freeport-McMoran, First Financial, Genuine Parts, Intuitive Surgical, Johnson & Johnson, KeyCorp, Knight-Swift Transportation, Marsh McLennan, Newmont Goldcorp, Phillip Morris International, PPG Industries, Pool, SAP, Snap-On, Travelers, Truist Financial & W.R. Berkley are all due to report earnings on Thursday.
Friday has no economic data scheduled, but American Express, AutoNation, Comerica, Huntington Banc, Regions Financial, Roper Technologies & SLB are all due to report earnings.
See you back here next week!
*** I DO NOT OWN SHARES OR OPTIONS CONTRACT POSITIONS IN SPY, QQQ, IWM, DIA, TPOR, MEXX, DUSL, SOCL, ERX, THD, UST, or IHE AT THE TIME OF PUBLISHING THIS ARTICLE ***