Seagate Technologies PLC trades under the ticker STX & is a Technology stock that closed for trading on 5/8/2020 at $51.06/share.
Seagate Technologies PLC. STX Stock Fundamentals Broken Down
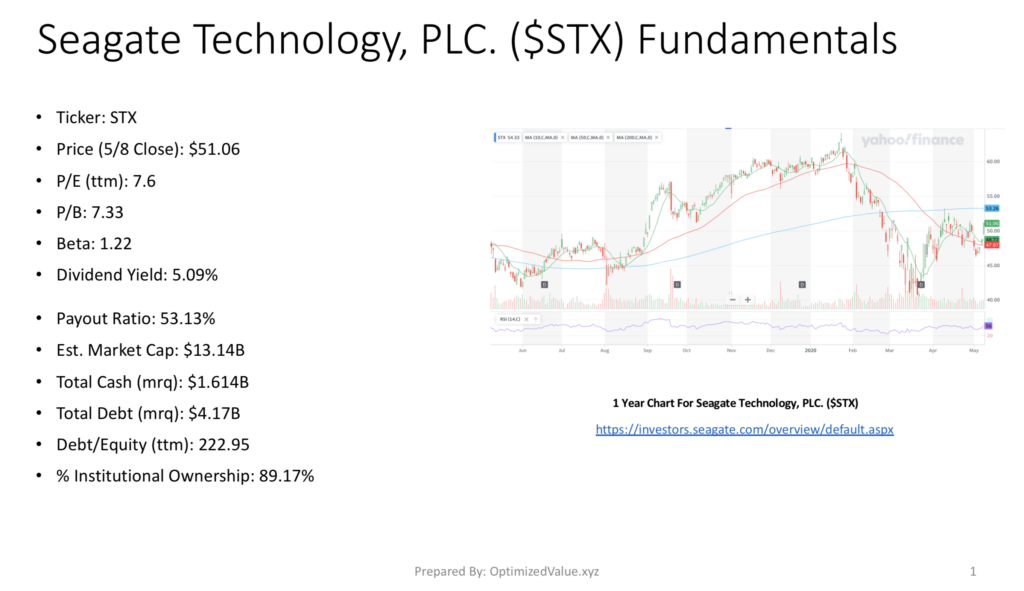
STX’s P/E (ttm) is 7.6, with a P/B of 7.33. They offer an attractive Dividend Yield of 5.09% annually, with a supportive Payout Ratio of 53.13%.
They sport a $13.14B Market Cap, with $1.614B in Total Cash (mrq), $4.17B in Total Debt (mrq), & a Total Debt/Equity (ttm) of 222.95.
Their 1.22 Beta & 89.17% Institutional Ownership also make them worth taking an additional look for an investor or trader’s portfolio.
Seagate Technologies PLC STX Stock Fundamentals Vs. The Information Technology Sector
Despite a 28% higher price per share than the average information technology sector stock, STX offers many attractive fundamentals that investors & traders should explore.
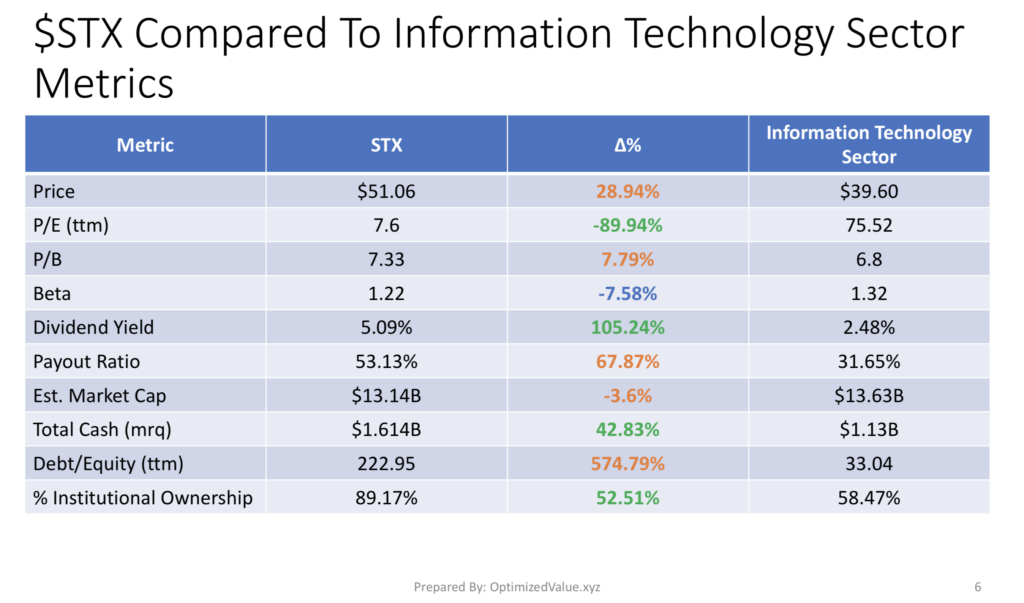
STX’s P/E(ttm) is almost 90% less than the average IT stock, despite having a 7.8% higher P/B.
STX’s Dividend Yield is 105% more than the average Information Technology Stock, and while their Payout Ratio is higher than average, it is still at a safe enough level for sustainability.
STX has 43% more Total Cash (mrq) than the average Information Technology Stock, although their Debt/Equity (ttm) is very high at 575% more than the average.
Despite this, they offer a 52% higher level of Institutional Ownership than average.
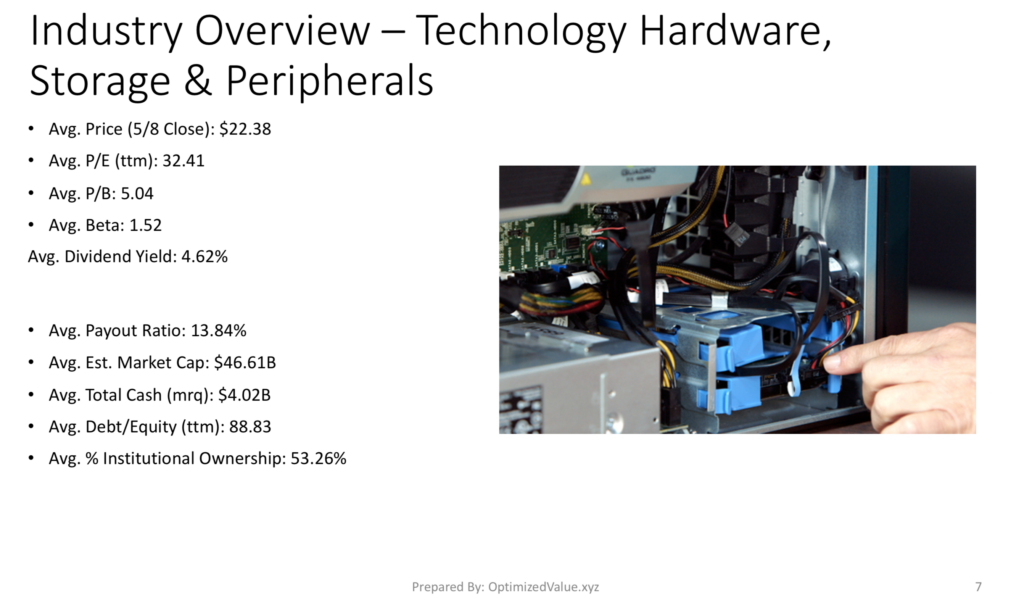
Seagate Technologies PLC STX Stock Fundamentals Vs. Technology Hardware, Storage & Peripherals Industry Averages
Seagate Stock continues to offer great fundamentals when compared with the Technology Hardware, Storage & Peripherals Industry averages.
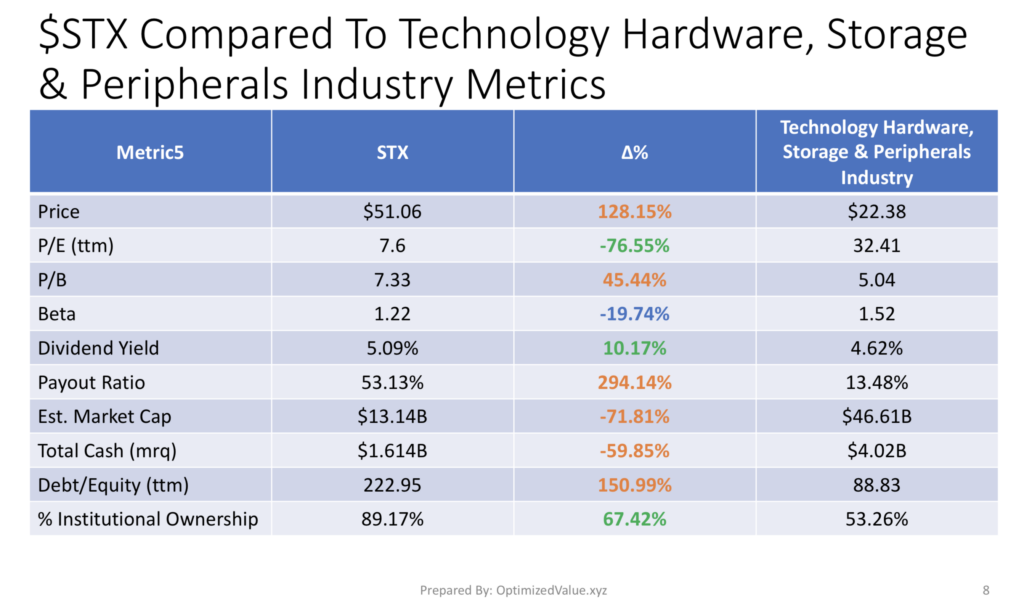
STX’s P/E (ttm) is ~77% less than average compared with the Technology Hardware, Storage & Peripherals Industry, and their Dividend Yield is 10% higher than average.
While they are much smaller in Market Cap than average, they still have a 67% higher % Institutional Ownership, showing that major investors find more strength among them than their peers.
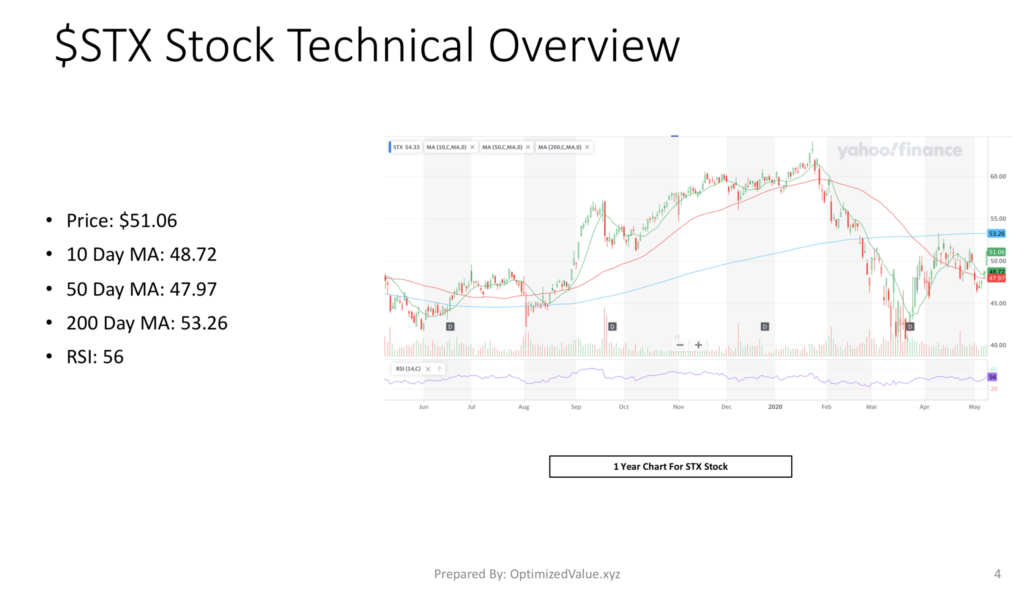
Seagate Technologies PLC STX Stock Technicals
STX’s 10-Day Moving Average is 48.72, and their 50-Day Moving Average is 47.97, adding support to their $51.06 share price.
However, their 200-Day Moving Average is 53.26, providing some future downwards pressure on the stock’s price.
Their RSI is 56 when looking at a one year chart.
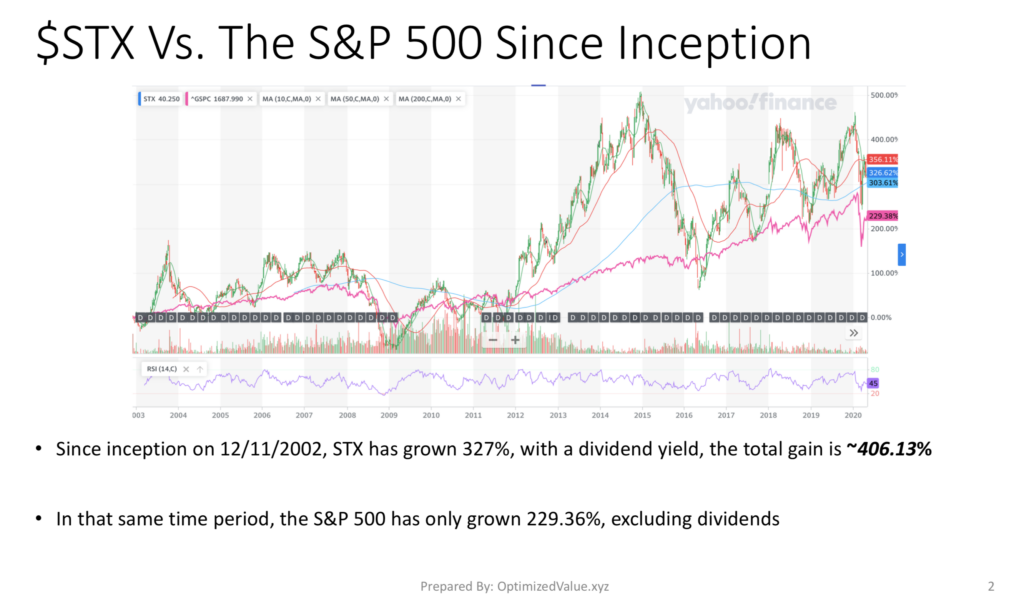
STX Has Outperformed The S&P 500 Since It Began Trading
STX has gained 326.62%, in addition to it’s Dividend Yield which over time brings the total gains for one share of STX from when it first began trading to ~406%.
In that same time, the S&P 500 has only grown 229.38%, excluding dividends.
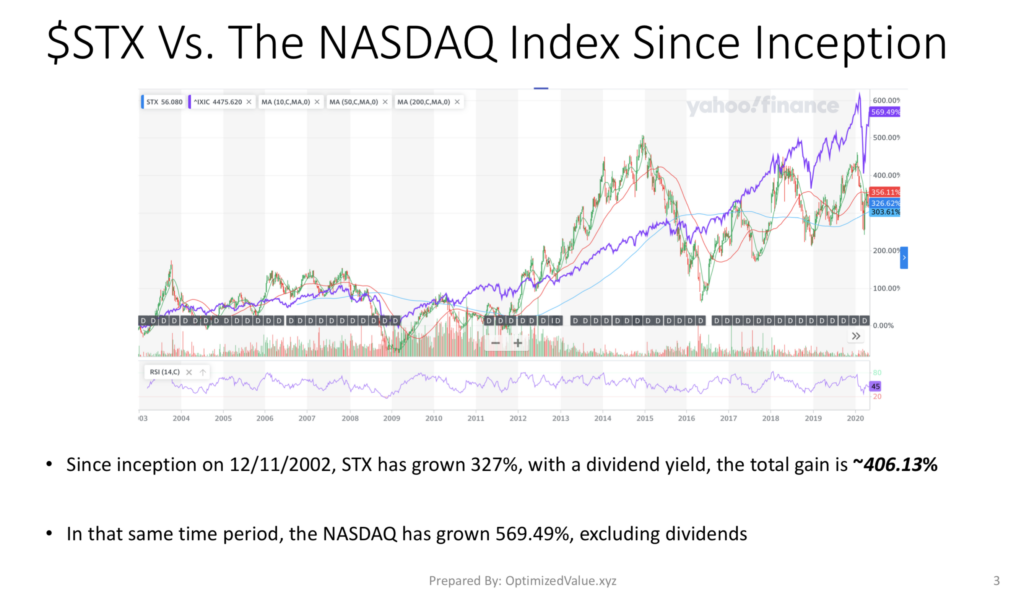
Seagate Technologies STX Stock Has However Trailed The NASDAQ Index
STX’s 406% All-Time Gains are less than the 569%+ returns of the NASDAQ index (excluding dividends), but when looking at both charts it still looks like a strong portfolio candidate.
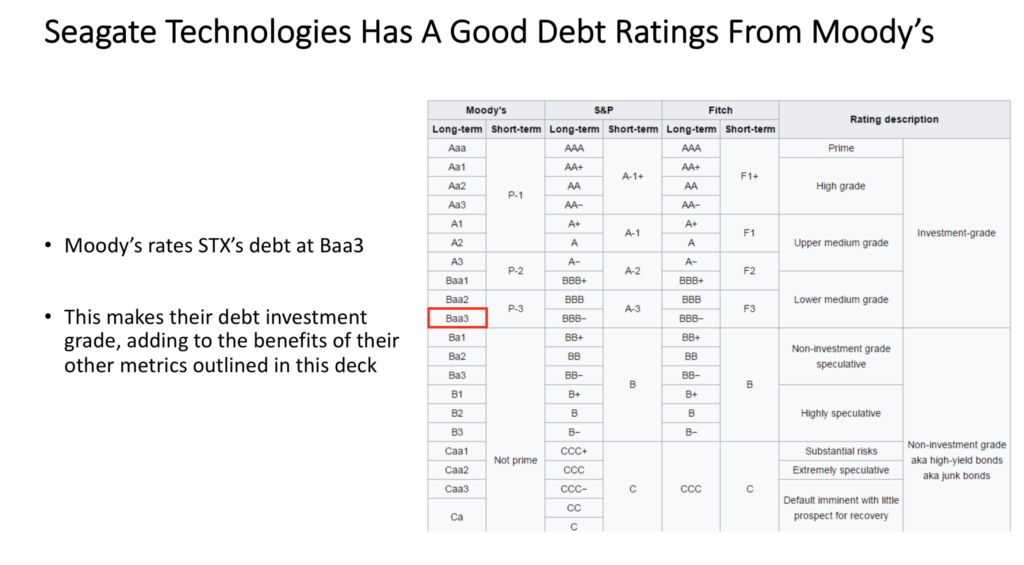
Seagate Technologies PLC STX Stock Offers An Investment Grade Debt Rating
Moody’s rates STX a Baa3, viewing their debt as investment grade. With the impending troublesome times, this combined with their attractive dividend yield & low P/E will attract more & more investors’ attention as they flee to safety.
Tying It All Together
STX stock offers a lot of strong fundamentals that are attractive to investors & traders alike. Overall, they offer a unique place for your money, as they are a tech company that has decent fundamentals & yield, more like a value play.
I don’t currently hold any, although I may begin to consider buying some if it were to return to the $47-range, pending a further technical review at that point.
As I contend that there will be another NASDAQ correction coming up, buying shares at around $47 would offer a ~8% discount from the current price, with a 5% cushion for future fall via their dividend yield.
For longer-term focused investors this may not matter as much, but when I consider their Beta & then discount a market drop, this seems like a good buy-in level.
Regardless, it is certainly worth consideration for investors & traders alike upon further research!
*** I do not own shares of Seagate Technologies Plc, STX Stock***
View The Full PDF Report: