Let’s be honest, no one needs me to break down what 2022 has been like for the S&P 500 & NASDAQ; the charts speak for themselves & we all know why its happening.
SPY & the S&P 500 have been less impacted than the NASDAQ, which is to be expected in an anticipated environment of raising rates.
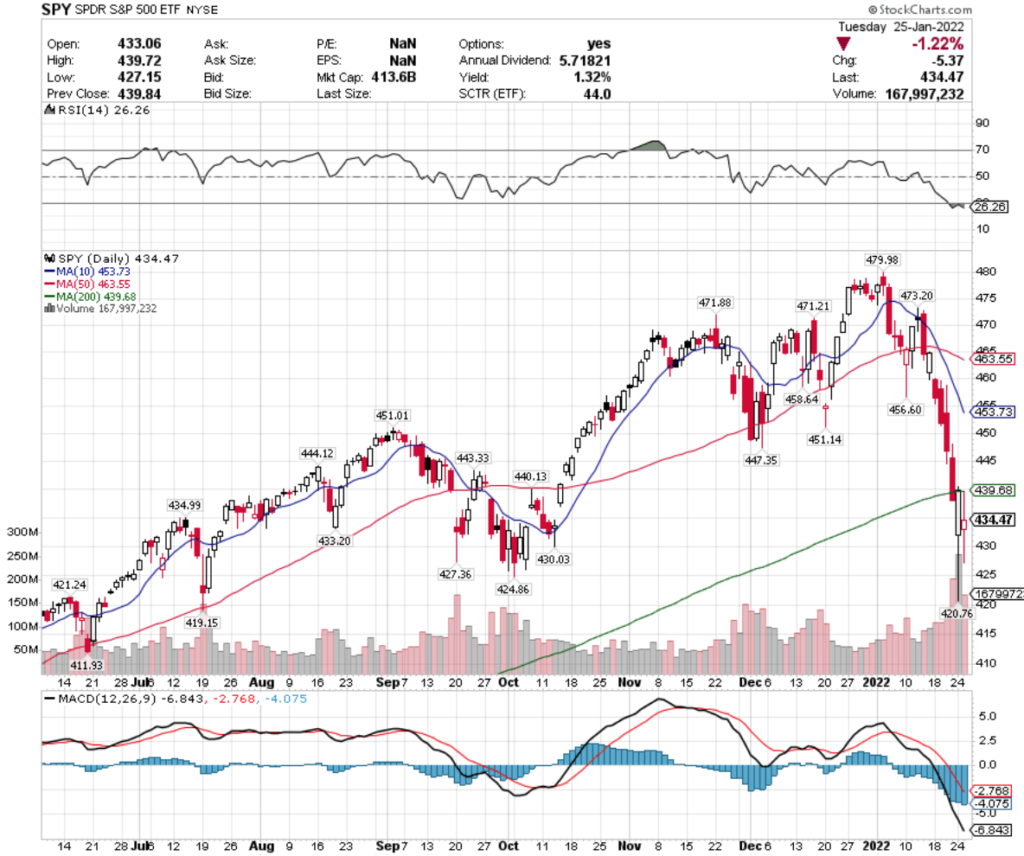
SPY’s in oversold RSI territory, but their MACD & volume levels don’t convince me that the pain is through just yet.
Let’s see how they hold up around the $424-430 range, which is only ~1% away.
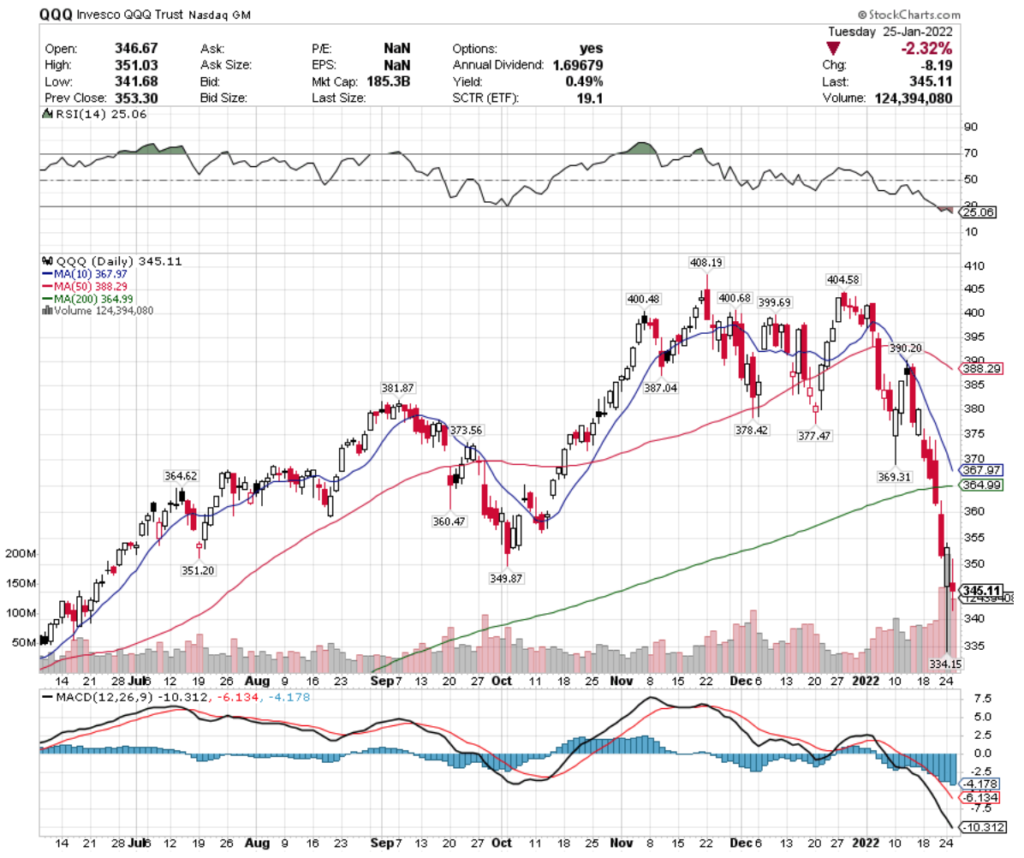
QQQ has fared worse, and looks to be on the verge of having a bearish 50 & 200 Day Moving Average crossover, adding to downward pressure on prices.
With an RSI at 25, there should be a bit of bouncing around to get them out of such deep oversold territory, but the MACD & MA situations don’t look pretty.
Oil & Gas Exploration & Production (IEO), Saudi Arabia (KSA), Wheat (WEAT) & High Dividend (HDV) Names Have All Been Beating The Pack
IEO, the iShares US Oil & Gas Exploration & Production ETF continues to be one of the top performing ETFs from a technical standpoint.
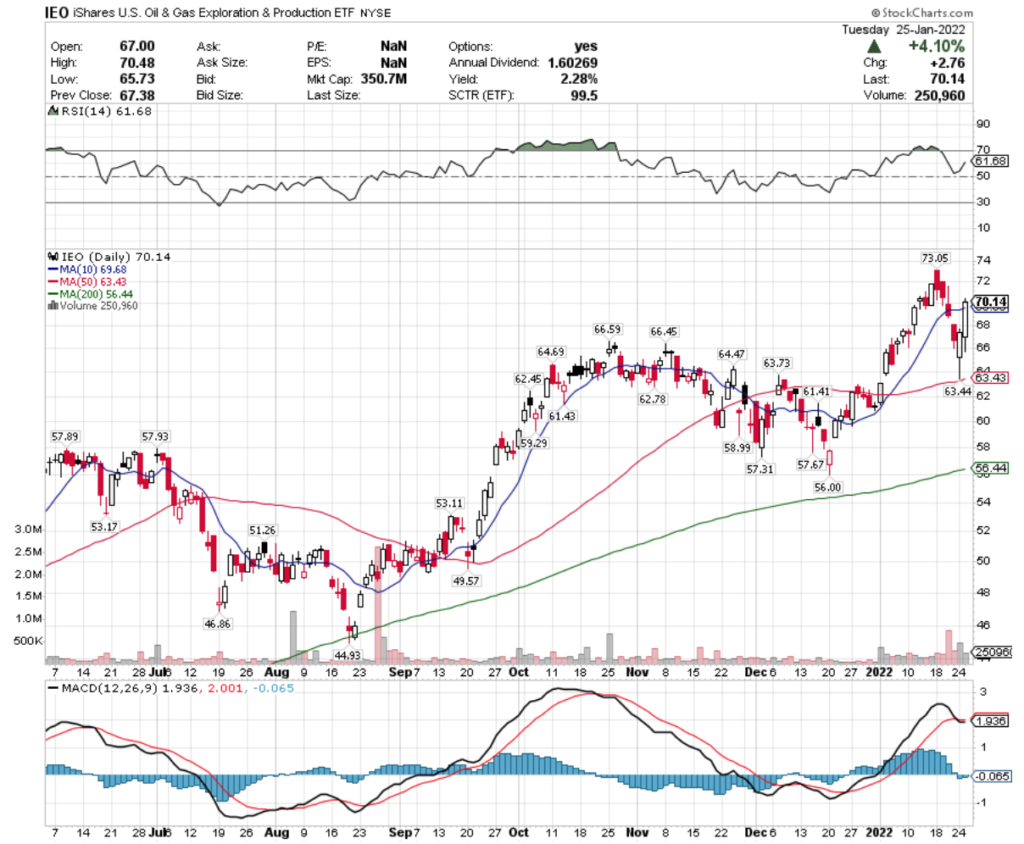
Their MACD looks set to roll over bearishly, although yesterday they bullishly crossed their 10 Day Moving Average on better than average trading volume.
With an RSI at 61, this looks to continue higher to re-test the $73.05-level.
KSA, the iShares MSCI Saudi Arabia Capped ETF has also continued having a strong year.
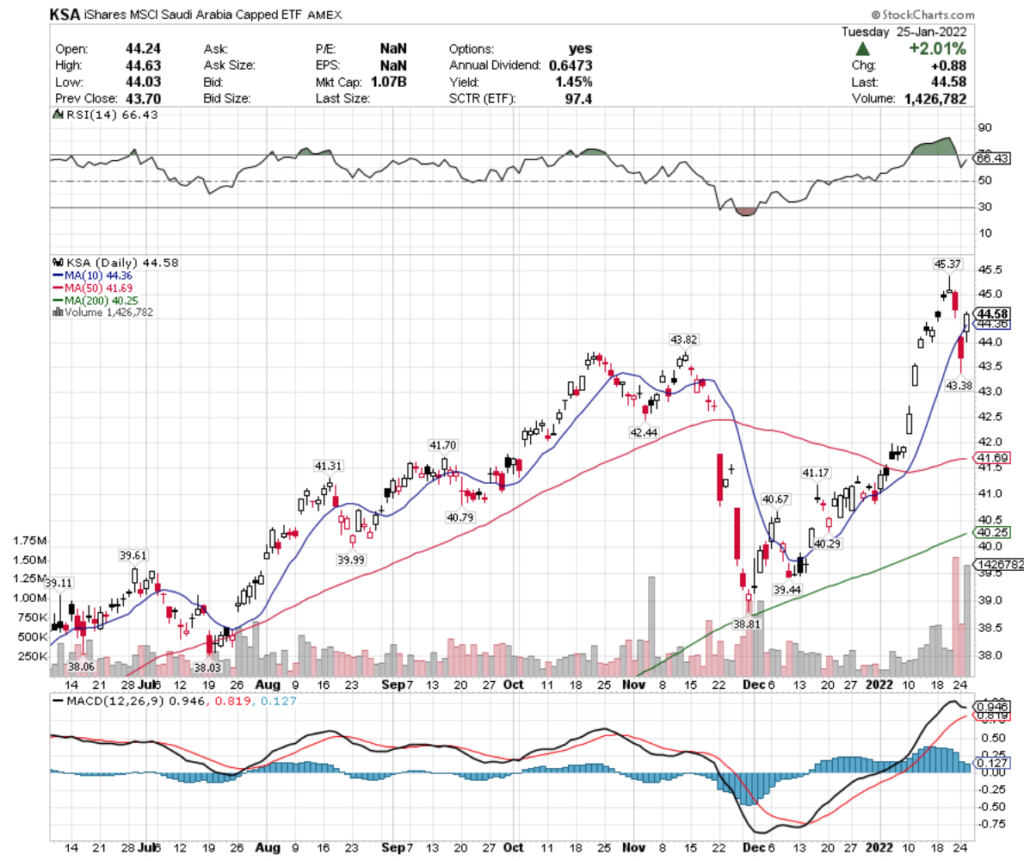
They too have a bearish looking rollover starting on their MACD line, yet yesterday broke out above their 10 Day MA on above average volume.
With their RSI approaching being overbought, it will be interesting to see how they fare against the $45.37 resistance level, ~2% away.
WEAT, the Teucrium Wheat Fund ETF has also been outperforming many of its peers in the ETF markets.
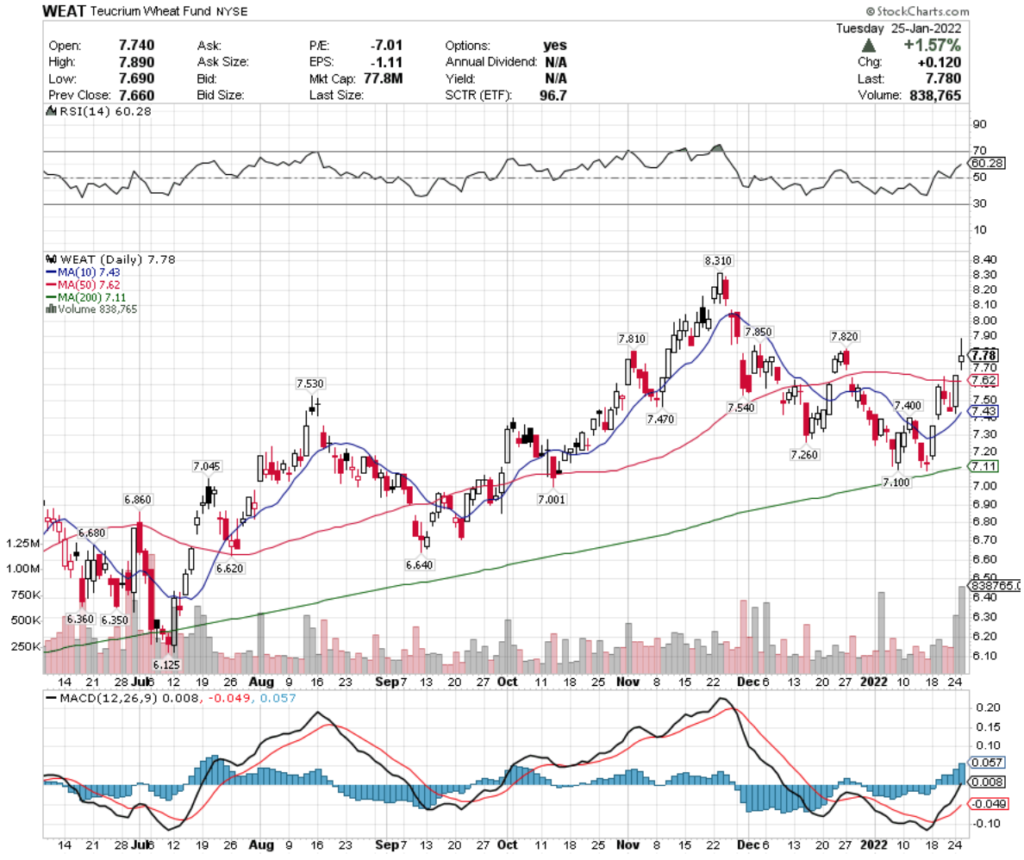
WEAT ETF looks to have solid momentum to test the next level of resistance at $7.82/share, after briefly breaking through the price level yesterday.
Based on their RSI, MACD setup, and 10 Day Moving Average about to bullishly cross through the 50 Day MA, on high trading volume, this looks to have solid momentum behind it.
HDV, the iShares Core High Dividend ETF has seen short-term difficulties, but an overall strong performing year.
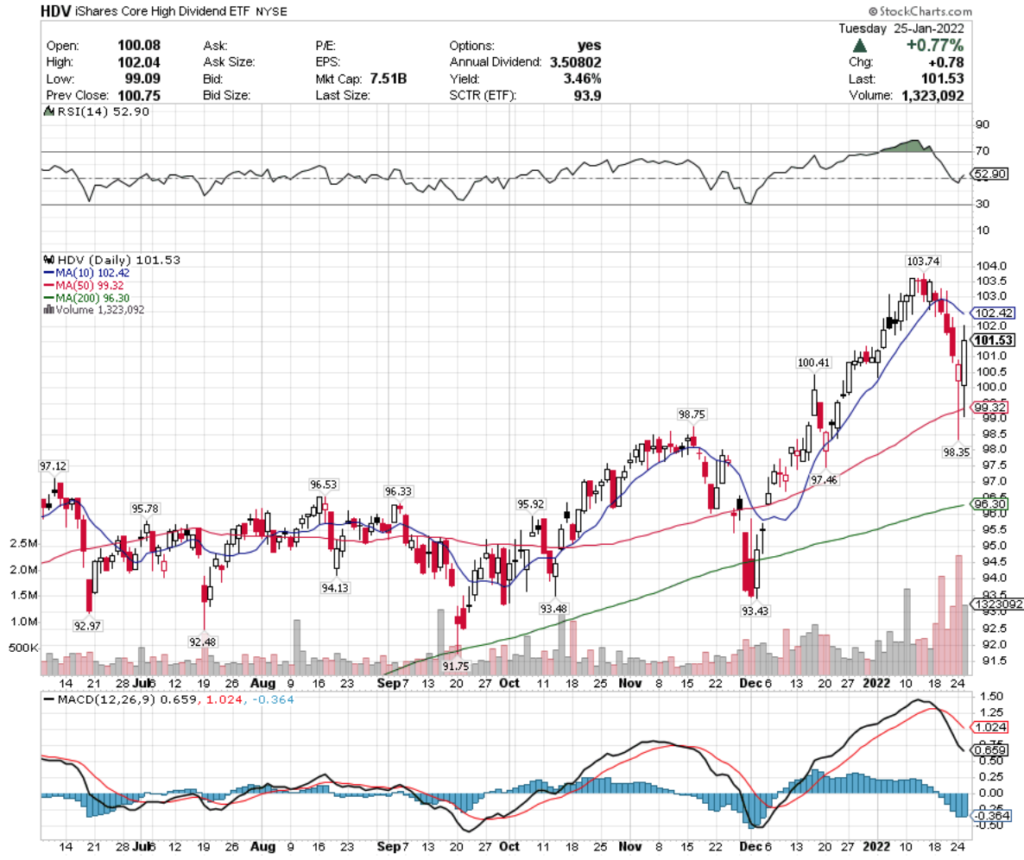
While their MACD is still negative, their RSI has gone back to neutral & they have had above average trading volumes in 2022’s sessions.
HDV will need to break above the $102.42 level before testing the $103.74 price level.
FinTech Innovation (ARKF), Internet Giants (OGIG), ESG Mid-Cap Growth (NUMG) & Clean Power (CNRG) Names All Lagging The Pack
I don’t think anyone is surprised to hear that ARKF ETF, the ARK FinTech Innovation ETF is having a terrible year.
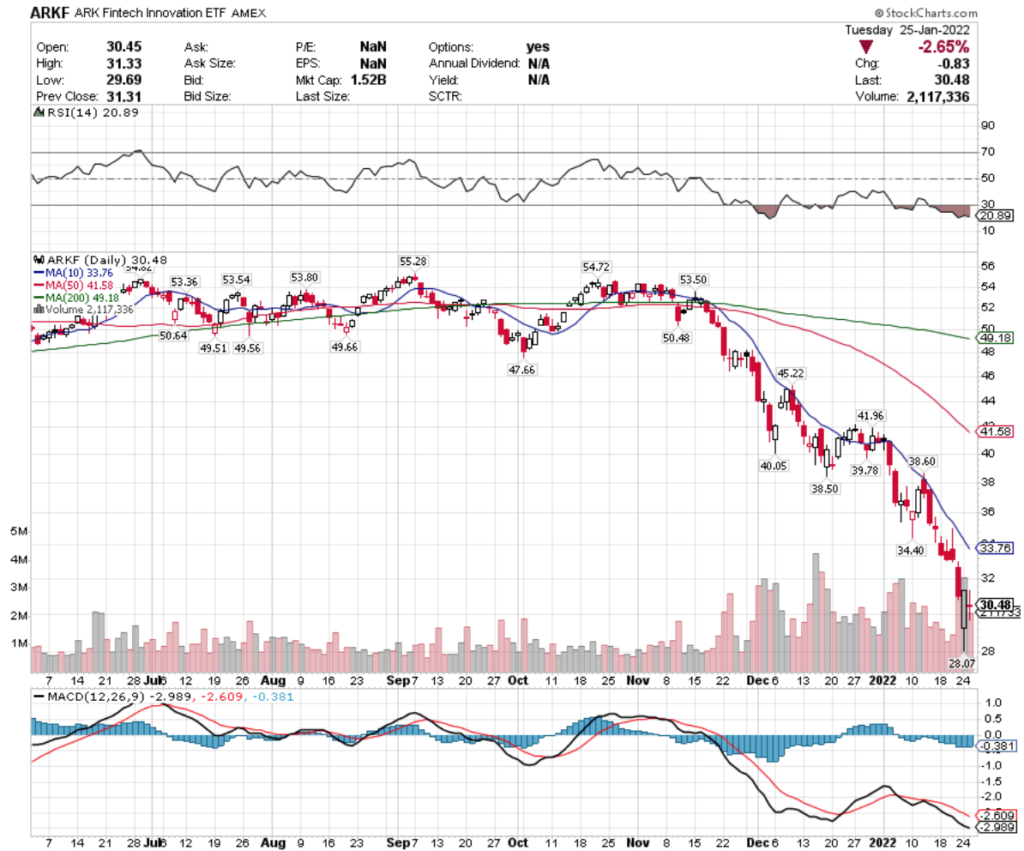
RSI is terribly oversold, volumes are all above average, price is 1%+ below the 10 Day MA & the MACD is still bearish.
With no yield, this looks like complete & utter junk.
OGIG, the O’Shares Internet Giants Index ETF has also been falling steadily over the last year.
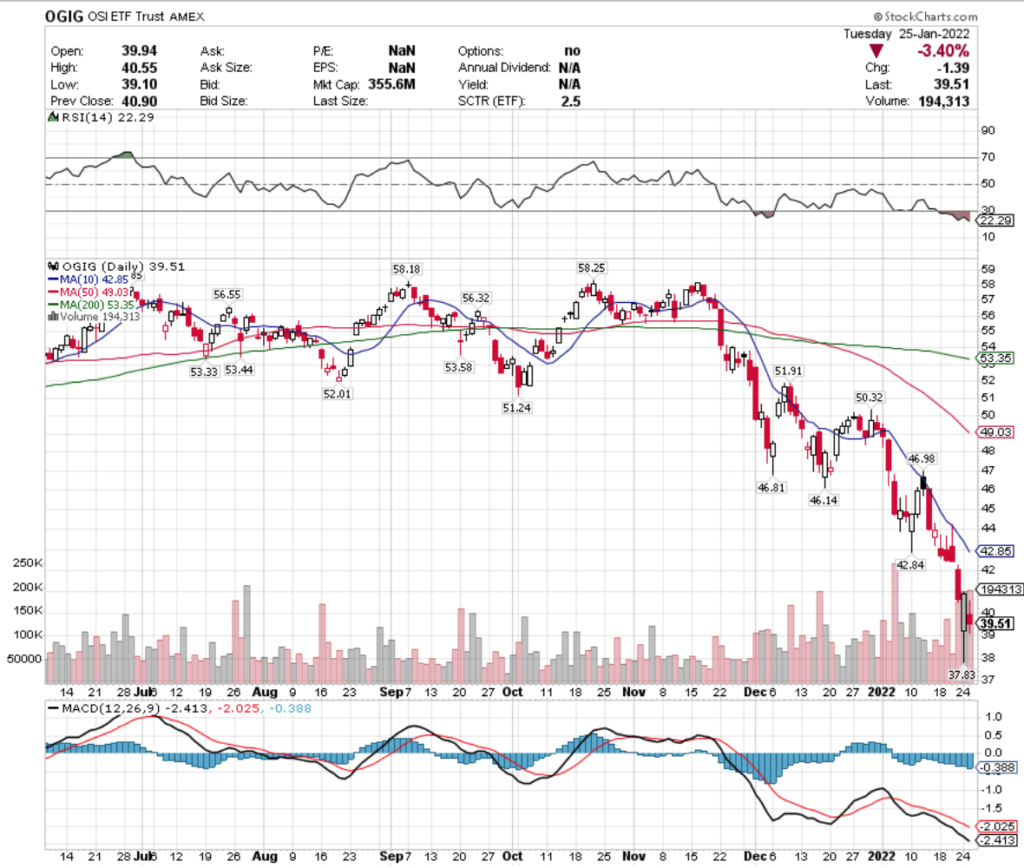
It’s another one that’s got above average volumes, a bearish MACD, very oversold RSI, & is only ~1% off of the year’s bottom in pricing.
NUMG, the Nuveen ESG Mid-Cap Growth ETF has also faced a similar set of difficulties this year.
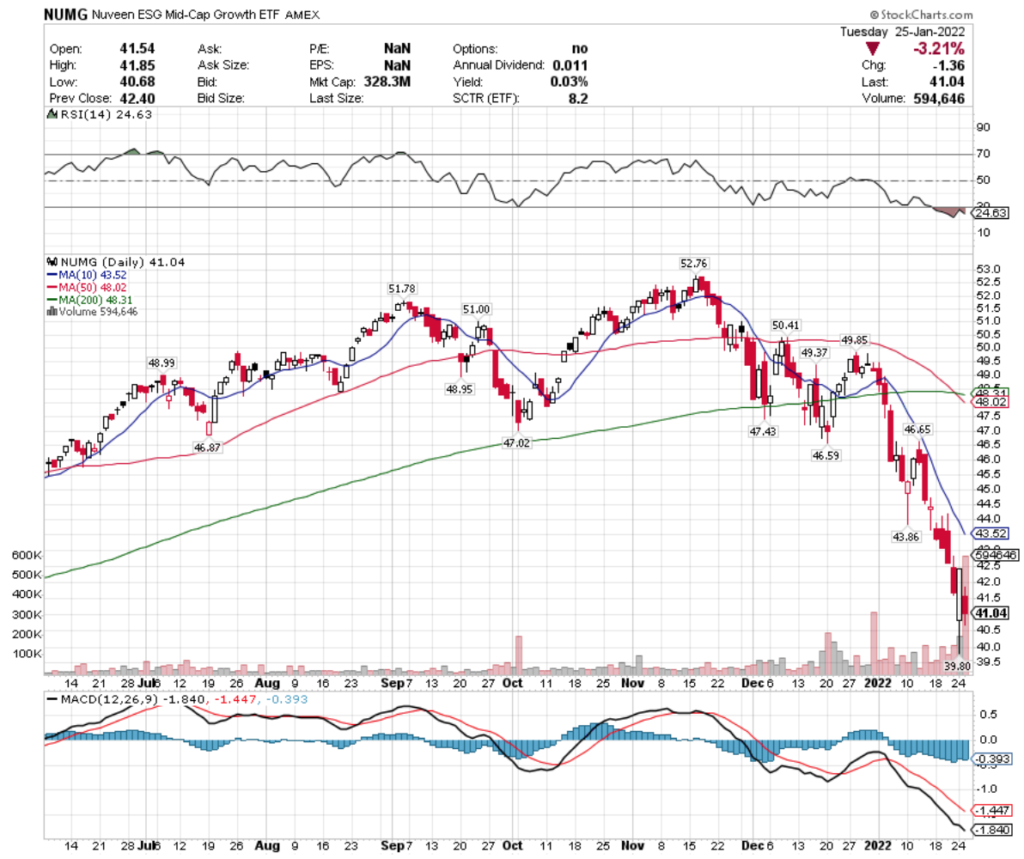
They too are still in a free fall based on their technicals; oversold RSI, MACD still very bearish & the recent death cross of the 50 & 200 Day Moving Averages spell more trouble to come as this name tries to establish footing.
CNRG, the SPDR S&P Kensho Clean Power ETF is another name that has been getting beaten badly over the last few months.
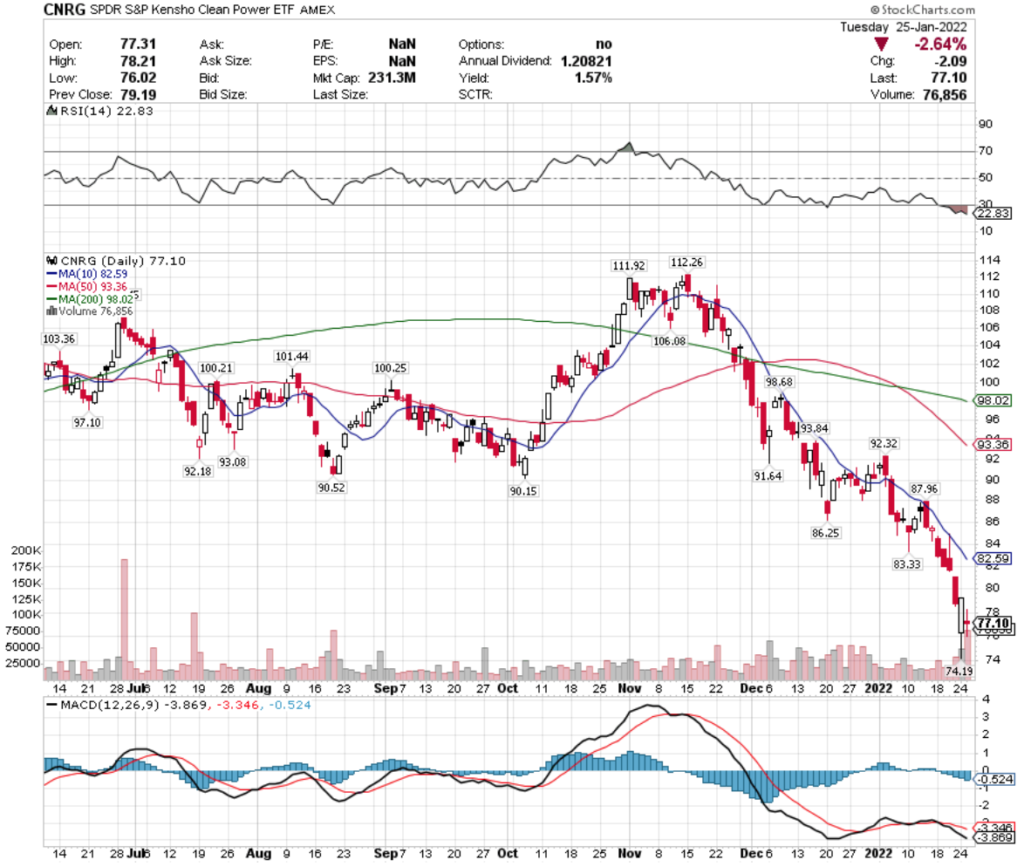
Another underperforming name, trying to figure out where it bottoms out.
RSI deeply oversold, MACD bearish & recent volume is above average.
Not sure where we will see this bottom, but for those interested in a position, there is a 1.57% price cushion for protection via their dividend yield.
Tying It All Together
Overall, there looks to be more selling ahead of us, although we should get more clues today on the Federal Reserve’s plans, which will be nice.
I would be focused on having options hedges for anything being bought now, as there does look to be continued volatility in the near-future.
Let’s see what the rest of the week holds!